


Food and beverage marketing is a powerful force shaping eating norms, attitudes, behaviours and health(1–Reference Harris and Taillie3). Food/beverage brands are increasingly marketing their products on social media (SM)(Reference Harris, Fleming-Milici, Gearhardt, Christakis and Hale4,Reference Harris, Reed and Maksi5) . This is particularly problematic for American adolescents who spend almost 5 h each day on SM, where they may be exposed to high volumes of unhealthy food ads(Reference Rothwell6).
TikTok – an SM application that features short videos that play automatically and rely on a complex (and obscure) algorithm to promote content – is currently one of the most popular platforms among adolescents(Reference Faverio and Teens7). Sixty-three per cent of adolescents in the USA report having used TikTok at least once, and 57 % report using it every day(Reference Faverio and Teens7). Even though TikTok is intended for adolescents aged ≥ 13 years – and some states have implemented stricter age eligibility and verification policies(Reference Thimm-Kaiser and Keyes8,Reference Moreno and Radesky9) – younger adolescents have found ways to circumvent age restrictions. In 2020, one-third of TikTok users were aged ≤ 14 years(Reference Zhong and Frenkel10).
Adolescents are continuously exposed to food/beverage ads on SM(11). In one study, 278 Canadian teenagers captured 1392 teen-targeted food ads from Instagram, Snapchat, TikTok and YouTube over a 7-d period(Reference Elliott, Truman and Black12). In another study, Australian adolescents were exposed to 17·4 food/beverage ads per hour they spent online(Reference Kelly, Bosward and Freeman13). Research also indicates that adolescents are more likely to engage with food ads that have many v. few likes(Reference Lutfeali, Ward and Greene14)– a key TikTok feature. Like traditional marketing, digital and SM marketing of unhealthy food/beverage products has negative impacts on health(Reference Mc Carthy, de Vries and Mackenbach15,Reference Boyland, Backholer and Potvin Kent16) .
Food marketing on TikTok – combined with its popularity among adolescents – raises several concerns. For example, current industry-led initiatives to restrict marketing to youth, like the Children’s Food and Beverage Advertising Initiative (CFBAI), only extend to adolescents under the age of 13 years(17). Additionally, companies participating in CFBAI primarily market products of poor nutritional quality, as measured by nutrition criteria used by government agencies in the USA and UK(Reference Kunkel, Castonguay and Filer18,Reference Jensen, Fleming-Milici and Harris19) , meaning millions of young people are exposed to unhealthy food marketing on SM.
One popular marketing strategy on SM is to promote products through influencers. Unlike traditional celebrities (e.g. actors), influencers are seen as relatable, and their product endorsements are often taken as word-of-mouth recommendations(Reference Schouten, Janssen and Verspaget20). A study assessing exposure to food/beverage promotions on SM among Australian adolescents found that 26 % of promotions were on celebrity or influencer accounts(Reference Van Der Bend, Jakstas and Van Kleef21). Additional studies have found that SM influencers, including celebrities, overwhelmingly promote unhealthy products(Reference Turnwald, Anderson and Markus22–Reference Amson, Bagnato and Remedios24). Evidence of the effect of influencer marketing on consumption is emerging, with positive to null results(Reference Boyland, Backholer and Potvin Kent16,Reference Powell and Pring25) . For example, randomised trials among children aged 9–11 years indicate that influencer marketing of unhealthy foods leads to increased snack intake(Reference Coates, Hardman and Halford26,Reference Coates, Hardman and Halford27) .
In a recent study, we found that 15 % of the videos from the top 100 TikTok influencers in the USA in July 2022 featured at least one food/beverage product, and that nearly half of those products (48 %) featured a food/beverage brand(Reference Amson, Bagnato and Remedios24). Most videos featuring a brand (69 %) did not contain any disclosures of brand sponsorships. Among videos that contained disclosures, influencers used ten different types of disclosures, many of which were ambiguous about paid sponsorships (e.g. #[brandname] in the caption)(Reference Dupuis, Musicus and Edghill28). The lack of disclosures and the use of ambiguous disclosures leave viewers guessing as to whether they watched a paid product placement or an influencer’s personal preference. While the US Federal Trade Commission regulates influencer marketing(29), gaps in the regulatory framework allow influencers to circumvent any ramifications when posting by not acknowledging sponsored content. Building on this study, we sought to evaluate the healthfulness of the food/beverage products featured on the accounts of top influencers, framed within the context of known youth engagement with TikTok.
Methods
Data collection and classification
The research team screen-recorded up to 100 TikTok videos from the top 100 influencers in the USA overall (i.e., across all users, a significant portion of which are adolescents) – identified using HypeAuditor, an influencer marketing platform – as of 1 July 2022. HypeAuditor uses data on views, likes, comments and shares to create the list.
For each TikTok, we identified if a food/restaurant, beverage or supplement was featured and, if so, categorised the main product featured (Figure 1)(Reference Dupuis, Musicus and Edghill28).
Steps to identify products and categorise them. To categorise food products, we identified products based on food groups and added categories for processed or packaged items (e.g. breakfast cereals, packaged snacks, and condiments and cooking staples) and for prepared foods (e.g. mixed dishes and desserts)(Reference Schwartz, Levi and Lott47). We categorised foods from restaurants into their own category. For beverage products, we used the Rudd Center Children’s Drinks categories and added alcoholic beverages and plain water(48). We combined sweetened and unsweetened coffee and tea into one category and collapsed some categories for which there were only a small number of items. These categories have been used in other food and beverage marketing evaluations, including on digital platforms.(Reference Bragg, Miller and Roberto33,Reference Bragg, Miller and Elizee34,Reference Harris, Schwartz and Shehan36)

Product scoring
To ascertain the healthfulness of food products, we used the Nutrient Profile Index (NPI). NPI scores are derived from the Nutrient Profile Model (NPM), a validated assessment developed to identify and regulate marketing of unhealthy food to children in the UK(Reference Scarborough, Boxer and Rayner30–Reference Lobstein and Davies32). NPM considers the amount of specific macro- and micro-nutrients and the proportion of fruits, vegetables and/or nuts per serving size. NPM scores were converted into NPI scores for ease of interpretation – a protocol used in prior studies(Reference Bragg, Miller and Roberto33–Reference Bragg, Pageot and Amico35) – with values ranging from 1 (least healthy) to 100 (most healthy), using the following formula: −2 × NPM score + 70(Reference Harris, Schwartz and Shehan36). An NPI score of ≥ 64, equivalent to an NPM score of ≤ 3 – the cut-off for advertising to children in the UK – is considered healthy(Reference Harris, Schwartz and Shehan36).
For branded/packaged foods, we extracted nutrition information from the official product websites. If flavour, for example, was not specified, we selected popular or frequently bought varieties (e.g. products that appeared on the home page or featured as customer ‘favourites’). We assumed that foods contained at least 50 % fruits, vegetables or nuts if these were listed in the first five ingredients. Because NPM calculates a score based on a serving size in grams, we used MenuStat 2022 data (https://catalog.data.gov/dataset/dohmh-menustat) or the USDA Food Data Central database (https://fdc.nal.usda.gov/index.html) to estimate weight for items for which serving size weight was not readily available.
For unspecified foods from a restaurant (e.g. McDonald’s combo meal), we extracted NPI scores from the Rudd Center’s Fast Food FACTS Report(Reference Harris, Schwartz and Munsell37). If information was not available in the report, we assessed nutrition information for the top five food products from the brand/company’s website and averaged their scores. For fast-food restaurant products, we used the top five combo meals using defaults as advertised on the website or by following the protocol used by Vercammen et al.(Reference Vercammen, Frelier and Moran38).
For fruits and vegetables, mixed dishes (e.g. lasagna) and unbranded foods (e.g. generic oat ‘O’ cereal), we used the USDA FoodData Central database. If we could not find a typical recipe for an item or find any nutrition information, we omitted the food from the NPI analysis. We noted any assumptions made when calculating scores.
Because NPM and NPI are not as reliable in evaluating beverages, we opted to report product categories.
Statistical analysis
We report descriptive statistics. All analyses were completed in R version 4.4.1.
Results
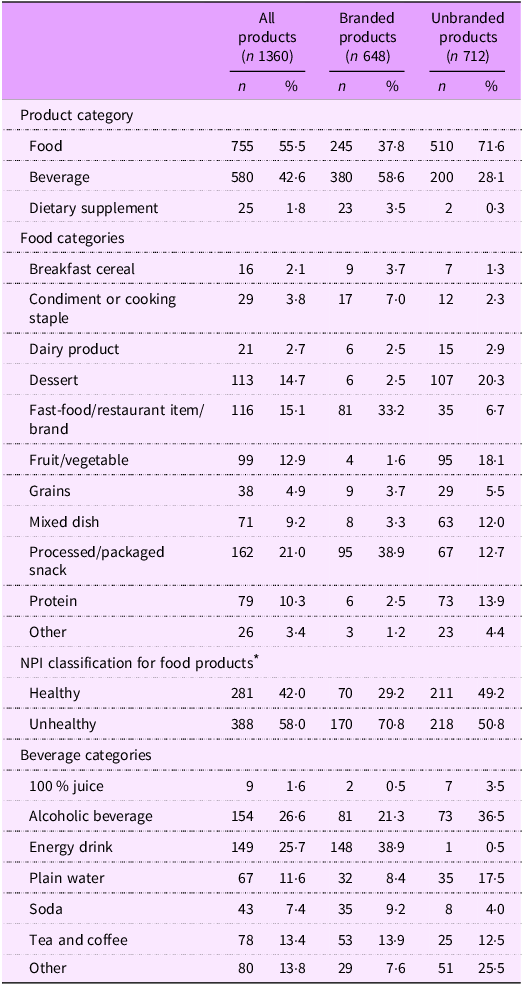
Our final sample included 8871 videos, 1360 (15·3 %) of which featured at least one food product, beverage or dietary supplement. Close to half (47·6 %) of the products were branded (Table 1).
Product categories and classification

NPI, Nutrient Profile Index.
* Only 669 food products and restaurants are included in this analysis. We could not find the necessary nutrition information (e.g. because of unknown recipe) for eighty-six products.
Overall, there was a large variety of food products featured. The largest category was processed or packaged snacks (n 162, 21·0 %), followed by fast-food/restaurant items/brands (n 116, 15·41%) and desserts (n 113, 14·17%). Among posts featuring branded foods, the top three product categories were processed or packaged snacks (n 95, 38·9 %), fast-food/restaurant items/brands (n 81, 33·2 %) and condiments or cooking staples (n 17, 7·0 %). Among posts featuring unbranded foods, the top three product categories were desserts (n 107, 20·3 %), fruits and vegetables (n 95, 18·1 %) and protein (n 73, 13·9 %).
We calculated NPI scores for 669 (88·6 %) of the food products. Mean NPI score was 54·73 (sd 19·95), with an eight-point difference between branded (mean 49·58, sd 17·80) and unbranded (mean 57·61, sd 20·52) food products. Most foods (58 %) were considered unhealthy, with a 20-percentage-point difference between branded (70·8 %) and unbranded (50·8 %) foods.
Across all posts featuring beverage products, the most featured were alcoholic beverages (n 154, 26·6 %) and energy drinks (n 149, 25·7 %). Similarly, alcoholic beverages and energy drinks made up more than half of the branded beverages (n 81, 21·3 % and n 148, 38·9 %, respectively). Alcoholic beverages were also the largest category among unbranded products (n 73, 36·5 %), followed by ‘other’ beverages (n 51, 25·5 %).
Discussion
Among the 1360 TikTok videos that featured food/beverage products from the top 100 influencers in the USA in July 2022, the largest beverage category was alcoholic drinks (26·6 %), almost half of which were classified as ‘unbranded.’ A high share of unbranded alcohol could underestimate the true extent of commercial alcohol promotion, since brand visibility may not always be captured. Relatedly, most food products were considered unhealthy (58·0 %), and a higher proportion of branded foods were considered unhealthy (70·8 %) compared to unbranded foods (50·8 %). Importantly, however, a large share of the unbranded food products could not be analysed for nutritional quality. It is possible that such food content represents the organic interests of influencers and is truly not a form of food marketing.
These findings add to the small, but growing, literature on the healthfulness of food/beverage products promoted by influencers. A study of the most popular influencers among Canadian adolescents by Amson et al. found that, across three platforms (including TikTok), restaurants were the most frequently featured food/beverage products (24 % of posts featuring food/beverage products), and most products were unhealthy(Reference Amson, Bagnato and Remedios24). In our study, fast-food/restaurant items/brands made up 15·1 % of the posts featuring food items, the second largest food category after processed/packaged snacks. The differences between our findings may reflect our different audiences – Amson et al. reviewed the posts by the top three influencers among Canadian adolescents across multiple platforms, while we reviewed the posts of the top 100 influencers overall on TikTok in the USA. Finally, a study of the content of food/beverage-related Instagram posts by highly followed traditional celebrities found that the most featured foods were snacks and sweets (37 %), while the most featured beverages contained alcohol (51 %)(Reference Turnwald, Anderson and Markus22). Overall, 61 % of the foods featured were considered unhealthy(Reference Turnwald, Anderson and Markus22). Our findings regarding the top TikTok influencers – many of whom would also be considered traditional celebrities – were similar, with the largest food category being processed/packaged snacks (21·0 % of foods) and the largest beverage category being alcoholic drinks (26·6 % of beverages).
While we did not have any data on the demographic profiles of the audiences for the top 100 influencers, we assumed that their overall popularity was indicative of their reach across TikTok users, a significant portion of whom are adolescents. In this respect, these trends in featuring or promoting primarily unhealthy food products, alcoholic beverages and energy drinks is particularly concerning. None of these products should be marketed to adolescents(Reference Harris, Reed and Maksi5,Reference Lobstein and Davies32,Reference Lott, Reed and Deuman39,40) , who may be uniquely susceptible to influencer and SM marketing(Reference Harris, Fleming-Milici, Gearhardt, Christakis and Hale4). Research indicates that, for adolescents, the aesthetic of an SM post, even on a traditional advertisement, is associated with a higher rating for that post(Reference Bragg, Lutfeali and Greene41). Ads from influencers, specifically, blur the line between marketing and entertainment(Reference Schouten, Janssen and Verspaget20), in addition to playing into adolescents’ desire to fit in with peers. Neuroimaging studies, for example, have shown that not only do adolescents like SM content with many v. few likes, but also that viewing content with many likes increases activation of the reward processing regions of the brain(Reference Sherman, Payton and Hernandez42). In combination, this research supports stronger regulation of food marketing and SM use among adolescents. Some states have proposed and enacted a range of policies to address these issues, including age restrictions, warning labels and the prevention of targeted marketing to minors on SM(43–45). It will be important to evaluate whether such policies reduce exposure to unhealthy food/beverage products on SM.
This study has some limitations. We only included one product per video. In reality, each video could feature multiple products with different nutritional profiles. For many of the foods, we had to make assumptions about the recipe (e.g. lasagna), the specific flavour (e.g. tub of ice cream) or the specific items (e.g. fast-food takeout bag) featured to calculate the NPI. This also resulted in missing NPI data for 11·4 % (n 86) of foods, most of which were unbranded (n 81). Our sample included few dietary supplements. The ones identified were primarily powders (e.g. whey protein and greens) to add to foods and drinks. It is possible that other types of supplements (e.g. capsules) were not captured. It is also possible that the market for dietary supplements was not as saturated in July 2022 as it is now(Reference Lenharo46).
Given the reach of influencers and the fact that adolescents spend considerable time on SM, stronger regulations are needed for platforms, influencers and brands to protect adolescents from undue harm from food/beverage marketing.
Acknowledgements
The authors thank the NYU Food Environment and Policy Research Coalition research assistants, including Cervelle Vidal, who worked on this project.
Financial support
Research reported in this publication was supported by the National Cancer Institute of the National Institutes of Health under award number R01CA248441. The content is solely the responsibility of the authors and does not necessarily represent the official views of the National Institutes of Health. The National Institutes of Health had no role in the design, analysis or writing of this article.
Competing interests
There are no conflicts of interest.
Marie Bragg was a Senior Behavioral Expert at the Federal Trade Commission in the Bureau of Consumer Protection’s Division of Advertising Practices at the time of this study. The views in this paper do not represent those of the Federal Trade Commission or the Commissioners.
Authorship
R.D.: conceptualisation, data curation, formal analysis, investigation, methodology, supervision, visualisation and writing (original draft). A.A.M.: conceptualisation, methodology and writing (review and editing). O.C.: writing (review and editing). M.A.B.: conceptualisation, funding acquisition, methodology, supervision, validation and writing (review and editing).
Ethics of human subject participation
This study was determined to be non-human subjects research.


 Open access