


1. Introduction
When grains are poured from a point source onto a horizontal plane, they form a conical pile (or heap) that has a well-defined angle of repose (see figure 1). This is one of the most fundamental of granular flows, and has been used throughout the ages to store bulk solids in industrial processes, agriculture and food processing (Bates Reference Bates1997; Schulze Reference Schulze2008). When the source is not a point, a wide range of pile shapes can develop, and this has motivated the development of simple sandpile models, which assume that all the slopes are at, or close to, the angle of repose (Hadeler & Kuttler Reference Hadeler and Kuttler1999; Nuca, Giudicec & Preziosi Reference Nuca, Giudicec and Preziosi2021).
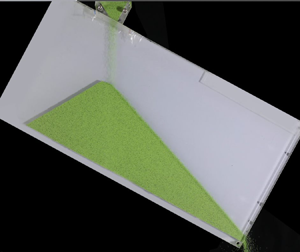
Conical pile formed from the  $710\unicode{x2013}750\,\mathrm {\mu }{\rm m}$ green glass spheres used in the super-stable heap experiments. The angle of repose is approximately $22^{\circ }$.

Taberlet et al. (Reference Taberlet, Richard, Valance, Losert, Pasini, Jenkins and Delannay2003) discovered that when material is continually poured from a point source onto a flat plane (or chute) that is confined laterally by frictional sidewalls, a heap can form whose faces are inclined significantly above the angle of repose. They termed such piles super-stable heaps. An example is shown in figure 2. Interestingly, the super-inclination of the pile's sides requires the continued flow of grains over their surfaces to keep them stable. When the inflow is shut off, the pile slowly collapses back to a conventional heap, or completely flows off the inclined chute, if it is inclined above the angle of repose.
Experimental set-up for the super-stable heap. Two 10 mm thick perspex front and back confining walls are separated by 3 mm perspex bars across the left and bottom boundaries (as well as a perspex spacer along part of the top boundary) to form a  $600\,{\rm mm} \times 300\,{\rm mm}$ rectangular domain. A silo with a funnel is attached to the top, with a ‘double gate’ mechanism to control the mass-inflow rate and open and close the inlet. Material exits the domain through the right-hand side of the rectangular domain and lands on a balance. This measures the mass accumulation as a function of time. The left-hand stand adjusts the inclination angle of the system, whilst the right-hand stand has a fixed height, allowing for in-plane rotation.

Taberlet et al. (Reference Taberlet, Richard, Valance, Losert, Pasini, Jenkins and Delannay2003, Reference Taberlet, Richard, Henry and Delannay2004) observed that at steady state, a super-stable slope was inclined at a constant angle  $\zeta$ and had a flow of uniform depth $h$ along its surface (measured perpendicular to the free surface). They used a simple force balance argument to show that for a chute of width $W$, the slope inclination angle satisfies
 \begin{equation} \tan\zeta=\mu_i+\mu_w\,\frac{h}{W}, \end{equation}
where  $\mu _i$ is a constant internal friction angle and $\mu _w$ is the wall friction. Taberlet et al. (Reference Taberlet, Richard, Valance, Losert, Pasini, Jenkins and Delannay2003) found that for dry polydisperse beach sand (0.1–0.8 mm), the best fit to the experimental data was obtained with $\mu _i=\tan 23.3^\circ$ and $\mu _w=\tan {33.7^\circ }$. The experiments showed that as the mass-inflow rate was increased, the flow layer depth increased, and the pile inclination steepened in agreement with (1.1). For high mass-inflow rates in narrow channels, the slopes were in excess of $60^\circ$, which is over 2.5 times the inclination angle in a wide chute.
Taberlet, Richard & Delannay (Reference Taberlet, Richard and Delannay2008) used three-dimensional discrete element method/discrete particle method (DEM/DPM) simulations, with frictional sidewalls, to model the development of a super-stable heap. This was computationally very expensive, however, and there was little analysis of the growth of the heap, and no analysis of its decay. Instead, Taberlet et al. (Reference Taberlet, Richard, Henry and Delannay2004) focussed on DEM/DPM simulations in a short periodic box that was inclined at a fixed angle  $\zeta$ to the horizontal, which developed a steady uniform flow that transported the same mass flux as the full simulation. These periodic simulations showed that as well as developing a velocity profile that increased strongly towards the top of the pile, the solids volume fraction decreased continuously towards the free surface, which itself was poorly defined. The fact that super-stable heaps develop steady uniform flows along their free surfaces makes them of fundamental rheological interest. This is because measurements of the velocity profiles and slope inclination angle at different mass-inflow rates can be used to constrain the granular rheology and determine parameter values and/or functional fits (GDR MiDi 2004; Jop, Forterre & Pouliquen Reference Jop, Forterre and Pouliquen2006).
The aim of this paper is to use a continuum theory to model the growth, steady-state behaviour and drainage of a super-stable heap. This is more challenging than one might imagine at first, because the flow encompasses simultaneously existing and evolving solid-like, liquid-like and gaseous granular regions. The focus of the modelling here is on the dense solid and liquid regimes, while the dilute free-falling jet that supplies the grains from the hopper is parametrized in a simple way. Even with this reduced focus, the super-stable heap raises fundamental issues about modelling granular flows. Rate-independent Coulomb models, in which the inter-particle friction  $\mu$ is constant (Drucker & Prager Reference Drucker and Prager1952), are not appropriate, because they are unable to determine the steady uniform velocity profile that develops at the surface of the flow. Besides, for time-dependent problems, Schaeffer (Reference Schaeffer1987) showed that the Drucker–Prager rheology was mathematically ill-posed, in the sense that linear instabilities grew at an unbounded rate as the wavenumber of the perturbation tended to infinity (Joseph & Saut Reference Joseph and Saut1990).
Over the past fifteen years, there has been significant development in the continuum modelling of granular materials. Many of the theories are complex; however, the incompressible  $\mu (I)$-rheology (Jop et al. Reference Jop, Forterre and Pouliquen2006) has garnered considerable attention, because of its comparative simplicity, and its ability to describe steady-state liquid-like flows in a variety of configurations (GDR MiDi 2004; Jop, Forterre & Pouliquen Reference Jop, Forterre and Pouliquen2005; Jop et al. Reference Jop, Forterre and Pouliquen2006; Gray & Edwards Reference Gray and Edwards2014). It is a rate-dependent theory, in which the friction $\mu$ now becomes a function of the dimensionless inertial number
 \begin{equation} I = \dfrac{\dot{\gamma} d}{\sqrt{p/\rho_*}}, \end{equation}
where  $\dot {\gamma }$ is the shear rate, $p$ is the pressure, $\rho _*$ is the intrinsic density of the grains, and $d$ is the particle diameter (GDR MiDi 2004). In the original form of the $\mu (I)$-rheology, the friction
 \begin{equation} \mu = \mu_s+\dfrac{\mu_d-\mu_s}{I_0/I + 1} \end{equation}
starts at a finite value  $\mu _s>0$, when $I=0$, and asymptotes to $\mu _d>\mu _s$ as $I\rightarrow \infty$. It is valid in what is known as the dense inertial regime ( $I\in [10^{-3},10^{-1}]$), where the flow is liquid-like. However, most practical problems involve transitions to quasi-static flow ( $I<10^{-3}$) and/or collisional behaviour ( $I>10^{-1}$). This has led to problems when trying to use the $\mu (I)$-rheology to simulate column collapses and silos (Lagrée, Staron & Popinet Reference Lagrée, Staron and Popinet2011; Staron, Lagrée & Popinet Reference Staron, Lagrée and Popinet2012; Martin et al. Reference Martin, Ionescu, Mangeney, Bouchut and Farin2017), because the theory is ill-posed at high and low inertial numbers (Barker et al. Reference Barker, Schaeffer, Bohorquez and Gray2015).
Ill-posedness of mathematical models is a common, yet insidious, problem. This is because low-resolution simulations may be regularized by numerical diffusion and appear plausible. It is only when the numerical grid is refined that it becomes apparent that the results do not converge towards a well-defined solution, and blow up if the grid is sufficiently fine (Barker et al. Reference Barker, Schaeffer, Bohorquez and Gray2015; Barker & Gray Reference Barker and Gray2017; Martin et al. Reference Martin, Ionescu, Mangeney, Bouchut and Farin2017; Schaeffer et al. Reference Schaeffer, Barker, Tsuji, Gremaud, Shearer and Gray2019). It is possible to formulate well-posed granular rheologies by introducing compressibility, although the original form of the compressible  $\mu (I)$-rheology, with a rigid one-to-one dependence of the solids volume fraction $\varPhi$ on $I$, is always ill-posed (Barker et al. Reference Barker, Schaeffer, Shearer and Gray2017; Heyman et al. Reference Heyman, Delannay, Tabuteau and Valance2017; Goddard & Lee Reference Goddard and Lee2018; Schaeffer et al. Reference Schaeffer, Barker, Tsuji, Gremaud, Shearer and Gray2019). Other approaches to obtain a well-posed $\mu (I)$-based theory are to include either non-local effects or higher spatial gradients (Bouzid et al. Reference Bouzid, Trulsson, Claudin, Clément and Andreotti2013; Henann & Kamrin Reference Henann and Kamrin2013; Goddard & Lee Reference Goddard and Lee2017). However, all of these theories introduce greater complexity into the modelling framework, and new numerical methods need to be developed to solve them.
This paper stays within the general framework of the  $\mu (I)$-rheology, but uses a modified $\mu (I)$ relation, developed by Barker & Gray (Reference Barker and Gray2017). This completely regularizes the theory at low inertial numbers, and significantly extends the range of well-posedness at high inertial numbers. It is known as the partially regularized $\mu (I)$-rheology. The major advantage of this is that it allows practical granular flow problems to be solved using numerical solvers that have been developed for fluid flows (Lagrée et al. Reference Lagrée, Staron and Popinet2011; Staron et al. Reference Staron, Lagrée and Popinet2012; Barker & Gray Reference Barker and Gray2017; Martin et al. Reference Martin, Ionescu, Mangeney, Bouchut and Farin2017; Barker et al. Reference Barker, Rauter, Maguire, Johnson and Gray2021; Maguire et al. Reference Maguire, Barker, Rauter, Johnson and Gray2024).
This paper begins in § 2 by performing a series of experiments to quantify the growth, steady-state behaviour and decay of a super-stable granular heap. In § 3, the partially regularized  $\mu (I)$-rheology is introduced, and the mass and momentum equations are averaged across the width of the cell, reducing a three-dimensional problem to a two-dimensional one in which the sidewall friction appears as a momentum source. In § 4, these equations are used to solve for the steady-state velocity profiles that develop through the depth of the uniform flow along the super-inclined free surface. It is shown that it is not always possible to construct solutions using the classical $\mu (I)$ law (1.3), whereas the partially regularized $\mu (I)$ function always has solutions, and can capture the experimental behaviour at different mass fluxes using a single set of parameters. The numerical method to solve the equations is described in § 5, and this is then used in § 6 to quantitatively simulate the experimental growth and decay of a super-stable heap. The main results are summarized in § 7 along with limitations of the model and potential future avenues of research.
2. Super-stable heap experiments
The experimental set-up consists of two  $600\times 300\times 10\,{\rm mm}$ perspex sheets, which form a box that is separated by a 3 mm gap, as shown in figure 2. The gap width is slightly narrower than the smallest width selected by Taberlet et al. (Reference Taberlet, Richard, Valance, Losert, Pasini, Jenkins and Delannay2003), which makes the wall friction effects slightly stronger, and ensures that there is a blunt velocity profile across the width of the cell (Jop et al. Reference Jop, Forterre and Pouliquen2005). Observations made at the sidewall are therefore representative of the flow across the cell width. A perspex bar parallel to the base provides a boundary for the grains to flow and accumulate on. Additional perspex spacers along the left and top boundaries are used to set the gap width. The experimental domain rests on two ‘legs’. The right leg remains fixed, and the experimental domain is able to pivot about this point. The left leg is adjustable and can raise/lower the left-hand side of the domain to allow for the inclination angle of the system to be adjusted. A small silo is attached to the top of the domain to supply the grains. The inlet is controlled by two gates. One gate is fixed in position to control the mass-inflow rate, while the other gate opens and closes the inlet. Material exits the domain through the right-hand boundary, and lands on a balance that records the weight as a function of time.
All experimental results in this paper are obtained using  $710\unicode{x2013}750\,\mathrm {\mu }{\rm m}$ spherical sodalime-glass deco beads manufactured by Sigmund Lindner GmbH, which are large enough that the humidity does not effect their flow properties. The beads have a $2\,\mathrm {\mu }{\rm m}$ base coating of silver, and a $1\unicode{x2013}3\,\mathrm {\mu }{\rm m}$ coloured coating formed by a Sol-Gel process, which is very stable to wear and stable over time. The results also assume that the rectangular domain is inclined at a fixed angle $\theta = 29.2^\circ$ to the horizontal, which is above the repose angle of the grains of approximately $22^\circ$ (figure 1). In the absence of sidewall friction, the grains falling from the hopper would impact the base, flow down the slope, and exit the domain. Here, however, the sidewall friction provides additional resistance, which reduces the flow rate down the incline and allows a super-stable heap to develop (figure 2).
Figure 3 shows the complete time-dependent development towards a steady super-stable heap for inflow rate  $0.0046\,{\rm kg}\,{\rm s}^{-1}$, as well as the subsequent drainage once the inflow is cut off. The inflowing grains fall from the hopper, hit the bed, and flow down the incline and out of the domain. However, the sidewall friction retards the flow sufficiently that the outflow rate is less than the inflow rate. As a result, a pile of static grains begins to form, with its apex directly underneath the free-falling jet and its right-hand toe located at the outlet. Grains that fall onto the top of the pile mainly avalanche down the right-hand face in a thin layer towards the outflow. In order to account for the mismatch in inflow and outflow rates, some of the inflowing particles are deposited along the free surface of the pile, with more being deposited near its apex than near the outlet. The net effect of this is that the free surface remains approximately linear in shape, but steepens over time (Taberlet et al. Reference Taberlet, Richard, Valance, Losert, Pasini, Jenkins and Delannay2003). This progressive steepening allows the grains to avalanche down the slope faster, and ultimately the mass-inflow and mass-outflow rates are able to balance. A steady state is then reached in which there is no deposition. To balance the growth of the right-hand pile face, there has to be a corresponding growth in the left-hand face to keep the pile stable. Some grains therefore also avalanche down the left-hand side to build the pile up. Once the pile of grains has reached steady state, the flow of grains down the left-hand face stops, as shown in movie 1 of the supplementary material (available at https://doi.org/10.1017/jfm.2024.1106), and all the inflowing grains avalanche down the right-hand face. Figure 3(a vi) shows the steady-state super-stable heap. All the free-surface profiles during its growth are superimposed on this image for comparison. From this, it is easy to see the gradual steepening of the pile (on both the left- and right-hand faces), as well as the rising of the apex with time. Note that the right-hand face is significantly steeper than the left-hand face, and the growth of the pile slows down as the steady state is approached.
Photographs of the (a) experimental formation and (b) draining of the super-stable heap, for slope angle  $\theta = 29.2^\circ$ and mass-inflow rate $Q = 0.0046\,{\rm kg}\,{\rm s}^{-1}$. The inlet is opened at $t_{exp} = 0$, and the photos of the filling are taken at $t_{exp} = 6$, 12, 20, 43, 83 and $321$ s. Photo (a vi) shows the steady state, with the earlier free-surface profiles superimposed for comparison. The inlet is cut off at $t_{exp} = 340.5$ s. The draining images are at times $t_{exp} = 341$, 344, 346, 370, 398 and 424 s. For comparison, the free-surface shapes during the draining phase are superimposed on the first of these images. All of the material leaves the domain at $t_{exp} = 429.5$ s. Movie 1 of the supplementary material shows the growth and decay of a closely similar super-stable heap for a mass-inflow rate $Q = 0.0060\,{\rm kg}\,{\rm s}^{-1}$.

At steady state, the super-stable heap is stabilized by the material that flows across its surface. As soon as the inflow is cut off, this delicate balance is destroyed, the pile is gradually eroded, and the particles flow out of the domain along the free surface as shown in figure 3(b). The first photo shows the heap almost immediately after the inflow is shut off, when the pile is still close to steady state. The later photos show the evolution of the heap as it drains. All the free-surface profiles are superimposed on the first image to contrast it against the growth phase of the pile. Rather than keeping a linear profile, as in the case of growth, the top of the pile initially erodes faster than the material near the outlet, which is still stabilized by the grains flowing over it. The upper part of the right-hand face therefore has a lower inclination than material further down the pile, where the steady-state inclination is maintained for a short period. Since the flow rate decreases progressively, the region close to the steady-state inclination is eventually propagated out of the system, and erosion occurs all the way along the right-hand side of the free surface. The left-hand free surface remains stationary and unaffected by the outflow, until the surface avalanche erodes downwards and mobilizes it. Since the angle of repose of the granular material is less than  $\theta =29.2^\circ$, the heap is able to drain entirely. Movie 1 of the supplementary material shows the full time-dependent growth and collapse of a closely similar pile that forms at mass-inflow rate $Q = 0.0060\,{\rm kg}\,{\rm s}^{-1}$.
Higher mass-inflow rates spontaneously develop steeper slopes in order to transport the inflowing material out of the domain, and hence produce a larger steady-state heap. This is shown in figure 4 for mass-inflow rates  $Q = 0.0020$, $0.0046$ and $0.0060\,{\rm kg}\,{\rm s}^{-1}$. The balance beneath the outlet records the total mass that has flowed out of the system as a function of time, from which the mass-outflow rate can be calculated by taking the time derivative of the data. Figure 5 shows both the total accumulated mass and the mass-outflow rate as functions of time for each of the mass-inflow rates in figure 4. All of the curves have a similar form. At time $t_{exp} = 0$ s, the inlet is opened. Initially, there is no mass, and there is a short delay, from the start of the inflow to the time at which material first arrives at the balance. Since some mass is deposited between the hopper and the balance (in order to build the pile) the initial mass-outflow rate is not equal to the mass-inflow rate. As the pile gets steeper, however, the mass-outflow rate steadily rises over time until the mass-inflow and mass-outflow rates balance. This corresponds to the linearly increasing section of the curves in figure 5(a) and the horizontal plateau in figure 5(b). Larger mass-inflow rates necessarily produce higher gradient mass accumulation curves. This is similar to what Taberlet et al. (Reference Taberlet, Richard, Henry and Delannay2004, Reference Taberlet, Richard and Delannay2008) found in their DEM/DPM simulations. The length of the steady-state sections is dependent on how long the inflow is sustained. Once the inflow is shut off, there is a gradual decrease in the mass-outflow rate towards zero, and the total mass on the balance asymptotes to a constant value. In the experiments, the total mass that accumulates on the scales is different for each of the three cases. However, unsurprisingly, if one wanted to accumulate the same total mass, then the low mass-inflow rate case would have to be run for far longer than the largest inflow rate case.
Steady-state super-stable heaps for mass-inflow rates  $Q = 0.0020$, $0.0046$ and $0.0060\,{\rm kg}\,{\rm s}^{-1}$, and box inclination angle $\theta = 29.2^\circ$. The pile size increases with increasing mass-inflow rate. It is useful to define three coordinate systems. The $(X,Z)$ coordinate system is used to represent the horizontal and gravity-aligned vertical, the $(\tilde {x},\tilde {z})$ system is aligned with the rectangular domain at angle $\theta$ to the horizontal, and the $(x,z)$ system is aligned with the steady uniform flowing layer at angle $\zeta$ to the horizontal. For the flow rates given, the heap inclination angles are $\zeta =41.63^\circ$, 49.35 $^\circ$ and 49.8 $^\circ$, respectively.

(a) Accumulated mass and (b) the mass-outflow rate as functions of time for mass-inflow rates  $Q=0.0020$, $0.0046$ and $0.0060\,{\rm kg}\,{\rm s}^{-1}$, and the box inclination angle $\theta =29.2^\circ$. The mass-outflow rate is calculated by taking the time derivative of the accumulated mass data. The inlet is opened at $t=0$ s, and the plateaus in total accumulated mass in (a) show where all of the material has drained from the system. The linear dot-dashed lines in (a) and the horizontal dot-dashed lines in (b) indicate the steady-state super-stable heap regime, when the mass-inflow rate equals the mass-outflow rate.

A JAI GO 5000C high-speed camera is oriented approximately parallel to the free surface of the super-stable heap, and used to collect 1000 images at  $664$ fps of the steady-state flowing layer. Figure 6(a) shows an example $1000 \times 120$ pixel image for a mass-inflow rate $Q=0.0046\,{\rm kg}\,{\rm s}^{-1}$, with the camera inclined at $48.9^\circ \pm 0.1^\circ$ to the horizontal. The PIVlab package (Thielicke & Stamhuis Reference Thielicke and Stamhuis2014) is used to generate velocity vectors (figure 6b), and the data are rotated by an additional $0.44^\circ$ to ensure that the down-slope direction is oriented along the $x$ axis. The slope-aligned $(x,z)$ coordinates are therefore inclined at $\zeta = 49.34^\circ$ to the horizontal. Figure 6(c) shows the velocity magnitude $|{\boldsymbol {u}}|$ in the slope-aligned coordinates $(x,z)$. It is approximately spatially uniform in the down-slope direction, which motivates averaging the time-averaged data along the $x$ direction to determine the velocity profile through the flow depth $z$.
$z$.
Panel (a) and movie 2 of the supplementary material show a  $1000 \times 120$ pixel high-speed photo/image sequence of the grains flowing down the inclined free surface at mass-inflow rate $Q=0.0046\,{\rm kg}\,{\rm s}^{-1}$. The camera is inclined at $48.9^\circ \pm 0.1^\circ$ to the horizontal. One thousand of these images are used to construct the velocity field (b) using the PIVlab package (Thielicke & Stamhuis Reference Thielicke and Stamhuis2014). Green velocity vectors are obtained from particle image velocimetry (PIV) analysis, and the red ones are interpolated from the surrounding field. (c) The time-averaged velocity magnitude in $(x,z)$ coordinates, which lie at an angle $\zeta = 49.34^\circ$ to the horizontal. The white line is the horizontally averaged velocity magnitude $|{\boldsymbol {u}}|$ through the flow depth. Note that the velocity scale is aligned with the colour bar for the contour map.

From the high-speed photographs (e.g. figure 6a) it is difficult to define the exact position of the free surface. Indeed, the Taberlet et al. (Reference Taberlet, Richard and Delannay2008) steady uniform DEM/DPM solutions show that the solids volume fraction decreases continuously through the flowing layer, and that there is a sparse region above it where the particles undergo ballistic motion. In order to compare the experimental velocity data with the incompressible theory (used in this paper), the free surface ( $z=0$) is defined by assuming a constant density throughout the material, and matching the mass-inflow rate implied by the measured velocity profiles with the rate measured by the balance. Figure 7 shows the resultant velocity profiles for the three mass-inflow rates $Q = 0.0020$, $0.0046$ and $0.0060\,{\rm kg}\,{\rm s}^{-1}$. Higher rates lead to higher velocities and deeper flows, but these also occur on steeper slopes. Note that the sections of the velocity data that are neglected correspond to regions where the solids volume fraction is low, so the error associated with the procedure to define the free surface is not that large.
Steady uniform velocity profiles measured using PIV for mass-inflow rates  $Q = 0.0020$, $0.0046$ and $0.0060\,{\rm kg}\,{\rm s}^{-1}$, which generate slopes at $\zeta =41.63^\circ$, 49.35 $^\circ$ and 49.8 $^\circ$ to the horizontal, respectively. The $z$ coordinate lies perpendicular to the inclined free surface, which is defined at $z = 0$. The dot-dashed lines represent velocity data that have been removed to ensure that the mass-inflow rates agree with that measured at the outlet. Since the solids volume fraction is very small in this region, this is not a large discrepancy.

3. Governing equations
The aim of this paper is to use the incompressible partially regularized  $\mu (I)$-rheology of Barker & Gray (Reference Barker and Gray2017) to model the formation, steady-state behaviour and drainage of a super-stable heap. The granular material is therefore assumed to have constant density $\rho =\varPhi \rho _*$, where $\varPhi$ is the solids volume fraction, and $\rho _*$ is the intrinsic density of the material that the grains are made of. This is a good leading-order approximation throughout most of the body, although this assumption fails close to the free surface of the avalanching layer, where the solids volume fraction reduces significantly (Taberlet et al. Reference Taberlet, Richard and Delannay2008).
3.1. Integration across the experiment width
For the experiments in § 2, the frictional sidewalls are sufficiently close together that the velocity profile across the cell width is plug-like (Taberlet et al. Reference Taberlet, Richard, Valance, Losert, Pasini, Jenkins and Delannay2003; Jop et al. Reference Jop, Forterre and Pouliquen2005). This motivates integration across the narrow gap to remove one spatial dimension from the problem. Assuming Cartesian coordinates  $Ox_i$, $i=1,2,3$, with the $x_1$ and $x_3$ coordinates in the plane of the experiment, and the $x_2$ coordinate lying across the width $W$, the incompressibility condition is
 \begin{equation} \frac{\partial u_1}{\partial x_1}+\frac{\partial u_2}{\partial x_2}+\frac{\partial u_3}{\partial x_3}=0, \end{equation}
where  $u_i$, $i=1,2,3$, are the velocity components in the directions $x_i$, respectively. Equation (3.1) can be integrated across the width of the cell by exchanging the order of integration with respect to $x_2$ and differentiation with respect to $x_1$ and $x_3$, and assuming that $u_2=0$ at $x_2=0,W$. Dividing the resulting equation by the constant cell width $W$ yields a two-dimensional width-averaged incompressibility condition
 \begin{equation} \frac{\partial\bar u_1}{\partial x_1}+\frac{\partial\bar u_3}{\partial x_3}=0, \end{equation}
where the width-averaged velocities in the plane of the cell are defined as
 \begin{equation} \bar u_i=\frac{1}{W}\int_0^W u_i\,\mathrm{d}{\kern0.9pt}x_2,\quad i=1,3. \end{equation}
The in-plane momentum balances (for  $i=1,3$) are
 \begin{equation} \rho\left(\frac{\partial u_i}{\partial t}+\frac{\partial}{\partial x_1}(u_i u_1)+\frac{\partial}{\partial x_2}(u_i u_2)+\frac{\partial}{\partial x_3}(u_i u_3)\right)=\rho g_i+\frac{\partial\sigma_{i1}}{\partial x_1}+\frac{\partial\sigma_{i2}}{\partial x_2}+\frac{\partial\sigma_{i3}}{\partial x_3}, \end{equation}
where  $g_i$ is the $i\text {th}$ component of the gravity acceleration vector ${\boldsymbol {g}}$, and $\sigma _{ij}$ is the $i, j$ component of the Cauchy stress tensor ${\boldsymbol {\sigma }}$. The momentum balances (3.4) can also be averaged across the cell by exchanging the order of integration and differentiation. Moreover, the plug-like velocity profiles across the cell imply that the integrals of the momentum transport terms can be simplified, to give
 \begin{equation} \rho\left(\frac{\partial\bar u_i}{\partial t}+\frac{\partial}{\partial x_1}(\bar u_i \bar u_1)+\frac{\partial}{\partial x_3}(\bar u_i \bar u_3)\right)=\rho g_i+\frac{\partial\bar\sigma_{i1}}{\partial x_1}+\frac{\partial\bar\sigma_{i3}}{\partial x_3}+\frac{1}{W}\,[\sigma_{i2}]_0^W, \end{equation}
where the width-averaged stresses are
 \begin{equation} \bar\sigma_{ij}=\frac{1}{W}\int_0^W \sigma_{ij}\,\mathrm{d}{\kern0.9pt}x_2,\quad i=1,3. \end{equation}
The shear stresses on the sidewalls are assumed to be given by a Coulomb law of the form
 \begin{equation} t_i=\sigma_{ij}n_j={-}\mu_w\,p\,\frac{\bar u_i}{|\bar{{\boldsymbol{u}}}|}\quad\textrm{at}\ x_2=0,W,\quad\textrm{for}\ i=1,3, \end{equation}
where  $\mu _w$ is a constant friction coefficient, $p$ is the pressure acting on the wall, and the factor $-\bar u_i/|\bar {{\boldsymbol {u}}}|$ ensures that the friction opposes the motion. This is consistent with the equations used by Taberlet et al. (Reference Taberlet, Richard, Valance, Losert, Pasini, Jenkins and Delannay2003, Reference Taberlet, Richard, Henry and Delannay2004, Reference Taberlet, Richard and Delannay2008) and Jop et al. (Reference Jop, Forterre and Pouliquen2005), although more complex friction laws that relate the slip velocity to the granular temperature are possible (Artoni & Richard Reference Artoni and Richard2015). Near the free surface of the heap, the velocity is predominantly down-slope, so the direction of the friction is well defined. Deeper down within the flow, $\bar {{\boldsymbol {u}}}$ can be zero. For sufficiently small creep, a $\tanh$ profile regularization is therefore used to allow the friction to smoothly transition through $\bar {{\boldsymbol {u}}}={\boldsymbol {0}}$.
The outward-pointing normal at  $x_2=0$ is ${\boldsymbol {n}}(0)=(0,-1,0)$, while at $x_2=W$, we have ${\boldsymbol {n}}(W)=(0,1,0)$. These definitions allow (3.7) to be used to solve for $\sigma _{i2}$ at $x_2=0,W$. Substituting these values into (3.5) implies that the width-averaged momentum balances in the plane of the cell are
 \begin{equation} \rho\left(\frac{\partial\bar u_i}{\partial t}+\bar{u}_1\,\frac{\partial\bar u_i}{\partial x_1}+\bar u_2\,\frac{\partial\bar{u}_i}{\partial x_3}\right)=\rho g_i+\frac{\partial\bar\sigma_{i1}}{\partial x_1}+\frac{\partial\bar\sigma_{i3}}{\partial x_3}-\mu_w\,\frac{2p}{W}\,\frac{\bar u_i}{|\bar{{\boldsymbol{u}}}|}, \end{equation}
where the momentum transport terms have been simplified using the width-averaged incompressibility relation (3.2). Equation (3.8) looks similar to the original momentum balance (3.4), but it is now defined in just two dimensions, with the lateral wall friction entering as a local source term. The width-averaged mass and momentum balances (3.2) and (3.8) can be written in vector notation as
 \begin{gather} {\boldsymbol{\nabla}} \boldsymbol{\cdot} {\boldsymbol{u}} = 0, \end{gather}
 \begin{gather} \rho\left(\frac{\partial{\boldsymbol{u}}}{\partial t} + {\boldsymbol{u}}\boldsymbol{\cdot}{\boldsymbol{\nabla}} {\boldsymbol{u}}\right) = {\boldsymbol{\nabla}}\boldsymbol{\cdot}{\boldsymbol{\sigma}} + \rho{\boldsymbol{g}} - \mu_w\,\frac{2p}{W}\,\frac{{\boldsymbol{u}}}{|{\boldsymbol{u}}|}, \end{gather}
where the averaging bars have now been dropped for notational simplicity (here and throughout the rest of the paper), and the gradient and dot product operators  ${\boldsymbol {\nabla }}$ and ${\boldsymbol {\cdot }}$ are understood to act in two dimensions. The conservation equations (3.9)–(3.10) hold in any of the coordinate systems $(X,Z)$, $(x,z)$ and $(\tilde x,\tilde z)$ defined in figure 4.
3.2. The  $\mu (I)$-rheology for granular flows

The Cauchy stress is decomposed into an isotropic pressure  $p$ and a deviatoric stress ${\boldsymbol {\tau }}$,
 \begin{equation} {\boldsymbol{\sigma}}={-}p {\boldsymbol{1}} + {\boldsymbol{\tau}}, \end{equation}
where  ${\boldsymbol {1}}$ is the unit tensor (in two dimensions). The $\mu (I)$-rheology for granular flows (GDR MiDi 2004; Jop et al. Reference Jop, Forterre and Pouliquen2006) is a nonlinear viscous law that relates the deviatoric stress ${\boldsymbol {\tau }}$ to the strain-rate tensor ${\boldsymbol {D}}=({\boldsymbol {\nabla }}{\boldsymbol {u}}+({\boldsymbol {\nabla }}{\boldsymbol {u}})^{\rm T})/2$ (where $T$ indicates transpose). The deviatoric stress and the strain rate are assumed to be aligned with one another:
 \begin{equation} \dfrac{{\boldsymbol{\tau}}}{\|\boldsymbol{\tau}\|} = \dfrac{{\boldsymbol{D}}}{\|{\boldsymbol{D}}\|}, \end{equation}
where
 \begin{equation} \| \cdot \| = \sqrt{\tfrac12\,\mathrm{tr}({\cdot}^2)} \end{equation}
is the second invariant of the enclosed tensor. In addition, there is a yield condition of the form
 \begin{equation} \|\boldsymbol{\tau}\| = \mu(I)\,p, \end{equation}
where the internal friction  $\mu$ is a function of the non-dimensional inertial number (1.2), which in tensorial notation becomes
 \begin{equation} I = \dfrac{2\,\|{\boldsymbol{D}}\|\,d}{\sqrt{p/\rho_*}}. \end{equation}
Substituting for the Cauchy stress (3.11) and the alignment and yield conditions (3.12) and (3.14), it follows that the width-averaged momentum balance (3.10) can also be written in the form
 \begin{equation} \rho\left(\frac{\partial{\boldsymbol{u}}}{\partial t} + {\boldsymbol{u}}\boldsymbol{\cdot}{\boldsymbol{\nabla}} {\boldsymbol{u}}\right) ={-}{\boldsymbol{\nabla}}p + {\boldsymbol{\nabla}}\boldsymbol{\cdot}\left(2\eta{\boldsymbol{D}}\right) + \rho{\boldsymbol{g}} - \mu_w\,\frac{2p}{W}\,\frac{{\boldsymbol{u}}}{|{\boldsymbol{u}}|}, \end{equation}
where the granular viscosity
 \begin{equation} \eta = \dfrac{\mu(I)\,p}{2\,\|{\boldsymbol{D}}\|} \end{equation}
is pressure and strain-rate invariant dependent. The governing equations (3.9) and (3.16) are therefore of the form of the incompressible Navier–Stokes equations, making it appropriate to use computational fluid dynamics tools to solve the system numerically.
3.3. Drucker–Prager plasticity and mathematical ill-posedness
If the friction  $\mu$ is constant, then the system reduces to the rate-independent Drucker–Prager model for plasticity (Drucker & Prager Reference Drucker and Prager1952). Schaeffer (Reference Schaeffer1987) showed that in this case, the equations are mathematically ill-posed over the complete range of parameter space. In this context, ill-posedness means that small perturbations to the system grow unboundedly in the high-wavenumber limit (Joseph & Saut Reference Joseph and Saut1990). This is catastrophic for numerical implementations, even though they may apparently yield plausible results at sufficiently low grid resolution. This is because numerical methods (i) are solved on grids with finite resolution, which truncates the instability, and (ii) introduce grid-dependent numerical diffusion. As a numerical grid is refined, the numerical diffusion diminishes, and progressively more unstable modes are resolved, so eventually these instabilities dominate the solution. The numerical solutions therefore become progressively more unstable on grid refinement, and do not converge towards a unique solution.
3.4. The classical $\mu (I)$ curve and well-posedness

The incompressible  $\mu (I)$-rheology (GDR MiDi 2004; Jop et al. Reference Jop, Forterre and Pouliquen2006) shares much of the same mathematical structure as the Drucker–Prager model, except that the friction $\mu$ is dependent on the non-dimensional inertial number $I$. In the original formulation, the $\mu (I)$ function is given by (1.3), and starts at a value $\mu _s$ when $I=0$, and asymptotes to $\mu _d>\mu _s$ as $I\rightarrow \infty$ (GDR MiDi 2004; Jop et al. Reference Jop, Forterre and Pouliquen2006). A graph of the function is shown in figures 8(a,b). This inertial number dependence makes the theory rate and pressure dependent, whereas the Drucker–Prager model is rate independent. As a result, the incompressible $\mu (I)$-rheology can have significantly better mathematical properties. This has allowed it to be used to calculate granular chute flows, column collapses and silo discharge (Jop et al. Reference Jop, Forterre and Pouliquen2006; Lagrée et al. Reference Lagrée, Staron and Popinet2011; Martin et al. Reference Martin, Ionescu, Mangeney, Bouchut and Farin2017; Staron, Lagrée & Popinet Reference Staron, Lagrée and Popinet2014). However, Barker et al. (Reference Barker, Schaeffer, Bohorquez and Gray2015) showed that the $\mu (I)$-rheology was mathematically well-posed provided that the condition
 \begin{equation} C = 4 \left( \dfrac{I \mu'}{\mu}\right)^2 -4\left( \dfrac{I \mu'}{\mu}\right) + \mu^2 \left( 1 -\dfrac{I \mu'}{2\mu} \right)^2 \leq 0 \end{equation}
was satisfied, where  $\mu ' = \mathrm {d}\mu /\mathrm {d}I$. For the classical $\mu (I)$ function (1.3), Barker et al. (Reference Barker, Schaeffer, Bohorquez and Gray2015) showed that provided that $\mu _d-\mu _s$ was large enough, there was a region of well-posedness for inertial numbers in the range $I\in [I_1^N, I_2^N]$. Figure 8(c) shows the condition (3.18) for the Jop et al. (Reference Jop, Forterre and Pouliquen2006) curve (1.3). For the parameters given in table 1, the theory is well-posed for $I\in [0.004, 0.3]$, but it is ill-posed when the inertial number is either too low ( $0< I<0.004$) or too high ( $I>0.3$). Barker et al. (Reference Barker, Schaeffer, Bohorquez and Gray2015) performed numerical simulations of Bagnold flow on a 32 $^\circ$ incline (when the theory is ill-posed) to explicitly show the rapid growth of grid-scale-dependent oblique waves, which ultimately caused the scheme to crash. Similar grid-dependent results have also been seen in the column collapse simulations of Martin et al. (Reference Martin, Ionescu, Mangeney, Bouchut and Farin2017), and in decelerating chute flows by Barker & Gray (Reference Barker and Gray2017). The classical $\mu (I)$ curve (1.3) inherits its reciprocal dependence from measurements of $h_{stop}$ as a function of inclination angle, as shown in Appendix A. It is therefore questionable whether the friction really asymptotes to $\mu _d$ at high inertial numbers, and $\mu _d$ is certainly poorly constrained by the chute flow experiments.
The friction  $\mu$ as a function of $I$ is shown in (a,b) for the original function (1.3) of Jop et al. (Reference Jop, Forterre and Pouliquen2006) (red curve) and the partially regularized function (3.19) of Barker & Gray (Reference Barker and Gray2017) (blue curve) using the parameter values in table 1. The red and blue dots highlight the values of $\mu$ when $I=0$ in the two models. Different horizontal scales are needed to show the extent of the well-posed regions for (a) the original (light red shading) and (b) the partially regularized theories (light blue shading). The well posedness condition $C$ of $I$, defined in (3.18), is shown for (c) the original and (d) the partially regularized theory. The black dots indicate the points where $C = 0$. It is these points that set the boundaries of the well-posed regions in (a,b).

Material parameters taken from Barker et al. (Reference Barker, Rauter, Maguire, Johnson and Gray2021).
3.5. The Barker & Gray (Reference Barker and Gray2017) partially regularized $\mu (I)$-rheology

Barker & Gray (Reference Barker and Gray2017) treated the neutral stability condition for (3.18) as an ordinary differential equation (ODE) for  $\mu$ as a function of $I$. From this, they were able to maximize the range of well-posedness of the incompressible $\mu (I)$-rheology. Figures 8(a,b) show the resulting function, which is given by
 \begin{equation} \mu(I) = \begin{cases} \sqrt{\dfrac{\alpha}{\ln(A/I)}}, & I\leq I^N_1, \\ \dfrac{\mu_s I_0 + \mu_d I + \mu_\infty I^2}{I_0 + I}, & I >I^N_1, \end{cases} \end{equation}
where  $\alpha$ and $\mu _\infty$ are material constants, and
 \begin{equation} A = I^N_1 \exp \left[\dfrac{\alpha (I_0 + I^N_1)^2}{(\mu_s I_0 + \mu_d I^N_1 + \mu_\infty (I^N_1)^2)^2} \right] \end{equation}
ensures a continuous transition between the two branches. Also,  $I_1^N=0.004$ is the lower neutral stability point of the Jop et al. (Reference Jop, Forterre and Pouliquen2006) curve (1.3). Figure 8(a) shows that this function is very close to the original Jop et al. (Reference Jop, Forterre and Pouliquen2006) curve, in the range where it is well-posed, i.e. for $I\in [0.004, 0.3]$. Barker & Gray (Reference Barker and Gray2017) showed that it was possible to eliminate the region of the ill-posedness at low inertial numbers by introducing a creep state, in which $\mu (0)=0$ and there is a logarithmic dependence in (3.19) at low inertial numbers. For large inertial numbers, the function (3.19) asymptotes to a linear dependence on $I$, as shown in figure 8(b). This significantly extends the range of inertial numbers for which the rheology is well posed to $[0, 16.99]$, but for large enough inertial numbers, it can still be ill-posed. For this reason, the theory is termed the partially regularized $\mu (I)$-rheology. It has the advantage that it is reasonably simple and can be solved within the framework of existing computational fluid dynamics codes (Barker & Gray Reference Barker and Gray2017). In particular, Barker et al. (Reference Barker, Rauter, Maguire, Johnson and Gray2021) and Maguire et al. (Reference Maguire, Barker, Rauter, Johnson and Gray2024) have coupled the theory with particle-size segregation models (Gray Reference Gray2018) to solve complex segregating flow problems in chutes and rotating drums. There are, however, new theories that always remain well-posed, but they add considerable complexity to the system (Barker et al. Reference Barker, Schaeffer, Shearer and Gray2017; Goddard & Lee Reference Goddard and Lee2017; Kamrin Reference Kamrin2019; Heyman et al. Reference Heyman, Delannay, Tabuteau and Valance2017; Schaeffer et al. Reference Schaeffer, Barker, Tsuji, Gremaud, Shearer and Gray2019).
The linear dependence of the friction  $\mu$ on $I$ at high inertial numbers, which is assumed in the Barker & Gray (Reference Barker and Gray2017) model, is supported by the high-speed flow experiments of Holyoake & McElwaine (Reference Holyoake and McElwaine2012). However, DEM/DPM simulations of dumbbells and discs suggest that a maximum friction occurs at a finite inertial number in the range 0.6–0.8, and then decreases monotonically with inertial number thereafter (Mandal & Khakhara Reference Mandal and Khakhara2016; Patro et al. Reference Patro, Prasad, Tripathi, Kumar and Tripathi2021). A classical incompressible $\mu (I)$ law of this form would be mathematically ill-posed in the monotonically decreasing region, since $\mu '<0$, hence the well-posedness condition (3.18) implies that $C$ is strictly positive, which violates the inequality. It is, however, possible to formulate well-posed compressible $I$-dependent rheology models that could have non-monotonic dependence on the inertial number (Schaeffer et al. Reference Schaeffer, Barker, Tsuji, Gremaud, Shearer and Gray2019).
4. Steady uniform flow on the pile
The experiments in § 2 show that a steady uniform-thickness flow develops on the right-hand face of the super-stable heap. Jop et al. (Reference Jop, Forterre and Pouliquen2005) constructed a one-dimensional steady-state solution for the flowing layer, with the original form (1.3) of the  $\mu (I)$-rheology. Attempts to simulate this in two-dimensional time-dependent numerical simulations with the tensorial form of the $\mu (I)$-rheology (Jop et al. Reference Jop, Forterre and Pouliquen2006) will, however, lead to grid-dependent results (Barker et al. Reference Barker, Schaeffer, Bohorquez and Gray2015; Barker & Gray Reference Barker and Gray2017). This is because there is necessarily a region where the inertial number falls below $I_1^N$, and there may be a region that exceeds $I_2^N$, both of which would be ill-posed. It is of interest to construct an equivalent one-dimensional solution for the partially regularized $\mu (I)$-rheology (Barker & Gray Reference Barker and Gray2017), which has a much wider range of applicability, and crucially does not become ill-posed at low inertial numbers.
4.1. Exact solution for the shear stress and friction
The super-inclined slope coordinates  $Oxz$, defined in figure 4, are used in this subsection, with the origin $O$ located at the free surface, so that $z=0$ corresponds to the free surface. The velocity ${\boldsymbol {u}}$ has components $(u,w)$ in the $(x,z)$ directions, respectively. The flow is assumed to be steady and uniform in the down-slope $x$ coordinate. This allows the mass balance equation (3.9) to be integrated, subject to the condition that $w=0$ at $z=0$, to show that
 \begin{equation} w = 0 \end{equation}
everywhere within the flow. Since  ${\boldsymbol {u}}=(u(z),0)$, the strain rate and the second invariant of the strain rate (3.13) reduce to
 \begin{equation} {\boldsymbol{D}}=\left(\begin{array}{@{}cc@{}}0 & \dfrac{1}{2}\,\dfrac{\mathrm{d}u}{\mathrm{d}z}\\ \dfrac{1}{2}\,\dfrac{\mathrm{d}u}{\mathrm{d}z} & 0\end{array}\right),\quad \|{\boldsymbol{D}}\|=\dfrac{1}{2}\left|\dfrac{\mathrm{d}u}{\mathrm{d}z}\right|, \end{equation}
respectively. Assuming that  $\mathrm {d}u/\mathrm {d}z >0$, the alignment and yield conditions (3.12) and (3.14) then imply that the deviatoric stress
 \begin{equation} {\boldsymbol{\tau}}=\left(\begin{array}{@{}cc@{}}0 & \mu(I)\,p\\ \mu(I)\,p & 0\end{array}\right) \end{equation}
and the down-slope and normal components of the momentum balance (3.10) are
 \begin{gather} \dfrac{\mathrm{d}\tau_{xz}}{\mathrm{d}z} + \rho g\sin\zeta - \dfrac{2}{W}\,\mu_w p = 0, \end{gather}
 \begin{gather} {-\dfrac{\mathrm{d}p}{\mathrm{d}z}} - \rho g\cos\zeta = 0, \end{gather}
respectively. Integrating (4.5) with respect to  $z$, subject to the boundary condition $p=0$ at $z=0$, implies that the pressure is lithostatic:
 \begin{equation} p={-}\rho g z \cos\zeta. \end{equation}
The linear dependence of the shear stress on pressure in (4.3) implies that  $\tau _{xz}$ has to be zero at the free surface to be compatible. Substituting (4.6) into (4.4), and integrating with respect to $z$, subject to $\tau _{xz}=0$ at $z=0$, implies
 \begin{equation} \tau_{xz} ={-}\rho g z \sin\zeta - \dfrac{\mu_w}{W}\,\rho g z^2 \cos\zeta. \end{equation}
Using  $\tau _{xz}=\mu (I)\,p$ and (4.6), it follows that the friction is
 \begin{equation} \mu(I) = \tan\zeta + \dfrac{\mu_w}{W}\,z. \end{equation}
This implies that at the free surface ( $z=0$), the friction is $\mu (I)=\tan \zeta$, independent of the wall friction $\mu _W$. This is extremely significant, because the experiments in § 2 show that even at moderate mass-inflow rates, the free-surface inclination approaches $\zeta \sim 50^\circ$. This can be a problem for the $\mu (I)$ function (1.3). If $\mu _d<\tan \zeta$, then it is not possible to invert the function $\mu (I)=\tan \zeta$ to determine $I$ at the free surface, hence a steady uniform flow solution does not exist. For example, this is the case for the parameters in table 1, where $\mu _d=0.557$ is less than $\tan 50^\circ =1.19$. It follows that either $\mu _d$ should be much higher than assumed in table 1, or the friction does not tend to $\mu _d$ as $I\rightarrow \infty$. In contrast, the friction in the Barker & Gray (Reference Barker and Gray2017) partially regularized $\mu (I)$-rheology has a linear dependence on $I$ at high inertial numbers, which implies that (3.19) can always be inverted to determine $I$, hence a steady uniform flow solution exists for all slope inclination angles.
As well as probing the high inertial number regime, the inertial number also sweeps through moderate and low inertial number regimes in the steady uniform flow that develops on top of the heap. In particular, there is a finite depth  $z=z_{st}$ in the flow, where the inertial number equals zero and hence the friction reaches its minimum value $\mu =\mu (0)$. Beneath this level, the granular material is assumed to fall below yield (3.14) and is stationary. Substituting $\mu =\mu (0)$ into (4.8) implies that the height below which everything is stationary is
 \begin{equation} z_{st} = \dfrac{W}{\mu_w} \left(\mu(0) - \tan\zeta\right). \end{equation}
For the original  $\mu (I)$ curve (1.3), the minimum value of the friction is $\mu (0)=\mu _s$, while for the partially regularized function (3.19), $\mu (0)=0$. As a result, the partially regularized $\mu (I)$-rheology of Barker & Gray (Reference Barker and Gray2017) apparently predicts a much thicker flowing layer than the original $\mu (I)$ model of Jop et al. (Reference Jop, Forterre and Pouliquen2006). Equation (4.9) can also be written as
 \begin{equation} \tan\zeta = \mu(0) + \mu_w\,\frac{h}{W}, \end{equation}
where the flow thickness is  $h=-z_{st}>0$. This essentially recovers the Taberlet et al. (Reference Taberlet, Richard, Valance, Losert, Pasini, Jenkins and Delannay2003) grain-size independent force balance (1.1). Determining the first point of yield, and hence the flow depth $h$, is open to interpretation, however, because creep motion may be visible only over longer time scales (Komatsu et al. Reference Komatsu, Inagaki, Nakagawa and Nasuno2001). One interpretation of the Taberlet et al. (Reference Taberlet, Richard, Valance, Losert, Pasini, Jenkins and Delannay2003) experiments is that $\mu _i=\mu (0)=\mu _s=\tan 23.3^\circ$ and $h$ is the depth of the surface layer of particles that are in motion during the short observational time scale in the experiments.
4.2. Numerical solutions for the associated velocity profile
To calculate the velocity profile, it is necessary to first invert (4.8) to obtain an expression for the inertial number, i.e.
 \begin{equation} I = \mathcal{I}\left( \tan\zeta + \dfrac{\mu_w}{W}\,z\right), \end{equation}
where  $\mathcal {I}(\mu )$ is the inverse function of $\mu (I)$. As discussed in § 4.1, it is not always possible to do this inversion. Assuming that it can be done, the definition of the inertial number (3.15) then allows an ODE for the velocity to be formulated as
 \begin{equation} \dfrac{\mathrm{d}u}{\mathrm{d}z} = \dfrac{\mathcal{I}\left( \tan\zeta + \dfrac{\mu_w}{W}\,z \right)}{d}\,\sqrt{-\varPhi g z \cos\zeta}, \end{equation}
where the solids volume fraction  $\varPhi =\rho /\rho _*$ is constant. This is integrated from $u=0$ at $z=z_{st}$ up to the free surface at $z=0$, using an explicit Runge–Kutta $(4,5)$ method (Dormand & Prince Reference Dormand and Prince1980; Shampine & Reichelt Reference Shampine and Reichelt1997).
Figure 9(a) shows the computed velocity profiles for inclination angles  $\zeta =36.87$ and $46.40^\circ$, which lie just below and just above $\arctan (\mu _d)=41.98^\circ$. At the lower inclination angle, both models produce qualitatively similar results. For the original friction law (1.3), the smooth transition to the unyielded material beneath occurs at $z_{st}=W(\mu _s-\tan \zeta )/\mu _w$. This contrasts with the partially regularized rheology (3.19), where the smooth transition occurs much deeper down at $z_{st}=-W\tan \zeta /\mu _w$. Despite the fact that the flowing layer is much thicker, the creep state at low inertial numbers ensures that there is very little motion except near the free surface. As a result, the low-velocity regions look very similar. However, the additional resistance afforded by the linear regime at high inertial numbers in (3.19) retards the flow, and the partially regularized velocities near the free surface are substantially lower than those using the original theory. The original model (1.3) breaks down in the $46.40^\circ$ case. This is because there is a finite depth at which the friction satisfies $\mu \rightarrow \mu _d$, which implies that $\mathcal {I}\rightarrow \infty$ and the velocity tends to infinity. In contrast, the partially regularized friction law (3.19) of Barker & Gray (Reference Barker and Gray2017) can be inverted at all inclination angles, and produces solutions that are qualitatively similar to those at the lower inclination.
(a) Exact solutions for the down-slope velocity  $u$ as a function of $z$ at inclination angles $\arctan (\mu _d - 0.15) = 36.87^\circ$ and $\arctan (\mu _d + 0.15) = 46.40^\circ$ using the parameters in table 2. The solutions are shown for the original (red lines) and partially regularized (black lines) forms of the $\mu (I)$-rheology (GDR MiDi 2004; Jop et al. Reference Jop, Forterre and Pouliquen2006; Barker & Gray Reference Barker and Gray2017). The circular and diamond-shaped markers show the height $z=z_{st}$ at which the material falls below yield. The grey-shaded markers correspond to the $46.40^\circ$ case. The dashed line in the inset indicates that on the $46.40^\circ$ slope, the velocity $u\rightarrow \infty$ at a finite depth for the original friction law (1.3). This corresponds to the height where the friction is $\mu \rightarrow \mu _d$. (b) The inclination angle $\zeta$ as a function of the mass-inflow rate $Q$ for the partially regularized (black line) and the original (red line) laws using the same parameters. The coloured triangles indicate the experimental cases from § 2, while the diamond and circular markers indicate the solutions in (a). The dashed line and star show the maximum mass-inflow rate for which a solution to the Jop et al. (Reference Jop, Forterre and Pouliquen2006) model exists.

The slope inclination angle  $\zeta$ emerges spontaneously during the experiments, and is controlled only indirectly through the mass-inflow rate $Q$. However, since all of this material flows down the right-hand side of the pile at steady state, it is easy to calculate $Q$ for a given inclination angle $\zeta$ using the computed velocity profile, i.e.
 \begin{equation} Q=\rho W\int_{z_{st}}^0 u\,\mathrm{d}z. \end{equation}
 Figure 9(b) shows a plot of the inclination angle  $\zeta$ as a function of the mass-inflow rate $Q$, for both the original friction law (1.3) and the partially regularized curve (3.19). At low mass-inflow rates, the two curves are almost indistinguishable from one another, and have large changes in inclination angle for only very small changes in flux. As the flow rate increases, the partially regularized model experiences larger friction, which retards the flow, and therefore requires the super-stable heap to select inclination angles that are steeper than in the original theory. Solutions exist for the original friction law (1.3) only if the slope angle is $\zeta <\arctan (\mu _d)$, as discussed above. In particular, for the parameters in table 2, this implies that there are no solutions to the Jop et al. (Reference Jop, Forterre and Pouliquen2006) model for the two larger experimental fluxes in § 2, as shown in figure 9(b). Similarly, the parameters in table 1 support a maximum slope angle of only $29.1^\circ$. This is well below the angles $40^\circ \unicode{x2013}50^\circ$ observed experimentally in § 2. In contrast, the slope angle is well defined for the partially regularized $\mu (I)$-rheology (3.19), and it continues to increase with increasing mass-inflow rate. The fit of the theory to the experiments is very good for the parameter values chosen in § 4.3.
Rheological parameters for the partially regularized  $\mu (I)$-rheology, and wall friction, used in § 4 to fit the experimental steady-state velocity profiles in figure 10 and the inclination angle as a function of mass-inflow rate in figure 9(b). A summary is also included of the measured steady super-stable-heap angles $\zeta _1^{exp}$, $\zeta _2^{exp}$ and $\zeta _3^{exp}$ for the experimental mass-inflow rates $Q = 0.0020$, $0.0046$ and $0.0060\,{\rm kg}\,{\rm s}^{-1}$. Using these parameters, the one-dimensional exact solution produces slope inclination angles $\zeta _1^{fit}$, $\zeta _2^{fit}$ and $\zeta _3^{fit}$, for the same mass-inflow rates. Note that $\mu _s$ is determined from the angle of repose in figure 1.

4.3. Determining suitable parameters for the numerical simulations
Equation (4.8) implies that the friction varies from  $\tan \zeta$ at the free surface of the steady uniform flow, to zero at a finite depth. Assuming that the grains satisfy a $\mu (I)$-type law, it follows that the inertial number also varies through the depth, rather than being equal to a constant value as in Bagnold flow (B2). The steady uniform velocity profiles in figure 7 therefore contain a wealth of information that can be used to determine the parameters $\mu _s$, $\mu _d$, $\mu _\infty$ and $I_0$ for use in the partially regularized law (3.19), as well as the wall friction $\mu _w$. Simultaneously fitting such a large set of parameters to all of the data is still difficult. Moreover, the theory is not perfect because it assumes incompressibility, and there is strong evidence that the flow dilates substantially close to the free surface, which itself is not clearly defined (Taberlet et al. Reference Taberlet, Richard and Delannay2008). Despite this, it will be shown in § 6 that the incompressible $\mu (I)$-rheology is able to capture the entire formation and collapse of super-stable heaps.
To simplify the parameter-fitting procedure, it was assumed that the static friction  $\mu _s$ is equal to the angle of repose of a static pile of grains, which from figure 1 is approximately $\tan 22^\circ \simeq 0.4$. The steady uniform flow solver from § 4.2 was then used to optimize the remaining parameters so that they provided good fits to the measured steady uniform velocity profiles for the three different mass-inflow rates (figure 10a), and so that the heap angles lay within $\pm 1.5^\circ$ of their experimental values (table 2). A further constraint lies in the fact that the theory should be well-posed throughout its entire flow depth, i.e. the values of the parameters must ensure that $I$ stays within the range of well-posed inertial numbers according to the inequality (3.18). Figure 10(b) shows that for the optimized parameters in table 2, the inertial number does indeed stay below the upper bound for well-posedness.
(a) The experimental down-slope velocity profiles with  $z$ (dot-dashed lines) for the three mass-inflow rates in § 2, and the corresponding fitted profiles (solid lines) using the parameters in table 2. For mass-inflow rates $Q = 0.0020$, $0.0046$ and $0.0060\,{\rm kg}\,{\rm s}^{-1}$, the resulting slope angles are $\zeta ^{fit}=43.3769^\circ$, 47.9899 $^\circ$ and 49.5276 $^\circ$, whereas the experimental angles were $\zeta ^{exp}=41.63^\circ$, 49.35 $^\circ$ and 49.8 $^\circ$, respectively. (b) The corresponding exact solution for the inertial number through the flow depth. The black dashed line indicates the upper limit of the well-posed region of the partially regularized $\mu (I)$-rheology. This is equal to 1.0297 for the parameters in table 2.

Figure 9(b) shows the slope inclination as a function of mass-inflow rate for the partially regularized  $\mu (I)$-rheology with the parameters in table 2. The solution curve passes close to the experimentally measured values, and as opposed to the classical law (1.3), is well defined for all mass-inflow rates. The parameter values that deviate most from those used in Barker et al. (Reference Barker, Rauter, Maguire, Johnson and Gray2021) are $\mu _d$ and $\mu _{\infty }$. These have greatest effect in the high inertial number limit. In future, it may be possible to use super-stable heap experiments and the exact solutions in §§ 4.1 and 4.2 to determine an even better functional form for the $\mu (I)$ law, or include bulk compressibility (Barker et al. Reference Barker, Schaeffer, Shearer and Gray2017; Schaeffer et al. Reference Schaeffer, Barker, Tsuji, Gremaud, Shearer and Gray2019). However, it is important to stress that the partially regularized incompressible $\mu (I)$-rheology does a remarkably good job of simultaneously fitting both the slope inclination angles and the velocity profiles, in figures 9(b) and 10(a), with a single set of parameters, given that the flow self-selects both of these quantities as the mass-inflow flux is changed.
5. Numerical method
5.1. Extended system of equations
The numerical method developed by Barker et al. (Reference Barker, Rauter, Maguire, Johnson and Gray2021) is used in this paper to solve the width-averaged mass and momentum balances (3.9) and (3.10). In order to handle the evolving free surface, a two-fluid mixture approach is used to solve the equations in an extended domain that includes an excess-air phase in regions that are not occupied by the grains. The excess air is introduced purely for numerical convenience, and is not the same as the interstitial air between the grains. The grains and the interstitial air (which will be referred to as grains for short) are assumed to occupy a volume fraction  $\varphi ^g\in [0,1]$, and the excess air occupies a volume fraction $\varphi ^a\in [0,1]$ per unit mixture volume. It follows that their sum equals unity:
 \begin{equation} \varphi^g+\varphi^a=1. \end{equation}
The aim of the method is to keep the two phases/species largely separated from one another, so that the interface between them represents the free surface of the grains. This is accomplished by requiring the volume fractions to satisfy a pair of segregation equations
 \begin{gather} \frac{\partial\varphi^g}{\partial t} + {\boldsymbol{\nabla}}\boldsymbol{\cdot}\left( \varphi^g {\boldsymbol{u}} \right) + {\boldsymbol{\nabla}}\boldsymbol{\cdot}\left(\,f_{ga}\varphi^g\varphi^a\,{\boldsymbol{e}}\right)=0, \end{gather}
 \begin{gather} \frac{\partial\varphi^a}{\partial t} + {\boldsymbol{\nabla}}\boldsymbol{\cdot}\left( \varphi^a {\boldsymbol{u}} \right) + {\boldsymbol{\nabla}}\boldsymbol{\cdot}\left({-}f_{ga}\varphi^a\varphi^g\,{\boldsymbol{e}}\right)=0, \end{gather}
where  ${\boldsymbol {u}}$ is the bulk velocity field, $f_{ga}$ is the segregation velocity between grains and the excess air, and ${\boldsymbol {e}}$ is a unit vector that sets the segregation direction (Gray & Thornton Reference Gray and Thornton2005; Gray & Chugunov Reference Gray and Chugunov2006; Gray & Ancey Reference Gray and Ancey2011; Gray Reference Gray2018). The first terms on the left-hand sides of (5.2) and (5.3) are the time rates of change of the species concentration; the second terms represent transport by the bulk flow; and the third terms segregate the phases from one another, driving the local concentrations to 0 or 1. Note that summing (5.2) and (5.3), and substituting (5.1), implies that the bulk velocity field ${\boldsymbol {u}}$ is still incompressible:
 \begin{equation} {\boldsymbol{\nabla}} \boldsymbol{\cdot} {\boldsymbol{u}} =0. \end{equation}
The width-averaged momentum balance (3.16) is written in conservative extended form
 \begin{equation} \frac{\partial}{\partial t}(\varrho {\boldsymbol{u}}) + {\boldsymbol{\nabla}}\boldsymbol{\cdot}( \varrho {\boldsymbol{u \otimes u}} ) ={-}{\boldsymbol{\nabla}} p + {\boldsymbol{\nabla}} \boldsymbol{\cdot} (2\hat\eta{\boldsymbol{D}}) + \varrho {\boldsymbol{g}} - \frac{2}{W}\,\varphi^g\mu_W p\,\frac{{\boldsymbol{u}}}{|{\boldsymbol{u}}|}, \end{equation}
where  $\varrho$ is the mixture density, ${\boldsymbol {\otimes }}$ is the dyadic product, and $\hat \eta$ is the mixture viscosity. Note that in (5.5), a factor $\varphi ^g$ has been added to the wall friction terms, so that they do not act on the excess air. The mixture density $\varrho$ is defined as
 \begin{equation} \varrho = \sum_{\forall\nu} \varphi^\nu\varrho^{\nu}, \end{equation}
where the species densities  $\varrho ^\nu$ are constant. In particular, the density of the air $\varphi ^a$ is a lot less than that of the grains: $\varrho ^a \ll \varrho ^g=\rho =\rho _*\varPhi$. The mixture viscosity $\hat \eta$ is also defined by a volume fraction weighted average of the individual species viscosities:
 \begin{equation} \hat\eta = \sum_{\forall\nu} \varphi^\nu\eta^{\nu}. \end{equation}
The granular viscosity  $\eta ^g=\eta$ is given by the nonlinear function (3.17), while the air viscosity $\eta ^a=1\times 10^{-2}\,{\rm kg}\,{\rm m}^{-1}\,{\rm s}^{-1}$ is chosen to be higher than a more realistic value $\eta ^a = 1.81 \times 10^{-5}\,{\rm kg}\,{\rm m}^{-1}\,{\rm s}^{-1}$, to suppress turbulent motion in the air (which can increase computational time). Choosing a higher value of $\eta ^a$ is legitimate here, since the excess air is included purely for ease of tracking the granular free surface.
5.2. Interface sharpening
For a pure phase of granular material ( $\varphi ^g=1$), the extended width-averaged mass and momentum equations (5.4) and (5.5) are formally equivalent to the original width-averaged equations (3.9) and (3.16). Conversely, in a pure phase of excess air ( $\varphi =1$), the system reduces to a low-density incompressible viscous fluid. The method rests on driving the species concentrations towards these two limiting states. A common problem in multi-phase methods is the smearing/blurring of the interface that forms between the two phases. The usual two-fluid approach uses the counter-gradient transport method to sharpen the air–grain interface (Rusche Reference Rusche2002; Weller Reference Weller2008). The interface-sharpening equation for the excess air and granular phases would be
 \begin{equation} \frac{\partial\phi^a}{\partial t} + {\boldsymbol{\nabla}}\boldsymbol{\cdot}\left( \varphi^a {\boldsymbol{u}} \right) + {\boldsymbol{\nabla}}\boldsymbol{\cdot}\left(c_{ag}\, |\boldsymbol{u}|\,\phi^a \phi^g\,\dfrac{{\boldsymbol{\nabla}}\phi^a}{|{\boldsymbol{\nabla}}\phi^a|}\right)=0, \end{equation}
where  $c_{ag}|{\boldsymbol {u}}|$ determines the strength of sharpening, with the direction given by the gradient of the excess air concentration ${\boldsymbol {\nabla }}\phi ^a/|{\boldsymbol {\nabla }}\phi ^a|$. Equation (5.8) has close structural similarities with the segregation equations (5.2) and (5.3); however, Barker et al. (Reference Barker, Rauter, Maguire, Johnson and Gray2021) showed that although it does sharpen the interface between the air and the grains, it also causes (i) thin layers of excess air to be trapped adjacent to solid boundaries, and (ii) excess air bubbles to become trapped within solid-like granular regions. Both of these effects are unphysical for granular systems, because the excess air is able to escape through the connected pore space between the grains. Since Barker et al. (Reference Barker, Rauter, Maguire, Johnson and Gray2021) were primarily concerned with solving for the motion and segregation in size bi-disperse mixtures of grains, they suggested extending the system of particle segregation equations to include the segregation/separation of the air phase. This has the advantage that the direction and magnitude of the segregation can be chosen by the user. Barker et al. (Reference Barker, Rauter, Maguire, Johnson and Gray2021) chose ${\boldsymbol {e}}$ parallel to the gravitational acceleration vector ${\boldsymbol {g}}$, i.e. ${\boldsymbol {e}}={\boldsymbol {g}}/|{\boldsymbol {g}}|$. The air segregation equation (5.3) therefore segregated any excess air that was in danger of being trapped, upwards in the opposite direction to gravity, into the excess air layer above the grains. This produced an air-bubble-free granular material with a very sharp surface interface.
5.3. OpenFOAM implementation
The incompressibility condition (5.4) and the extended momentum balance equations (5.5) are solved in OpenFOAM using the PIMPLE algorithm. This is a combination of the SIMPLE algorithm (semi-implicit method for pressure-linked equations), and the PISO algorithm (pressure implicit with splitting of operator), which is an iterative method to solve for the pressure (Issa Reference Issa1986). The concentration equations (5.2) and (5.3) are solved using the multi-dimensional universal limiter for explicit solution (MULES) algorithm (Weller Reference Weller2006). Both schemes are explicit, and a Courant–Friedrichs–Lewy (CFL) condition must therefore be satisfied. For many multi-phase flows, the convection term dominates the CFL criterion, but for granular flows with static regions, the viscosity (3.17) can reach large values. As a result, the CFL number is defined in terms of both the velocity and the viscosity (Moukalled, Mangani & Darwish Reference Moukalled, Mangani and Darwish2016):
 \begin{equation} \textrm{CFL} = \dfrac{|\boldsymbol{u}|\,\Delta t}{\Delta x} + \dfrac{\hat\eta\,\Delta t}{\rho\,\Delta x^2}. \end{equation}
A backward Euler integration scheme is used with an adaptive time stepper that ensures that the CFL number is always less than unity for numerical stability. Following Lagrée et al. (Reference Lagrée, Staron and Popinet2011) and Staron et al. (Reference Staron, Lagrée and Popinet2012), a viscosity cap is applied,
 \begin{equation} \hat\eta = \min(\hat\eta,\hat\eta_{max}), \end{equation}
to prevent the time step from becoming unreasonably small. The value of  $\hat \eta _{max}$ must be chosen to be sufficiently high that the high Newtonian viscosity is active only in regions where the granular material is essentially static. The two-dimensional periodic box solutions in Appendix B are used to validate the numerical algorithm against the exact solutions in § 4.
5.4. Artificial dilution of the free-falling granular jet
The  $\mu (I)$-rheology was designed to model dense liquid-like granular flows, such as the avalanches that develop on inclined slopes, and in the free-surface layers of heaps and partially filled rotating drums (GDR MiDi 2004; Jop et al. Reference Jop, Forterre and Pouliquen2006; Lagrée et al. Reference Lagrée, Staron and Popinet2011; Staron et al. Reference Staron, Lagrée and Popinet2012; Barker & Gray Reference Barker and Gray2017; Barker et al. Reference Barker, Rauter, Maguire, Johnson and Gray2021; Maguire et al. Reference Maguire, Barker, Rauter, Johnson and Gray2024). Importantly, the $\mu (I)$-rheology was never intended to apply to the dilute high-speed granular jet, which develops as the grains fall from the inlet (figure 2). However, in order to model the time-dependent growth of the super-stable heap, it is necessary to find a means of delivering the grains to the apex of the pile, even if this is not physically realistic.
Initial attempts to model the jet closely paralleled the experimental system, with a  $0.02$ m inlet at $\tilde {x} = 0.1\unicode{x2013}0.12$ m (figure 4) delivering grains into the system with mass-inflow rate $Q$ and concentration $\varphi ^g=1-\varphi ^a=1$. However, this approach failed, because as the grains accelerated due to gravity, incompressibility caused the jet to thin to such a degree that impractical levels of grid refinement were needed to resolve it. At low inflow velocities, the narrow jet was also prone to instabilities with the excess air phase. In reality, the free-falling granular jet does not remain dense, but rapidly breaks apart and becomes highly dilute. A practical approach is therefore to assume that the jet is already dilute at the inflow, i.e. $\varphi ^g=1-\varphi ^a=0.2$, but the mass-inflow rate $Q$ is the same. Figure 11 shows a simulation of the dilute free-falling jet in gravity-aligned coordinates $(X,Z)$. This also accelerates and narrows as it falls, but not as strongly as for a pure phase of grains. As a result, it can be resolved in the numerical simulations, and is not prone to disturbances from the air. Artificial dilution of the inflow is therefore closer to what happens physically than trying to impose a pure phase of grains throughout the jet.
Numerical simulation of a free-falling jet using the the partially regularized  $\mu (I)$-rheology in the absence of wall friction and interface-sharpening forces. (a) The volume fraction of granular material in the free-falling jet, and (b) the velocity magnitude. (c) The blue circles represent the computed width-averaged flow rate through the jet at each $z$ coordinate, while the red line represents the flow rate input by the boundary conditions, i.e. $Q = 0.0046\,{\rm kg}\,{\rm s}^{-1}$.

An immediate consequence of the artificial jet dilution is that the interface-sharpening method must be shut off in the free-falling jet to prevent the granular phase from separating out again. The phase separation terms in (5.2) and (5.3) are therefore multiplied by a factor
 \begin{equation} \varOmega= \left\{ \begin{array}{@{}ll@{}} 0, & \textrm{inside the jet region},\\[2pt] 1, & \textrm{outside the jet region}. \end{array}\right. \end{equation}
The boundaries of the jet region are chosen to be  $0.025$ m away from the edges of the inlet boundary in gravity-aligned coordinates. It is important that the heap never enters this region as it grows. The bottom boundary of this region, $H_b$, is therefore set to be
 \begin{equation} H_b = \max(0.02,H + 0.02), \end{equation}
where  $H$ is the highest point of the super-stable heap in gravity-aligned coordinates. Wall friction opposes the inflow of the jet and can also cause issues at low inflow rates. It is therefore also shut off in the jet region. The final system of conservation laws that are solved in OpenFOAM is therefore
 \begin{gather} \frac{\partial\varphi^g}{\partial t} + {\boldsymbol{\nabla}}\boldsymbol{\cdot}( \varphi^g {\boldsymbol{u}} ) + {\boldsymbol{\nabla}}\boldsymbol{\cdot}( \varOmega f_{ga}\varphi^g\varphi^a\,{\boldsymbol{e}})=0, \end{gather}
 \begin{gather} \frac{\partial\varphi^a}{\partial t} + {\boldsymbol{\nabla}}\boldsymbol{\cdot}( \varphi^a {\boldsymbol{u}} ) + {\boldsymbol{\nabla}}\boldsymbol{\cdot}(-\varOmega f_{ga}\varphi^a\varphi^g\,{\boldsymbol{e}})=0, \end{gather}
 \begin{gather} \frac{\partial}{\partial t}\left(\varrho {\boldsymbol{u}}\right) + {\boldsymbol{\nabla}}\boldsymbol{\cdot}\left( \varrho {\boldsymbol{u \otimes u}} \right) ={-}{\boldsymbol{\nabla}} p + {\boldsymbol{\nabla}} \boldsymbol{\cdot} (2\hat\eta{\boldsymbol{D}}) + \varrho {\boldsymbol{g}} - \frac{2\varOmega}{W}\,\varphi^g\mu_W p\,\frac{{\boldsymbol{u}}}{|{\boldsymbol{u}}|}. \end{gather}
The super-stable heap simulations are performed in experimental-box-aligned coordinates  $(\tilde x,\tilde z)$ defined in figure 4, which are inclined at $\theta = 29.2^\circ$ to the horizontal. At the base, a no-slip boundary condition is applied ( ${\boldsymbol {u}}={\boldsymbol {0}}$), and there is no flux of air or grains across it. As described above, at the inlet, the concentrations of the air and grains are prescribed, with an associated gravity-aligned velocity to produce the correct mass-inflow rate $Q$ into the domain. The left- and right-hand boundaries, as well as the remaining part of the top boundary, are open to allow material to exit the domain, and zero pressure boundary conditions are applied.
6. Simulating the growth and decay of super-stable heaps
Figures 12–14 show contour plots of the simulated flow speed  $|{\boldsymbol {u}}|$, pressure $p$ and base ten logarithm of the inertial number $I$ at a sequence of times for a mass-inflow rate $Q=0.0046\,{\rm kg}\,{\rm s}^{-1}$. Movies 3–5 in the supplementary material show the complete time-dependent evolution of these fields. Throughout the growth, steady-state behaviour and decay of a super-stable heap, the velocity magnitude is very low, except in a very narrow boundary that develops at the free surface of the pile (figure 12). The region where the partially regularized granular rheology is active occupies a considerably deeper layer, as can be seen in figure 14. It follows that throughout the simulation, the high-viscosity-capped region lies sufficiently deep within the pile that it does not affect the surface motion.
Contours of the simulated velocity magnitude  $|{\boldsymbol {u}}|$ for a mass-inflow rate $Q = 0.0046\,{\rm kg}\,{\rm s}^{-1}$ during (a) the growing phase and (b) the draining phase. The simulation times from (a i) to (a vi) are $t_{sim} = 7.2$, 12.4, 16.8, 30.8, 56, 150 s (steady), while for (b i) to (b vi), $t_{sim} = 151.2$, 155.2, 174.4, 202, 252, 297.6 s. Movie 3 of the supplementary material shows the full time-dependent evolution. The heap shapes are compared with the experimental free surfaces (magenta lines) when the granular areas are approximately equal. The areas are (a) $A = 0.02$, 0.045, 0.065, 0.11, 0.15, 0.175 m $^2$, and (b) $A = 0.175$, 0.16, 0.11, 0.08, 0.04, 0.01 m $^2$. The experimental data are taken at $t_{exp} = 6$, 12, 20, 43, 83, 321 s (steady) and $t_{exp} = 341$, 344, 346, 370, 398, 424 s.

Contours of the simulated pressure  $p$ for a mass-inflow rate $Q = 0.0046\,{\rm kg}\,{\rm s}^{-1}$ during (a) the growing phase and (b) the draining phase. The simulation times are the same as those in figure 12. Movie 4 of the supplementary material shows the full time-dependent evolution.

Contours of the base ten logarithm of the inertial number  $I$ for a mass-inflow rate $Q = 0.0046\,{\rm kg}\,{\rm s}^{-1}$ during (a) the growing phase and (b) the draining phase. The simulation times are the same as those in figure 12. Movie 5 of the supplementary material shows the full time-dependent evolution. The viscosity cap (5.10) is active below the white dashed line.

6.1. Detailed development of the numerical simulation
During the initial phase ( $t<18$ s), a pile develops rapidly beneath the falling jet, and the apex rises steadily as material flows down either side of it. More material flows down the longer right-hand face than the shorter left-hand face, and attains higher velocities. During these early times, both slopes have approximately the same gradient. On the right, there is a point near the base of the pile where there is a break in slope, which moves steadily downstream as the pile grows. To the right of this break in slope, the no-slip condition at the base results in the grains forming a steady uniform Bagnold-type flow down the plane. By approximately 18 s, this point reaches the outlet, and the pile enters into a new phase of motion ( $t=18\unicode{x2013}106$ s) in which the right-hand face of the pile progressively steepens, allowing the mass-inflow rate $Q$ to balance the mass-outflow rate.
For  $t=106\unicode{x2013}150$ s, the super-stable heap is essentially in a steady state, in which the slope angle $\zeta$ of the right-hand face is spontaneously selected as part of the fully coupled problem. There is a very thin steady uniform flow at the surface of the right-hand face, which transports virtually all of the incoming grains from the jet out of the domain. As a consequence of this, the right-hand face is inclined at a constant angle approximately $50^\circ$. This is very close to the observed value $49.35^\circ$. Beneath the rapid surface avalanche, the material is slowly creeping. The creep just under the free surface is due to the low inertial number creep state in the partially regularized $\mu (I)$-rheology (Barker & Gray Reference Barker and Gray2017). However, sufficiently deep within the pile, the viscosity cap (5.10) becomes active, and the creep is due to Newtonian viscosity. For $t=106\unicode{x2013}150$ s the left-hand side of the pile continues to evolve very slowly due to this combined creep, so a true steady state is never really achieved, although it will be referred to as such.
At  $t=150$ s, the inflowing jet shuts off. As a result, the steady uniform flow of grains on the right-hand face rapidly drains off and is replaced by a much slower flow that gradually erodes the super-stable heap. By $t=154$ s, a slope-parallel straight section has formed in place of the pile apex, and downstream of it there is a more steeply inclined linear section that connects to the outlet. Upstream of the slope-parallel section, the left-hand face is essentially stationary, although there is some very slow upstream creep. As time progresses, the slope-parallel section erodes downwards and grows in size, both upstream and downstream, while the gradient of the downstream inclined region slowly diminishes. By $t=290$ s, the downward erosion from the apex is sufficient for the left-hand base of the pile to begin to move downstream, and all the grains have drained from the chute by $320$ s.
During the entire development and collapse of the heap, the pressure in the free-surface layers is approximately lithostatic. Deeper down, there is some deviation from this. As a result, the maximum pressure during the growth of the heap is not directly under the apex, but very slightly to the left of it, as shown in figure 13. Note that the high-viscosity cutoff, (5.10), is active deep within the pile, as shown in figure 14. The pressure in this region is therefore that which would develop for a highly viscous incompressible fluid, and may not be representative of what would develop in a granular material. In particular, the sidewall friction is not able to support the grains in this region, so the pressure does not tend to a constant value, i.e. there is no Janssen effect (Janssen Reference Janssen1895; Sperl Reference Sperl2006). This does not matter for simulating the overall behaviour of a super-stable heap, because the velocities in the high-viscosity cutoff region are negligibly small, but for other problems this may prove to be more significant.
Figure 14 also shows that there is very strong variation in the inertial number through the free-surface layers, which contrasts strongly with Bagnold flow down an inclined plane, where  $I$ is constant (GDR MiDi 2004; Jop et al. Reference Jop, Forterre and Pouliquen2005; Gray & Edwards Reference Gray and Edwards2014). This variation in the inertial number combined with the fact that a steady uniform-depth free-surface avalanche develops along the right-hand face of the pile implies that super-stable heaps are an important rheometric flow, which can be exploited to determine the functional dependence of $\mu$ on $I$, as well as the wall friction $\mu _w$.
6.2. Quantitative comparison of the mass balance data and the evolving free surface
In order to make a quantitative comparison between the simulations and the experimental data, it is useful to consider the accumulated outflow mass, for a mass-inflow rate  $Q = 0.0046\,{\rm kg}\,{\rm s}^{-1}$. The inset in figure 15 shows that there is approximately a 1 s delay between opening the hopper and the particles landing on the balance. At early times $t < 30$ s, the experimental mass (on the balance) accumulates faster than in the simulations. This is because the simulations assume no slip along the base of the chute, whereas in reality there is some basal slip that allows the grains to flow out faster. The numerically simulated pile therefore grows faster, and reaches steady state slightly quicker, than the experiments. The difference in the shapes of experimental and computed piles, for the same volume of grains in the system, is shown in figure 12. Once the toe of the computed heap reaches the outflow, the pile steepens progressively and uniformly along the right-hand face, and is in close agreement with the experiments. The slow exponential decay towards a constant mass accumulation rate is consistent with the Taberlet et al. (Reference Taberlet, Richard, Henry and Delannay2004) DEM/DPM simulations (see their figure 2) and occurs on a much longer time scale than it takes a single surface particle to flow through the system.
Comparison between the experimental (red solid line) and computed (blue solid line) accumulated mass at the outlet as a function of time for a mass-inflow rate  $Q = 0.0046\,{\rm kg}\,{\rm s}^{-1}$. The experimental data are the same as in figure 5, while the numerical curve is computed from the simulations. Both systems start filling at $t = 0$ s and run until steady state is reached, during which the accumulated mass rises linearly in time. However, in the computations, the inflow is shut off at $t=150$ s, which is shorter than in the experiments that shut off at $t_{exp}=340.5$ s. To account for this, the computed steady-state regime has been extended (blue dashed line) so that the draining phase can be compared directly with the experimental data. Both systems therefore begin draining at $t = 340.5$ s. The inset shows a close-up of the early-time behaviour.

The experimental and numerical steady states are both closely approached by  $t_{exp}=106$ s, and their shapes are in very good agreement. In order to demonstrate that a stable steady state had been achieved, the experimental inflow was not shut off until $t_{exp}=340.5$ s. This is much longer than the numerical shut-off time $t_{sim}=150$ s, which was chosen to save computational expense. In order to compare the experimental and numerical mass balance time series, it was therefore necessary to correct for the different shut-off times. This was easy to do, because at steady state, the mass accumulates linearly in time at a known rate.
Figure 15 shows the experimental and numerical drainage of the chute for a common time  $t>340.5$ s. The experimental system drains faster than the numerical one. The reason for this is that the apex of the experimental pile collapses not into a slope-parallel straight region, but into one that is inclined at a slightly steeper angle to the numerically computed one (see figure 12 and movies 1 and 3 of the supplementary material). In the experiments, there is a slope break, to a steeper region that connects to the outflow, as predicted by the numerics. However, the increased experimental slope angles in these two sections allow the pile to erode, and material to flow out, faster. In particular, the gradient of the lower section remains close to that of the super-stable heap for longer, allowing a lot of grains to flow out just after the inflow is stopped (figure 15). Since the inclination angle $\theta =29.2$ of the base is greater than the angle of repose, all the grains flow out of both the experimental and computational systems.
Figure 15 shows that there is a slight difference between the experimental and computed total masses on the balance at the end of the experiment. This difference is due to the fact that at  $t=340.5$ s, when both inflows shut off, the experimental and numerical systems have slightly different pile volumes. Overall, the mass balance data show that there is good quantitative and qualitative agreement between the experiments and theory. However, the experimental system has a tendency for the pile to grow slightly more slowly and erode slightly faster.
6.3. Quantitative comparison of the steady-state flows
Numerical simulations have been performed for the three experimental mass-inflow rates investigated in § 2. A comparison of the simulated steady-state heap shapes with the experimental ones is shown in figure 16. The computations are in good qualitative agreement with the experiments, and show an increase in the super-stable heap size with increasing mass-inflow rate, and that the right-hand side of the pile has an approximately linear profile whose gradient also increases with the mass-inflow rate. The computed right-hand pile gradients are, however, all slightly steeper than in the experiments, which leads to a slight offset in the position of the apex of the pile.
Comparison of the steady-state heap shape for the experiment (solid heaps) and the numerical simulations for mass-inflow rates  $Q = 0.0020$ (yellow line), $0.0046$ (red line) and $0.0060\,{\rm kg}\,{\rm s}^{-1}$ (blue line). The experimental heaps are identical to those in figure 4.

Figure 17 shows a series of down-slope velocity profiles measured perpendicular to the pile free surface at a sequence of locations down the right-hand face. The velocity profiles almost exactly superimpose on top of each other, which implies that the flow is steady and uniform. The simulated velocity profiles can therefore be compared to both the measured profiles and the exact steady uniform flow solutions in § 4. Figure 18 shows that the computed velocity profiles are very close to the exact steady uniform solutions for all three cases, except right at the free surface, where the computed profile is blunter. This occurs because even though the interface tracking method is very sharp, the very top cells contain a mixture of excess air and grains, which moderates and slightly diffuses the velocity profile, as shown in the inset in figure 17(b). The moderation of the computed velocity in the top grid cells reduces the mass-inflow rate and causes the computed heap to over-steepen slightly to compensate. These issues could be improved by increasing the spatial resolution of the grid. The grid resolution of the results presented in this paper has, however, been optimized to achieve sufficiently good resolution of the free surface boundary layer, while not making the simulations excessively costly.
(a) Computed velocity magnitude  $|{\boldsymbol {u}}|$ measured perpendicular to the free surface and taken at a series of positions down the right-hand face of the pile. The colour of the profile corresponds to the position of the slice in (b). The inset in (b) is a close-up of the free-surface flowing layer; the colour map for the velocity magnitude is the same as that in figure 12. The opacity is used to show the transition between the excess air phase (white) and the region occupied by grains, which is at full saturation.

Comparison of the computed (coloured lines), measured (grey dashed) and exact (black dot-dashed) steady uniform velocity profiles through the flow depth for mass-inflow rates (a)  $Q = 0.0020$, (b) $0.0046$, (c) $0.0060\,{\rm kg}\,{\rm s}^{-1}$.

7. Conclusions
Super-stable granular heaps form when grains are poured onto a flat plane, or chute, that is confined by lateral sidewalls that lie close enough together to form a narrow gap. These sidewalls retard the flow by exerting friction, and the flow responds by super-inclining the free surface to compensate (Taberlet et al. Reference Taberlet, Richard, Valance, Losert, Pasini, Jenkins and Delannay2003, Reference Taberlet, Richard, Henry and Delannay2004, Reference Taberlet, Richard and Delannay2008). Super-stable heaps are of fundamental rheological significance, because in steady state, a uniform-depth flow develops along the free surface. Both the velocity and inertial number vary through the depth of this flow, which is also free to choose its inclination. Super-stable heaps therefore provide a sensitive test of rheological models. In particular, continuum models need to be able to correctly predict the super-inclination angle for different mass-inflow rates.
Despite their rheological importance, super-stable heaps have received very little attention. This is in part because DEM/DPM simulations of the formation of the whole pile are extremely computationally expensive (Taberlet et al. Reference Taberlet, Richard and Delannay2008), and continuum theories struggle to model the simultaneous existence of solid-like, liquid-like and gaseous granular regimes. The problem is further complicated by the fact that sidewall friction makes free-surface flows thinner and faster than they would otherwise be (Jop et al. Reference Jop, Forterre and Pouliquen2005), so adequately resolving the thin boundary layer that forms at the pile free surface is a challenge. The experiments performed in § 2 also show that long simulations are necessary to fully realize a steady state.
This paper focuses on the dense liquid-like and solid-like regimes, which can be reasonably well captured by the partially regularized incompressible  $\mu (I)$-rheology of Barker & Gray (Reference Barker and Gray2017). The granular jet, which delivers the inflowing grains to the top of the heap, cannot be captured with this rheology, but it is parametrized in a simple way by artificially diluting the inflow and using a segregation-based interface-sharpening technique to compact the material as it lands at the top of the pile (see § 5.4 and Barker et al. Reference Barker, Rauter, Maguire, Johnson and Gray2021; Maguire et al. Reference Maguire, Barker, Rauter, Johnson and Gray2024). To simplify the system further, the mass and momentum balances are averaged across the width of the cell in § 3.1. This reduces the spatial dimensions by one, while still allowing the sidewall friction to be accounted for through momentum source terms. It is also consistent with the Taberlet et al. (Reference Taberlet, Richard, Valance, Losert, Pasini, Jenkins and Delannay2003) experimental observation that the surface velocity has a blunt profile across the width of the cell.
The partially regularized  $\mu (I)$-rheology introduces a creep state at low inertial numbers, which, unlike the original form of the $\mu (I)$ function (1.3), keeps the theory mathematically well-posed at low inertial numbers (GDR MiDi 2004; Jop et al. Reference Jop, Forterre and Pouliquen2006; Barker et al. Reference Barker, Schaeffer, Bohorquez and Gray2015). At high inertial numbers, the partially regularized function has a linear dependence on $I$, which significantly extends the well-posed region of parameter space, but the theory can still become ill-posed if the inertial number is high enough. Indeed, the simulations of the super-stable heap, performed here, push the theory towards the limit of its applicability, which is perhaps one reason why it has not been attempted before.
One-dimensional exact solutions for the pressure  $p$, shear stress $\tau$ and friction $\mu =\tau /p$, as a function of depth $z$ through the steady uniform flow at the pile surface, are derived in § 4. Equation (4.8) shows that at the free surface ( $z=0$), the friction is equal to the tangent of the super-inclination angle $\zeta$, independent of the wall friction $\mu _W$. This already presents a problem for the classical $\mu (I)$-rheology, because if the maximum allowable friction $\mu _d$ is less than $\tan \zeta$, then there are no steady uniform solutions. The experiments in § 2 show that slope angles approach $50^\circ$, which is already higher than typical values of $\zeta _d=\arctan (\mu _d)\simeq 29^\circ$ in table 1, or, for that matter, $\zeta _d\simeq 42^\circ$ in table 2. This is a simple but significant result, because it provides strong evidence that the classical $\mu (I)$ curve (1.3) does not have the correct functional behaviour in the high inertial number limit (see Appendix A). Indeed, the original authors of the GDR MiDi (2004) project knew that the $\mu (I)$ curve was valid only over a limited interval of inertial numbers ( $I<1$), but the reciprocal law (1.3), which asymptotes to $\mu _d$ at high inertial numbers, has since become de rigueur.
The linear dependence on  $I$ of (3.19) at high inertial numbers implies that it is always possible to invert (4.8) at the free surface. The partially regularized $\mu (I)$-rheology is therefore valid in a surface layer $z\in [z_{st},0]$, where $z_{st}$ is the height at which the friction reaches its minimum value $\mu =\mu (0)$ at $I=0$. Below this level, the material is assumed to be below yield. If $h$ is defined to be $-z_{st}$, then the equation for the depth of the yield point (4.10) essentially recovers the Taberlet et al. (Reference Taberlet, Richard, Valance, Losert, Pasini, Jenkins and Delannay2003) force balance equation (1.1), where $\mu _i$ must be interpreted as $\mu (0)=\mu _s$, and the thickness $h$ is the depth of the surface layer of particles that are clearly in motion over a short observational time scale. When adopting the partially regularized $\mu (I)$-rheology, however, the material creeps deep down in the pile, which is perhaps more physically realistic (Komatsu et al. Reference Komatsu, Inagaki, Nakagawa and Nasuno2001). This makes the flow depth $h$ apparently far deeper for the partially regularized theory than for the classical $\mu (I)$-rheology. However, for much of this extended depth, there is very little motion, as shown in figure 9. The Taberlet et al. (Reference Taberlet, Richard, Valance, Losert, Pasini, Jenkins and Delannay2003) force balance (1.1) is therefore open to considerable interpretation, dependent on how the flowing layer depth $h$ and the friction $\mu _i$ are defined.
Provided that (4.8) can be inverted, the definition of the inertial number (3.15) can then be used to formulate an ODE for the velocity profile in the surface layer (4.12). This can then be solved numerically (figure 9a), and the velocity profiles can be integrated through the depth to determine the super-inclination angle  $\zeta$ as a function of the mass-inflow rate $Q$ (figure 9b). These quantities provide strong constraints on the system. The experimental measurements in § 2 were used to determine a set of best-fit parameters for the partially regularized $\mu (I)$ function (3.19), which are summarized in table 2. These parameters, which include a value for the wall friction $\mu _w$, are able to provide reasonable fits to the velocity profiles for all three mass-inflow rates, as shown in figure 10, while also ensuring that the theory remains well-posed. Critically, the measured super-inclination angles as a function of mass-inflow rate are all in close agreement with the theoretically predicted curve using the partially regularized $\mu (I)$-rheology (figure 9b). In contrast, it is possible to construct only a single solution, for the lowest mass flux case, using the classical $\mu (I)$ curve (1.3).
The experimental and numerical slope angle and velocity profile comparisons in figures 9(b) and 10(a) are good, but not perfect, which is probably an indication that compressibility needs to be taken into account in the flowing layer. Taberlet et al. (Reference Taberlet, Richard and Delannay2008) used DEM/DPM simulations to show that there was a steady decrease in the solids volume fraction as the free surface was approached. This would reduce the pressure in the surface layers and moderate the sidewall friction, potentially allowing better fitting of the velocity profiles. Solids volume fraction variations can be incorporated by using the compressible  $I$-dependent rheologies (Barker et al. Reference Barker, Schaeffer, Shearer and Gray2017; Schaeffer et al. Reference Schaeffer, Barker, Tsuji, Gremaud, Shearer and Gray2019), but this is not done here, because it introduces considerable additional complexity and requires new numerical methods to be developed. It is also of interest to see how closely an incompressible theory can simulate a super-stable heap, given that significant volume fraction changes are confined to a very thin layer at the surface of the pile.
Having determined suitable parameters to model the steady-state behaviour, numerical solutions of the growth and decay of a super-stable heap were performed in § 6 using the numerical method described in § 5. The results are shown in figures 12–15 and movies 3–5 of the supplementary material for a mass-inflow rate  $Q = 0.0046\,{\rm kg}\,{\rm s}^{-1}$. The simulations have the correct qualitative behaviour, with the inflowing material forming a pile that grows in time. The right-hand pile face, adjacent to the outflow, gradually steepens over time, until it allows all the inflowing grains to flow out of the domain. When this happens, a steady state is achieved in which the right-hand face has a constant slope and a steady uniform depth flow at its surface. Once the inflow stops, the pile slowly collapses, and all the material flows out of the domain, because (in this case) the chute is higher than the angle of repose. During the entire evolution of the pile, the free-surface flowing layer is very thin, and is barely visible in figure 12. Figure 12 also shows a comparison between the computed and experimental pile shapes. These are broadly in very good quantitative agreement with one another, although the numerically simulated pile grows slightly faster and drains slightly slower than the experimental one, as shown in figure 15. By way of contrast, figure 19 shows what happens in an identical simulation, but in the absence of wall friction ( $\mu _w=0$). In this case, a heap does not form, although there is a small static region just up-slope of the jet impact point, and a steady uniform Bagnold flow (Appendix B) develops rapidly along the incline, which transports all the inflowing grains off the chute. This shows that as Taberlet et al. (Reference Taberlet, Richard, Valance, Losert, Pasini, Jenkins and Delannay2003) surmised originally, sidewall friction is critical to the formation, steady-state behaviour and decay of super-stable granular heaps.
Numerical simulation of the system with inflow rate  $Q = 0.0046\,{\rm kg}\,{\rm s}^{-1}$ and no sidewall friction; all other parameters of the system remain the same as in table 2. The close-up shows that the material develops a steady uniform Bagnold velocity profile (B2), sufficiently far down the inclined section of the chute.

The numerical method was also used to simulate the formation of the pile at different mass fluxes, and the results are compared with the experiments in figures 16 and 18. Qualitatively, these show that increasing the mass-inflow rate steepens the super-inclination angle of the pile, that the maximum velocity in the free-surface flow is increased, and that the steady uniform flow depth deepens. The quantitative agreement is also good, but, as mentioned previously, there is potential for improvement if compressibility were included in the model.
The simulations in § 6 demonstrate that it is possible to quantitatively model the entire development and collapse of a super-stable heap with the partially regularized incompressible  $\mu (I)$-rheology. However, the theory is close to the bounds of its applicability, since the inertial number reaches values that are close to the threshold for ill-posedness at the free surface (figure 10b). Higher mass-inflow rates may therefore push the theory over this threshold, allowing grid-resolution-dependent instabilities to develop near the top of the free surface (Barker et al. Reference Barker, Schaeffer, Bohorquez and Gray2015; Barker & Gray Reference Barker and Gray2017). In future, it may therefore be necessary to introduce compressibility (Heyman et al. Reference Heyman, Delannay, Tabuteau and Valance2017; Barker et al. Reference Barker, Schaeffer, Shearer and Gray2017; Goddard & Lee Reference Goddard and Lee2018; Schaeffer et al. Reference Schaeffer, Barker, Tsuji, Gremaud, Shearer and Gray2019) or non-local behaviour (Bouzid et al. Reference Bouzid, Trulsson, Claudin, Clément and Andreotti2013; Henann & Kamrin Reference Henann and Kamrin2013; Goddard & Lee Reference Goddard and Lee2017) to keep the theory well-posed.
In conclusion, the steady uniform flow that develops along the surface of a super-stable heap is a very important rheological flow that has largely been overlooked. Conventionally, chute flow experiments have been used to determine the  $\mu (I)$ curve (Pouliquen Reference Pouliquen1999a,Reference Pouliquenb; Pouliquen & Forterre Reference Pouliquen and Forterre2002), as reprised in Appendix A. Since the inertial number is constant through the depth of these flows, a large number of experiments must be performed to determine the frictional dependence on the inertial number. The flows are also relatively slow, and the value of $\mu _d$ in the classical $\mu (I)$ law (1.3) is poorly constrained. The super-stable heap, on the other hand, requires only a modest amount of material, and a great deal of constitutive information can be extracted from a single experiment. This is because the inertial number varies from zero, deep enough into the pile, to $\mu ^{-1}(\tan \zeta )$ at the surface of the steady super-inclined heap. High super-inclination angles $\zeta$, and hence high inertial numbers, are easy to access by increasing the mass-inflow rate. Measurements of the velocity, and potentially density, profiles perpendicular to the inclined free surface allow the functional dependence of both the friction and solids volume fraction as a function of the inertial number to be determined. The slope super-inclination angle dependence on the mass flux also provides a strong constraint on rheological models. Indeed, it is shown here, in §§ 4.1 and 4.2, that the classical $\mu (I)$ curve, which has maximum value $\mu =\mu _d$ at high inertial numbers, fails to generate a steady uniform state for typical values of $\mu _d$ used in the literature.
Supplementary material
Supplementary movies are available at https://doi.org/10.1017/jfm.2024.1106.
Funding
J.M.N.T.G. was supported by a Royal Society Wolfson Research Merit Award (WM150058) and an EPSRC Established Career Fellowship (EP/M022447/1). Additional support was provided by NERC grants NE/X00029X/1 and NE/X013936/1.
Declaration of interests
The authors report no conflict of interest.
Data availability statement
All research data supporting this publication are directly available within this publication.
Appendix A. Origin of the classical $\mu (I)$ function

The classical form of the  $\mu (I)$ law (1.3) emerged from the papers of Pouliquen (Reference Pouliquen1999a,Reference Pouliquenb), Pouliquen & Forterre (Reference Pouliquen and Forterre2002) and Jop et al. (Reference Jop, Forterre and Pouliquen2005, Reference Jop, Forterre and Pouliquen2006). In order to understand some of the issues in fitting the friction law, it is useful to recall how it was developed. When a constant flux of grains is released from a hopper onto a rough inclined plane, a front propagates down-slope with constant speed $u_F$, and builds up a steady uniform flow behind it, with thickness $h$ and depth-averaged velocity $\bar u=u_F$. Pouliquen (Reference Pouliquen1999a) measured the front speed $u_F$ and flow depth $h$ at different slope inclination angles $\zeta$, and with different sized glass beads, and found that all the data collapsed onto the straight line
 \begin{equation} Fr=\beta\,\frac{h}{h_{stop}}, \end{equation}
where  $Fr=|\bar u|/\sqrt {gh\cos \zeta }$ is the Froude number, $h_{stop}$ is the deposit thickness after the flow had ceased, and $\beta$ is a constant of proportionality. Pouliquen & Forterre (Reference Pouliquen and Forterre2002) measured $h_{stop}$ as a function of slope angle $\zeta$, and fitted the data with a rational function
 \begin{equation} \tan\zeta=\mu_s+\frac{\mu_d-\mu_s}{h_{stop}/\mathscr{L}+1}, \end{equation}
where  $\mu _s=\tan \zeta _s$, $\mu _d=\tan \zeta _d$, and the length scale $\mathscr {L}$ is proportional to the grain size. In steady uniform flow, the down-slope and normal components of the momentum balance imply that the friction is $\mu =\tan \zeta$ through the depth of the flow. Pouliquen & Forterre (Reference Pouliquen and Forterre2002) therefore determined a depth-averaged friction law
 \begin{equation} \mu(Fr/h)=\mu_s+\frac{\mu_d-\mu_s}{\displaystyle\dfrac{\beta h}{\mathscr{L}\,Fr}+1} \end{equation}
by using (A1) to substitute for  $h_{stop}$ in (A2). The depth-averaged friction law (A3) was then converted into the classical $\mu (I)$ function by observing that since $\mu =\tan \zeta$, and $\mu =\mu (I)$, the inertial number $I$ is also constant through the flow depth. Since the pressure (4.6) is lithostatic, the definition of the inertial number (3.15) reduces to an ODE (B1), which can be solved to determine the Bagnold velocity (B2). Following Jop et al. (Reference Jop, Forterre and Pouliquen2005) and Gray & Edwards (Reference Gray and Edwards2014), the depth-averaged Bagnold velocity then determines an explicit relation between $Fr/h$ and the inertial number given by
 \begin{equation} \frac{Fr}{h}=\left(\frac{2\sqrt{\phi}}{5d}\right) I, \end{equation}
which can be substituted into (A3) to obtain (1.3), i.e.
 \begin{equation} \mu(I)=\mu_s+\frac{\mu_d-\mu_s}{I_0/I+1}, \end{equation}
where the constant
 \begin{equation} I_0=\frac{5\beta}{2\sqrt{\varPhi}}\,\frac{d}{\mathscr{L}}. \end{equation}
Note that the classical  $\mu (I)$ curve (A5) inherits its reciprocal dependence on the inertial number from the fit to the $h_{stop}$ curve (A3). In this fit, the value of $\mu _s$ corresponds to the tangent of the angle at which the deposit depth tends to infinity, while the value of $\mu _d$ is set by the lowest angle at which no deposit is left on the chute. Although the $h_{stop}$ phenomenology is routinely used to fit the $\mu (I)$ parameters, it is an odd concept, because $h_{stop}$ itself does not emerge as a solution of the theory. It is reasonable that the value of $\mu _s$ may be closely linked to the deposit depth, because $\mu \rightarrow \mu _s$ as $I\rightarrow 0$ in (1.3). However, the evidence for the friction in thick, highly sheared flows asymptoting to $\mu _d$ as $I\rightarrow \infty$ is far less strong.
Appendix B. Validation of the numerical method using periodic box simulations
In this appendix, the numerical solver developed in § 5 is tested against the steady uniform flow solution derived in § 4. The two-dimensional numerical domain ( $0.21\times 0.0022$ m) is assumed to be inclined at an angle $\zeta$ to the horizontal, so that the gravitational acceleration vector is ${\boldsymbol {g}} = (9.81\sin \zeta, 0,-9.81\cos \zeta )$. Initially, the granular material is at rest and occupies a $0.2$ m deep layer, with a $0.01$ m thick layer of excess air above it. A no-slip condition is applied at the base of the flow, and the left- and right-hand boundaries are assumed to be periodic. The top boundary allows free outflow. Once the system is released, the grains accelerate down-slope, and a steady-state solution develops rapidly. Figure 20 shows a comparison between the computed down-slope velocity profiles for a series of inclination angles. All of the profiles are in good agreement with the exact solution, computed by solving the ODE (4.12). Larger inclination angles produce deeper, faster flows. Figure 21 shows the effect of keeping the inclination angle constant, and changing the gap width. Again, the numerical solutions are all in good agreement with the exact solutions, and show that as the gap is increased progressively, the effect of the sidewall friction diminishes, and the profile tends towards the Bagnold profile (Silbert et al. Reference Silbert, Ertaş, Grest, Halsey, Levine and Plimpton2001; GDR MiDi 2004; Jop et al. Reference Jop, Forterre and Pouliquen2006; Gray & Edwards Reference Gray and Edwards2014). This occurs when $W\rightarrow \infty$, or $\mu _w=0$, and the ODE (4.12) reduces to
 \begin{equation} \dfrac{{\rm d}u}{{\rm d}z} = \dfrac{\mathcal{I}(\tan\zeta)}{d} \sqrt{-\varPhi g z \cos\zeta}. \end{equation}
This can be integrated, subject to no slip at the base ( $z = z_b$), to give the explicit solution
 \begin{equation} u = \dfrac{2\mathcal{I}(\tan\zeta)}{3d}\sqrt{\varPhi g \cos\zeta} \left[({-}z_{b})^{3/2}- ({-}z)^{3/2}\right], \end{equation}
where, recall,  $I=\mathcal {I}(\tan \zeta )$ is the inverse function of $\tan \zeta =\mu (I)$. This is equivalent to the solution given in (3.21) of Gray & Edwards (Reference Gray and Edwards2014), once the non-dimensionalization and the shift in the coordinate origin are accounted for. Note that the small periodic length of the domain (just four grid cells wide) suppresses the formation of roll waves, which develop when the Froude number exceeds approximately two-thirds (Forterre & Pouliquen Reference Forterre and Pouliquen2003; Forterre Reference Forterre2006; Gray & Edwards Reference Gray and Edwards2014; Edwards & Gray Reference Edwards and Gray2015; Barker & Gray Reference Barker and Gray2017).
Down-slope velocity profiles  $u$ as a function of $z$, calculated from two-dimensional periodic box simulations (circles) and by solving (4.12) for the profile in a steady uniform flow. The light to dark blue curves correspond to angles $\zeta = 41^\circ$, 47 $^\circ$, 51 $^\circ$, 54 $^\circ$, 57 $^\circ$ and 59 $^\circ$, which generate volume flow rates $Q = 0.1051$, 0.5007, 1.2047, 2.2171, 3.9787 and $5.8308\,{\rm m}^2\,{\rm s}^{-1}$. The gap width is assumed to be $W = 0.04$, the wall friction coefficient $\mu _w = 0.277$, and the rest of the rheological parameters are summarized in table 1.

Down-slope velocity profiles  $u$ as a function of $z$, calculated from two-dimensional periodic box simulations (circles) and by solving (4.12) for the profile in a steady uniform flow at $\zeta = 28^\circ$. The light to dark blue curves correspond to gaps $W = 0.18$, 0.45, 1, 3 and 500 m. The red dashed line represents the Bagnold profile (B2). All remaining parameters are as defined in table 1.


 Open access