

Suboptimal riboflavin status occurs in children, elderly and women worldwide, particularly in regions with low intakes of dairy products and meat( Reference Powers 1 – Reference Neumann, Bwibo and Murphy 6 ). Riboflavin is an essential precursor for the biosynthesis of FMN and FAD. A number of flavin-dependent proteins that utilise FMN or/and FAD, so-called flavoproteins, participate in a range of redox reactions in, among others, the tricarboxylic acid (TCA) cycle, fatty acid β-oxidation, amino acid degradation and the electron transport chain (ETC)( Reference Powers 1 , Reference Lienhart, Gudipati and Macheroux 7 ). Owing to its involvement in primary metabolic pathways, riboflavin deficiency (RD) causes impaired growth, glossitis, anaemia and dermatitis in humans( Reference Venkataswamy 8 – Reference Lane and Alfrey 10 ). Also in animal studies, RD depresses growth and even results in death of rats( Reference Kim and Lambooy 11 – Reference Veitch, Draye and Vamecq 15 ), fish( Reference Deng and Wilson 16 ) and ducks( Reference Tang, Xie and Yang 17 – Reference Tang, Hu and Wen 19 ). Disturbed lipid handling was shown to be a major consequence of RD in both humans and animals. Riboflavin intakes are inversely associated with trunk fat mass and total body fat mass in children( Reference Gunanti, Marks and Al-Mamun 20 ). In addition, RD was shown to provoke fatty livers in cats( Reference Gershoff, Andrus and Hegsted 21 ) and rats( Reference Taniguchi and Nakamura 22 ) and to alter the liver fatty acid composition of rats( Reference Olpin and Bates 12 , Reference Taniguchi and Nakamura 22 , Reference Taniguchi, Yamamoto and Nakamura 23 ). Several studies in rodents have shown that RD impairs hepatic mitochondrial β-oxidation of fatty acids by reducing the activities of the fatty acyl-CoA dehydrogenases( Reference Olpin and Bates 12 , Reference Veitch, Draye and Vamecq 15 , Reference Hoppel, DiMarco and Tandler 24 – Reference Brijlal, Lakshmi and Bamji 27 ), which are flavin-dependent enzymes catalysing the rate-limiting, initial step of β-oxidation( Reference Ghisla and Thorpe 28 ).
While it is clear that RD affects growth and lipid metabolism, an experimental overview of underlying processes has not been presented and the extent of changes induced by RD have not been investigated at the protein level – the functional relevant integration level. Here, we used a proteomic approach in starter Pekin ducks, a well-established model of RD, to investigate the effects of RD on hepatic protein levels in relation to changes in hepatic lipid profile.
Methods
Animals and housing
All procedures were approved by Animal Welfare Committee of Institute of Animal Sciences, Chinese Academy of Agricultural Sciences. A total of 360 1-d-old male white Pekin ducks (Anas platyrhynchos) were obtained from the Pekin duck breeding center (Chinese Academy of Agricultural Sciences) and randomly assigned to thirty-six raised plastic-floor pens with ten birds per pen. All ducks were divided into three experimental groups, each containing twelve replicates with ten birds per replicate. The ducks were either ad libitum fed with a control diet (CAL) or an RD diet, or pair-fed with a control diet based on the mean intake of the RD group (CPF). All ducks were fed their respective diets and had free access to water from the day of hatching to 21 d of age. During this period, the light was continuously on. The temperature was kept at 33°C from 1 to 3 d of age, after which it was gradually reduced to approximately 25°C until 14 d of age and kept at approximately 16–22°C for the remainder of the experiment.
Diet
The basal diet during the experimental period was riboflavin-deficient containing 1·38 mg of free riboflavin/kg of diet (online Supplementary Table S1). The RD diet and CAL were produced from the basal diet, and were supplemented with, respectively, 0 and 10 mg of crystalline riboflavin/kg diet (purity, 99 %; Sigma-Aldrich). The riboflavin concentration for the CAL met the recommendations for starter ducks provided by the National Research Council( 29 ).
Sampling
To pair-feed the CPF group with a CAL, daily feed intake of the RD ducks was recorded to determine the mean intake. At 21 d of age, body weight and feed intake of each pen were measured. One duck from each pen was randomly selected and bled by cardiac puncture. Blood was collected into heparin-Na-containing tubes, and centrifuged at 1520 g for 10 min to obtain plasma, which was then stored at −20°C until further analysis. Afterwards, these ducks were killed by CO2 inhalation and livers were dissected, weighed, snap-frozen in liquid N2 and stored at −80°C until further analysis.
Riboflavin, FMN and FAD content
The free riboflavin content in feed, plasma and liver and the FMN and FAD content in liver were determined by reversed-phase HPLC according to methods described previously( Reference Tang, Xie and Yang 17 , Reference Tang, Wen and Guo 18 ). Feed, liver and plasma samples were prepared before HPLC analysis according to the method described previously( Reference Britton, Riter and Smallidge 30 – Reference Petteys and Frank 32 ). Peaks were identified and quantified using pure authentic standards of riboflavin, FMN and FAD (Sigma-Aldrich).
Plasma parameters
Plasma parameters, including glucose, lactate, uric acid, pyruvate, albumin, alanine transaminase (ALT), aspartate transaminase (AST), TAG and total cholesterol (TC), were determined using commercial kits according to the manufacturer’s instructions (Biosino Bio-Technology and Science Inc.).
Liver lipids
Total lipids were extracted by homogenising minced liver tissue samples in chloroform–methanol (2:1) according to( Reference Folch, Lees and Sloane Stanley 33 ). The extracts were evaporated under a stream of nitrogen, weighed and resuspended in chloroform–methanol (2:1) containing 0·01 % butyrated hydroxytoluene. Measurements of total lipids in liver were performed as described( Reference Wen, Tang and Hou 34 ). Aliquots were dried and resuspended in 1-butanol for analysis of TAG and TC using commercial kits according to the manufacturer’s instructions (Biosino Bio-Technology and Science Inc.). Fatty acid methyl esters were prepared by acid-catalysed transmethylation of total lipids using boron trifluoride methanol according to the method described previously( Reference Shantha and Ackman 35 ). Fatty acid composition of liver was analysed in a gas chromatograph (Agilent 6890; Agilent Technologies) as described previously( Reference Yin, Shang and Li 36 ). Peaks were identified by comparing retention times with those of the corresponding standards (Sigma-Aldrich).
Liver proteomics
To reduce the influence of individual variation, twelve individual liver samples per group were used to conduct the isobaric tags for relative and absolute quantification (iTRAQ) assays. A pooled sample in each group was created from an equal amount of protein from each of twelve samples. Proteins were extracted and digested as described( Reference Wang, Zheng and Xie 37 ). Each digested sample was labelled with iTRAQ 8-plex reagents (AB Sciex) as follows, according to the manufacturer’s instructions: tag 117 for RD, tag 118 for CAL and tag 119 for CPF. Labelled samples were mixed and fractionated into twenty fractions by HPLC (Ultimate 3000 BioRS; Dionex-Thermo Fisher Scientific Inc.) using a Durashell C18 (5 µm, 100 Å, 4·6×250 mm) column. Liquid chromatography-electrospray ionisation–MS/MS analysis was carried out with a Triple TOF 5600 plus system (AB Sciex). The original MS/MS file data for identification and quantification were analysed against the database Uniprot_Neognathae_8825 using ProteinPilot Software version 4.0 (AB Sciex). Only unique peptides whose confidence intervals are more than 95 % were contained in the iTRAQ labelling quantification and used for further analysis.
For analysis of the proteomic results, the relative expressions of identified proteins were based on the ratio of the reporter ions of the peptides between two of three groups (i.e. RD v. CPF, RD v. CAL, CPF v. CAL). Fold changes (FC) were used to determine whether identified proteins were enhanced (FC>1·5) or diminished (FC<−1·5) by RD.
To enrich the differentially expressed proteins with respect to specific functional terms, the protein lists were analysed using the ClueGo software (http://www.ici.upmc.fr/cluego/) with the Gene Ontology database (release date: March 2016). The ontology selection on the base of biological processes and enrichment analysis was performed by the right-side hyper-geometric statistic test and its probability value was corrected by the Bonferroni method( Reference Bindea, Mlecnik and Hackl 38 ).
A pathway enrichment analysis of the differentially expressed proteins( Reference Ashburner, Ball and Blake 39 ) was performed using ClueGo software and applying database from the Kyoto Encyclopedia of Genes and Genomes (KEGG) database (release date: February 2016).
Western blot analyses
Western blot analysis of the liver samples of ducks was conducted as described( Reference Zhu, Lu and Li 40 ). Primary antibodies (1 µg/ml) against short-chain specific acyl-CoA dehydrogenase (ACADS) (ab154823), medium-chain specific acyl-CoA dehydrogenase (ACADM) (ab92461) and acyl-CoA dehydrogenase family member 9 (ACAD9) (ab113917) were obtained from Abcam. Blots were stripped and re-probed with antibodies against β-actin (ACTB; HX1831; Huaxing-Bio) to demonstrate equal sample loading.
Statistical analyses
One-way ANOVA analysis followed by Tukey’s multiple comparison was performed using SAS software (2003; SAS Institute). Data were expressed as mean values with their standard errors. A probability level of P<0·05 was considered to be statistically significant.
Results
Mortality and growth performance
The mortality of ducks was greater in RD than in CAL and CPF (P<0·001; online Supplementary Table S2). Growth performance of the ducks at 21 d of age was assessed by average daily weight gain (ADG), average daily feed intake (ADFI) and gain to feed ratio (G:F) (online Supplementary Table S2). ADG and ADFI declined in RD and CPF in comparison with CAL (P<0·001). ADG was lower in RD than in CPF (P<0·001), even though the ADFI was equal in these two groups. G:F was lower in RD than in CAL and CPF (P<0·001). The relative liver weight was elevated in the RD group compared with CAL and CPF (P<0·001).
Riboflavin status
Plasma riboflavin concentration decreased by 88 % as a result of RD (P<0·001; online Supplementary Fig. S1(A)). Liver riboflavin and FMN concentrations were reduced in RD compared with CAL and CPF (P<0·001; online Supplementary Fig. S1(B)). Liver FAD concentration was decreased in both RD and CPF when compared with CAL (P=0·008; online Supplementary Fig. S1(B)).
Plasma parameters
Plasma glucose and lactate did not differ among RD, CPF and CAL. Plasma uric acid, pyruvate, albumin, TAG and TC levels were elevated in RD compared with CPF and CAL (P<0·05; Table 1). Plasma enzyme activities of ALT and AST were greater in RD than in CPF and CAL (P<0·001; Table 1).
Plasma parameters on day 21 of ducks in the riboflavin-deficient (RD), pair-fed with the control diet to the mean daily intake of the RD group (CPF) and ad libitum control (CAL) groups (n 12)Footnote *
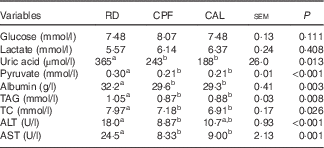
TC, total cholesterol; ALT, alanine transaminase; AST, aspartate transaminase.
a,b Mean values with unlike superscript letters were significantly different (P<0·05).
* Data were analysed by one-way ANOVA followed by Tukey’s multiple comparison.
Liver total lipids, TAG, total cholesterol and fatty acid composition
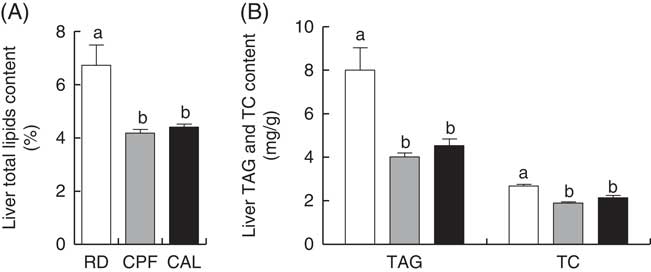
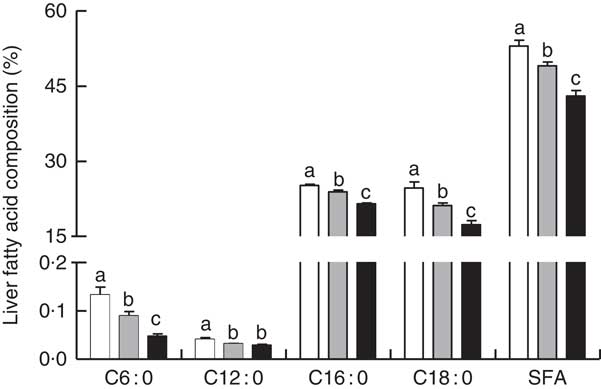
Liver total lipids, TAG and TC content were elevated in RD when compared with CPF and CAL (P<0·05; Fig. 1(A) and (B)). Hepatic SFA C6 : 0, C12 : 0, C16 : 0 and C18 : 0 were enhanced in RD compared with CPF and CAL (P<0·05; Fig. 2). Total SFA content in liver was greater in RD than in CPF and CAL (P<0·001; Fig. 2). Complete liver fatty acid compositions are shown in the online Supplementary Table S3.
Liver total lipid content (A), TAG and total cholesterol (TC) content (B) on day 21 of ducks in the riboflavin-deficient (RD, ![]() ), pair-fed with the control diet to the mean daily intake of the RD group (CPF,
), pair-fed with the control diet to the mean daily intake of the RD group (CPF, ![]() ) and ad libitum control (CAL,
) and ad libitum control (CAL, ![]() ) groups, respectively. Values are means (n 12), with their standard errors represented by vertical bars. a,b Mean values with unlike letters were significantly different (P<0·05). Data were analysed by one-way ANOVA followed by Tukey’s multiple comparison.
) groups, respectively. Values are means (n 12), with their standard errors represented by vertical bars. a,b Mean values with unlike letters were significantly different (P<0·05). Data were analysed by one-way ANOVA followed by Tukey’s multiple comparison.
Liver fatty acid composition (% of the total fatty acid) on day 21 of ducks in the riboflavin-deficient (RD, ![]() ), pair-fed with the control diet to the mean daily intake of the RD group (CPF,
), pair-fed with the control diet to the mean daily intake of the RD group (CPF, ![]() ) and ad libitum control (CAL,
) and ad libitum control (CAL, ![]() ) groups. Values are means (n 12), with their standard errors represented by vertical bars. a,b,c Mean values with unlike letters were significantly different (P<0·05). Data were analysed by one-way ANOVA followed by Tukey’s multiple comparison.
) groups. Values are means (n 12), with their standard errors represented by vertical bars. a,b,c Mean values with unlike letters were significantly different (P<0·05). Data were analysed by one-way ANOVA followed by Tukey’s multiple comparison.
Changes in the liver proteomics of duck from the three groups
A total of 31 851 peptide spectral matches were found, from which 1749 proteins were identified. Among the identified proteins, a total of sixty-three proteins showed an FC>1·5 when comparing RD with CAL and CPF, of which thirty-two were enhanced and thirty-one were diminished. The complete list of proteins regulated by RD is present in the online Supplementary Table S4. Of these, seven flavoproteins were regulated by RD, six diminished (ACADS, ACAD9, ACADM, hydroxyacid oxidase 2, dihydrolipoyl dehydrogenase (DLD) and electron transfer flavoprotein-ubiquinone oxidoreductase (ETFDH)) and one enhanced (xanthine dehydrogenase/oxidase).
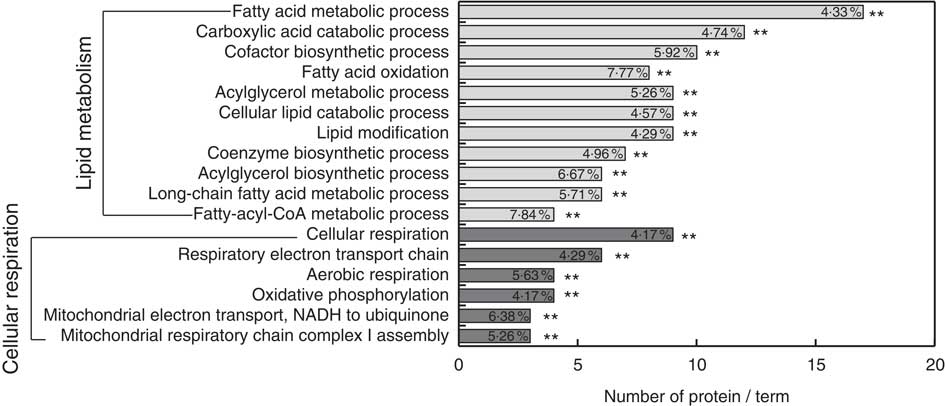
Gene ontology enrichment analysis was performed for functional analysis of the sixty-three differentially expressed proteins using ClueGo software. The results showed that two major functional groups were enriched: lipid metabolism and cellular respiration (Fig. 3 and online Supplementary Table S5), and twenty-nine noteworthy proteins were involved in these processes (Table 2). The highest proportion of regulated proteins were those related to lipid metabolism, eight being diminished and fourteen enhanced. Fatty acid β-oxidation was mainly enriched in the diminished proteins (ACADS, ACADM, ACAD9, ETFDH), whereas the enhanced proteins were mainly enriched in TAG metabolic process (acyl-CoA thioesterase 1 (ACOT1), acyl-CoA synthetase family member 2 (ACSF2), long-chain-fatty-acid–CoA ligase 1 (ACSL1), long-chain-fatty-acid–CoA ligase 5 (ACSL5), complement component 3 (C3), solute carrier family 27, member 5 (SLC27A5), apo B-100 (APOB), microsomal TAG transfer protein (MTTP)) and cholesterol metabolic process (hydroxymethylglutaryl-CoA synthase (HMGCS1), acetyl-CoA acetyltransferase (ACAT2) and non-specific lipid-transfer protein (SCP2)).
Functional enrichment analysis of the differentially abundance proteins in liver regulated by riboflavin deficiency using ClueGO software. ** Significant enrichment at the P<0·01 statistical level.
Differentially expressed proteins in liver involved in lipid metabolism and cellular respiration on day 21 of ducks caused by riboflavin deficiency (RD)
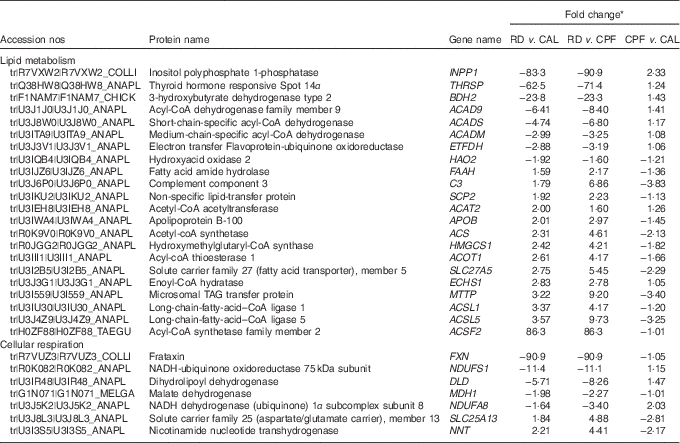
CPF, pair-fed with the CAL to the mean daily intake of the RD group; CAL, ad libitum control diet.
* Fold change is expressed as the ratio between two of three groups. For diminished proteins, the fold change was transformed to the corresponding negative value.
Of the proteins in the enriched cellular respiration category, six proteins were diminished, two involved in TCA cycle (DLD and malate dehydrogenase (MDH1)) and four involved in ETC (ACAD9, NADH-ubiquinone oxidoreductase 75 kDa subunit (NDUFS1), NADH dehydrogenase (ubiquinone) 1α subcomplex subunit 8 (NDUFA8) and frataxin (FXN)). One protein in this category was enhanced (solute carrier family 25 (aspartate/glutamate carrier), member 13).
A KEGG pathway enrichment analysis was performed on the sixty-three differentially expressed proteins. The top ten pathways including the number of proteins affected are listed in Table 3: valine, leucine and isoleucine degradation, propanoate metabolism, pyruvate metabolism, fatty acid degradation, butanoate metabolism, PPAR signalling pathway, synthesis and degradation of ketone bodies, glyoxylate and dicarboxylate metabolism, β-alanine metabolism and glycolysis/gluconeogenesis.
Enriched Kyoto Encyclopedia of Genes and Genomes-pathway-based sets of differential levels of proteins in the liver of starter Pekin ducks in response to riboflavin deficiencyFootnote *
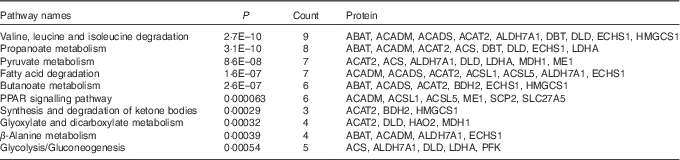
ABAT, 4-aminobutyrate aminotransferase; ACADM, medium-chain-specific acyl-CoA dehydrogenase; ACADS, short-chain-specific acyl-CoA dehydrogenase; ACAT2, acetyl-CoA acetyltransferase; ALDH7A1, aldehyde dehydrogenase 7 family, member A1; DBT, lipoamide acyltransferase component of branched-chain α-keto acid dehydrogenase complex; DLD, dihydrolipoyl dehydrogenase; ECHS1, enoyl-CoA hydratase; HMGCS1, hydroxymethylglutaryl-CoA synthase; ACS, acetyl-coA synthetase; LDHA, l-lactate dehydrogenase; MDH1, malate dehydrogenase; ME1, malic enzyme; ACSL1, long-chain-fatty-acid–CoA ligase 1; ACSL5, long-chain-fatty-acid–CoA ligase 5; BDH2, 3-hydroxybutyrate dehydrogenase type 2; SCP2, non-specific lipid-transfer protein; SLC27A5, solute carrier family 27 (fatty acid transporter), member 5; HAO2, hydroxyacid oxidase 2; PFK; 6-phosphofructokinase.
* The top ten pathways obtained are sorted based on significance.
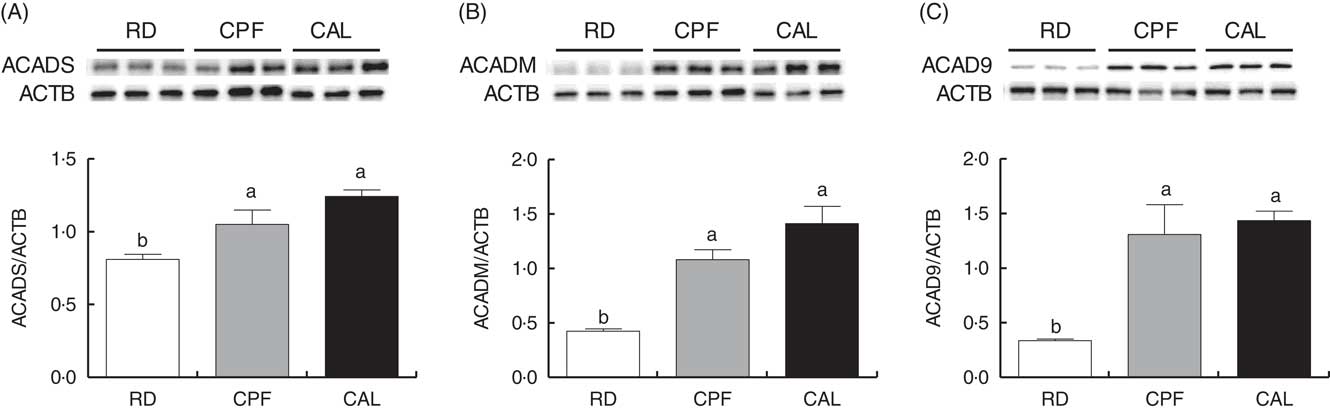
Western blot analysis
To validate proteomic results, Western blot analyses of three differentially expressed proteins were conducted. Proteins involved in β-oxidation (ACADS and ACADM) and ETC (ACAD9) were selected. The Western blot results of ACADS, ACADM and ACAD9 were fully consistent with the findings from the iTRAQ analysis (Fig. 4).
Western blot analysis of short-chain-specific acyl-CoA dehydrogenase (ACADS; A) medium-chain-specific acyl-CoA dehydrogenase (ACADM; B) and acyl-CoA dehydrogenase family member 9 (ACAD9; C) protein abundance of liver tissue of ducks in the riboflavin-deficient (RD), pair-fed with the control diet to the mean daily intake of the RD group (CPF) and ad libitum control (CAL) groups. β-Actin (ACTB) was used as a loading control. Representative Western blots are shown. Values are means (n 6), with their standard errors represented by vertical bars. a,b Mean values with unlike letters were significantly different (P<0·05). Data were analysed by one-way ANOVA followed by Tukey’s multiple comparison.
Discussion
Previous studies described that RD could depress growth( Reference Kim and Lambooy 11 – Reference Veitch, Draye and Vamecq 15 , Reference Tang, Xie and Yang 17 – Reference Tang, Hu and Wen 19 , Reference Brady, Feng and Brady 41 ) and induce fatty livers( Reference Gershoff, Andrus and Hegsted 21 , Reference Taniguchi and Nakamura 22 ) of animals. In the present study, growth depression, liver enlargement and liver lipid accumulation were observed in RD ducks, accompanied by a high mortality rate. No overt pathology was found in the birds that died from RD. Most likely their death stems from the metabolic processes that were identified, which result in energy deficiency, a speculation that remains to be verified. Furthermore, poor riboflavin status was found in RD ducks indicated by a marked reduction of free riboflavin concentrations in liver and in plasma. These results demonstrate that a severe RD animal model was successfully established. Using, for the first time, a proteomic approach, the present study shows that RD mainly affects proteins involved in lipid metabolism and cellular respiration, suggesting these processes to probably underlie the liver lipid metabolic disorder and poor growth. Notably, almost all flavoproteins or subunits of flavin-dependent enzymes among the RD altered proteins were reduced in the liver from RD ducks, such as ACADS, ACADM, ACAD9, ETFDH and DLD. This finding is consistent with the hypothesis that flavoprotein expression may be down-regulated owing to reduced supply of riboflavin in the diet and is in line with a human study( Reference Gianazza, Vergani and Wait 42 ).
Previous studies proved that RD markedly decreased feed intake in rats( Reference Kim and Lambooy 11 – Reference Veitch, Draye and Vamecq 15 , Reference Brady, Feng and Brady 41 ), pigs( Reference Brady, Brady and Parsons 43 ) and ducks( Reference Tang, Xie and Yang 17 – Reference Tang, Hu and Wen 19 ). As expected, an RD diet in the present study led to a decreased overall feed intake. The inclusion of a CPF group, in addition to a CAL group, allowed to conclude that the biochemical or molecular changes observed in the RD group were attributable to RD and not to an unequal feed intake.
In the present study, RD caused liver damage indicated by elevated plasma ALT and AST activities, confirming our previous findings( Reference Tang, Wen and Guo 18 ). Additional evidence for liver damage was provided by the markedly increased relative liver weight in RD ducks, which is indicative of liver enlargement, confirming previous findings in other animal species( Reference Kim and Lambooy 11 – Reference Patterson and Bates 13 , Reference Veitch, Draye and Vamecq 15 , Reference Brady, Feng and Brady 41 , Reference Brady, Brady and Parsons 43 – Reference Duerden and Bates 45 ). Liver enlargement in the RD group might due to lipid accumulation indicated by elevation of liver total lipids, TAG and TC, which is consistent with previous findings( Reference Olpin and Bates 12 , Reference Duerden and Bates 45 , Reference Liao and Huang 46 ). Together, these results provide evidence that the liver responds sensitively to RD, making it an interesting organ for extended proteomic analysis to investigate the mechanisms underlying growth depression and lipid accumulation.
Lipid metabolism
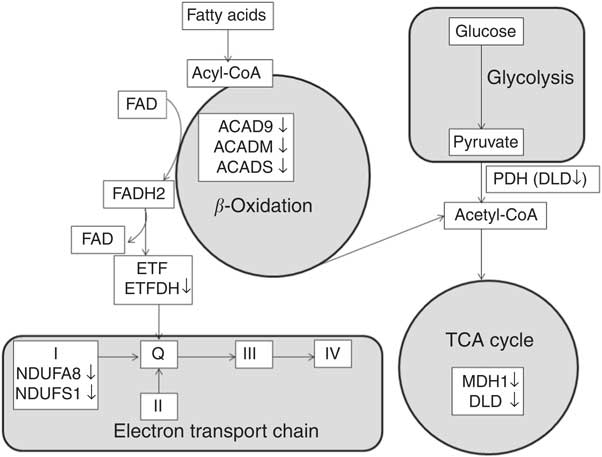
A total of twenty-two proteins participating in the lipid metabolism pathway were differentially expressed after RD, making it the largest category of identified proteins. Of these, five proteins were involved in fatty acid β-oxidation, one enhanced (enoyl-CoA hydratase) and four diminished (ACADS, ACADM, ACAD9 and ETFDH; Fig. 5). ACADS, ACADM and ACAD9 belong to the family of fatty acyl-CoA dehydrogenases, which catalyse the initial rate-limiting step of the β-oxidation cycle( Reference Ghisla and Thorpe 28 ). ETFDH accepts electrons from multiple acetyl-CoA dehydrogenases and subsequently transfers these to ETC( Reference Olsen, Andresen and Christensen 47 ). Therefore, a reduction of ACADS, ACADM, ACAD9 and ETFDH suggests that the rate of fatty acid β-oxidation in the liver may be impaired in RD ducks, which is supported by previous studies in rodents( Reference Olpin and Bates 12 , Reference Veitch, Draye and Vamecq 15 , Reference Hoppel, DiMarco and Tandler 24 – Reference Brijlal, Lakshmi and Bamji 27 ). Furthermore, ACADS and ACADM catalyse oxidation of fatty acids of 4–6 carbons and 4–16 carbons, respectively( Reference Ghisla and Thorpe 28 ), whereas ACAD9 catalyses oxidation of palmitoyl-CoA (C16 : 0) and stearoyl-CoA (C18 : 0)( Reference Zhang, Zhang and Zou 48 ). Decreased protein expression of ACADS, ACADM and ACAD9 due to RD may provide a possible explanation for the observed elevation of the SFA C6 : 0, C12 : 0, C16 : 0 and C18 : 0, which probably leads to the lipid accumulation that is seen. This explanation is supported by findings in a riboflavin-responsive multiple acyl-CoA dehydrogenase deficiency (RR-MAD) patient, showing that the reduction of ACADS, ACADM and ETFDH protein levels lead to lipid accumulation in skeletal muscle, suggested to be due to defective β-oxidation( Reference Gianazza, Vergani and Wait 42 ).
Differentially expressed proteins involved in fatty acid β-oxidation, tricarboxylic acid (TCA) cycle and electron transport chain. Protein names for the symbols used are defined in Table 3. (on the right), diminished protein levels in response to riboflavin deficiency; FADH2, 1, 5-dihydro-FAD; ETF, electron transfer flavoprotein; ETFDH, electron transfer flavoprotein-ubiquinone oxidoreductase; ACAD9, acyl-CoA dehydrogenase family member 9; ACADM, medium-chain specific acyl-CoA dehydrogenase; ACADS, short-chain-specific acyl-CoA dehydrogenase; PDH, pyruvate dehydrogenase complex; DLD, dihydrolipoyl dehydrogenase; MDH1, malate dehydrogenase; NDUFA8, NADH dehydrogenase (ubiquinone) 1α subcomplex subunit 8; NDUFS1 (Anapl_00655), NADH-ubiquinone oxidoreductase 75 kDa subunit; I, respiratory chain complex I (NADH-ubiquinone oxidoreductase); II, respiratory chain complex II (succinate dehydrogenase); Q, ubiquinone; III, respiratory chain complex III (ubiquinol-cytochrome c reductase); IV, respiratory chain complex IV (cytochrome coxidase).
In the present study, nine proteins that were differentially affected by RD are involved in TAG metabolic processes. Of these, one protein was diminished (Thyroid hormone responsive Spot 14α), whereas eight proteins were enhanced (ACOT1, ACSF2, ACSL1, ACSL5, C3, SLC27A5, APOB and MTTP). ACOT1 hydrolyses acyl-CoA of C12-C20-CoA into long-chain free fatty acids and CoA( Reference Dongol, Shah and Kim 49 , Reference Hunt, Yamada and Maltais 50 ), and regulates cellular pools and proper ratios of activated fatty acyl-CoA, free fatty acids and CoASH( Reference Brocker, Carpenter and Nebert 51 ). ACSF2, ACSL1 and ACSL5 belong to the acyl-CoA synthetase family( Reference Watkins, Maiguel and Jia 52 , Reference Yu, Wei and Xia 53 ), which plays an important part in de novo lipid synthesis and fatty acid catabolism, catalysing the initial fatty acid activation by forming a thioester with CoA( Reference Watkins, Maiguel and Jia 52 , Reference Soupene and Kuypers 54 ). SLC27A5 activates long-chain fatty acids but also enhances long-chain fatty acid uptake in the liver( Reference Doege, Baillie and Ortegon 55 ). Together, the increase of ACOT1, ACSF2, ACSL1, ACSL5 and SLC27A5 in response to RD likely indicates increased activation, uptake of hepatic (long-chain) fatty acids and probably subsequent enhanced lipid biosynthesis. These results might explain the increased TAG content observed in the liver of the RD group. In addition, APOB and MTTP play a critical role in the mobilisation and secretion of TAG-rich lipoproteins from hepatocytes( Reference Xie, Newberry and Young 56 ). APOB is required for formation of chylomicrons, VLDL and LDL and play a vital role in plasma lipoprotein metabolism( Reference Walldius and Jungner 57 ). MTTP is involved in lipid transfer during the assembly of lipoproteins in the liver and intestine( Reference Hussain, Shi and Dreizen 58 ). Therefore, overexpression of MTTP and APOB in the RD group might explain the enhanced plasma TAG concentration observed in RD ducks.
Proteins involved in cholesterol metabolic processes were also affected by RD in the present study via three enhanced proteins: HMGCS1, ACAT2 and SCP2. HMGCS1 catalyses the first committed step in the mevalonate pathway, condensing acetoacety-CoA and acetyl-CoA to form 3-hydroxy-3-methylglutaryl-CoA( Reference Shafqat, Turnbull and Zschocke 59 ), which is an intermediate in cholesterol biosynthesis. The increased levels of HMGCS1 in RD might suggest enhancement of cholesterol synthesis, providing a possible explanation for the enhanced TC concentration in liver or plasma in response to RD. Similarly, the enhanced levels of ACAT2 and SCP2 might contribute to the explanation of increased TC levels in RD ducks. SCP2 plays an important role in cholesterol transport, cholesterol esterification and bile acid formation( Reference Weber, Dyer and Garcia 60 ). ACAT2 is an enzyme responsible for intracellular cholesterol esterification, and inhibition of ACAT2 activity in the liver decreases serum cholesterol levels( Reference Bell, Brown and Graham 61 ). The overexpression of HMGCS1, ACAT2 and SCP2 in liver provides a possible explanation for the enhanced TC concentrations in liver or plasma in response to RD.
Cellular respiration
RD diminished two key enzymes involved in TCA cycle (DLD and MDH1; Fig. 5) and four proteins involved in ETC function (ACAD9, NDUFS1, NDUFA8 and FXN; Fig. 5). Results obtained in a previous human study, showing that NDUFS1, NDUFA8 and DLD were diminished in skeletal muscle of RR-MAD patient( Reference Gianazza, Vergani and Wait 42 ) validate our results. DLD (E3) is the common component of pyruvate and α-ketoglutarate dehydrogenase complexes, converting dihydrolipoic acid and NAD+ into lipoic acid and NADH( Reference Carothers, Pons and Patel 62 ). Pyruvate dehydrogenase catalyses the oxidative decarboxylation of pyruvate to acetyl-CoA, thereby linking glycolysis to the TCA cycle and fatty acid synthesis( Reference Sugden and Holness 63 , Reference Holness and Sugden 64 ). The decreased expression of DLD in the RD group might lead to the accumulation of plasma pyruvate. α-Ketoglutarate dehydrogenase is a rate-limiting enzyme of the TCA cycle, catalysing the conversion of α-ketoglutarate to succinyl-CoA and NADH( Reference Gibson, Blass and Beal 65 , Reference Zündorf, Kahlert and Bunik 66 ). MDH1 catalyses the reversible interconversion of malate and oxaloacetate. Therefore, the reduced expression of DLD and MDH1 in the RD group probably indicates a decreased liver TCA cycle.
RD diminished proteins involved in the ETC, including ACAD9, NDUFS1 and NDUFA8, and FXN. ACAD9 not only plays a physiological role in fatty acid oxidation, but is also an assembly factor for mitochondrial respiratory chain complex I( Reference Schiff, Haberberger and Xia 67 ). As two subunits of complex I, NDUFS1 and NDUFA8 play a direct role in complex I assembly( Reference Lazarou, McKenzie and Ohtake 68 , Reference Szklarczyk, Wanschers and Nabuurs 69 ). The decrease of these proteins in RD is in line with the role of riboflavin in complex I assembly( Reference Grad and Lemire 70 ). This suggestion is supported by previous findings that either ACAD9 or NDUFS1 defects or mutations cause complex I deficiency( Reference Gerards, van den Bosch and Danhauser 71 – Reference Bénit, Chretien and Kadhom 75 ). FXN is not only involved in iron–sulphur cluster assembly( Reference Yoon and Cowan 76 ) but is also able to physically interact with complex II and the electron transfer flavoprotein complex( Reference González-Cabo, Vázquez-Manrique and García-Gimeno 77 ). The diminished expression of FXN in RD is supported by data showing that FXN deficiency can be rescued by FAD supplementation, enhancing mitochondrial respiration( Reference Gonzalez-Cabo, Ros and Palau 78 ). This finding suggests that RD probably block the ETC process not only via complex I but also via complex II. Indeed, it has been reported in a previous study that there was loss of activity of the flavin-dependent sections in complex I and II of the ETC due to RD( Reference Veitch, Draye and Vamecq 15 ). Decreased expression of proteins involved in the ETC process likely imply that mitochondrial oxidative phosphorylation is impaired in response to RD. The previous observation that oxygen consumption and oxidative phosphorylation in liver mitochondria of RD rodents were significantly lower than those in the control group supports this implication( Reference Brijlal, Lakshmi and Bamji 27 , Reference Kielley and Bronk 79 , Reference Burch, HUNTER and Combs 80 ).
Our proteomic analysis revealed that fatty acid β-oxidation, TCA cycle and oxidative phosphorylation processes were probably impaired in RD ducks, which may lead to insufficient ATP production and subsequent growth retardation. This result might explain reduced energy utilisation for growth owing to RD indicated by markedly reduced weight gain per unit of feed consumed in this study, which is also observed in previous studies in rats( Reference Olpin and Bates 12 – Reference Veitch, Draye and Vamecq 15 , Reference Brady, Feng and Brady 41 , Reference Burch, Lowry and Padilla 81 ) and pigs( Reference Brady, Brady and Parsons 43 ). The results support the hypothesis that the lower food utilisation efficiency as the consequence of RD is due to incomplete oxidation of nutrients( Reference Burch, HUNTER and Combs 80 , Reference Sure 82 , Reference Sure, Dichek and Citron 83 ).
Conclusion
Proteomics analysis in liver of RD ducks showed that RD mainly affected proteins involved in lipid metabolism and cellular respiration. Down-regulation of flavoproteins involved in fatty acid β-oxidation (ACADS, ACADM, ACAD9 and ETFDH) probably indicate impaired β-oxidation of fatty acids, which may lead to liver lipid accumulation. Furthermore, reduced expression of proteins involved in cellular respiration (DLD, MDH1, ACAD9, NDUFS1, NDUFA8 and FXN) may impair oxidative phosphorylation and thus reduce energy generation, which might lead to growth depression. This finding adds to our understanding of the mechanisms underlying lipid metabolic disorders as a result of RD.
Acknowledgements
This work was supported by the earmarked fund for China Agriculture Research System (CARS-42), the science and technology innovation project of Chinese Academy of Agricultural Sciences (CXGC-IAS-09) and the Chinese Scholarship Council (grant nos 201403250064 for J. T. and 201303250054 for W. S.).
J. T. performed the study, was involved in all aspects of analysis and drafted the manuscript. J. H., Y. G., M. X. and S. H. were involved in experimental design. M. X. performed data analysis, and J. H. and Y. J. performed sample analysis. J. T., M. A. H., W. S., V. d. B. and S. H. and J. K. were involved in the data interpretation and writing. All authors revised and approved the final version of the paper and agreed to be accountable for all aspects of the work in ensuring that questions related to the accuracy or integrity of any part of the work are appropriately investigated and resolved. All persons designated as authors qualify for authorship, and all those who qualify for authorship are listed.
The authors declare that there are no conflicts of interest.
Supplementary material
For supplementary material/s referred to in this article, please visit https://doi.org/10.1017/S0007114517002641


