

Introduction
The Antarctic atmosphere is particularly pure. However, It contains minute chemical traces, which are deposited on the snow surface by several hitherto largely unknown processes. Among them, removal of particles by nucleation and precipitation is of major Importance (Reference JungeJunge 1977, Reference ShawShaw 1980). Dry deposition also occurs. I t seems to be most important (as a percentage of the total deposited matter) both near the coasts where rapid deposition (by gravity) of coarse sea-salt particles occurs and in central areas where snow-accumulation rates are so low (a few g of snow cm−2 a−1) that dry deposition of microparticles Is a prime contributor (up to 50%) as has been demonstrated for artificial radioactive products (Sr90 and Cs137) (Pourchet and others to be publishedFootnote *). However, as a first approximation satisfactorily supported by theoretical considerations (Reference JungeJunge 1977) and experimental data (Reference Boutron and LoriusBoutron and Lorlus 1979) it can be assumed that trace-element compositions in the air and in the snow are closely related. Valuable Information can therefore be obtained about past aerosol composition by analysing the regularly stacked ice layers of the Antarctic ice sheet.
Antarctica is a compact continent surrounded by oceans and remote from the other continents of the southern hemisphere. Its surface, mainly ice-covered, is generally at altitudes higher than 2 000 m on the central plateau. For these reasons coarse sea-salt particles and Insoluble crustal material are scarce in the atmosphere of central Antarctica. Only submicron particles may be transported far inland (Reference ShawShaw 1979). It has been proposed by Delmas and others (in press) that gas-derived aerosol (sulphate, nitrate, ammonium, chloride, etc.) is the dominant present-day snow impurity at the South Pole. Insoluble material and sea salt are much less important. The purpose of this paper Is to present new results concerning the past and present concentrations of the gas-derived aerosol in central Antarctica, particularly at Dome C (74°40'S, 124°10'E). Sulphate and nitrate as well as a covariant parameter (the acidity) have been measured. Experimental methods are also presented briefly. Finally the importance of such measurements globally will be examined.
Experimental procedures
Deep ice-cores were obtained using a thermal drill (Dome C 1, 1978, 906 m) and an electromechanical drill (Dome C 2, 1979, 180 m). Firn samples were collected near the surface by means of precleaned Plexiglas tubes (Syrd samples), or i n pits by means of clean plastic vials (Coulter Accuvettes) (Dome C and South Pole samples). In all these operations stringent contamination-free techniques were used (Reference BoutronBoutron 1979, Legrand and others to be published Footnote **). Blanks indicate that these procedures did not introduce contamination. The samples were kept frozen until they were melted in the laboratory just before chemical analysis.
Ice cores were recored with the aid of a small thermal probe (diameter 40 mm) in order to recover the central part (Legrand and others to be publishedFootnote **). I f this is not done, the sulphate and nitrate values obtained are 2 or 3 times too high, and traces (1 to 2 µEquiv. l−1) of sulphite ions can often be detected. Furthermore, alkaline contaminants can neutralize the natural acidity of the melt water. The methods (sampling, sample handling, titration) concerning the acidity measurements have already been described (Legrand and others to be publishedFootnote **). Some SO4 determinations (3yrd samples) were made using a lead selective electrode following the technique described by Reference DelmasDelmas (1978).
However, most SO4 and NO3 determinations presented in this paper were obtained by ion chromatography (Dionex Inc. Model 10). In this case, 5 ml of melt water is passed first through a small preconcentration ion exchanger column. In the concentration range studied, the errors are ±0.2 µEquiv. l−l (SO4) and ±0.1 µEquiv. l−l (N0 3 ). The concentrations are expressed in µEquiv. l−l which is a more suitable unit than mass units when investigating the chemical composition and the ionic balance of aerosols.
Results and discussion
Sulphate
At mid-latitudes, sulphate has been recognized as generally the most abundant trace impurity in rain water. Its measurement is now systematic in precipitation chemistry, particularly in relation to the problem of acid rain. The baseline aerosol is composed mainly of sulphuric acid and of ammonium sulphate (Reference BiggBigg 1980).
In the mass and ionic budgets of Antarctic snow impurities, sulphate plays an important part, especially in central areas (Reference BiggBigg 1980, Reference ShawShaw 1980, Delmas and others in press). This anion is now more frequently determined in polar aerosol and snow, due to its geochemical importance and also thanks to new analytical techniques.
Our first results concerned east Antarctica (Adelie Land, Dome C) and South Pole (Reference Delmas and BoutronDelmas and Boutron 1978, Reference Delmas and BoutronDelmas and Boutron 1980). We now present additional surface data which extend the geographical cover to West Antarctica (see Table I). When compared to the East Antarctic data (in the range 1–3 µEquiv. l−1), these values are relatively low (>1 µEquiv. l−l). However it must be noted that they relate to the early 1970s, a time of volcanic quiescence, during which sulphate concentrations in the snow were also particularly low at other locations (1 to 1.2 µEquiv. l−1 at Dome C and at South Pole).
The values are consistent with those reported by Reference Cragin, Herron, Langway, Klouda and MaxwellCragin and others (1977) at Byrd station where the Holocene average was 1.26 µEquiv. l−1. Moreover it is possible that these samples do not cover a sufficient number of years (~1.5 a only) to be representative of a baseline value.
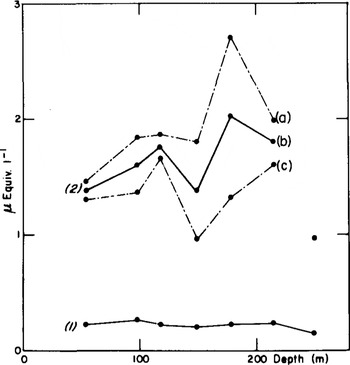
For Dome C, the analysis of deep samples is presented. The curve 2b of Figure 1 represents average SO4 concentrations calculated from two values at several depths between 50 and 250 m. At each level (except at 250 m), the two values were obtained by dividing each sample into two parts corresponding to two consecutive periods of nearly 5 a. The broken lines join the maxima (a) and minima (c). According to the concept of two contributions to sulphate deposition in Antarctica, i.e. “background” deposition and sporadic volcanic inputs (Reference Delmas and BoutronDelmas and Boutron 1980), we can assume that curve (c) is, on the whole, representative of the “background”, the difference (a) minus (c), which is particularly important at 14 and 179 m, being volcanic sulphate. The sulphate “background” may, of course, be even lower than (c).
Nitrate (curve 1) and sulphate (curve 2b) mean concentrations in the Dome C core. Curves 2a and 2c are the maximum and minimum values observed for sulphate concentrations in each core (see text).
Such an interpretation of the sulphate results for this core is supported by the detailed analysis of three deep ice samples for which unusually high static electro-conductivities (SEC) were detected (Reference Maccagnan, Barnola, Delmas and DuvalMaccagnan and others 1981), probably indicating important acidic volcanic fallouts at these depths (431, 467, and 713 m). Typical asymmetrical sulphate peaks are observed (Fig. 2).
Detailed sulphate (white area) and nitrate (hatched area) concentrations at three different depths of the Dome C ice core where volcanic fallouts were detected.

The oldest eruption reported here (at 713 m representing ~23 ka BP) was apparently several times more powerful than the 1963 Agung eruption which peaks only at ~2.4 µEquiv. l−1 at Dome C and South Pole (Reference Delmas and BoutronDelmas and Boutron 1978). Such volcanic events disturb the Antarctic snow sulphate profiles over several years which shows that the reservoir of volcanic sulphate aerosol is situated in the stratosphere: the residence times for gases and aerosols are of the order of 1.5 a at these altitudes (~20 km). In the stratosphere, SO2 is slowly oxidized to H2SO4 vapour which, in turn, is transformed into aerosol droplets (Reference YueYue 1981). The aerosol particles formed are of considerable interest for climatic studies (Reference Pollack, Toon, Summers, Baldwin, Sagan and Van CampPollack and others 1976) and the estimation of the past stratospheric sulphate aerosol is relevant to the problem of past climates and triggering of glaciation.
We can therefore deduce that average sulphate
CONCENTRATION OF SULPHATE IN SURFACE SNOW SAMPLES NEAR BYRD STATION (WEST ANTARCTICA) IN 1973-74
SULPHATE CONCENTRATIONS AT DOME C IN FIRN AND ICE: 10 a MEANS

concentrations in ice, covering 10 a or more as in Figure 1, are probably of lesser use for climatic studies than a detailed analysis as presented in Figure 2. Two different phenomena, tropospheric and stratospheric, contribute to averaged values. However, the most important volcanic events may be detected by sampling, over periods of 10 a, the tropospheric sulphate background over Antarctica being estimated only if at least more than one sample a−1 is analysed.
In order to compare past and present sulphate depositions at Dome C, we have tabulated (Table II) all 10 a average values obtained at this location.
It is remarkable that sulphate deposition at Dome C has remained relatively constant in the past, except during periods of high volcanic activity and during the Holocene glaciation. But we will see further on that acidity values indicate the possibility that this conclusion can be extended to the last 30 ka, a period which includes fundamental changes in the climatic and meteorological conditions prevailing in Antarctica (Reference AristarainLorius and others 1979, Reference Petit, Briat and RoyerPetit and others 1981). Is this finding entirely unexpected? To answer this question, we have to examine the potential sources of tropospheric sulphate in the Antarctic atmosphere. Sea-salt sulphate is a minor contributor (Reference ShawShaw 1980, Delmas and others in press) and microparticles containing excess sulphate are therefore probably responsible for this sulphate background. Due to the short residence times (a few days) of sulphur compounds over marine surfaces, it seems unlikely that Antarctic sulphate could originate from the surrounding continents (Reference Bonsang, Nguyen, Gaudry and LambertBonsang and others 1980). The role of the oceans as a source of organic sulphur gases has been investigated by Reference Lovelock, Maggs and RasmussenLovelock and others (1972), Reference Maroulis and BandyMaroulis and Bandy (1977), Reference Nguyen, Gaudry, Bonsang and LambertNguyen and others (1978), and Reference Bonsang, Nguyen, Gaudry and LambertBonsang and others (1980). These gases are oxidized rapidly (a few days) to SO2 which is in turn converted to sulphate. Dimethyl sulphide would be the more commonly produced gas by microbial activity but some long-life gases have also been proposed (COS and CS2). SO2 and SO4 measurements over the Southern Ocean by Reference Nguyen, Bonsang and LambertNguyen and others (1974) have shown that the concentrations of these compounds are not extremely low in the atmosphere (0.13 µg m−3 for S02, 1.57 µg m−3 for SO4) and a local source of marine sulphur-bearing gases is therefore possible to account for the sulphate concentrations in Antarctic snows. No SO2 has been detected at Dome C (Reference Bonsang, Nguyen, Gaudry and LambertBonsang and others 1980) which suggests that the SO2 to H2SO4 conversion takes place before the gaseous sulphur compounds penetrate deeply over the continent.
Furthermore, the geographical variations of sulphate concentrations in Antarctic snow have been found to be small. Even near the coast, at James Ross Island, Antarctic Peninsula (Reference AristarainAristarain 1980), the "excess" sulphate concentrations have an average of 1.3 µEquiv. l−l. The atmospheric sulphate concentrations are thus probably rather uniform over the Antarctic continent, when the sea-salt contribution is subtracted. This leads to the conclusion that the residence times of gas-derived microparticles are long (perhaps several weeks) in these areas. This figure is quite realistic for the Antarctic atmosphere where the precipitation rates are extremely low.
For both reasons (coastal Antarctic origin and uniform distribution) the concentration of tropospheric sulphate in Antarctica might have remained unchanged when meridional circulation brought more continental dust (× 20) and sea-salt aerosol (× 5 over the continent, as suggested by Reference Petit, Briat and RoyerPetit and others (1981). However, sea-salt sulphate contribution may Increase to significant levels when sea-salt deposition reaches-its upper values (~100 ug l−1).Taking the SO4 to Na marine ratio as equal to 0.12 (concentrations expressed in ~Equiv. l−1), we calculate a contribution of nearly 0.5 ~Equiv. l−1 for the seasalt sulphate during glaclation which could represent up to 25–3% of the tropospheric sulphate on the Antarctic Plateau (<10% during the Holocene). A more accurate estimation of this percentage could be achieved in the future by the simultaneous determination of both SO4 and H in the deepest samples of the Dome C core (sea-salt sulphate is a neutral salt whereas excess sulphate is acidic as discussed later).
Finally, little Is known about the possible change in the biological activity of sub-Antarctic marine surfaces in the past. Such changes could induce variations in the amount of sulphur gaseous compounds emitted around the Antarctic continent. Inversely the determination of the long-term variations of the sulphate background in Antarctic ice cores could be a means to assess the past biological activity of the Southern Ocean.
Nitrate
As with sulphate, nitrate is now routinely determined in rain chemistry. About one-third of the acidity of precipitation at mid-latitudes is attributed to HNO3 and this amount is increasing because of anthropogenic sources of gaseous nitrogen compounds (Reference Galloway and LikensGalloway and Likens 1981). The data already published about the nitrate content of Antarctic snow reveal that this anion could be important in both the mass and the ionic budgets of snow Impurities. However some uncertainties still remain regarding the measurements themselves and their geochemical interpretation (Reference Parker, Zeller, Heiskell and ThomsonParker and others 1977, Reference Parker, Zeller, Harrower and ThomsonParker and others 1978, Reference Parker and ZellerParker and Zeller 1979,Reference Parker and Zeller1980).
The results presented by Reference Parker and ZellerParker and Zeller (1979) exhibit strong temporal and spatial variations. The mean nitrate concentration along a 100 m deep core at South Pole is 1.5 µEquiv. l−1 with variations in the range from 0 to 5 µEquiv. l−1. At Dome C and Vostok the mean values are 3.6 and 8.6 µEquiv. l−1, respectively. An average surface value of 0.4 uEquiv. l−1 is reported by Reference AristarainAristarain (1980) for a coastal zone (James Ross Island, Antarctic Peninsula).
The NO3 results presented in this paper concern the Dome C ice core. From depths of 55 to 250 m (Fig. l), the 13 concentrations obtained have a mean value of 0.23 µEquiv, l−1. The value of the standard deviation (±0.04) shows that over the period studied, the NO3 concentrations of snow remained fairly constant. In particular, no sudden increases such as those observed for sulphate in relation to volcanic activity are evident. In a detailed study, the standard deviation was somewhat higher: ±0.10 (at 431 m), ±0.05 (at 467 m), and 0.14 µEquiv. A−1 (at 713 m) (Fig. 2). The mean values are also relatively constant: 0.20, 0.18, and 0.46 µEquiv. l−1 respectively, which compare well with the Holocene mean (0.23 µEquiv. l−1). The doubling of the NO3 concentration in the deepest sample of this core needs to be confirmed at other times of the glaciation.
AVERAGE ACIDITY OF SNOW AT DOME C FROM 1962 TO 1967
With the aid of the data already published, 1t is difficult to estimate the most probable origin of Antarctic nitrate among those listed by Parker and Reference Parker and ZellerZeller (1979). It seems unlikely that nitrate originates from sea spray (Reference HuebertHuebert 1980) but rather more likely that 1t originates from the high troposphere or the stratosphere (Reference HuebertHuebert and Lazrus 1980, Reference Levy, Mahlman and MaximLevy and others 1980), Furthermore, as HNO3 vapour and N0X gases are involved in particulate NO3 formation (Reference Huebert and LazrusHuebert and Lazrus 1980, Reference Kelly, Stedman, Ritter and HarveyKelly and others 1980), understanding the origin of nitrate over Antarctica requires also understanding of the chemistry of NO3 precursors in sub-Antarctic areas. Although transport of particulate nitrate from the surrounding continents to Antarctica appears unlikely, a worldwide atmospheric pollution by anthropogenic N0X and further transformation to NO3 cannot be ruled out. The analysis of a 100 a ice core could reveal such a pollution.
Reference Bauer, Biggs and El-SayedBauer (1978) considers galactic cosmic-ray nitrogen fixation as important whereas Reference Parker and ZellerParker and Zeller (1979) judge that fixation Induced by solar activity, i.e. aurora, Is more likely. Finally, the suggestion (Reference Wilson, Hendy and HarrowerWilson and others 1978, Reference Parker and ZellerParker and Zeller 1980) that NO3 content in snow could be an indicator of past solar activity is still questioned. Solar cycles of 11 a do not appear in our NO3 profiles.
Acidity
Atmospheric gaseous sulphur and nitrogen (N0X) compounds when oxidized in a clean atmosphere lead to the formation of acids. It is therefore assumed that Antarctic gas-derived aerosol Is essentially formed of acids (H2SO4, HNO3), ammonia being scarce over oceanic surfaces remote from continents (Reference Ayers and GrasAyers and Gras 1980). We have titrated this acidity (Legrand and others to be published) and will report here on results concerning Dome C flrn and Ice samples.
The firn samples were collected in two pits (P5 and P6, 1 km apart) and cover the same period (1962–67) (Table III). The two average acidity values are in essential agreement when considering the experimental uncertainties and the irregularity of the annual snow layers at this site. The sample period includes years during which fallout of volcanic sulphate has been previously detected in relation to the Important volcanic eruption of Agung. Unfortunately until now no sulphate determination has been performed on these samples themselves but the mean acidity values reported are reasonable with respect to the sulphate content of snow published for the same years at Dome C (Reference Delmas and BoutronDelmas and Boutron 1980).
For older samples, the acidity of ice remained in the narrow range found for the sulphate and nitrate concentrations (Reference Delmas, Aristarain, Legrand, DrablØs and TollanDelmas and others 1980). The deepest samples only (800 to 900 m, seven samples analysed, average value 1.07±0.52 µEquiv. l−1) exhibit relatively low acidities. This observation needs to be confirmed by additional analysis.
Conclusion
Antarctic gas-derived aerosol is a part of the baseline tropospheric aerosol and its composition is influenced by global phenomena. The geochemical information provided by studying the sulphate and nitrate contents of Antarctic snow and ice Is different from that which can be deduced from the measurement of other traces such as insoluble microparticles or sea-salt aerosol.
Sulphate and nitrate concentrations do not seem to vary significantly with depth along the Dome C ice core. Only major volcanic eruptions may cause important disturbances in the sulphate profile. Such events have a duration of a few years and can be easily detected when a detailed analysis Is performed (at least one sample a−1). The mean values of acidity obtained at the same location are In accord with the sulphate and nitrate results, the gas-derived sulphate and nitrate aerosol being usually in the form of H2SO4 and HNO3.
For the moment (and it is also true at other latitudes), the regional budget of nitrate (particularly the sources) in the Antarctic atmosphere and precipitation is much less understood than that of sulphate.
Finally, it Is interesting to note that sulphate and acidity concentration levels and origins have been already widely discussed for Greenland snow and ice, particularly by Reference Koide and GoldbergKoide and Goldberg (1971), Reference Cragin, Herron and LangwayCragin and others (1975, Reference Cragin, Herron, Langway, Klouda and Maxwell1977), Reference HammerHammer (1977), and Reference Herron, Langway, Weiss and CraginHerron and others (1977)
Acknowledgements
We are Indebted to C Boutron for making available to us preconcentrated samples from the Byrd area and to G Gravenhorst for helpful discussions regarding the origin of sulphate and nitrate.


