


1. Introduction
Turbulent flows subject to strong stable stratification such as in the ocean and atmosphere have been shown to exhibit strong spatiotemporal intermittency with isolated patches of vigorous ‘weakly stratified’ turbulence encapsulated by an essentially quiescent yet ‘strongly stratified’ fluid (Baker & Gibson Reference Baker and Gibson1987; van de Wiel et al. Reference van de Wiel, Ronda, Moene, De Bruin and Holtslag2002). In particular, if the stabilising force of buoyancy is sufficiently strong the flow may partially relaminarise such that the turbulent and non-turbulent phases may coexist and interact in a mutually stable state (Brethouwer, Duguet & Schlatter Reference Brethouwer, Duguet and Schlatter2012). This intermittency creates significant challenges in the quantification of local mixing rates from measurements that are inherently calculated as averages over finite volumes and time periods and in which it is conceivable that contributions from both flow regimes are present in unknown quantities (Caulfield Reference Caulfield2021). In wall-bounded stratified flows, the complexity of the intermittency problem is further confounded by the inherent vertical inhomogeneity of the flow (Armenio & Sarkar Reference Armenio and Sarkar2002; Taylor, Sarkar & Armenio Reference Taylor, Sarkar and Armenio2005). Accordingly, flow properties and mixing diagnostics for wall-bounded flows are by convention presented as appropriate volumetric averages across horizontal planes (García-Villalba & del Álamo Reference García-Villalba and del Álamo2011; Deusebio, Caulfield & Taylor Reference Deusebio, Caulfield and Taylor2015; Williamson et al. Reference Williamson, Armfield, Kirkpatrick and Norris2015; Zhou, Taylor & Caulfield Reference Zhou, Taylor and Caulfield2017; Issaev et al. Reference Issaev, Williamson, Armfield and Norris2022). However, strong intermittency of turbulence has been observed across horizontal layers in the very same studies. In this study, we explore the nature and structure of intermittency in internally heated stratified open channel flow and its effect on the estimation of local mixing rates.
Strongly stratified flows are highly anisotropic with a large separation of horizontal and vertical scales. Such flows are typically defined by a sufficiently small turbulent Froude number  $Fr = \epsilon _K/(N E_K)$, where $\epsilon _K$ is the dissipation rate of turbulent kinetic energy (TKE), $N$ is the buoyancy frequency and $E_K$ is the TKE. In addition, for turbulence to be sustained, a global buoyancy Reynolds number $Re_B = \epsilon _K/(N^2 \nu )$ which acts as an indicator of the inertial range, must be appropriately large such that buoyancy does not suppress the smallest scales of turbulence (Riley & de Bruyn Kops Reference Riley and de Bruyn Kops2003), where $\nu$ is the kinematic viscosity of the fluid. In particular, much of the stratified turbulence theory developed and investigated over the past decades that underlies the prediction of mixing and energetic transfer in the ocean and atmosphere has focused on the so called ‘strongly stratified’ or ‘layered anisotropic stratified turbulence’ (LAST) regime in the limit of $Fr \ll {O}(1)$ and $Re_B \gg {O}(1)$ (Billant & Chomaz Reference Billant and Chomaz2001; Riley & de Bruyn Kops Reference Riley and de Bruyn Kops2003; Lindborg Reference Lindborg2006; Riley & Lindborg Reference Riley and Lindborg2008; Falder, White & Caulfield Reference Falder, White and Caulfield2016; Maffioli & Davidson Reference Maffioli and Davidson2016; Maffioli Reference Maffioli2019; Taylor et al. Reference Taylor, de Bruyn Kops, Caulfield and Linden2019).
Portwood et al. (Reference Portwood, de Bruyn Kops, Taylor, Salehipour and Caulfield2016) demonstrated that flow described by appropriate bulk measures of  $Fr$ and $Re_B$ such that the flow approaches the LAST regime may be subdivided into three dynamically distinct regimes: ‘turbulent patches’, ‘intermittent layers’ and ‘quiescent’ flow, with conditionally averaged values of $Re_B$ that vary by orders of magnitude across the three regimes. Of particular note, they found that although for their most stratified case of $Fr = 0.015$, the quiescent region occupies approximately $80\,\%$ of the flow domain, it only accounts for less than $15\,\%$ of the total dissipation rates of TKE and scalar variance. In their DNS study de Bruyn Kops (Reference de Bruyn Kops2015) similarly found that with decreasing $Fr$ the flow becomes increasing anistropic with an emerging bimodal distribution of the dissipation rates. In their similar DNS study of homogeneous stratified turbulence Howland, Taylor & Caulfield (Reference Howland, Taylor and Caulfield2020) further observed the occurrence of ‘spontaneous layering’, such that the flow organises into horizontal layers of vigorous and essentially isotropic turbulence as well as definitively anisotropic quiescent flow. A fundamental question of stratified turbulence is hence how such strong intermittency effects the parametrisation of diapycnal mixing through non-dimensional parameters that are composed of flow properties that display significant spatial variation over the different dynamical regions.
As outlined in Ivey, Bluteau & Jones (Reference Ivey, Bluteau and Jones2018), one of the key aims in the study of mixing in stratified flows is the accurate estimation of the diapycnal or eddy diffusivity  $K_{\rho }$ which can be expressed as (Osborn Reference Osborn1980)
 \begin{equation} K_{\rho} = \varGamma \frac{\epsilon_K}{N^2}, \end{equation}
where  $\varGamma$ is the flux coefficient: that is, the ratio of an appropriately defined mixing rate to the dissipation rate of TKE. A considerable amount of work has focused on parametrisation schemes for $\varGamma$ (Ivey, Winters & Koseff Reference Ivey, Winters and Koseff2008; Gregg et al. Reference Gregg, D'Asaro, Riley and Kunze2018; Caulfield Reference Caulfield2020). Maffioli, Brethouwer & Lindborg (Reference Maffioli, Brethouwer and Lindborg2016) presented scaling arguments based on the underlying theory of the LAST regime to demonstrate that for quasi-stationary flow in the limit of low $Fr$,
$Fr$,  $\varGamma$ should become independent of $Fr$ and asymptote to a constant value. A number of studies with a variety of flow configurations and ranges of $Fr$ and $Re_B$ have demonstrated support for this result (Garanaik & Venayagamoorthy Reference Garanaik and Venayagamoorthy2019; Howland et al. Reference Howland, Taylor and Caulfield2020; Smith, Caulfield & Taylor Reference Smith, Caulfield and Taylor2021; Issaev et al. Reference Issaev, Williamson, Armfield and Norris2022), albeit with differing asymptotic values of $\varGamma$. However, it remains unclear how the varying intermittency in these studies influences this relationship as measurements of both $Fr$ and $\varGamma$ inherently contain contributions from both turbulent and quiescent regions of the flow. It is becoming more apparent that to accurately model turbulent fluxes within intermittent stratified flow, accurate physically based parametrisation for the different flow regimes is required (Allouche et al. Reference Allouche, Bou-Zeid, Ansorge, Katul, Chamecki, Acevedo, Thanekar and Fuentes2022).
In the study of the stable atmospheric boundary layer, the theme of intermittency in strongly stratified flow has been frequently explored through the Monin–Obhukov (M-O) framework and the M-O length  $L$ which compares the turbulence generation through the wall shear to the suppression of turbulence as a result of the surface buoyancy flux (Howell & Sun Reference Howell and Sun1999; van de Wiel et al. Reference van de Wiel, Ronda, Moene, De Bruin and Holtslag2002; van de Wiel, Moene & Jonker Reference van de Wiel, Moene and Jonker2012). In their DNS study, Flores & Riley (Reference Flores and Riley2011) demonstrated that analogous to an $Re_B$ approach, the collapse of turbulence in channel flow subject to bottom wall cooling is well predicted by the ‘mixed’ parameter $L^+$, where $L^+$ is the M-O length normalised in viscous wall units, often referred to as the Obhukov Reynolds number $Re_L$ (van Hooijdonk et al. Reference van Hooijdonk, Clercx, Ansorge, Moene and van de Wiel2018). Deusebio et al. (Reference Deusebio, Caulfield and Taylor2015) demonstrated that the $L^+$ criterion is similarly applicable to stratified plane Couette flow for the prediction of intermittency. Past studies such as those by Nieuwstadt (Reference Nieuwstadt1984), Sorbjan (Reference Sorbjan1986) and Chung & Matheou (Reference Chung and Matheou2012) further showed that a local M-O approach may be similarly applied to homogeneous stratified shear flow and intermittency displays a dependence on a vertically varying ‘local’ normalised M-O length $\varLambda ^+$. In their study of surface heated channel flow, Williamson et al. (Reference Williamson, Armfield, Kirkpatrick and Norris2015) demonstrated that an appreciable depth range for which the flow is sufficiently stratified, a state of local energetic equilibrium is obtained and through scaling arguments demonstrate that $\varLambda ^+ \sim Re_B$. As such each horizontal layer within such regions may be loosely considered a slice of quasi-homogeneous sheared turbulence where it is expected that a ‘local’ $\varLambda ^+$ approach to quantify intermittency be valid (Chung & Matheou Reference Chung and Matheou2012; Zhou et al. Reference Zhou, Taylor and Caulfield2017). However, to date this has not been tested explicitly.
For stratified flows in the presence of a mean shear, the theme of intermittency and relaminarisation has been frequently explored in literature through the gradient Richardson number:  $Ri_g = N^2/S^2$, where $S$ is the mean shear. The underlying concept being that the stabilising forces of the background stratification suppress turbulence whilst the background shear deforms the flow leading to the formation of shear instabilities. Based on linear stability analysis, Miles (Reference Miles1961) proposed the ‘Miles–Howard criterion’ of an upper limit of $Ri_g = 1/4$ for the formation of instabilities. Since then, a wide range of studies have observed that in a stationary state, stratified sheared turbulence tends to converge to an upper critical limit of $Ri_{g,c} \approx 0.16 \sim 0.25$ (Shih et al. Reference Shih, Koseff, Ferziger and Rehmann2000; Flores & Riley Reference Flores and Riley2011; Chung & Matheou Reference Chung and Matheou2012; Williamson et al. Reference Williamson, Armfield, Kirkpatrick and Norris2015; Zhou et al. Reference Zhou, Taylor and Caulfield2017; Portwood, de Bruyn Kops & Caulfield Reference Portwood, de Bruyn Kops and Caulfield2019). However, as discussed by Zhou et al. (Reference Zhou, Taylor and Caulfield2017), it is unclear whether this result is indeed related to the stability of the local flow as argued by Miles (Reference Miles1961) or is simply ‘fortuitous’. Thorpe & Liu (Reference Thorpe and Liu2009) further hypothesised that stratified shear flow naturally converges to this state of ‘marginal instability’ that facilitates the formation of relatively efficient mixing through local shear instabilities. This work was expanded on by the studies of Salehipour, Peltier & Caulfield (Reference Salehipour, Peltier and Caulfield2018) and Smyth, Nash & Moum (Reference Smyth, Nash and Moum2019) who used numerical and observational data to demonstrate this behaviour dubbed ‘self-organised criticality’ in stratified shear flows. However as noted in Caulfield (Reference Caulfield2020), due to the inherent local intermittency of stratified flows it becomes somewhat ambiguous as to what defines a local measure of the background shear and stratification and, hence, the appropriate measure of $Ri_g$. As such the role of the intermittency in the concept of a ‘critical’ $Ri_g$ remains unclear.
Mashayek, Caulfield & Peltier (Reference Mashayek, Caulfield and Peltier2017) demonstrated that the mixing in a Kelvin–Helmholtz instability (KHI) overturning event is most vigorous and efficient when the flow enters this critical state such that the injection of energy into the flow through overturning is precisely at the wavelength corresponding to the upper limit of the inertial sub-range such that  $R_{OT} \approx 1$, where $R_{OT} = L_O/L_T$ is the length scale ratio of the Ozmidov length scale ( $L_O$) characterising the theoretical upper bound for scales largely unaffected by the background stratification to the well-known Thorpe scale ( $L_T$) describing the extent of overturning motions. Mashayek, Caulfield & Alford (Reference Mashayek, Caulfield and Alford2021) expanded on this idea, demonstrating through oceanic observational data sets that the distinct majority of field observations correspond to this ‘critical’ and ‘optimal’ state defined by a marginally unstable $Ri_g$ and where $R_{OT} \approx {O}(1)$. It is still however unclear how the theory and results derived in studies of singular mixing events pertains to forced quasi-stationary flows and the role of the inherent intermittency arising from stable stratification, in particular that of wall-bounded vertically inhomogeneous flows. Furthermore, it is unclear how the concept of a self-organised critical state within stratified shear flow reconciles with the numerous observations of an asymptotic $\varGamma$ regime in the limit of low $Fr$ and how intermittency effects this behaviour.
The concept of spatiotemporally intermittent mixing is directly physically relevant to stratified river flows which underlies the motivation behind this study. Persistent stratification and subsequent reduction in mixing rates in Australian rivers has been shown to create conditions that directly facilitate harmful cyanobacterial blooms and reduce vertical transport of key nutrients (i.e.  ${\rm CO}_2,{\rm O}_2$) absorbed at the water/air interface (Turner & Erskine Reference Turner and Erskine2005). As such the need to accurately predict the intermittency profile of the flow and to better understand the mixing dynamics in regions of intermittency are crucial to understanding such ecologically damaging processes.
Our study falls into two key themes. First, that of the robust identification and prediction of the intermittency profile in internally heated open channel flow. Second, that of the role of spatiotemporal intermittency in stratified shear flows on the estimation of mixing rates through ‘local’ measurements of appropriately defined mixing diagnostics, with emphasis on the concept of self-organised ‘critical’ mixing in stratified shear flows. We explore these ideas through our DNS of temporally evolving stratified open channel flow which due to its vertical inhomogeneity allows us to explore a wide range of local parameters with a varied intermittency profile within a single simulation. To that end the remainder of this paper is structured as follows. In § 2 we present our numerical method and DNS configuration. In § 3 we present our adaption of the density gradient inversion method of Portwood et al. (Reference Portwood, de Bruyn Kops, Taylor, Salehipour and Caulfield2016) to separate our intermittent flow into ‘turbulent’ and ‘quiescent’ regions and present our prediction of the intermittency profile through both an  $Re_B$ and a $\varLambda ^+$ approach. In § 4 we demonstrate the vertical distribution of key conditionally averaged flow properties and non-dimensional parameters within the turbulent and quiescent regions of the flow . In § 5 we explore and quantify the effect of intermittency on the parametrisation of mixing rates through $Fr$ and discuss the implications of the results for stratified shear flow. Finally, in § 6 we summarise the main findings within this study.
2. Numerical method
2.1. Flow configuration
The flow configuration of our DNS employs the framework of Williamson et al. (Reference Williamson, Armfield, Kirkpatrick and Norris2015) for stationary internally heated open channel flow. For our DNS we consider not only the stationary flow but also the temporally evolving case as an initially isothermal neutral open channel flow is subject to internal heating and evolves towards a stationary stably stratified state. The problem formulation for our evolving case follows the procedure outlined in Issaev et al. (Reference Issaev, Williamson, Armfield and Norris2022) (henceforth denoted as IWAN22).
A schematic depicting our flow configuration is presented in figure 1. The flow is periodic in the streamwise  $(x)$ and spanwise $(y)$ directions and is driven by a constant pressure gradient in $x$. The top and bottom boundary conditions are free-slip adiabatic and no-slip adiabatic, respectively. The flow is subject to a depth-varying volumetric temperature source $q(z)$, modelled as radiative heating on the principle of Beer and Lambert's law and defined as
 \begin{equation} q(z) = \frac{I_s \alpha}{C_{\rho} \rho_0} \, {\rm e}^{(z-\delta)\alpha}, \end{equation}
where  $I_s$ is the radiant surface heat flux, $\alpha$ is the absorption coefficient and $\delta$ is the channel height, $C_{\rho }$ is the specific heat and $\rho _0$ is the reference fluid density. Hence, we can define both the domain-averaged mean heat source and representative heat source, respectively, as
 \begin{equation} \langle q \rangle = \frac{1}{\delta}\int_0^{\delta}q(z)\, {\rm d} z, \quad q_N = \frac{1}{\delta^2}\int_0^{\delta}(\langle q \rangle-q(z))(z-\delta)\, {\rm d} z. \end{equation}
Subsequently, under the Oberbeck–Boussinesq assumption, the governing equations for our flow, i.e. the incompressible Navier–Stokes equations, are
 $$\begin{gather} \boldsymbol{\nabla}\boldsymbol{\cdot}\boldsymbol{u} =0, \end{gather}$$
 $$\begin{gather}\frac{\partial \boldsymbol{u}}{\partial t} + \boldsymbol{u}\boldsymbol{\cdot}\boldsymbol{\nabla}\boldsymbol{u} ={-} \nabla p + \nu \nabla^2\boldsymbol{u} + b\boldsymbol{e}_z +F\boldsymbol{e}_x, \end{gather}$$
 $$\begin{gather}\frac{\partial b}{\partial t} + \boldsymbol{u} \boldsymbol{\cdot} \boldsymbol{\nabla} b = \kappa \nabla^2b + g \beta q(z), \end{gather}$$
where  $b = -g \rho /\rho _0$ is the buoyancy, $g$ is gravitational acceleration, $\nu$ is the kinematic viscosity, $\kappa$ is the thermal diffusivity, $F$ is the driving mean pressure gradient and $\beta$ is the coefficient of thermal expansion such that the transform from fluid temperature ( $\theta$) to density ( $\rho$) is given by the equation of state
 \begin{equation} \rho = \rho_0(1 - \beta \theta). \end{equation}
Our initial and boundary conditions are explicitly defined as
 $$\begin{gather} z = 0: \quad u=v=w=0, \quad \frac{\partial b}{\partial z} = 0, \end{gather}$$
 $$\begin{gather}z = \delta: \quad \frac{\partial u}{\partial z}=\frac{\partial v}{\partial z}=w=0, \quad \frac{\partial b}{\partial z} = 0, \end{gather}$$
 $$\begin{gather}t = 0: \quad b = 0. \end{gather}$$
The initial velocity field is that of fully developed and neutrally stratified turbulent open-channel flow at a given  $Re_{\tau }^0$ (to be defined shortly) as outlined in IWAN22.
Schematic diagram of the flow configuration, domain is periodic in  $x$ and $y$.
$y$.

Our flow is then fully defined by four non-dimensional parameters: the equilibrium friction Reynolds number  $Re_{\tau }^0$, the molecular Prandtl number $Pr$, the turbidity parameter $\alpha \delta$ that controls the vertical heating profile and an equilibrium bulk stability parameter $\lambda ^0$, defined as
 \begin{equation} Re_{\tau}^0 = \frac{u_{\tau}^0\delta}{\nu}, \quad Pr = \frac{\nu}{\kappa}, \quad \alpha \delta, \quad \lambda^0 = \frac{\delta}{\mathcal{L}^0}. \end{equation}
Here,  $u_{\tau }^0$ is the initial equilibrium friction velocity defined as
 \begin{equation} u_{\tau}^0 = \left( \frac{\tau_{w}^0}{\rho_0}\right)^{1/2}, \end{equation}
where  $\tau _{w}^0$ is the initial equilibrium viscous shear stress at the bottom wall. The stability parameter of our $\lambda ^0$ flow follows Williamson et al. (Reference Williamson, Armfield, Kirkpatrick and Norris2015) and is defined in the M-O framework as the ratio of the domain confinement scale $\delta$ to bulk Obhukov length $\mathcal {L}^0$ defined as
 \begin{equation} \mathcal{L}^0= \frac{({u_{\tau}^0})^3}{g\beta q_N \delta }.\end{equation}
We note that this formulation of the Obhukov length which accounts for our volumetric heat source is analogous to the standard definition used in the atmospheric literature  $L = u_{\tau }^3/(\kappa _c b_*)$, where $\kappa _c \approx 0.4$ is the von Kármán's constant and $b_*$ is the surface buoyancy flux (Flores & Riley Reference Flores and Riley2011). In (2.12) the term $g\beta q_N \delta$ can hence be interpreted as a representative buoyancy flux for the flow, analogous to $b_*$. Furthermore, as derived in Williamson et al. (Reference Williamson, Armfield, Kirkpatrick and Norris2015), for high $\alpha \delta$ we can obtain
 \begin{equation} q_N \approx \frac{I_S}{\delta \rho_0 C_p }\left( \frac{1}{2} - \frac{1}{\alpha\delta}\right), \end{equation}
such that we can redefine
 \begin{equation} \mathcal{L}^0= \frac{({u_{\tau}^0})^3}{g\beta I_s/ (\rho_0 C_p) } \left( \frac{1}{2} - \frac{1}{\alpha\delta}\right)^{{-}1}. \end{equation}
We choose this flow configuration primarily as the choice of a bottom adiabatic bottom boundary conditions creates a buoyancy flux profile that ensures that the effect of stratification on the bottom of the channel is negligible (Taylor et al. Reference Taylor, Sarkar and Armenio2005; Williamson et al. Reference Williamson, Armfield, Kirkpatrick and Norris2015; Kirkpatrick et al. Reference Kirkpatrick, Williamson, Armfield and Zecevic2019, Reference Kirkpatrick, Williamson, Armfield and Zecevic2020; Issaev et al. Reference Issaev, Williamson, Armfield and Norris2022). Subsequently, this ensures that the primary mechanism for turbulence generation in the flow at the bottom wall is relatively unaffected by stratification. As demonstrated in § 3 this creates an inhomogeneous intermittency profile that varies from fully turbulent at the wall to fully quiescent at the top boundary. This accordingly allows us to run simulations at stronger levels of stability relative to bottom Dirichlet or Neumann boundary conditions such as in stable boundary layer simulations (Flores & Riley Reference Flores and Riley2011; van de Wiel et al. Reference van de Wiel, Moene and Jonker2012; Atoufi, Scott & Waite Reference Atoufi, Scott and Waite2021), or stratified plane Couette flow (Deusebio et al. Reference Deusebio, Caulfield and Taylor2015; Zhou et al. Reference Zhou, Taylor and Caulfield2017) where intermittency at the wall may cause a collapse of turbulence across the entire flow domain. Furthermore, as discussed in § 1 our DNS configuration may be seen as an idealised representation of stratified river flow in Australia, where the understanding of intermittent mixing dynamics is a significant challenge.
2.2. Direct numerical simulations
Equations (2.3)–(2.5) were solved using the SnS code, fourth-order fractional-step finite-volume solver as outlined in Armfield et al. (Reference Armfield, Morgan, Norris and Street2003) and Williamson et al. (Reference Williamson, Armfield, Kirkpatrick and Norris2015). We refer the reader to IWAN22 for a detailed description of the DNS procedures used for our simulations.
A detailed list of simulations performed is presented in table 1. Our simulations focus on a friction Reynolds number of  $Re_{\tau }^0=400$, with a single $Re_{\tau }^0=900$ case being run until equilibrium. As we are primarily interested in flow where the dynamics are strongly affected by stable stratification our simulations cover a range of $\lambda ^0 = 0.5\unicode{x2013}2$. Finally, we keep the turbidity parameter constant at $\alpha \delta = 8$ for all simulations with a single control case of $\alpha \delta = 32$. Note that $t_e$ corresponds to the time at which the flow obtains ‘quasi-equilibrium’ in the sense that the TKE across the channel reaches steady state and the buoyancy and momentum fluxes are in balance with their respective forcing terms (to be defined in more detail in § 3). Meanwhile, $z_{e}$ corresponds to the vertical coordinate past which the flow is no longer in a state of local quasi-equilibrium (also to be defined in § 4).
List of DNS performed and relevant parameters:  $t_f$ corresponds to the total simulation time, $t_e$ corresponds to the time to obtain quasi-stationarity and $z_e$ corresponds to the upper vertical coordinate past which the flow is no longer in a state of local quasi-equilibrium.

The procedures defining our choice of grid resolution and initial condition follow the same specification as in IWAN22 based on past studies of stratified wall-bounded turbulence (García-Villalba & del Álamo Reference García-Villalba and del Álamo2011; Deusebio et al. Reference Deusebio, Caulfield and Taylor2015; Williamson et al. Reference Williamson, Armfield, Kirkpatrick and Norris2015). For all simulations the stream- and span-wise grid size in initial viscous wall units is kept constant at  $\Delta x_0^+ = 5$ and $\Delta y_0^+ = 2.5$. The vertical grid size for the $Re_{\tau }^0=400$ simulations is logarithmically stretched from $\Delta z_0^+ = 0.4$ at the wall to $\Delta z_0^+ = 4$ at $z = 0.25$ where it stays constant to the half channel height $z = 0.5$. The vertical grid spacing in the top half of the channel is then set as symmetrical about the midpoint axis to ensure accurate resolution of viscous near-surface mechanics (Calmet & Magnaudet Reference Calmet and Magnaudet2003). A similar procedure for the vertical grid size of the $Re_{\tau }^0=900$ simulations was employed with a further refinement of $\Delta z_0^+ = 2.5$ in the bulk of the flow. To maintain accurate resolution of the viscosity affected near-wall and near-surface regions we ensure that we have more than 10 grid points within a $\Delta z_0^+ = 10$ distance from either boundary.
For all simulations, transient data have been recorded at non-dimensional time intervals of  $\Delta t/ T_{\tau }^0 = 0.02$ up to the non-dimensional time of $t/T_{\tau }^0= 10$ to ensure accurate representation of the temporal effects during the early adjustment period of the flow. Here $T_{\tau }^0 = \delta /u_{\tau }^0$ is the initial friction time scale of the flow. For $t/T_{\tau }^0 > 10$ data are collected at non-dimensional time intervals of $\Delta t/ T_{\tau }^0 = 0.1$.
We acknowledge past studies that have shown that the size of the domain may effect the intermittent regime where laminar and turbulent patches coexist, such that a smaller domain often leads to earlier laminarisation for the same set of bulk parameters (Flores & Riley Reference Flores and Riley2011; García-Villalba & del Álamo Reference García-Villalba and del Álamo2011; Brethouwer et al. Reference Brethouwer, Duguet and Schlatter2012; Deusebio et al. Reference Deusebio, Caulfield and Taylor2015). However, as shown by Williamson et al. (Reference Williamson, Armfield, Kirkpatrick and Norris2015), our adiabatic bottom boundary condition ensures that the near-wall region remains fully turbulent, hence we do not expect the domain size to significantly influence the results presented in this study. Furthermore, our primary focus of this paper is the prediction of ‘local’ intermittency and its effect on ‘local’ flow parameters. Accordingly for computational efficiency we keep the domain size constant at  $L_x \times L_y \times L_z = 2 {\rm \pi}\delta \times {\rm \pi}\delta \times \delta$ across all simulations with the exception of case R400L1LD (long domain) for which the domain size is increased to $L_x \times L_y \times L_z = 8 {\rm \pi}\delta \times 2 {\rm \pi}\delta \times \delta$ to demonstrate the independence of our results on the domain size.
3. Turbulent/non-turbulent identification algorithm
3.1. Method validation
We base our turbulent/non-turbulent flow identification algorithm on the method described in Portwood et al. (Reference Portwood, de Bruyn Kops, Taylor, Salehipour and Caulfield2016) (henceforth denoted as PKTSC16). The underlying hypothesis being that regions of active turbulence inevitably contain some measure of local overturning down to a relevant length scale such that there exist appreciable regions in the flow where the local buoyancy gradient is unstable; i.e.  $\partial b(\boldsymbol {x})/\partial z < 0$. We define our detector function $Q$ as
 \begin{equation} Q(\boldsymbol{x}) = \int^\infty_{-\infty} H\left(\frac{-\partial b(\boldsymbol{x-\boldsymbol{r})}}{\partial z} \right)G_{xy}(\boldsymbol{r},l_f)\, {\rm d} \boldsymbol{r},\end{equation}
where  $H$ is the Heaviside function, $G_{xy}$ is the two-dimensional Gaussian function (in the $x$–
$x$– $y$ horizontal plane) with the input variance corresponding to the filter length scale $l_f$ and $\boldsymbol {r}$ is the dummy variable for the convolution of the Gaussian function in the $x$–
$x$– $y$ plane.
In their study of homogeneous stratified turbulence, by filtering in all three dimensions with a constant filter size  $l_f$, PKTSC16 are able to construct a cumulative filtered density function (c.f.d.f.) which serves as a measure of the vertical extent of the density inversions and acts as the final detector function within their algorithm. However, in our case, the inherent vertical inhomogeneity of channel flow creates significant variation of the turbulent length scales of the flow with respect to $z$ (Taylor et al. Reference Taylor, Sarkar and Armenio2005; Williamson et al. Reference Williamson, Armfield, Kirkpatrick and Norris2015), such that we cannot construct a similar sensible three-dimensional c.f.d.f. as in PKTSC16. Our hypothesis, however, is that for regions of vigorous turbulence, overturns of a particular vertical extent $l_f$ leave an ‘imprint’ of small-scale inversions on a horizontal pancake of the same radius $l_f$. $Q(\boldsymbol {x})$ can hence be considered the smoothed probability that within the two-dimensional horizontal circular filter range of $l_f$ the local buoyancy gradient at $(\boldsymbol {x})$ is unstable. The turbulent identification algorithm for our flow then requires two choices, an appropriate filter size $l_f$ and a suitable threshold value of $Q^*$ to be defined in (3.3).
PKTSC16 demonstrated that by defining two different filter radii based on physical length scales, their flow may be separated into three regimes with varying values of conditionally averaged  $Re_B$: vigorous ‘patch’ turbulence where buoyancy inversions occur down to the buoyancy length scale $L_B$ and where $Re_B \approx {O}(100)$, ‘turbulent layers’ where buoyancy inversion occur down to the Taylor micro-scale $L_{\lambda }$ where $Re_B \approx {O}(10)$ and ‘quiescent’ flow where $Re_B \approx {O}(1)$. Here
 \begin{equation} Re_B = \frac{\epsilon_K}{N^2 \nu}, \quad L_B = \frac{u_h}{N}, \quad L_{\lambda} = \sqrt{15 \frac{\nu}{\epsilon_K}}\boldsymbol{u}'_{{rms}}, \end{equation}
where  $u_h$ is the turbulent horizontal velocity scale, $N = (\partial \bar {b}/\partial z )^{1/2}$ and $\epsilon _K = \nu (\partial u'_i/ \partial x_j)^2$. As discussed in PKTSC16, $L_B>L_{\lambda }$ for all $z$, hence it is clear that regions of the flow where buoyancy inversions occur down to a length scale of $L_{\lambda }$ incorporate both turbulent ‘patch’ and ‘layer’ regions. Due to the vertical inhomogeneity of the stratification and shear profiles of our flow as well as the modest $Re_{\tau }$ range of our simulations, our flow does not have the sufficient dynamic range to find horizontal planes where appreciable contributions from all three regions exist. For our study we have chosen not to differentiate between ‘patch’ and ‘layer’ turbulence, but rather classify them together as ‘turbulent’ with the remaining flow considered ‘quiescent’. This leads us to only consider one depth-varying filter size in the definition of (3.1) such that $l_f(\boldsymbol {x}) = L_{\lambda }(z)$.
Analogous to PKTSC16, we seek to define a single spatially independent (and for our case also time-varying) threshold variable  $Q^*(t)$ such that the flow is considered ‘turbulent’ if $Q(\boldsymbol {x},t) \ge Q^*(t)$ and ‘quiescent’ or quasi-laminar if $Q(\boldsymbol {x},t) < Q^*(t)$. In their case the threshold criterion was derived by considering a reference simulation at high $Re_B$ and moderate $Fr$ where intermittency was negligible such that the entire flow domain may be considered a turbulent ‘patch’. For our study we employ similar logic by considering the bottom region of the channel is similarly described by $Fr>{O}(1)$ and $Re_B>{O}(10^2)$ and due to the bottom adiabatic boundary condition, may be considered fully turbulent (Williamson et al. Reference Williamson, Armfield, Kirkpatrick and Norris2015; Kirkpatrick et al. Reference Kirkpatrick, Williamson, Armfield and Zecevic2019; Issaev et al. Reference Issaev, Williamson, Armfield and Norris2022). We hence define a depth- and time-varying threshold value of $Q^*(z,t)$ such that almost the entire volume of a horizontal plane at depth $z$ would be considered turbulent. We explicitly define this as
 \begin{equation} Q^*(z,t) \quad \text{s.t.} \ \frac{1}{L_xL_y} \int^{L_x}_0 \int^{L_y}_0 H (Q(\boldsymbol{x},t) - Q^*(z,t))\, {\rm d}\kern 0.06em x\, {\rm d} y \geq 0.99. \end{equation}
We expect that for fully turbulent horizontal layers where  $Re_B \gtrsim {O}(10^2)$, $Q^*(z,t)$ will approach a constant value and for layers with strong intermittency where $Re_B \lesssim {O}(10^2)$, $Q^*(z,t)$ will trend towards zero. To demonstrate this we plot the stationary vertical profiles of $\bar {Q}^*(z)$ and $\overline {Re_B}$ for case R900L1 in figure 2(a). Here the $(\bar {.})$ operator denotes temporal averaging over the statistically stationary window of $t_e \le t \le t_f$. Note that a reading of $\bar {Q}^*(z) = 10^{-4}$ corresponds to the finest numerical sampling size of $Q^*$ in the algorithm to satisfy the implicit equation (3.3) and may be interpreted as essentially zero.
(a) Stationary profiles of the horizontally averaged cutoff threshold parameter  $\bar {Q}^*$ and buoyancy Reynolds number $\overline {Re_B}$ as a function of $z/\delta$. Shading indicates $\pm$ one standard deviation. (Shading for $\bar {Q}^*$ cutoff to minimise noise in the plot.) Horizontal lines indicate $z/\delta (\overline {Re_B}=150)$ and $z/\delta = 0.083 (z^+ = 75)$. (b) Time series of the global threshold parameter $\langle Q^* \rangle$. (c) Stationary profiles of the conditionally averaged ‘turbulent’ buoyancy Reynolds number $\langle \overline {Re_B} \rangle |_T$ plotted against $z/\delta$ for all simulations. Shading indicates $\pm$ one standard deviation. Plots ended at a turbulent fraction threshold of $\gamma <0.05$. Dotted lines of same colour correspond to the full data set. Vertical dashed lines corresponds to $Re_B = 10$ (d) Variation of conditionally averaged $\langle Re_B \rangle |_T$ (left axes solid lines) and turbulent fraction $\gamma$ (right axes dashed lines) with varied sampling of $\langle Q^* \rangle$ at $z/\delta = 0.875$. Scatter plots correspond to the values of $\langle Re_B \rangle |_T$ and $\gamma$ as per the identification algorithm with error bars showing a variation of ${\pm }0.005$. Panels (a,b,d) for case R900L1.

The results show clear support for our hypothesis showing  $\bar {Q}^*(z)$ approaches a constant value of ${O}(10^{-1})$ within a region approximately bounded by an upper vertical limit corresponding to a vertical location where $Re_B \approx 150$ and a lower limit of $z/\delta \approx 0.08\unicode{x2013}0.1$. The upper bound is consistent with the arguments presented in PKTSC16 for $Re_B \approx {O}(100)$ as a criterion for vigorous turbulence where intermittency is negligible. The lower bound which corresponds to a viscous wall-unit range of $72< z^+ < 90$ represents the dominance of near-wall mechanics and viscous effects that invalidate the assumption of small-scale overturning as an indicator of active turbulence. Note that for the $Re_{\tau } = 400$ cases (not shown here), the lower bound was similarly found to be within the viscous wall-unit range of $60 < z^+ < 80$. As near-wall mechanics are outside the scope of this study, for simplicity we assume that this region is fully turbulent due to past studies showing negligible effects of stratification for channel flow with a bottom adiabatic boundary condition at a similar parameter range (Taylor et al. Reference Taylor, Sarkar and Armenio2005; Williamson et al. Reference Williamson, Armfield, Kirkpatrick and Norris2015; Kirkpatrick et al. Reference Kirkpatrick, Williamson, Armfield and Zecevic2019). Although not shown here, qualitatively similar behaviour occurs for all our other simulations as in figure 2(a), with an asymptotic region of constant $\bar {Q}^*(z)$ developing within the aforementioned upper ( $z_u$) and lower ( $z_l$) vertical bounds.
We can therefore construct a global threshold value of  $\langle Q^* \rangle (t)$ for each DNS of the form
 \begin{equation} \langle Q^* \rangle (t) = \frac{1}{( z_u - z_l)}\int^{z_u}_{z_l} Q^*(z,t) \, {\rm d} z, \end{equation}
where  $z_u$ and $z_l$ are defined as
 \begin{equation} z_u \quad \text{s.t.} \ Re_B(z_u) = 150, \quad z_l \quad \text{s.t.} \ z_l^+ = 75. \end{equation}
Figure 2(b) shows the time series of  $\langle Q^*(t) \rangle$ for case R900L1, both the instantaneous realisations and a line of best fit using a moving average filter. Note we do not consider the data for $t/T_{\tau }^0<1$ as these correspond to an initial nonlinear adjustment period of the flow due to the sudden imposition of buoyancy on an idealised isothermal flow field (see IWAN22). The results show that $\langle Q^* \rangle (t)$ is well behaved in time, with a slight initial decline during the early ‘suppression period’ of the flow (Atoufi, Scott & Waite Reference Atoufi, Scott and Waite2020), after which it approaches a constant value of $\langle Q^* \rangle (t) \approx 0.09$. The scatter in the instantaneous data has a clear normal distribution about the line of best fit of the order of $0.005$ in agreement with the narrow spread of $\bar {Q}^*(z)$ observed in the vertical profiles of figure 2(a). We therefore propose that for any given simulation, provided a sufficient amount of flow falls within the fully turbulent vertical range of $z_l< z< z_u$, a single realisation of the flow at time $t$ and the corresponding measurement of the global threshold value of $\langle Q^* \rangle (t)$ is sufficient to separate the flow into turbulent and quiescent regions as outlined above.
To first test the validity of our identification algorithm, we consider that a consensus has formed in stratified flow literature that for active stratified turbulence a requirement is that  $Re_B \gtrsim {O}(10)$ (Maffioli et al. Reference Maffioli, Brethouwer and Lindborg2016; Portwood et al. Reference Portwood, de Bruyn Kops, Taylor, Salehipour and Caulfield2016). We hence define a conditionally averaged (and inherently depth varying) $\langle Re_B \rangle |_I$ such that
 \begin{equation} \langle Re_B \rangle |_I = \frac{\langle\epsilon_K \rangle |_I}{\nu \langle N^2 \rangle |_I}, \end{equation}
where the  $\langle.\rangle |_I$ operator denotes conditional averaging over the set $I$ where $|_F, |_T, |_Q$ correspond to the full (unsorted), turbulent and quiescent data sets, respectively, and where $\langle N^2 \rangle |_I = \langle \partial b(\boldsymbol {x})/\partial z \rangle |_I$. In the limit of low $Re_B$ ,we expect that for horizontal layers with strong intermittency, the conditionally averaged $\langle Re_B \rangle |_T$ should trend towards ${O}(10)$ if our turbulent identification algorithm is robust.
Figure 2(c) shows the stationary profiles of  $\langle \overline {Re_B} \rangle |_T$ against $z/\delta$ for all simulations. To minimise noise, we restrict the plots within the limits of $0.05 < \gamma \le 1$, where we define $\gamma$ is the depth-varying turbulent fraction defined as
 \begin{equation} \gamma(z) = \frac{V_F(z)}{V_F(z) +V_Q(z)}, \end{equation}
where  $V_F(z)$ and $V_Q(z)$ are the total volume of a horizontal plane at location $z$ that are classified as ‘turbulent’ or ‘quiescent’, respectively. For reference the profiles of $\langle Re_B \rangle |_F$ for the full data set are also plotted (dashed lines of the same colour). From the results it is clear that for all simulations, despite the variation in the profiles of the unconditionally averaged $\langle \overline {Re_B} \rangle |_F$, the turbulent counterpart $\langle \overline {Re_B} \rangle |_T$ appears to approach a lower limit of ${O}(10)$ confirming the hypothesis underlying our algorithm.
Second, we seek to demonstrate the insensitivity of our results to any noise in the instantaneous measurements of  $\langle Q^* \rangle (t)$. To test this, we consider the depth of $z/\delta = 0.875$ of case R900L1 where throughout the entire flow evolution $\langle Re_B \rangle |_F \approx {O}(1)$ and a significant portion of the flow is quiescent. Figure 2(d) shows the variation of $\langle Re_B \rangle |_T$ (solid lines, left axes) and the turbulent volume fraction $\gamma$ (dashed lines, right axes) as we vary the threshold parameter $\langle Q^*\rangle$.
We plot the results for two instances in time:  $t/T_{\tau }^0 = 5,35$, corresponding to the developing and statistically stationary flow, respectively. To help interpret this figure it is important to consider that $\langle Q^* \rangle (t) = 0$ corresponds to the assumption that the entire horizontal plane is considered turbulent such that $\langle Re_B \rangle |_T = \langle Re_B \rangle |_F$. In addition, we overlay the plot with the values of $\langle Re_B \rangle |_T$ and $\gamma$ that correspond to the threshold $\langle Q^* \rangle (t)$ as per the algorithm above. Furthermore, we also plot error bars of $\pm 0.005$ depicting the potential scatter in the data as identified in figure 2(b). From the results it is clear that both conditions are satisfied. Within the $\langle Q^* \rangle (t)$ range of potential error, we maintain $\langle Re_B \rangle |_T \approx {O}(10)$ and both $\langle Re_B \rangle |_T$ and $\gamma$ show negligible variation with $<3\,\%$ variability within the region of uncertainty.
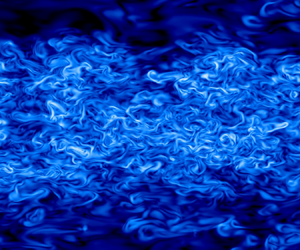
Finally, for visual reference we also verify our identification algorithm by considering flow visualisations of the  $\epsilon _K$ field for case R900L1 across all three planes in figure 3 at $t/T_{\tau }^0 = 35$ which has been chosen to display the full range of intermittency in the flow. The overlaying red contours display the separation of turbulent and quiescent regions as outlined in the method above. Figure 3(a,b) show slices in the $x$–
$x$– $y$ plane at depths of $z/\delta = 0.75$ and $z/\delta = 0.875$, respectively, and where there is significant variation in the amount of intermittency between the two depths. The results show convincing support for the robustness of our algorithm as the small-scale high-dissipation regions of active turbulence are distinctly separated from quiescent regions of essentially constant near-zero dissipation.
Instantaneous realisations of the dissipation rate of kinetic energy field  $\epsilon _K$ at $t/T_{\tau }^0=35$ for case R900L1. Red lines indicate the separation of the ‘turbulent’ and ‘quiescent’ flow regions as per the algorithm in § 3. Colour scale for all figures is logarithmic. (a,b) Slices in the $x$–
$x$– $y$ plane at $z=0.75,0.875$, respectively. (c) Slice in the $x$–
$x$– $z$ plane. (d) Slice in the $y$–
$y$– $z$ plane.

Figures 3(c) and 3(d) show realisations of the flow in the  $x$–
$x$– $z$ and $y$–
$y$– $z$ planes, respectively. The results clearly depict our unique flow structure with a weakly stratified fully turbulent lower region, a distinctly sheared central bulk flow and an upper quiescent or quasi-laminar layer (see IWAN22 for a more detailed discussion on vertical flow structure). We further observe the inherent three-dimensional aspect of the intermittency which highlights a key feature of our flow: that the intermittency in our flow manifests as a deformed horizontal interface between the lower turbulent and upper quiescent flow that forms within the flow due to the inhomogeneous stratification profile enforced on the flow through $q(z)$. This allows us the opportunity to explore the effect of intermittency in wall-bounded flows at a wide range of local parameters and with a distinctly inhomogeneous intermittency profile that is not effected by the suppression of near-wall mechanics. This being fundamentally different to that of past studies of stratified wall-bounded flow where intermittency is ‘global’ in the sense that it also originates at the bottom wall (Flores & Riley Reference Flores and Riley2011; Deusebio et al. Reference Deusebio, Caulfield and Taylor2015; van Hooijdonk et al. Reference van Hooijdonk, Clercx, Ansorge, Moene and van de Wiel2018). We return to the vertical structure of the intermittency in more detail in §§ 3.2 and 4.4.
In particular, we also highlight that the shear layer that forms between the turbulent bulk flow and upper quasi-laminar layer is notably defined by energetic mixing from distinct braided-eye ‘overturning’ structures that somewhat resemble KHI structures. Similar structures were observed in the large eddy simulation (LES) stable atmospheric boundary layer study of van der Linden et al. (Reference van der Linden, van de Wiel, Petenko, van Heerwaarden, Baas and Jonker2020), who showed using linear stability analysis that sporadic ‘bursts’ of turbulence at the turbulent/non-turbulent boundary were susceptible to KHI. We note in our flow, such structures may then be ejected from the layer into the upper quiescent flow during upwelling events from below. From figure 3(c) we note that our algorithm is able to robustly capture these mechanics identifying separated overturning structures within the upper layer as ‘turbulent’.
3.2. Vertical intermittency profile
Figure 4(a) shows the resulting intermittency profile as a result of the turbulent/quiescent identification algorithm outlined above by plotting the stationary turbulent volume fraction  $\bar {\gamma }$ against $z/\delta$ for all simulations. In agreement with the distinctly inhomogeneous profiles of $Re_B$, the profiles of $\bar {\gamma }$ show significant variation with $z$ as the flow sharply transitions from its fully turbulent state in the lower portion of the channel to an entirely quiescent state at the upper boundary.
(a) Vertical profiles of the stationary turbulent fraction  $\bar {\gamma }$ for all simulations. (b) Bin-averaged values of the turbulent fraction $\langle \gamma \rangle$ plotted against corresponding bins of $\langle Re_B \rangle |_F$. (c) Bin-averaged values of the turbulent fraction $\langle \gamma \rangle$ plotted against corresponding bins of $\varLambda ^+$. Bin-averaged values in ( $b,c$) constructed for all $z$ and $t/T_{\tau }^0>1$. (d) Stationary profiles of $\bar {\gamma }$ plotted against the theoretical maximum value of $\varLambda ^+_M$. Shading corresponds to $\pm$ one standard deviation. Horizontal dashed lines in (b) indicate $Re_B = 1100$. Horizontal dashed lines in (c,d) indicate $\varLambda ^+ = 2.5,260$.

Figure 4(b) shows the bin-averaged values of  $\gamma$ plotted against corresponding bins of $\langle Re_B \rangle |_F$. The bin-averaged data include both the transitional and quasi-stationary data and are constructed for $t/T_{\tau }^0>1$ to exclude the initial adjustment period as described above. The results confirm the dependency of the intermittency profile on $Re_B$ with a clear collapse for all DNS showing a transition to fully turbulent flow at $Re_B \approx 100$ and fully quiescent flow at $Re_B \approx 1$ consistent with the results of PKTSC16.
We note that the intermittency profiles observed in figure 4(a) show a remarkable resemblance to that of the intermittency observed in studies of neutrally stratified Ekman flow (Ansorge & Mellado Reference Ansorge and Mellado2014, Reference Ansorge and Mellado2016; Lee, Gohari & Sarkar Reference Lee, Gohari and Sarkar2020). In atmospheric literature such intermittency is classified as ‘external’: that is, the flow is separated into in an inner turbulent flow near the wall and an outer or external non-turbulent flow above. However, we must be somewhat cautious in drawing direct comparisons between our work and the aforementioned Ekman flow studies. In our case the external intermittency can still be considered ‘local’ in the sense that the collapse of turbulence is caused by strong buoyancy gradients which form in the upper channel where the heating is strongest. Conversely in neutral Ekman flow, the absence of turbulence in the outer flow is caused by an equilibrium balance between the mean geostrophic wind and the Coriolis force (Coleman, Ferziger & Spalart Reference Coleman, Ferziger and Spalart1990). Rather, the external intermittency in our flow bears closer resemblance to that of convective boundary layer (CBL) flow where the outer non-turbulent layer is defined by a stable stratification profile separated from the turbulent bulk flow by an entrainment or interfacial layer (Garcia & Mellado Reference Garcia and Mellado2014; Fodor & Mellado Reference Fodor and Mellado2020). This is addressed in more detail in § 4.4.
3.3. M-O prediction of intermittency
The scaling of flow sufficiently far from the wall and prediction of intermittency have been investigated extensively in the literature through the M-O framework for a variety of flow configurations (Howell & Sun Reference Howell and Sun1999; Flores & Riley Reference Flores and Riley2011; García-Villalba & del Álamo Reference García-Villalba and del Álamo2011; Chung & Matheou Reference Chung and Matheou2012; van de Wiel et al. Reference van de Wiel, Moene and Jonker2012; Deusebio et al. Reference Deusebio, Caulfield and Taylor2015; Williamson et al. Reference Williamson, Armfield, Kirkpatrick and Norris2015; Zhou et al. Reference Zhou, Taylor and Caulfield2017). As outlined in § 1, one of the key aims of this study is to investigate the efficacy of a ‘local’ (vertically varying)  $\varLambda ^+$ approach to the parametrisation of intermittency within surface heated open channel flow, where following Chung & Matheou (Reference Chung and Matheou2012)
 \begin{equation} \varLambda = \frac{\langle -u'w'\rangle^{3/2}}{\kappa_c B}, \quad \varLambda^+ = \frac{\langle -u'w'\rangle ^{2}}{ \kappa_cB \nu}, \end{equation}
where  $B = \langle -b'w'\rangle$ is the turbulent buoyancy flux. Here $\varLambda$ constructed out of the local buoyancy and momentum fluxes can be interpreted as a direct local variant of the classic M-O $L$, whereas $\varLambda ^+$ is the non-dimensional length normalised through viscous units, analogous to $L^+ = Lu_{\tau }/\nu$ as defined by Flores & Riley (Reference Flores and Riley2011).
Figure 4(b) shows the bin-averaged values of  $\gamma$ plotted against corresponding bins of $\varLambda ^+$. The results show clear collapse of the data for all DNS as intermittency is introduced into the flow within the bounds of $2.5 \lesssim \varLambda ^+ \lesssim 260$. These transitional values being directly equivalent to the range $1 \lesssim Re_B \lesssim 100$ observed in figure 4(b) under the assumption that for flow in a state of local ‘quasi-equilibrium’ we can obtain $Re_B \approx \kappa _c \varLambda ^+$ (Williamson et al. Reference Williamson, Armfield, Kirkpatrick and Norris2015; van Hooijdonk et al. Reference van Hooijdonk, Clercx, Ansorge, Moene and van de Wiel2018).
It is further worth noting that the data here include both the transitional period of the flow as well as the quasi-stationary state. Furthermore, our flow is highly inhomogeneous with distinctly varying flux profiles with respect to depth. As such the excellent collapse of the results presents a further strong argument for the applicability of a local  $\varLambda ^+$ approach in the prediction of the onset of intermittency for a variety sheared flows where the local flow can be described as a competition of shear, buoyancy and viscous forces.
In a practical sense, the accurate prediction or measurement of the depth varying turbulent fluxes  $\langle -u'w'\rangle, B$ or the dissipation rate $\epsilon _K$ and, hence, $Re_B$ or $\varLambda ^+$ is very challenging outside of DNS. However, an advantage of our flow configuration is that for the quasi-stationary case, the vertical profiles of the momentum and buoyancy fluxes and hence $\varLambda ^+(z)$ may be roughly estimated a priori. For the flow to obtain a quasi-equilibrium state, the forced heating profile $q(z)$ and driving pressure gradient $F$ seek to attain balance with the total downward buoyancy $\mathcal {B}$ and momentum $\mathcal {M}$ fluxes which are composed of their turbulent and laminar components such that
 \begin{equation} \mathcal{B} = B + \kappa N^2, \quad \mathcal{M} = \langle -u'w'\rangle + \nu S. \end{equation}
For the stationary state, the equilibrium profiles of  $\mathcal {B}_E$ and momentum $\mathcal {M}_E$ may be obtained analytically (Williamson et al. Reference Williamson, Armfield, Kirkpatrick and Norris2015):
 \begin{equation} \mathcal{B}_E(z) = \frac{g \beta I_S}{C_P \rho_0 \delta} ( z(1 - {\rm e}^{(z-\delta)\alpha } )), \quad \mathcal{M}_E(z) = \overline{u}_{\tau}^2 \left(1-\frac{z}{\delta}\right).\end{equation}
By neglecting the molecular terms we can, hence, construct a theoretical maximum value for  $\varLambda ^+_M(z)$ from the analytical profiles of the form
 \begin{equation} \varLambda^+_M(z) = \frac{\mathcal{M}_E^2(z)}{\kappa_c \mathcal{B}_E(z) \nu }. \end{equation}
In this sense  $\varLambda ^+_M(z)$ represents an ideal state which the flow seeks to achieve such that the turbulent flux profiles develop to obtain equilibrium.
Figure 4(c) shows the quasi-stationary values of  $\bar {\gamma }$ plotted against $\varLambda ^+_M(z)$ for all simulations. The results show excellent agreement with identical bounding values of $\varLambda ^+_M \approx 2.5\unicode{x2013}260$ that define the intermittent region of the flow. We observe that the slope of $\gamma$ in the intermittent region is slightly reduced to that of figure 4(b) due to our idealised assumption of neglecting the molecular terms in $\varLambda ^+_M$. However, the data remain well collapsed suggesting the variation between the turbulent and molecular components due to the suppression of turbulent fluxes is captured in our idealised measure of $\varLambda ^+_M$. The exception to this is the least intermittent case R400L0.5 where the stationary flow never reaches a state of $\gamma = 0$. Accordingly as the flow approaches the surface where the confinement effects modify the turbulence properties (Calmet & Magnaudet Reference Calmet and Magnaudet2003; Flores, Riley & Horner-Devine Reference Flores, Riley and Horner-Devine2017), the assumptions of local equilibrium underpinning the construction of $\varLambda$ become somewhat invalid and the data asymptote to the final value of $\gamma$ even as $\varLambda ^+_M$ continues to decrease.
As  $\varLambda ^+_M$ may be constructed entirely from bulk flow proprieties and the geometry of the flow, our results suggest $\varLambda ^+_M$ may lend itself as a useful forecasting tool for the onset of intermittency and subsequent reduction in ‘local’ mixing of real stratified river flows for which our DNS configuration is an idealised representation.
We note further from the comparison of our results of cases R400L1 and R400L1LD that their is negligible difference in the intermittency profile and its dependence on  $Re_B$ or $\varLambda ^+$ with increased domain size. The results hence suggest that our results pertaining to ‘local’ intermittency and its effect on ‘local’ parameters is independent of the domain size of our DNS.
4. Vertical distribution of conditionally averaged flow properties and non-dimensional parameters
4.1. Mean gradients and energetic quantities
We briefly present the variation in key flow properties due to intermittency for our representative case R900L1. We similarly plot both the turbulent and quiescent data sets within the limits of  $0.05 \le \gamma \le 1$ and $0 \le \gamma \le 0.95$, respectively, to minimise the effect of noisy measurements in the presentation of our results. Dimensional flow properties are non-dimensionalised by the friction velocity $u_{\tau }$ and channel height $\delta$.
Figures 5(a) and 5(b) show the conditionally averaged stationary profiles of the buoyancy frequency  $\langle \bar {N} \rangle |_I$ and mean shear $\langle \bar {S} \rangle |_I$, respectively, where $\langle S\rangle |_I = \langle \partial u(\boldsymbol {x})/ \partial z \rangle |_I$ is the local conditionally averaged shear. As discussed above, the flow attempts to balance the imposed heating profile and pressure gradient through $\mathcal {B}$ and $\mathcal {M}$, respectively. We find that in regions of non-trivial intermittency, the turbulent mean stratification $\langle \bar {N} \rangle |_T$ and shear $\langle \bar {S} \rangle |_T$ are appreciably reduced relative to the full data set as the turbulent fluxes are less suppressed within these regions. Analogously the mean profiles in the quiescent data set $\langle \bar {N} \rangle |_Q$ and shear $\langle \bar {S} \rangle |_Q$ are both larger than the full data set as the flow tends to develop steeper gradients locally to account for the strong suppression of turbulence within these regions. As such our results support the concern raised in Caulfield (Reference Caulfield2020) about the validity of any assumptions made of mean gradients of buoyancy or shear, particularly from field measurements where the data set may be limited or biased by time-dependent events.
Stationary vertical profiles of key conditionally averaged flow properties for case R900L1. (a) Buoyancy frequency  $\langle \bar {N} \rangle |_I$. (b) Mean shear rate $\langle \bar {S} \rangle |_I$. (c) The TKE $\langle \overline {E}_K \rangle |_I$. (d) Production of TKE $\langle \bar {P} \rangle |_I$. (e) Dissipation rate of TKE $\langle \bar {\epsilon }_K \rangle |_I$. (f) The vertical buoyancy flux $\langle \bar {B} \rangle |_I$. (g) The local energetic equilibrium ratio $\overline {\langle P \rangle |_I / (\langle B \rangle |_I + \langle \epsilon _K \rangle |_I)}$. Turbulent and quiescent data sets are cut off at $\gamma < 0.05$ and $\gamma >0.95$ respectively. Shading corresponds to $\pm$ one standard deviation.

Figure 5(c) shows the stationary vertical profiles of the conditionally averaged TKE  $\langle \overline {E_K} \rangle |_I$ where $E_K = 1/2 \langle u'_i u'_i \rangle$. From the results it is clear that in the region of intermittency, $\langle \overline {E_K} \rangle |_T$ does not decline towards zero with increasing distance from the wall as does the full data set, but rather plateaus to an approximately constant value within the energetic shear mixing layer. Conversely, we observe low but non-zero TKE for the quiescent data set as $\langle \overline {E_K} \rangle |_Q$ remains relatively small for its entire range. We conjecture that the energy remaining within the flow is kept at long wavelengths similar to the analysis presented for the diffusive regime of Brethouwer et al. (Reference Brethouwer, Billant, Lindborg and Chomaz2007). Accordingly the results highlight the subtle difference between a ‘quiescent’ in the presence of nearby turbulence to that of steady laminar flow where the TKE is strictly zero.
Figures 5(d)–5( f) shows the stationary conditionally averaged profiles of the dominant terms in the TKE budget, that being the production term  $\langle \bar {P} \rangle |_I$, the dissipation rate of kinetic energy $\langle \bar {\epsilon }_K \rangle |_I$ and the buoyancy flux $\langle \bar {B} \rangle |_I$ where
 \begin{equation} \langle \bar{P} \rangle|_I = \langle -u'w'\rangle |_I \langle S\rangle |_I. \end{equation}
The results show qualitatively similar results within the intermittent region for all three quantities with the turbulent data sets showing clear growth up to a secondary peak at  $z/\delta \approx 0.8$, roughly corresponding to the location of maximum shear and where the KHI-driven shear layer is observed in figure 3. As we show, this can be directly attributed to the idea of an ‘energetic’ mixing regime as argued by Mashayek et al. (Reference Mashayek, Caulfield and Alford2021) where the flows self-organises to a critical state such that the mixing is most vigorous and becomes most efficient. Conversely, the three quantities within quiescent data set remain relatively negligible and trend towards a constant limit with increasing distance from the free surface.
Figure 5(g) shows the profiles of the ratio  $\overline {\langle P \rangle |_I / (\langle B \rangle |_I + \langle \epsilon _K \rangle |_I)}$ which represents a measure of how close the flow is to a state of local energetic equilibrium. For horizontal layers where the ratio is unity we expect the local flow dynamics to be representative of an instance of homogeneous flow such that local scaling and parametrisation becomes valid. We observe that the ‘turbulent’ flow exists in a state of local equilibrium for the majority of the channel depth and this region has a slightly greater vertical extent relative to the full data set as the quasi-laminar quiescent contributions are filtered out. Accordingly, we define $z_e$ as listed in table 1 as the upper vertical intercept for which the local equilibrium assumption holds true such that $\overline {\langle P \rangle |_T / (\langle B \rangle |_T + \langle \epsilon _K \rangle |_T)} \approx 1$ and where we expect negligible influence over local flow dynamics from the confinement effects of the upper boundary which remains poorly understood (Flores et al. Reference Flores, Riley and Horner-Devine2017). For the other simulations not presented here we note similar regions develop where the local equilibrium assumption is valid, albeit with different individual values of $z_e$ due the varying thickness of the upper fully quiescent regions as the quasi-laminar flow is unable to produce enough TKE to maintain local equilibrium. In agreement with this, we observe that in the quiescent regions where the turbulent fluxes are almost fully suppressed, the local equilibrium assumption becomes strictly invalid for all $z$.
$z$.
4.2. Gradient Richardson number and ‘marginal instability’
Through separation of the turbulent and quiescent data sets we can define a conditionally averaged gradient Richardson number of the form
 \begin{equation} \langle Ri_g \rangle|_I = \frac{ \langle N^2 \rangle|_I}{ \langle S^2 \rangle|_I }. \end{equation}
Figures 6(a) and 6(b) show the quasi-stationary and conditionally averaged vertical profiles of the gradient Richardson number for the ‘turbulent’  $\langle \overline {Ri}_g \rangle |_T$ and ‘quiescent’ data sets $\langle \overline {Ri}_g \rangle |_Q$ for all simulations. For reference we include the full data set (dashed line of same colour) on both plots.
Stationary vertical profiles of: (a) the ‘turbulent’ conditionally averaged gradient Richardson number  $\langle \overline {Ri}_{g} \rangle |_T$; (b) the ‘quiescent’ conditionally averaged gradient Richardson number $\langle \overline {Ri}_{g} \rangle |_Q$. Vertical dashed line in (a,b) indicates $Ri_g = 0.2$. Dotted lines of the same colour depict full data sets in both figures. Turbulent and quiescent data sets are cut off at $\gamma < 0.05$ and $\gamma >0.95$, respectively. (c) Ratio of the turbulent to quiescent gradient Richardson numbers $\langle \overline {Ri}_{g} \rangle |_T/ \overline {Ri}_{g} \rangle |_Q$ plotted against $z/ \delta$ within the vertical range corresponding to $0.05 \le \gamma \le 0.95$. (d) The ‘full’ unconditionally averaged gradient Richardson number $\langle \overline {Ri}_{g} \rangle |_F$ plotted against the corresponding turbulent fraction $\bar {\gamma }$. Shading corresponds to $\pm$ one standard deviation. Note the vertical scale in (c) is different to (a,b,d).

From the results we observe that even though the mean stratification and shear vary appreciably over the intermittent region as seen in figure 5(a,b),  $Ri_g$ shows relatively small variation from its full data set values as the mean profiles of $N,S$ evolve proportionally in the turbulent and quiescent regions. Similar to past results of open channel and Poiseille flow (Armenio & Sarkar Reference Armenio and Sarkar2002; García-Villalba & del Álamo Reference García-Villalba and del Álamo2011; Williamson et al. Reference Williamson, Armfield, Kirkpatrick and Norris2015), we observe the core of the channel which directly corresponds to the region of intermittency equilibrates to a constant critical value of approximately $Ri_{g,c} \approx 0.2$. Towards the free surface where $\mathcal {B}$ and $\mathcal {M}$ are composed almost entirely through the molecular terms, $Ri_g$ grows rapidly large as the upper boundary condition dictates the mean gradient profiles of $S$ and $N$ through (3.10a,b).
A key finding from these results is that although the profiles of  $\langle \overline {Ri}_g \rangle |_T$ and $\langle \overline {Ri}_g \rangle |_Q$ are qualitatively similar in the region of intermittency, the turbulent data set is marginally smaller than the visually estimated asymptotic value of $Ri_{g,c} \approx 0.2$, whilst the quiescent data set is marginally larger. To show this more clearly, figure 6(c) shows the ratio of $\langle \overline {Ri}_g \rangle |_T /\langle \overline {Ri}_g \rangle |_Q$ plotted against $z/\delta$ within the region of intermittency of $0.05 \le \gamma \le 0.95$. The results clearly show that sufficiently far from the upper boundary the ratio approaches a constant of approximately $0.8$ for all simulations, regardless of the external parameter set. The results hence provide strong evidence for the ‘marginal instability’ hypothesis of Thorpe & Liu (Reference Thorpe and Liu2009). As outlined in § 1, the underlying theory being that the mean shear and stratification self-modulate in a cycle between states of marginal stability and instability. Under the assumption that $Ri_{g,c} \approx 0.2$ represents some critical measure of stability for our particular flow, our results suggest that the turbulent flow exists in an energetic and marginally unstable state prone to the formation of local instabilities. Meanwhile the quiescent flow remains suppressed, yet exists in a state where a marginal acceleration of the flow and increase in mean shear reverts the flow back to an unstable state defined by $Ri_g < Ri_{g,c}$. Considering the distinct inhomogeneity of the $S,N$ vertical profiles for our flow, our results present very strong evidence for this self-modulating behaviour.
A further and crucial observation is that this critical state defined by  $Ri_g = Ri_{g,c}$ only occurs within regions of intermittency. To make this clear we plot the stationary values of $\langle \overline {Ri}_g \rangle |_F$ against corresponding turbulent fraction $\bar {\gamma }$ for a given depth in figure 6(d). The results clearly show that the transition to $Ri_g \approx 0.2$ occurs for all simulations at precisely the location where intermittency is introduced into the flow such that $\gamma$ becomes less than unity. The results hence suggest that for our flow, criticality and intermittency may be fundamentally linked as a critical $Ri_g$ represents a saturated state past which the stationary flow cannot sustain turbulence.
The results are further consistent with the DNS findings of van Hooijdonk et al. (Reference van Hooijdonk, Clercx, Ansorge, Moene and van de Wiel2018) who investigate the transition to intermittency in stratified plane Couette flow. They find the bulk flow transition to intermittency is dependent on both an outer stability parameter  $SC_C$ (shear capacity, see van Hooijdonk et al. (Reference van Hooijdonk, Donda, Clercx, Bosveld and van de Wiel2015) for a derivation) and a Reynolds number analogous to how local stratified flow is defined by both $Ri_g$ (or $Fr$) and $Re_B$ (or $\varLambda ^+$) (Billant & Chomaz Reference Billant and Chomaz2001; Lindborg Reference Lindborg2006; Chung & Matheou Reference Chung and Matheou2012). In particular, they find that when $SC_C \sim SC_C^{{crit}}$ (i.e. when the flow approaches intermittent critical conditions), the flow obtains its maximum buoyancy flux analogous to the results shown in figure 5( f) and $Ri_g$ similarly saturates to a constant critical value. Considering the distinctly differing nature of the intermittency within the two studies: external intermittency permeating down from the free surface due to internal heating (concentrated near the surface) in our case and global intermittency due to cooling at the walls in theirs, the results presented here similarly seem to support the classic argument of Phillips (Reference Phillips1972) that the buoyancy flux–gradient relationship obtains a maximum value at a given critical stratification strength under the caveat that the Reynolds number is sufficiently large.
4.3. Turbulent Froude number and the mixing efficiency
As outlined in § 1 one of the core aims of this study is to identify the effect of intermittency on the scaling arguments of Maffioli et al. (Reference Maffioli, Brethouwer and Lindborg2016) and Garanaik & Venayagamoorthy (Reference Garanaik and Venayagamoorthy2019) that suggest the flux coefficient  $\varGamma$ trends towards a constant asymptotic value in the limit of $Fr \ll {O}(1)$. In § 5 we thoroughly investigate the effects of intermittency within the $Fr\unicode{x2013}\varGamma$ parameter space across the varying mixing regimes. However, we first consider the effects of intermittency on the spatial distribution of $Fr$ and $\varGamma$ by considering their conditionally averaged vertical profiles. We hence explicitly define the conditionally averaged measures of $\langle Fr \rangle |_I$ and $\langle \varGamma \rangle |_I$ of the form
 \begin{equation} \langle Fr \rangle |_I = \frac{\langle \epsilon_K \rangle |_I}{\langle N \rangle |_I \langle E_K \rangle |_I}, \quad \langle \varGamma \rangle |_I = \frac{\langle B \rangle |_I}{\langle \epsilon_K \rangle |_I}.\end{equation}
 Note that  $\varGamma$ can be directly related to the flux Richardson number $R_f = B/(B+\epsilon _K)$ (often referred to as the mixing efficiency) through the relation $\varGamma = R_f/(1-R_f)$. We note that as discussed IWAN22, we defer to a more classic definition of $\varGamma$ through the buoyancy flux $B$ as defined in Ivey & Imberger (Reference Ivey and Imberger1991) rather than through the normalised rate of buoyancy variance destruction $\chi = (\kappa /N^2) (\boldsymbol {\nabla } b')^2$. We acknowledge that $B$ may become contaminated through inherently reversible ‘stirring’ motions and counter-gradient fluxes and may underestimate the true irreversible mixing rate (Venayagamoorthy & Koseff Reference Venayagamoorthy and Koseff2016). However, $\chi$ begins to lose relevance as a measure of mixing in a spatiotemporally inhomogeneous flow such as ours in which the buoyancy frequency $N$ varies significantly with $z$ and $t$ (Caulfield Reference Caulfield2020). Furthermore, our results in IWAN22 have shown that the qualitative behaviour of $\varGamma$ defined through (4.3a,b) relative to $Fr$ remains consistent with past studies in which $\varGamma$ has been defined through $\chi$.
Figures 7(a) and 7(b) show the stationary vertical profiles of  $Fr$ within the turbulent and quiescent data sets respectively. For reference, the vertical profiles of the full data set of each simulation are plotted as the dashed lines of the same colour on all figures.
Stationary vertical profiles of ‘turbulent’ and ‘quiescent’ conditionally averaged: (a,b) turbulent Froude number  $\langle \overline {Fr} \rangle |_I$, where the vertical dashed line corresponds to $Fr = 0.3$; (c,d) flux coefficient $\varGamma$, where the vertical dashed line corresponds to $\varGamma = 0.2$. Turbulent and quiescent data sets are cut off at $\gamma < 0.05$ and $\gamma >0.95$, respectively. Shading where presented corresponds to $\pm$ one standard deviation. Shading is not included in (c,d) due to excessive noise.

We observe the distinct trend that irrespective of the external parameter set and the subsequent range of  $Fr$ for the full data set, the Froude number for the ‘turbulent’ data set appears to asymptote towards a lower critical limit of $Fr_c \approx 0.3$. The critical value being in direct agreement of the value for the maximum mixing efficiency within the homogeneous simulations of Maffioli et al. (Reference Maffioli, Brethouwer and Lindborg2016) and the value at which in IWAN22 we observe the transition to the ‘saturated’ constant $\varGamma$ regime. Accordingly, this result adds further evidence to the hypothesis of self-organised criticality of stratified shear flow, as the turbulent flow naturally converges towards an optimal or critical state that facilitates conditions for relatively ‘efficient’ KHI-induced mixing (Thorpe & Liu Reference Thorpe and Liu2009; Mashayek et al. Reference Mashayek, Caulfield and Peltier2017, Reference Mashayek, Caulfield and Alford2021).
We note that similar to the results regarding  $Ri_g$ in figure 6, the flow obtains $Fr \approx Fr_c$ at the location in the flow where intermittency becomes appreciable. Furthermore, as observed in figure 4, the intermittency profile displays a clear dependence on $\varLambda ^+$ and, hence, $Re_B$ in direct agreement with the theory of PKTSC16. Accordingly our results which suggest criticality and intermittency are fundamentally linked for our flow, present compelling evidence for the arguments of Caulfield (Reference Caulfield2021) that active vigorous turbulence in stratified sheared flow may not be able to access the LAST regime and should not be considered ‘strongly stratified’ as the underlying requirements of $Re_B \gg {O}(1)$ and $Fr \ll {O}(1)$ are inherently unsatisfied.
Conversely, the quiescent vertical profiles of  $Fr$ essentially follow that of the full data set as the turbulent properties ( $\epsilon _K,E_K)$ go towards zero and the parameters become predominantly defined by the shape of the vertical profile of the background stratification $N$. We observe that similarly to the lower limit for the turbulent data set, $Fr$ appears to have an analogous asymptotic upper limits within the quiescent regime of $Fr \approx 0.3$. This is conceptually consistent with the underlying theme of criticality in stratified shear flow and our analysis in IWAN22 that shows a functional relationship between $Fr$ and $Ri_g$. As such, finite bounds must exist on $Fr$ within the turbulent and quiescent regions such that the respective measurements of $Ri_g$ remain in a marginally unstable or stable state.
Figures 7(c) and 7(d) show the stationary vertical profiles of  $\varGamma$ within the turbulent and quiescent data sets, respectively. Again, the vertical profiles of the full data set of each simulation are plotted as the dashed lines of the same colour on all figures.
From the results we observe that the variation in  $\varGamma$ between the conditionally averaged and full data sets is relatively subtle as the qualitative behaviour remains essentially the same. However, within the region of intermittency it is clear that the ‘turbulent’ mixing efficiency is slightly larger than the full data. In particular, this variation is most pronounced at the secondary energetic peak corresponding to the overturning driven mixing within the interfacial layer separating the turbulent and quiescent regimes. This again directly corresponds to a critical state and the ‘optimal’ energetic mixing regime described above.
Conversely, the results show that for the majority of the intermittent region, measurements of  $\varGamma$ in the quiescent regime are relatively smaller than the full data set as the quasi-laminar flow is not able to mix the flow as efficiently. We note, however, with increasing distance from the free surface or analogously as the turbulent fraction $\gamma \rightarrow 1$, $\varGamma$ within the quiescent flow grows larger and exceeds the full data set. As observed in Smith et al. (Reference Smith, Caulfield and Taylor2021) in quiescent regions described by low $Re_B$, even as $\epsilon _K$ goes towards zero the diapycnal flux may not fully suppressed resulting in high readings of $\varGamma$. Furthermore, we note that this occurs at the lower fringes of the intermittent region where the quiescent data set is relatively sparse and measurements of $B$ become very noisy resulting in large fluctuations of $\varGamma$. It is also worth noting that the corresponding ‘quiescent’ Froude number for these higher values is appreciably smaller than that of the full or turbulent data sets for the same vertical location.
4.4. Turbulent/quiescent interface coordinate system
A key observation from the flow visualisations in figure 3 and the vertical profiles of turbulent fraction  $\gamma$ in figure 4 is that the intermittency of the flow is largely defined by an upper quasi-laminar quiescent layer separated from the lower turbulent channel by a deformed horizontal interface. The exception to this being occasional detached turbulent overturning structures within the quiescent layer and localised pockets of quiescent fluid within the turbulent flow. We can, hence, consider the vertical distribution of flow properties and non-dimensional parameters from the reference coordinate system of the interface location analogous to past studies of turbulent/non-turbulent interface flows (Garcia & Mellado Reference Garcia and Mellado2014; Ansorge & Mellado Reference Ansorge and Mellado2016; Watanabe et al. Reference Watanabe, Riley, de Bruyn Kops, Diamessis and Zhou2016).
Within the horizontal ( $x$–
$x$– $y$) plane we, hence, define the vertical reference coordinate of the turbulent/quiescent interface $z_i(x,y) = 0$ as the uppermost location that vertically separates an upper ‘quiescent’ and lower ‘turbulent’ location according to the algorithm defined in § 3. To ensure that we do not define the interface along a separated overturning structure we place an additional constraint such that along a one-dimensional search vector of length $L/\delta = 0.2$ in the $-z$ direction originating at $z_i(x,y) = 0$, more than half of the flow must be ‘turbulent’. The choice of $L/\delta = 0.2$ being the visually estimated vertical size of the largest turbulent structures within the central region of intermittency. Dimensional flow quantities (i.e. $N,S,E_K,\epsilon _K$ at a given $x,y,z,t$ are, hence, calculated cell-wise relative to their reference interface location $z_i(x,y,t) = 0$ and subsequently bin-averaged into vertical bins of size $\Delta z_i^+ = 4,2.5$ for the $Re_{\tau } = 400,900$ cases, respectively, which correspond to the coarsest vertical grid size. Non- dimensional parameters for a given $z_i$ are constructed out of the bin-averaged dimensional quantities.
Figures 8(a)–8(c) shows the stationary vertical profiles of the dominant energetic terms  $\bar {P},\bar {B},\overline {\epsilon _K}$, normalised by their mean interfacial values $\bar {P}(z_i = 0),\bar {B}(z_i = 0),\overline {\epsilon _K}(z_i = 0)$ in the $z_i$ reference coordinate system for all simulations. As the turbulent/quiescent interface is markedly defined by distinct ‘overturning’ shear instability structures, we hypothesise that the size of the interfacial layer will scale with the size of the overturns. Accordingly, we normalise $z_i$ by $\overline {L_E}(z_i = 0)$ calculated at the interface, where $L_E$ is the well-known Ellison length describing the characteristic size of the overturns in a stratified fluid (Ellison Reference Ellison1957; Shih et al. Reference Shih, Koseff, Ivey and Ferziger2005; Mater, Schaad & Venayagamoorthy Reference Mater, Schaad and Venayagamoorthy2013), defined as
 \begin{equation} L_E = \frac{b'_{{rms}}}{N^2}. \end{equation}
The results show clear behaviour of two distinctly different flow regimes separated by an interfacial layer where the properties rapidly change, showing qualitatively similar behaviour to the results of Watanabe et al. (Reference Watanabe, Riley, de Bruyn Kops, Diamessis and Zhou2016). Above the interface, the energetic terms go to zero as the flow approaches quasi-laminar conditions. Below the interface the flow is actively turbulent, in particular the mixing being most energetic just below the interfacial layer as seen from the peak in  $B$. Crucially, the interfacial layer does appear to characterised by the Ellison length, with thickness of approximately $4L_E/\delta$.
Stationary vertical profiles in the  $z_i$ turbulent/quiescent interface system of: (a) TKE production $\bar {P}$, (b) buoyancy flux $\bar {B}$; (c) TKE dissipation rate $\overline {\epsilon _K}$; and (d) local equilibrium ratio $\overline {P/(B+\epsilon _K)}$. Dimensional quantities in (a–c) normalised by their respective mid-interface values at $z_i = 0$. For all figures: vertical interface location $z_i$ normalised by the Ellison length calculated at the centre of the interface. Vertical dashed lines indicate a value of unity. Horizontal dashed lines indicate values of $z_i/ \overline {L_E} = -2,0,2$. Shading where presented corresponds to $\pm$ one standard deviation.

We note that on the ‘turbulent side’ of the interface the energetic quantities follow individual trajectories with each simulations. This is unsurprising as the location of the vertical region of intermittency varies with each simulation, which combined with the vertically inhomogeneous nature of the depth-dependent mean shear and stratification profiles causes variation in the energetic quantities with respect to the turbulent/quiescent interface.
Figure 8(d) shows the stationary vertical profiles of the local equilibrium ratio  $\overline {P/(B+\epsilon _K)}$ in the $z_i$ coordinate system. Note that the data in the positive $z_i$ direction have been abbreviated to minimise excessively noisy measurements of the local equilibrium ratio as all terms become small and minor fluctuations in any quantity cause large variations in the local equilibrium ratio. A state of local energetic equilibrium is only evident for the actively turbulent flow as the suppressed momentum flux in the quiescent layer is unable to extract sufficient TKE from the mean shear to maintain local equilibrium in agreement with our analysis in § 4.
Figure 9(a) shows the stationary profiles of the buoyancy Reynolds number  $\overline {Re_B}(z_i)$. We again normalise $z_i$ by $\overline {L_E}(z_i = 0)$ to demonstrate self-similar behaviour of the interfacial layer. The results are well collapsed for all simulations. At the quiescent-side boundary of the interfacial layer, the flow obtains $Re_B \approx {O}(1)$ confirming the observation of a quasi-laminar or diffusive state. Conversely at the turbulent-side boundary of the interfacial layer, the flow obtains $Re_B \approx {O}(10)$. The results are consistent with the assumptions of PKTSC16 and past work on stratified flows discussed in § 3 regarding the lower ‘local’ limit of $Re_B \approx 10$ for actively turbulent flow.
Stationary vertical profiles in the  $z_i$ turbulent/quiescent interface system of: (a) buoyancy Reynolds number $\overline {Re_B}$, where the vertical dashed lines indicate $Re_B = 1,10$; (b) gradient Richardson number $\overline {Ri_g}$, where the vertical dashed line indicates $Ri_g = 0.2$; (c) turbulent Froude number $\overline {Fr}$, where the vertical dashed line indicates $Fr = 0.3$; (d) flux coefficient $\bar {\varGamma }$, where the vertical dashed line indicates $\varGamma = 0.2$. For all figures: vertical interface location $z_i$ normalised by the Ellison length calculated at the centre of the interface. Horizontal dashed lines indicate values of $z_i/ \overline {L_E} = -2,0,2$. Shading where presented corresponds to $\pm$ one standard deviation and has been abbreviated to minimise excessive noise in the quiescent region. Legend same as figure 8.

Figure 9(b) shows the stationary profiles of the gradient Richardson number  $\overline {Ri_g}(z_i)$. The results clearly show support for our argument that the criticality of the flow is inherently linked to the intermittency as the flow deviates from its critical state of $Ri_g \approx 0.2$ at precisely the interface location $z_i = 0$ for all simulations. Above the interface $Ri_g$ rapidly grows as the flow approaches stable and quasi-laminar conditions. Further evidence to support this idea is seen in figure 9(c), which analogously shows that through the stationary profiles of the turbulent Froude number $\overline {Fr}(z_i)$ that the flow similarly departs from its critical state of $Fr \approx 0.3$ within the interfacial layer again suggesting that actively turbulent shear flow is unable to access $Fr \ll {O}(1)$ locally.
Figure 9(d) shows the stationary profiles of the flux coefficient  $\bar {\varGamma }(z_i)$. We interestingly observe non-monotonic behaviour of $\varGamma$ with $z_i$. We note that the mixing is most efficient with a clear peak of $\varGamma \approx 0.25$ at the lower turbulent-side boundary of the interfacial layer at $z_i/L_E = -2$ rather than at $z_i = 0$, corresponding to the peak in $B$ observed in figure 8(b) and where $Ri_g$ and $Fr$ obtain their critical values. Past this point where $Re_B < {O}(10)$, the flow begins to enter a diffusive regime which is not able to mix the buoyancy field as efficiently such that $\varGamma$ drops slightly and approaches a constant value (albeit with a significant amount of scatter) within the quiescent regime. This suggests the asymptotic nature of a ‘saturated’ $\varGamma$ at low $Fr$ is linked to the quiescent flow. We explore this concept in more detail in § 5.
We again observe that on the ‘turbulent side’ of the interface the profiles the mixing diagnostics do not universally collapse when normalised by the interfacial value of  $L_E$. In particular, this is accentuated in our R900L1 results. This can be explained if we consider figure 9(a) showing that for all cases the transition to the intermittent interfacial region occurs at $Re_B \approx 10$, consistent with the underlying theory and our analysis so far. Furthermore, we note that $Re_B$ can be defined as a ratio of length scales such that
 \begin{equation} Re_B = \left(\frac{L_O}{L_K}\right)^{4/3}, \end{equation}
where  $L_O = (\epsilon _K/N^3)^{1/2}$ is the Ozmidov length roughly defining the upper limit of the inertial subrange in stratified flow and $L_K = (\nu ^3/\epsilon _K)^{1/4}$ is the Kolmogorov micro scale. Hence, $Re_B$ represents an estimate of the isotropic inertial subrange of the flow. Thus, if we assume $L_K$ decreases with increasing $Re_{\tau }$, then to maintain $Re_B \approx 10$ we expect $L_O$ to similarly decrease. As argued by Mashayek et al. (Reference Mashayek, Caulfield and Alford2021) and as shown directly in § 5, we expect this region of ‘optimal’ or critical mixing to be defined by $L_E \approx L_O$ such that the injection of energy into the flow through overturns is precisely at the wavelength corresponding to the upper limit of the inertial subrange. Hence, as the interfacial value of $L_E$ accordingly shrinks with increasing $Re_{\tau }$, the vertical profiles of the $Re_{\tau }=900$ appear more ‘stretched’ than the $Re_{\tau }=400$ cases. Furthermore, we do not expect that in our flow where $L_E$ and $L_O$ vary significantly with depth, that a local interfacial scale at $z_i = 0$ would scale the turbulence within the bulk flow below. However, the significant takeaway from the results is that regardless of Reynolds number, the behaviour of the energetic quantities and mixing diagnostics within the interfacial layer as seen in figures 8 and 9 remains self-similar when scaled with the interfacial mean value of $L_E$.
It is worth noting that  $z_i$-based vertical profiles of the turbulence properties and non-dimensional parameters in figures 8 and 9 bear striking similarity to the vorticity profiles observed for CBL flow with respect to an appropriately defined encroachment length (analogous to $z_i = 0$ in our case) (Garcia & Mellado Reference Garcia and Mellado2014; Fodor & Mellado Reference Fodor and Mellado2020). They similarly found that the flow is divided into two regimes: an outer non-turbulent and stably stratified layer and a lower well-mixed turbulent layer, between which the strength of the vorticity varies by orders of magnitude. These regimes being separated by an entrainment layer where the magnitude of the vorticity rapidly changes. Garcia & Mellado (Reference Garcia and Mellado2014) further found that the thickness of this layer scales with the vertical buoyancy scale $L_{B}^w = w'_{{rms}}/N$. As shown in IWAN22, for strong stratification ( $Fr \le 0.3$) we expect the buoyancy scale to determine the size of the overturns such that $L_{B}^w \sim L_E$. As such our results suggest that the structure of the interfacial layer in surface heated channel flow bears remarkable similarity to that of the entrainment layer structure in the aforementioned CBL studies. Considering the distinctly differing mechanisms governing the entrainment or mixing process itself: convective turbulence as opposed to shear-driven instabilities in a pressure gradient-driven flow, the results suggest a degree of universality on a local buoyancy scaling of an entrainment or interfacial layer for stably stratified flows with a clear turbulent/non-turbulent interface. How this pertains to a wider range of flow configurations remains to be seen and presents clear direction for future work.
5. Effect of intermittency on a  $Fr$-based parametrisation of $\varGamma$


5.1. Horizontal averages
We now consider how the spatially varying distributions of the conditionally and horizontally averaged values of  $Fr$ and $\varGamma$ correlate and to what effect the parametrisation of the mixing efficiency is effected by highly intermittent flow. We note that a caveat to the use of our conditionally averaged data sets in this section is that the ‘turbulent’ and ‘quiescent’ patches within the horizontal layers for which statistics are calculated, must be larger than all the physically relevant scales such that the two regions may be seen as self-contained. If this condition is met, we conceptually expect the two flow regimes to be independent of each other and local measures of $Fr$ to correlate with local measures of $\varGamma$.
To demonstrate that this is strictly true for our flow, we consider that the largest length scales most physically relevant to the mixing dynamics of our flow are: the Ellison length  $L_E$ defining the size of the overturns, the mean shear mixing length $L_S$, the Ozmidov length $L_O$ defining the upper limit of the inertial subrange and the inertial turbulent length $L_{IT}$ roughly characterising the integral scale of the flow. We hence explicitly define the above conditionally averaged lengths:
 \begin{equation} \langle L_E \rangle |_I = \frac{\langle b'_{{rms}} \rangle |_I}{\langle N^2 \rangle |_I}, \quad \langle L_S \rangle |_I = \frac{\langle E_K^{1/2} \rangle |_I}{\langle S \rangle |_I}, \end{equation}
and
 \begin{equation} \langle L_O \rangle |_I = \left( \frac{\langle \epsilon_K \rangle |_I}{\langle N^3 \rangle |_I \langle E_K \rangle |_I} \right)^{1/2}, \quad \langle L_{IT} \rangle |_I = \frac{\langle E_K^{3/2} \rangle |_I}{\langle \epsilon_K \rangle |_I}. \end{equation}
 Figures 10(a) and 10(b) show the stationary vertical profiles of the turbulent and quiescent length scales  $L_E,L_S,L_O,L_{IT}$, respectively, normalised by the domain height $\delta$ for case R900L1. From the results it is clear that for both data sets, within the region of intermittency all the normalised lengths are of size $L/\delta \approx {O}(10^{-1})$. In particular, we note that within the ‘turbulent’ data sets $L_E,L_S$ and $L_O$ appear to be of similar scale and approach an asymptotic limit in agreement with the concept of criticality as argued by Mashayek et al. (Reference Mashayek, Caulfield and Alford2021) where all three length scales equate. Conversely, from our visualisations in figure 3 it is clear that with the exception of small isolated overturning events, contiguous turbulent or quiescent patches are of size $L/\delta \approx {O}(1)$. Furthermore, as the turbulent and quiescent flow regions may be loosely considered two large dynamically distinct regions separated by a deformed horizontal interface, the results confirm our underlying assumption that the local dynamics describing both regions are self-contained.
Stationary vertical profiles of the Ellison length  $\overline {L_E}$, shear mixing length $\overline {L_S}$, Ozmidov length $\overline {L_O}$, inertial turbulent length $\overline {L_{IT}}$ normalised by the channel height $\delta$. (a) ‘Turbulent’ data set. (b) ‘Quiescent’ data set. Turbulent and quiescent data sets are cut off at $\gamma < 0.05$ and $\gamma >0.95$, respectively. Shading where presented corresponds to $\pm$ one standard deviation. Data presented for case R900L1 in both figures.

We have used a singular case R900L1 to show this result for brevity. Although the size of the four aforementioned length scales vary slightly with each simulation, they all remain of size  $L/\delta \approx {O}(10^{-1})$ validating our assumption of self-contained flow within the quiescent and turbulent patches.
Figure 11 shows the bin-averaged values of instantaneous measurements of  $\langle \varGamma (z,t) \rangle |_I$, plotted against their corresponding bins of $\langle Fr \rangle |_I$ for each individual simulation. To show the spread of the instantaneous data, we plot the two-dimensional probability density functions (2D p.d.f.s) of the same variables constructed from all simulations as a single 2D p.d.f. in the inset of the figures. To demonstrate the invariance of our results to time, we include data for both the temporally evolving and quasi-stationary state such that both the bin-averaged values and p.d.f.s are constructed for data where $t/T_{\tau }^0>1$. Furthermore, to ensure our results are not susceptible to the confinement effects from the top and bottom boundaries, we limit the vertical range from which we construct our figures between $0.2 < z < z_e$. Here $z = 0.2$ corresponds to the approximate lower bound in which Williamson et al. (Reference Williamson, Armfield, Kirkpatrick and Norris2015) observe a transition of the flow to a state of local equilibrium such that $P \approx B+\epsilon _K$ for their $Re_{\tau } = 395$ simulations. Meanwhile, $z_e$ as defined in § 4 varies with each simulation. Accordingly within this vertical range we expect the mixing dynamics of the flow to be free from boundary effects and to be characterised by local processes.
Bin-averaged values and 2D p.d.f.s of the conditionally averaged flux coefficient  $\langle \varGamma \rangle |_I$, plotted against corresponding bins of conditionally averaged $\langle Fr \rangle |_I$. Bin-averaged values and 2D p.d.f. constructed with the temporal range of $t/T_{\tau }^0>1$ and the vertical range of $0.2< z< z_{le}$. (a) ‘Full’ data set. (b) ‘Turbulent’ data set. (c) ‘Quiescent data set’. For (a,b) solid diagonal lines indicate $\varGamma \propto Fr^{-1}$ and $\varGamma \propto Fr^{-2}$. Dashed vertical lines indicate $Fr =0.3,1$. Horizontal thin lines in all figures indicate $\varGamma = 0.2,0.33$. Legend same as figure 4(b).

For reference, figure 11(a) shows the correlations between  $\varGamma$ with $Fr$ for the ‘full’ data set. The results show the same qualitative behaviour as shown in figure 6 of IWAN22, with a distinct collapse of the data along the lines of scaling as proposed by Maffioli et al. (Reference Maffioli, Brethouwer and Lindborg2016) and Garanaik & Venayagamoorthy (Reference Garanaik and Venayagamoorthy2019). For $Fr \gtrsim 1$ the flow displays a $\varGamma \sim Fr^{-2}$ scaling consistent with the arguments of Maffioli et al. (Reference Maffioli, Brethouwer and Lindborg2016) for ‘weakly stratified’ flow. For $0.3 \lesssim Fr \lesssim 1$ we observe the ‘moderately stratified $\varGamma \sim Fr^{-1}$ scaling of Garanaik & Venayagamoorthy (Reference Garanaik and Venayagamoorthy2019). Importantly, we observe that similarly to the results presented in IWAN22, the full data set displays an asymptotic $\varGamma$ regime for $Fr < 0.3$ which corresponds directly to the regions of the flow where we observe strong intermittency. Within this regime $\varGamma$ approaches a constant value within the bounds of $\varGamma = 0.2$ as predicted by Osborn (Reference Osborn1980) and $\varGamma = 0.33$ as predicted for the optimal mixing regime of Mashayek et al. (Reference Mashayek, Caulfield and Alford2021).
Figure 11(b) shows the correlations between  $Fr$ and $\varGamma$ for the turbulent data set and the comparison with the full data set is striking. The results clearly show that within the turbulent data set there is no indication of a constant $\varGamma$ regime. Rather for flow where $Fr \lesssim 1$, the mixing efficiency continues to display an inverse correlation with $Fr$, such that the $\varGamma \sim Fr^{-1}$ ‘intermediate’ scaling of GV19 clearly holds for an entire decade of $Fr$ with a distinct collapse of the data for all simulations even for $Fr < Fr_c$. This is again seemingly in agreement with the arguments of Caulfield (Reference Caulfield2021) suggesting turbulent stratified shear flow is unable to access a strongly stratified buoyancy dominated regime. However, as discussed in Mashayek et al. (Reference Mashayek, Caulfield and Alford2021), the emergence of an ‘intermediate’ $\varGamma \sim Fr^{-1}$ mixing regime under the assumption of Garanaik & Venayagamoorthy (Reference Garanaik and Venayagamoorthy2019) that buoyancy influences the evolution of $B$ to leading order appears somewhat in contradiction of their primary assumption underlying the theory of self-organised criticality of stratified shear flow. Being that for the entire mixing life cycle of a shear driven overturning event, the flow is weakly stratified in the sense that the mixing of the buoyancy field defined through $B$ is ‘slaved’ to that of momentum and, hence, the shear and inertial forces of the flow. We return to this idea in more detail in § 5.3.
It is important however to consider our distinct observation from figure 6(a) which shows that for the stationary case and when considering only the ‘turbulent’ flow,  $Fr$ approaches its clear critical limit of $Fr_c = 0.3$. For our results this directly corresponds to a measurement of $\varGamma = 0.2\unicode{x2013}0.33$ conceptually consistent with the critical mixing regime of Mashayek et al. (Reference Mashayek, Caulfield and Alford2021) and with numerous studies for the saturated value of the mixing efficiency in the limit of strong stratification (Osborn Reference Osborn1980; Ivey & Imberger Reference Ivey and Imberger1991; Shih et al. Reference Shih, Koseff, Ivey and Ferziger2005; Maffioli et al. Reference Maffioli, Brethouwer and Lindborg2016; Portwood et al. Reference Portwood, de Bruyn Kops and Caulfield2019; Howland et al. Reference Howland, Taylor and Caulfield2020). This is reflected by the high concentration of data on the 2D p.d.f. at the critical point in the flow.
In contrast, within figure 11(b), we note that the instances where  $Fr<0.3$ and we observe measurements of $\varGamma \ge 0.2\unicode{x2013}0.33$ higher than the asymptotic value observed in figure 11(a) are significantly less frequent and can be interpreted as transient mixing events at strong levels of stratification. This interpretation of the results is conceptually consistent with the findings of numerous stratified free shear layer studies that show the mixing efficiency grows very large during an initial ‘roll-up’ of a KHI mixing event in a quiescent and, hence, more strongly stratified background fluid (Caulfield & Peltier Reference Caulfield and Peltier2000; Peltier & Caulfield Reference Peltier and Caulfield2003; Salehipour, Peltier & Mashayek Reference Salehipour, Peltier and Mashayek2015; Mashayek et al. Reference Mashayek, Caulfield and Peltier2017).
In stark contrast to the above results, figure 11(c) clearly show that within the quiescent flow,  $\varGamma$ does not show any functional relationship on $Fr$. Rather, the mixing efficiency appears to remain constant such that $\varGamma$ ranges between $0.2$ and $0.33$ for the full parameter range presented. We explain this by employing the scaling arguments of Garanaik & Venayagamoorthy (Reference Garanaik and Venayagamoorthy2019). Within this regime the flow is essentially quasi-laminar such that buoyancy has almost entirely suppressed turbulent motions and $Re_B \lesssim {O}(1)$. Accordingly, we expect shear and inertial forces to be negligible and all dynamics of the flow to be characterised by processes occurring at the buoyancy time scale $T_N = 1/N$. This leads to their scaling argument of
 \begin{equation} B \sim \epsilon_K \sim \frac{w'^2}{T_N}, \end{equation}
and, subsequently,
 \begin{equation} \varGamma = \frac{B}{\epsilon_K} \sim \frac{w'^2 T_N} {w'^2 T_N} = \text{const}. \end{equation}
We note within this quiescent data set there is a significant amount of spread in the results as  $B$ and $\epsilon _K$ approach zero and small fluctuations in either quantities cause large variations in $\varGamma$. However, the main observation from the results that $\varGamma$ appears independent of $Fr$ within the quiescent regions of the flow remains distinctly clear.
The results presented in figure 11 show that at our parameter range and for our flow configuration, flow described by a global (unconditionally averaged)  $Fr< Fr_c$ and, hence, low $Re_B$ corresponds to highly intermittent flow with appreciable contributions from both the turbulent and quiescent data sets. Accordingly for our flow the transition observed in figure 11(a) at the critical point of $Fr_c = 0.3$ from the $\varGamma \sim Fr^{-1}$ regime to a ‘saturated’ constant $\varGamma$ regime occurs due to the increasing contributions from the quiescent flow regions leading to a plateau in a ‘global’ measure of $\varGamma$. Hence, assuming that $Fr \approx 0.3$ represents a critical lower bound for our sheared flow in the same sense that $Ri_{g,c} \approx 0.2$ represents an upper bound, the results suggest that the manifestation of a constant $\varGamma$ regime within stratified shear flows in the limit of low $Fr$ as argued by Maffioli et al. (Reference Maffioli, Brethouwer and Lindborg2016) and Garanaik & Venayagamoorthy (Reference Garanaik and Venayagamoorthy2019) occurs directly due to the intermittency of the flow as the ‘saturated’ flow cannot exceed critical conditions. The results again provide clear evidence for the concept that the self-organised criticality of stratified shear flow is linked with and arises directly due to the strong spatiotemporal intermittency of the flow. Although this concept has been discussed in past studies (Caulfield Reference Caulfield2020, Reference Caulfield2021; Mashayek et al. Reference Mashayek, Caulfield and Alford2021), to the best of the authors’ knowledge, ours is the first study to directly demonstrate this with DNS data. Furthermore, considering the collapse of the results irrespective of the external parameter set, time or vertical location, we believe this behaviour will display a degree of universality for a variety of forced stratified shear flows.
We also note that it becomes clear that for rare transient mixing events where  $Fr < Fr_c$, $\varGamma$ can significantly vary for a single measured value of $Fr$ depending on whether the composition of the flow is turbulent, quiescent or contains varied contributions from both flow regimes.
5.2. Interface-based parametrisation within the region of intermittency
We also investigate a  $Fr$-based parametrisation of $\varGamma$ within the turbulent/quiescent interface-based coordinate system. Figure 12 shows the bin-averaged values and the 2D p.d.f. of $\langle \varGamma \rangle |(z_i,t)$ plotted against corresponding bins of $\langle Fr \rangle |(z_i,t)$ constructed out of instantaneous measurements of $\varGamma (z_i,t)$ and $Fr(z_i,t)$, which are constructed from the instantaneous $z_i$ bin-averaged dimensional quantities, i.e. $B(z_i,t), \epsilon _K(z_i,t), E_K(z_i,t), N(z_i,t)$.
Bin-averaged values and 2D p.d.f.s of the flux coefficient  $\langle \varGamma \rangle |_I(z_i)$, plotted against corresponding bins of conditionally averaged $\langle Fr \rangle |_I(z_i)$ calculated within the $z_i$ turbulent/quiescent interface-based coordinate system. Bin-averaged values and 2D p.d.f. constructed with the temporal range of $t/T_{\tau }^0>1$. Solid diagonal lines indicate $\varGamma \propto Fr^{-1}$ and $\varGamma \propto Fr^{-2}$. Dashed vertical lines indicate $Fr =0.3,1$. Horizontal thin lines in all figures indicate $\varGamma = 0.2,0.33$. Legend same as figure 4(b).

The data for  $t/T_{\tau }^0<1$ are again excluded. For $0.3 \lesssim Fr \lesssim 1$ and $Fr \gtrsim 1$ the results show the same result as the horizontally averaged data with clear respective $\varGamma \sim Fr^{-1}$ and $\varGamma \sim Fr^{-2}$ regimes. This is consistent with our results in figures 6(a) and 9(c) which suggests that within both a $z$- and $z_i$-based coordinate system, sub-critical flow where $Fr \gtrsim 0.3$ may be considered almost entirely turbulent and, hence, we expect the same behaviour as the horizontally averaged data.
However, in contrast to our horizontally averaged results we observe non-monotonic behaviour of  $\varGamma$ in the left flank of the figure. Here the critical value of $Fr(z_i) \approx 0.3$ corresponds to a clear peak in the mixing efficiency consistent with the underlying theme of this study being the concept of optimal and most ‘efficient’ mixing under critical conditions defined by $Fr = 0.3$. Past this critical point, the mixing efficiency drops off slightly before plateauing to an ‘Osborne’ constant value at approximately $\varGamma \approx 0.2$, although this is somewhat unclear due to the significant scatter in the measurements of $\varGamma$ within this regime.
We note that the peak is most pronounced for our least intermittent case R400L0.5 and conversely most pronounced for the most intermittent case R400L2. This can be explained if we recall figure 7(c,d) where we observe that  $\varGamma$ rapidly declines as the free surface is approached due to the confinement effects of the upper boundary. Accordingly with reduced intermittency such as in case R400L0.5, the vertical location of the turbulent/quiescent interface where $\varGamma$ obtains its peak value is vertically shifted up the domain and the subsequent rapid drop in $\varGamma$ as the free surface is approached becomes more pronounced. Conversely, for case R400L2 the interface is appreciably below the free surface and its confinement effects such that the quiescent flow is able to display a constant $\varGamma$ regime for an extended vertical range.
The results here are consistent with the findings and arguments of Maffioli et al. (Reference Maffioli, Brethouwer and Lindborg2016) who similarly find a peak in the mixing efficiency at  $Fr = 0.3$ in their high-resolution DNS study. We note that although the nature of the mixing in their body-forced homogeneous DNS is appreciably different to ours being driven by the mean shear, we find their results conceptually consistent with our hypothesis that intermittency in stratified flows is responsible for the asymptotic nature of $\varGamma$ at low $Fr$. In their study, flow for which $Fr < 0.3$ and where they observe a constant $\varGamma$ regime corresponds to flow where $Re_B \approx {O}(10)$ and we expect strong intermittency. Conversely, their $Fr = 0.3$ case where they observe a peak in mixing efficiency corresponds to $Re_B \approx {O}(10^3)$ and, hence, we expect intermittency to be negligible. Accordingly, the results presented in this section provide further strong evidence not only for the concept of self-organised criticality manifesting due to the intermittency of the flow, but also for our hypothesis that within stratified flow the asymptotic behaviour of $\varGamma$ for $Fr \lesssim 0.3$ comes directly as a result of the intermittency and contributions from quasi-laminar quiescent flow. How this result pertains to a wide variety of stratified flows and at significantly higher Reynolds presents clear direction for future high-resolution DNS studies.
5.3. Underlying assumptions of the ‘intermediate’ mixing regime
In light of our results in figures 11 and 12 and the discussion presented in Mashayek et al. (Reference Mashayek, Caulfield and Alford2021) (henceforth denoted as MCA21) regarding the potential discrepancies of the ‘intermediate’  $\varGamma \sim Fr^{-1}$ scaling of Garanaik & Venayagamoorthy (Reference Garanaik and Venayagamoorthy2019) (henceforth denoted as GV19) and their assumptions of stratified shear flow, we explore this regime and the scaling arguments of both studies. In particular our data set for which the majority of the flow falls within $0.3 \lesssim Fr \lesssim 1$ ‘intermediate’ regime within a quasi-steady state allows us to explore this in more detail than previously reported in literature.
Central to the scaling arguments of MCA21 are two key assumptions. First, that within the critical mixing regime, the flow approaches a critical state defined by  $Ri_g \approx Ri_{g,c}$. Second, that buoyancy in stratified shear flows inherently never dominates the dynamics of the flow such that the mixing of the buoyancy field is ‘slaved’ to that of the momentum field resulting in $Pr_T = K_M/K_{\rho } \approx 1$ for all stages of the shear instability mixing cycle, where $K_M$ and $K_{\rho }$ are the eddy viscosity and diffusivity defined as
 \begin{equation} K_M = \frac{\langle -u'w' \rangle }{S}, \quad K_{\rho} = \frac{B}{N^2}. \end{equation}
 Figures 13(a) and 13(b) respectively show the ‘turbulent’ conditionally bin-averaged values and 2D p.d.f.s of  $\langle Ri_g \rangle |_T$ and $\langle Pr_T \rangle |_T$ plotted against corresponding bins of $\langle Fr \rangle |_T$ for all simulations. The plots are constructed analogously to figure 11. The results distinctly present confirmation of the two assumptions of MCA21. In agreement with our past analysis, it is clear from the high concentration of data that the flow organises towards a critical point of $Fr = Fr_c \approx 0.3$ and $Ri_g = Ri_{g,c} \approx 0.2$. For $Fr \ge 1$, we obtain the classic scaling of $Ri_g \sim Fr^{-2}$ for weakly stratified flow (Maffioli et al. Reference Maffioli, Brethouwer and Lindborg2016; Zhou et al. Reference Zhou, Taylor and Caulfield2017). For the ‘intermediate’ regime of $0.3 \lesssim Fr \lesssim 1$, the flow displays the transitional scaling of $Ri_g \sim Fr^{-1}$ between the weakly stratified and critical states as derived in IWAN22. For $Fr \lesssim 0.3$, we observe that $Ri_g$ seems to remain constant and become independent of $Fr$ in agreement with our scaling analysis in IWAN22. Furthermore, from the results it is clear that for all $Fr$, we obtain $Pr_T \approx 1$ as argued in MCA21, albeit with significant scatter in the left tail of the figure for $Fr \lesssim 0.3$ where the data set becomes quite scarce.
Bin-averaged values and 2D p.d.f.s of (a) the conditionally averaged gradient Richardson number within the turbulent data set  $\langle Ri_g \rangle |_T$, where the thin horizontal line indicates $Ri_g = 0.2$ and diagonal lines indicate $Ri_g \propto Fr^{-1}$ and $Ri_g \propto Fr^{-2}$, and (b) conditionally averaged turbulent Prandtl number within the turbulent data set $\langle Pr_T \rangle |_T$ plotted against corresponding bins of conditionally averaged $\langle Fr \rangle |_T$, where the thin horizontal line indicates $Pr_T = 1$. Bin-averaged values and 2D p.d.f.z constructed with the temporal range of $t/T_{\tau }^0>1$ and the vertical range of $0.2< z< z_{le}$. Vertical dashed lines indicate $Fr = 0.3,1$. Legend same as figure 4(b).

As discussed in MCA21, the scaling arguments of GV19 for the intermediate regime of  $B \sim E_K N$ (to be derived in more detail shortly) present an apparent contradiction of the $Pr_T \approx 1$ assumption. If we employ this scaling and initially assume that $E_K \sim \langle -u'w' \rangle$, we can show that
 \begin{equation} Pr_T = \frac{K_M}{K_{\rho}} = \frac{\langle -u'w' \rangle N^2}{B S} \sim \frac{\langle -u'w' \rangle N^2}{E_K N S} \sim \frac{N}{S} = Ri_g^{1/2}. \end{equation}
From the results presented in figure 13(a) this implies that  $Pr_T$ has an inverse and functional relationship with $Fr$ for $Fr > 0.3$. However, the results in 13(b) demonstrate this to be untrue.
We, hence, consider the arguments of GV19. They argued that the evolution of the buoyancy perturbation  $b'$ evolves due to a turbulent vertical displacement of a fluid parcel from its background stratification such that
 \begin{equation} b' \sim w'N^2 T_*,\end{equation}
where  $T_*$ is the time scale relative to the mixing dynamics of the local flow. Hence, by multiplying both sides of (5.7) by $w'$ we can obtain
 \begin{equation} b'w' \sim B \sim w'^2 N^2 T_* \sim E_K N^2 T_*.\end{equation}
Accordingly they argued that for the weakly stratified regime, inertial effects are dominant such that  $T_* = T_L$, where $T_L = E_K/\epsilon _K$ is the turbulent time scale. For the ‘intermediate’ regime, GV19 proposed that buoyancy dominates the evolution of $B$ such that $T_* = T_N$. Accordingly they derived
 \begin{equation} \varGamma = \frac{B}{\epsilon_K} \sim \frac{E_K N^2 T_L}{\epsilon_K} = \frac{E_K^2 N^2}{\epsilon_K^2} = Fr^{{-}2}, \end{equation}
for the weakly stratified regime and
 \begin{equation} \varGamma = \frac{B}{\epsilon_K} \sim \frac{E_K N^2 T_N}{\epsilon_K} = \frac{E_K N}{\epsilon_K} = Fr^{{-}1}, \end{equation}
for the intermediate regime. However, note that inherent within (5.7) lie two key assumptions. First, that the separation of vertical and horizontal scales is negligible such that  $w'^2 \sim E_K$. A similar assumption in (5.6) leads to $E_K \sim \langle -u'w' \rangle$. Second, considering the statistical nature of $B$, that the multiplication of the root-mean-square (r.m.s.) values of $b'_{{rms}}$ and $w'_{{rms}}$ corresponds to the correlation between their local values such that $b'_{{rms}}w'_{{rms}} \sim B$. We can directly investigate the validity of these assumptions by defining the ratios
 \begin{equation} C_1 = \frac{w'^2_{{rms}} }{E_K}, \quad C_2 = \frac{\langle -u'w' \rangle}{E_K}, \quad C_3 = \frac{B}{b'_{{rms}}w'_{{rms}}}.\end{equation}
 To test this, figure 14 shows the ‘turbulent’ conditionally bin-averaged values and 2D p.d.f.s of  $\langle C_1 \rangle |_T$, $\langle C_2 \rangle |_T$ and $\langle C_3 \rangle |_T$ plotted against corresponding bins of $\langle Fr \rangle |_T$. For the weakly stratified case of $Fr \gtrsim 1$, the assumptions are clearly valid and all three ratios approach a constant asymptotic value as buoyancy effects are negligible and the flow remains in a state of relative isotropy. However, for $Fr \lesssim 1$ the assumptions become distinctly invalid as all three ratios grow smaller with decreasing $Fr$ such that we can empirically observe
 \begin{equation} C_1 \sim C_2 \sim C_3 \sim \left\{ \begin{array}{@{}ll} \text{const.} & Fr \ge 1, \\ Fr^{1/2} & Fr \le 1. \end{array} \right. \end{equation}
Conceptually this is consistent with the stratified turbulence theory of Billant & Chomaz (Reference Billant and Chomaz2001) and Lindborg (Reference Lindborg2006) if we consider that  $Fr$ may be interpreted as a ratio of length scales such that
 \begin{equation} Fr = \left( \frac{L_O}{L_I} \right)^{2/3}.\end{equation}
Accordingly as  $Fr < 1$, we obtain $L_O < L_I$ such that buoyancy begins to constrain the vertical component of the largest energetic scales leading to large-scale anisotropy. Hence, we observe that the vertical and horizontal velocity scales diverge as seen in the evolution of $C_1$ and $C_2$. Similarly as $Fr$ grows smaller and $b'$ becomes increasingly affected by motions due to the resulting internal waves of the stable flow field (Itsweire et al. Reference Itsweire, Koseff, Briggs and Ferziger1993), we similarly observe $C_3$ to grow smaller. We note that for $Fr < 0.3$ there is significant scatter in the results as the data set becomes sparse, corresponding to the rare high stratification mixing events. However, it is still reasonably clear that a positive correlation continues to exist between $C_1,C_2,C_3$ and $Fr$. These results are consistent with the experimental findings of Ivey & Imberger (Reference Ivey and Imberger1991) who demonstrated that the correlation coefficient between the vertical density flux and r.m.s. values of vertical velocity and density fluctuations goes to zero as $Fr \rightarrow 0$.
Bin-averaged values and 2D p.d.f.s of (a)  $\langle C_1 \rangle |_T$, (b) $\langle C_2 \rangle |_T$ and (c) $\langle C_3 \rangle |_T$ as defined in (5.11a–c) within the turbulent data set plotted against corresponding bins of conditionally averaged $\langle Fr \rangle |_T$. Bin-averaged values and 2D p.d.f. constructed with the temporal range of $t/T_{\tau }^0>1$ and the vertical range of $0.2< z< z_{le}$. Solid diagonal lines in all figures indicate $C \propto Fr^{1/2}$. Vertical dashed lines indicate $Fr = 0.3,1$. Legend is the same as figure 4(b).

When considering the above results we must however be somewhat cautious in inferring a universal dependence of  $C_1,C_2,C_3$ on $Fr$ for all stratified flows. We note in our flow configuration, both $Fr$ and $Re_B$ are free parameters and as defined in Billant & Chomaz (Reference Billant and Chomaz2001) can be directly related through the expression
 \begin{equation} Re_B = Re_T Fr^2, \end{equation}
where  $Re_T = E_K^2/\nu \epsilon _K$ is the turbulent Reynolds number. As derived in IWAN22 it can be easily shown that $Re_T \sim Re_{\tau }$, such that for the majority of our flow, $Fr$ and $Re_B$ become strongly correlated. Figure 15(a) shows this clearly by plotting the conditionally bin-averaged values and 2D p.d.f. of $\langle Re_B \rangle |_T$ against $\langle Fr \rangle |_T$ for all simulations. In the left flank of the figure, the flow approaches its critical state at the intermittency boundary such that $Fr \approx 0.3$ and $Re_B \approx 10$. However, for the remainder of the flow, the results show distinct $Re_B \sim Fr^2$ behaviour with a clear upward vertical shift of the data for the $Re_{\tau } = 900$ case, consistent with the analysis above.
Bin-averaged values and 2D p.d.f.s of (a)  $\langle Re_B \rangle |_T$ plotted against $\langle Fr \rangle |_T$ and (b) $\langle C_2 \rangle |_T$ plotted against $\langle Re_B \rangle |_T$. Bin-averaged values and 2D p.d.f. constructed with the temporal range of $t/T_{\tau }^0>1$ and the vertical range of $0.2< z< z_{le}$. Solid diagonal line in (a) indicates $Re_B \propto Fr^{2}$. Vertical dashed lines in (a) indicate $Fr = 0.3,1$. Vertical dashed lines in (b) indicate $Re_B = 10^1,10^2,10^3$. Legend is the same as figure 4(b).

It is therefore unclear whether the decrease of  $C_1,C_2,C_3$ as $Fr < {O}(1)$ has a dependency on $Re_B$. To investigate this we plot the conditionally bin-averaged values and 2D p.d.f. of $\langle C_2 \rangle |_T$ against $\langle Re_B \rangle |_T$ in figure 15(b), constructed analogously to figure 13 but now binned by $Re_B$. The results indeed show that $C_2$ similarly shows a positive correlation with $Re_B$ for $Re_B \lesssim {O}(10^3)$. Although subtle, there is a clear shift to the right-hand side for the R900L1 case, and it becomes clear that the transitional value of $Re_B$ for the asymptotic regime displays a clear dependence on $Re_{\tau }$. In contrast, if we recall figure 14(b), it is clear that a singular value of $Fr \approx 1$ determines this transition for all simulations. As such we argue that the large-scale anisotropy which causes decreasing behaviour of $C_1,C_2,C_3$ is determined by $Fr$ (or $Ri_g$) as argued by Brethouwer et al. (Reference Brethouwer, Billant, Lindborg and Chomaz2007) rather than $Re_B$. However, at the modest $Re_{\tau }$ range explored within this study we cannot confirm this for all $Re_{\tau }$. Note that, for brevity, we have chosen to display $C_2$ alone as out of the three constants the results have the least scatter and highlights this behaviour most clearly.
Returning now to the parametrisation of  $\varGamma$, we can now rewrite (5.8) explicitly incorporating the above assumptions:
 \begin{equation} B \sim C_1C_3 E_KN^2 T_*.\end{equation}
Hence, if we take the assumption of MCA21 that active turbulence in stratified shear flow may always be considered ‘weakly stratified’ for all  $Fr$, we take $T_* = T_L$ to obtain
 \begin{equation} \varGamma = \frac{B}{\epsilon_K} \sim \frac{C_1C_3 E_KN^2 T_L}{\epsilon_K} = C_1 C_3 Fr^{{-}2}. \end{equation}
Accordingly for  $Fr > 1$, the flow approaches relative isotropy and buoyancy acts as a passive scalar such that $C_1 \sim C_3 \sim \text {const.}$ and, hence, we recover the $\varGamma \sim Fr^{-2}$ scaling of Maffioli et al. (Reference Maffioli, Brethouwer and Lindborg2016) and GV19.
For the  $0.3 \le Fr \le 1$ ‘intermediate’ transitional regime, the flow begins to develop the shear and large scale anisotropy to reach its critical and ‘optimal’ state such that $C_1 \sim C_3 \sim Fr^{1/2}$. Accordingly, we obtain
 \begin{equation} \varGamma \sim C_1 C_3 Fr^{{-}2} \sim Fr^{1/2}Fr^{1/2}Fr^{{-}2} \sim Fr^{{-}1}, \end{equation}
the same as the results presented in GV19 and directly supported by our results in this study. We now directly reconcile this with the primary assumption of MCA21 by rewriting (5.6) using (5.11a–c) and (5.15) to obtain
 \begin{equation} Pr_T = \frac{K_M}{K_{\rho}} = \frac{\overline{-u'w'} N^2}{B S} \sim \frac{1}{C_1 C_3} \frac{\overline{-u'w'}}{E_K} \frac{N^2}{N^2} \frac{T_S}{T_*} \sim \frac{C_2}{C_1 C_3} \frac{T_S}{T_L}, \end{equation}
where  $T_S = 1/S$ is the shear time scale. We also recall that $Ri_g$ and $Fr$ may be interpreted as a ratio of time scales such that
 \begin{equation} Ri_g = \frac{T_S^2}{T_N^2}, \quad Fr = \frac{T_N}{T_L}. \end{equation}
Accordingly, from the results in figure 10(a) we obtain
 \begin{equation} Ri_g \sim Fr^{{-}2} \rightarrow T_S/T_L = \text{const.}, \quad Fr \ge 1, \end{equation}
and
 \begin{equation} Ri_g \sim Fr^{{-}1} \rightarrow T_S/T_L \sim Fr^{1/2}, \quad 0.3 \le Fr \le 1. \end{equation}
Hence, for the  $Fr \ge 1$ regime we recall that $C_1 \sim C_2 \sim C_3 \sim \text {const.}$ to obtain
 \begin{equation} Pr_T \sim \frac{C_2}{C_1 C_3} \frac{T_S}{T_L} \sim \text{const.}, \end{equation}
and for the intermediate regime we recall that  $C_1 \sim C_2 \sim C_3 \sim Fr^{1/2}$ to obtain
 \begin{equation} Pr_T \sim \frac{C_2}{C_1 C_3} \frac{T_S}{T_L} \sim \frac{Fr^{1/2}}{Fr^{1/2} Fr^{1/2}} Fr^{1/2} \sim \text{const}. \end{equation}
This is consistent with our observations that  $Pr_T \approx 1$ across both the weakly stratified and intermediate regimes. Hence, we reconcile a $\varGamma \sim Fr^{-1}$ mixing regime with the $Pr_T \approx 1$ assumption of MCA21 by accounting for the large-scale anisotropy of the flow at $Fr \lesssim {O}(1)$. For the super-critical regime of $Fr < 0.3$ where $Ri_g$ becomes constant, we hence expect no correlation between $T_S$ and $T_L$. Due to the sparsity of data and scatter of our results in figures 9 and 10 within this regime in our study, it becomes somewhat unclear whether $Pr_T$ would remain constant with further decreasing $Fr$. However, as $Fr \approx 0.3$ represents a critical state for the stationary flow, we expect the infrequent deviations from this state to be relatively small and, hence, the $Pr_T \approx 1$ assumption to hold.
As such our results and analysis directly support the arguments of Caulfield (Reference Caulfield2021) that vigorous turbulence in stratified shear flow should never be considered ‘strongly stratified’ in the same sense as the LAST regime where buoyancy effects dominate the flow dynamics to leading order. However, our results distinctly show that for  $Fr \le 1$, the assumption that buoyancy acts purely as a passive scalar is also invalid. The results suggest, that as argued by GV19, the emergence of a $\varGamma \sim Fr^{-1}$ intermediate mixing regime indeed manifests due to buoyancy beginning to influence flow dynamics. However, our results suggest that this does not occur due to buoyancy playing a leading-order role in the evolution of $b'$ and, hence, $B$. Rather, consistent with previous studies (Ivey & Imberger Reference Ivey and Imberger1991; Jacobitz, Sarkar & Atta Reference Jacobitz, Sarkar and Atta1997; van Hooijdonk et al. Reference van Hooijdonk, Clercx, Ansorge, Moene and van de Wiel2018; Portwood, de Bruyn Kops & Caulfield Reference Portwood, de Bruyn Kops and Caulfield2022), this occurs due to the secondary effect of buoyancy and shear distorting the large scales of the flow when $Fr \le 1$ which acts to modify both the buoyancy and momentum field towards an ‘optimal’ anisotropic state.
6. Conclusions
In summary, we have investigated the behaviour of spatiotemporal intermittency in our DNS of stratified open channel flow due to the suppression of turbulence through the stabilising effects of buoyancy. In particular, our study has focused on the prediction of the vertical intermittency profile and on the effect of the inherent intermittency in stratified shear flows on the accurate parametrisation of the flux coefficient  $\varGamma$.
By adapting the density inversion criterion method of PKTSC16 to our inhomogeneous flow, we have been able to robustly separate the flow into regions of active turbulence defined by  $Re_B \gtrsim {O}(10)$ and the surrounding quiescent fluid which approaches a quasi-laminar state. Our method demonstrates that we are able to construct our reference state of ‘fully turbulent’ flow from a single instantaneous realisation of the flow, provided a sufficient vertical range emerges in the flow where $Re_B > {O}(100)$.
We subsequently find our flow configuration modelled as a canonical representation of radiatively heated stratified river flows in the framework of Williamson et al. (Reference Williamson, Armfield, Kirkpatrick and Norris2015) is distinctly defined by a intermittency profile that is highly inhomogeneous in the vertical direction that results from the spontaneous formation of an interface separating the upper quiescent flow from the turbulent bulk flow. We quantify this local intermittency through a depth-varying turbulent volume fraction  $\gamma$. The flow displays a fully turbulent and weakly stratified lower region near the wall defined by $\gamma = 1$, $Re_B > {O}(100)$ and $Fr > {O}(1)$. Conversely, at our parameter range (with the exclusion of our most weakly stratified case R400L0.5) the region at the top free surface transitions into a fully quiescent quasi-laminar state defined by $\gamma = 0$, $Re_B < {O}(1)$ and $Fr \ll {O}(1)$. The central bulk flow hence develops as a region of vertically varying intermittency separating the two regions. By applying local M-O scaling, we find that $\gamma$ is well predicted by a locally defined Obhukov length (normalised in wall units) $\varLambda ^+$ across all simulations and their respective external bulk parameter set. We have found that in direct agreement with the analysis of Chung & Matheou (Reference Chung and Matheou2012), the transition away from the fully turbulent regime occurs at $\varLambda ^+ \approx 260$, whereas the flow approaches quasi-laminar conditions at $\varLambda ^+ \approx 2.5$. As such, our results add further evidence that the M-O framework is highly applicable for the prediction of intermittency in a variety of stratified shear flows where the flow exists in a state of balance between the production of turbulence through the mean shear and suppressing nature of buoyancy and viscosity.
We find that within the region of intermittency, the background stratification  $N$ and shear $S$ are marginally lower in the ‘turbulent’ flow relative to the surrounding quiescent fluid as the suppression of the turbulent fluxes causes the quiescent flow to develop steeper mean gradients such that the total buoyancy and momentum fluxes are in balance with the forcing terms of the flow. Accordingly we find this region to be described by a critical value of $Ri_{g,c} \approx 0.2$ and where the turbulent and quiescent flow organises towards local $Ri_g$ values marginally smaller and larger, respectively, than the conceptual critical value for stability suggesting the flow exists in a state of ‘marginal instability’ as argued by Thorpe & Liu (Reference Thorpe and Liu2009). This region is notably defined by vigorous KHI-driven mixing that form in these critical conditions and where we find that the dominant energetic terms within the ‘turbulent’ flow $P,B,\epsilon _K$ all come to a local maxima. In agreement with the concept of optimal mixing under critical conditions as argued by Mashayek et al. (Reference Mashayek, Caulfield and Alford2021), we find that within this region the turbulent flow is described by $\varGamma \approx 0.2\unicode{x2013}0.33$. Considering the distinct vertical inhomogeneity in the profiles of the mean and turbulent flow, our results strongly suggest as to a degree of universality for the self-organisation of stratified shear flows towards this ‘optimal’ state. Furthermore, we have found that within this region of critical flow, the stationary profiles of $Fr$ within the ‘turbulent’ flow all clearly converge to a clear lower critical limit of $Fr_c \approx 0.3$ in direct agreement with the transitional value towards an asymptotic regime proposed by Maffioli et al. (Reference Maffioli, Brethouwer and Lindborg2016). Hence, we have provided further evidence for the arguments of Caulfield (Reference Caulfield2021) that active and vigorous turbulence in stratified shear flow should not be considered ‘strongly stratified’ in the same theoretical sense as the LAST regime due to a clear lower limit on $Fr$.
$Fr$.
By considering the flow from the  $z_i$ turbulent/quiescent interface reference coordinate system, we find that the thickness of the interfacial layer separating the two regimes to scale with the Ellison length $L_E$. This being in direct agreement with our visual observations of KHI overturning within this region. In particular we find that the critical values of $Ri_{g,c} \approx 0.2$, $Fr_c \approx 0.3$ and the peak in $\varGamma$ occur directly at the lower bound of the interfacial layer. Accordingly our results directly suggest that criticality and intermittency are intrinsically linked within stratified open channel consistent with the concept of self-organised criticality in stratified shear flows as argued by Smyth et al. (Reference Smyth, Nash and Moum2019).
By examining the correlations between horizontal averages of  $Fr$ and $\varGamma$ across the conditionally averaged data sets we show that in the limit of low $Fr$,
$Fr$,  $\varGamma$ shows continued dependence on $Fr$ within the ‘turbulent’ flow such that the flow continues to display $\varGamma \sim Fr^{-1}$ behaviour for $Fr< Fr_c$. Conversely, within the quiescent regions of the flow we find $\varGamma$ is independent of $Fr$ for the full parameter range presented and maintains a constant value of $\varGamma \approx 0.2\unicode{x2013}0.33$. The emergence of an asymptotic constant $\varGamma$ regime for $Fr \le 0.3$ in the full data set comes directly as a result of the intermittency of the flow and increasing contributions to measurements of $Fr$ and $\varGamma$ from the surrounding quiescent fluid. We argue that the observation of a ‘saturated’ $\varGamma$ regime in numerous past studies of stratified shear flow is fundamentally linked to the inherent intermittency of the flow at finite $Re_B$.
Within the turbulent patches of the flow, we observe the emergence of a  $\varGamma \sim Fr^{-1}$ intermediate regime for $Fr \le 1$ manifests due to the separation of the vertical and horizontal velocity scales within such patches as buoyancy and the mean shear distorts the flow towards an anisotropic state to facilitate efficient mixing through shear instabilities. As such, our results present evidence for the arguments of MCA21 that suggest when considering energetic turbulent patches within stratified shear flow, buoyancy does not play a leading-order role in the evolution of the mixing rate but rather it is ‘slaved’ to the mixing of momentum such that $Pr_T \approx 1$ for all $Fr$.
$Fr$.
Acknowledgements
The authors would like to gratefully acknowledge the National Computational Infrastructure (NCI) and the Sydney Informatics Hub and high-performance computing cluster, Artemis, at the University of Sydney, for providing the high-performance computing resources and services that have been crucial to this paper.
Decleration of interests
The authors report no conflict of interest.


 Open access