


INTRODUCTION
Seasonal snow covers up to 35% of Earth surface (Miteva, Reference Miteva, Margesin, Schinner and Marx2007) and, consequently, has a strong impact on the hydrological cycle, the mass balance of glaciers and the climate (Singh and others, Reference Singh, Singh and Harutashya2011). In addition, the feedback mechanisms between snow, ice and the atmosphere influence the whole biosphere (Jones, Reference Jones1999). Thus, snow and ice play a key role in the dynamics of a large number of ecosystems worldwide (Groisman and Davies, Reference Groisman, Davies, Jones, Pomeroy, Walker and Hoham2001).
Snow cover can be described as an independent ecosystem, which has drawn attention in recent years (Jones, Reference Jones1999). Bacterial communities inhabit the snow cover and have been investigated in Alpine (Felip and others, Reference Felip, Sattler, Psenner and Catalan1995), Antarctic (Carpenter and others, Reference Carpenter, Lin and Capone2000; Lopatina and others, Reference Lopatina, Krylenkov and Severinov2013) and Sub Arctic locations (Larsen and others, Reference Larsen, Grogan, Jonasson and Michelsen2007).
A detailed review of characteristics of this ecosystem and the microorganism interaction occurring in it is reported by Maccario and others (Reference Maccario, Sanguino, Vogel and Larose2015). Moreover, Cameron and others (Reference Cameron2015) described the microbial communities of surface snow on the Greenland Ice sheet using high throughput (Illumina) 16S rRNA sequencing and found that snow communities were dominated by Proteobacteria, Acidobacteria and Bacteroidetes in all sampled sites. Similar results were obtained by Hell and others (Reference Hell2013) on Larsbreen Glacier (Svalbard) using 454 pyrosequencing. Møller and others (Reference Møller, Søborg, Al-Soud, Sørensen and Kroer2013) analyzed the bacterial communities of the Greenland snowpack through pyrosequencing of 16S rRNA and found that different snow layers within the snow pack hosted different microbial communities. In particular, the highest diversity was observed in the upper snow layers where Proteobacteria, Bacteroidetes and Cyanobacteria dominated, while in the deepest layer, large percentages of Firmicutes and Fusobacteria were found. Michaud and others (Reference Michaud2014) used pyrosequencing to describe the microbial communities in snow samples near Concordia base in the interior of Antarctica (75°06′S, 123°20′E), which, again, were dominated by Proteobacteria and Bacteroidetes, with rather large abundance of Cyanobacteria. Thus, the same phyla seem to dominate snow pack bacterial communities in both hemispheres. Antarctic snow communities sampled near four stations (Druzhnaja 69°44′S, 72°42′E; Leninsgradskaja 69°30′S, 159°23′E; Mirny 66°33′S, 93°01′E and Progress 69°23′S, 76°23′E) were also analyzed with Illumina sequencing by Lopatina and others (Reference Lopatina2016). Not surprisingly, the most abundant classes in all samples were Alphaproteobacteria, Betaproteobacteria, Gammaproteobacteria, Sphingobacteria, Flavobacteria, Cytophagia and Actinobacteria together with the strains classified as Chloroplast/Cyanobacteria. Interestingly, these communities were compared with one another and the samples collected at the Progress station were found to differ from the other ones: the most abundant class in Progress samples was Flavobacteria, while in all the other ones the communities were dominated by Beta- and Gamma-proteobacteria. Other studies confirmed the dominance of few phyla in snow packs. For instance, Amato and others (Reference Amato2007) with the 16S rRNA sequencing isolated several bacterial strains from snow sampled near the station of Ny-Ålesund and on the Kongsvegen Glacier (Svalbard) and identified Proteobacteria, Firmicutes and Actinobacteria as the dominant phyla.
Bacterial communities of snow packs on mountains outside the Polar areas seem dominated by the same phyla found in Polar areas. However, the number of studies focused on these environments is even smaller. Wunderlin and others (Reference Wunderlin, Ferrari and Power2016) described the microbial communities hosted in the snow on Swiss and Australian Alps by Illumina sequencing and found that the communities were dominated by Proteobacteria and Bacteroidetes independently from the sampling site. Similarly, Liu and others (Reference Liu2006, Reference Liu2009) using clone libraries found that Proteobacteria, Bacteroidetes and Actinobacteria were the dominant phyla in snow sampled from the Tibetan plateau. Segawa and others (Reference Segawa2005) investigated snow from the Tateyama Mountains (Japan) analyzing clone libraries of the 16S rRNA gene. A large part of the retrieved sequences belonged to Alpha-, Beta- and Gamma-proteobacteria, particularly to the genera Flexibacter, Cytophaga, Bacteroides, Bacillus/Clostridium and Actinobacteria. Moreover, they isolated various organisms such as Aquaspirillum, Burkholderia, Methylobacterium, Hemophilus, Serratia (Proteobacteria), Corynebacterium, Propionibacterium (Actinobacteria), Staphylococcus and Streptococcus (Firmicutes). Meola and others (Reference Meola, Lazzaro and Zeyer2015) analyzed the bacterial composition of a snowfall enriched with Saharan dust on the Swiss Alps by Illumina sequencing and identified Proteobacteria as the most abundant phylum, in particular Betaproteobacteria (genera Variovorax, Polaromonas and Delftia), followed by Actinobacteria, Bacteroidetes, Firmicutes, Chloroflexi, Cyanobacteria and Gemmatimonadetes. Finally, Rime and others (Reference Rime, Hartmann and Frey2016) reported that the bacterial communities in the snow from the European Alps significantly differed from those found on the surface of the same glacier and in proglacial soils.
From this short review of the snow microbial literature, it appears that most studies (except Meola and others, Reference Meola, Lazzaro and Zeyer2015 and Wunderlin and others, Reference Wunderlin, Ferrari and Power2016) investigating snow cover bacterial communities focused on one site only and were conducted with approaches that differed from site to site. These differences in the methodologies partly limited the possibility of comparing results among studies and, consequently, our understanding of the differences in the bacterial communities and the ecological processes in the snow cover in different areas of the world.
Variability in the structure of snow bacterial communities can be due also to the different physical and chemical features of the air mass that originated the snowfall, which, in turn, depend on the geographical source region and the air mass trajectory (Mohler and others, Reference Mohler, DeMott, Vali and Levin2007; Fierer and others, Reference Fierer2008; Chuvochina and others, Reference Chuvochina2011). Indeed, eolian dust particles act as a long-range vector for microorganisms (Yamaguchi and others, Reference Yamaguchi, Ichijo, Sakotani, Baba and Nasu2012) and strong winds can lift soil particles and the associated microorganisms above the boundary layer, particularly over arid lands (Kaspari and others, Reference Kaspari2009). The distance and trajectory of these particles and the associated microbes depend on factors such as wind speed and land topography (Womack and others, Reference Womack, Bohannan and Green2010). An example of the influence of air sources on microbial communities was observed by Peter and others (Reference Peter, Hörtnagl, Reche and Sommaruga2014) who found a significant difference between the bacterial assemblages of rain samples with and without Saharan dust: rain events with Atlantic or continental origins were dominated by Betaproteobacteria, whereas those with Saharan dust intrusions were dominated by Gammaproteobacteria. The high diversity and evenness observed in all samples, however, suggests that different sources of bacteria contributed to the airborne assemblages. During long-distance transport at high altitudes, microorganisms are also potentially exposed to harsh conditions that may determine a strong selection by killing the strains less adapted to cold temperature and intense radiation (Smith and others, Reference Smith2013). Finally, precipitation forces the deposition of microbes to the ground. Importantly, some airborne microbes can promote precipitation as they act as cloud condensation nuclei or ice nuclei (Mohler and others, Reference Mohler, DeMott, Vali and Levin2007). This hypothesis is supported by the observation that most ice nuclei in snow samples are inactivated by a 95°C heat treatment, confirming that the bacteria presence is fundamental in the ice nucleation processes (Christner and others, Reference Christner2008).
A contribution to our understanding of the factors that affect the structure of bacterial communities of the snow could derive by studies conducted with the standardized methods and comparing snow bacterial communities from different areas of the world. This work presents the results of such an investigation conducted in four different mid-latitude mountain areas of the world: Alps, Eastern Anatolia, Karakoram and Himalaya. Snow samples at these sites were collected during field campaigns conducted for other glaciological and microbiological purposes (see e.g. Ambrosini and others, Reference Ambrosini2017, Azzoni and others, Reference Azzoni2016, Reference Azzoni2017, Franzetti and others Reference Franzetti2016, Reference Franzetti2017a, Reference Franzettib, Pittino and others, Reference Pittino2018). However, all samples were collected and processed according to the same protocol and analyzed with high throughput (Illumina) sequencing. This uniformity in the methods of analysis allows a robust comparison among the bacterial communities from different geographical areas. To the best of our knowledge, this is the first analysis of snow bacterial communities ever performed in Eastern Anatolia and Karakoram.
MATERIALS AND METHODS
Study area, field methods and environmental data
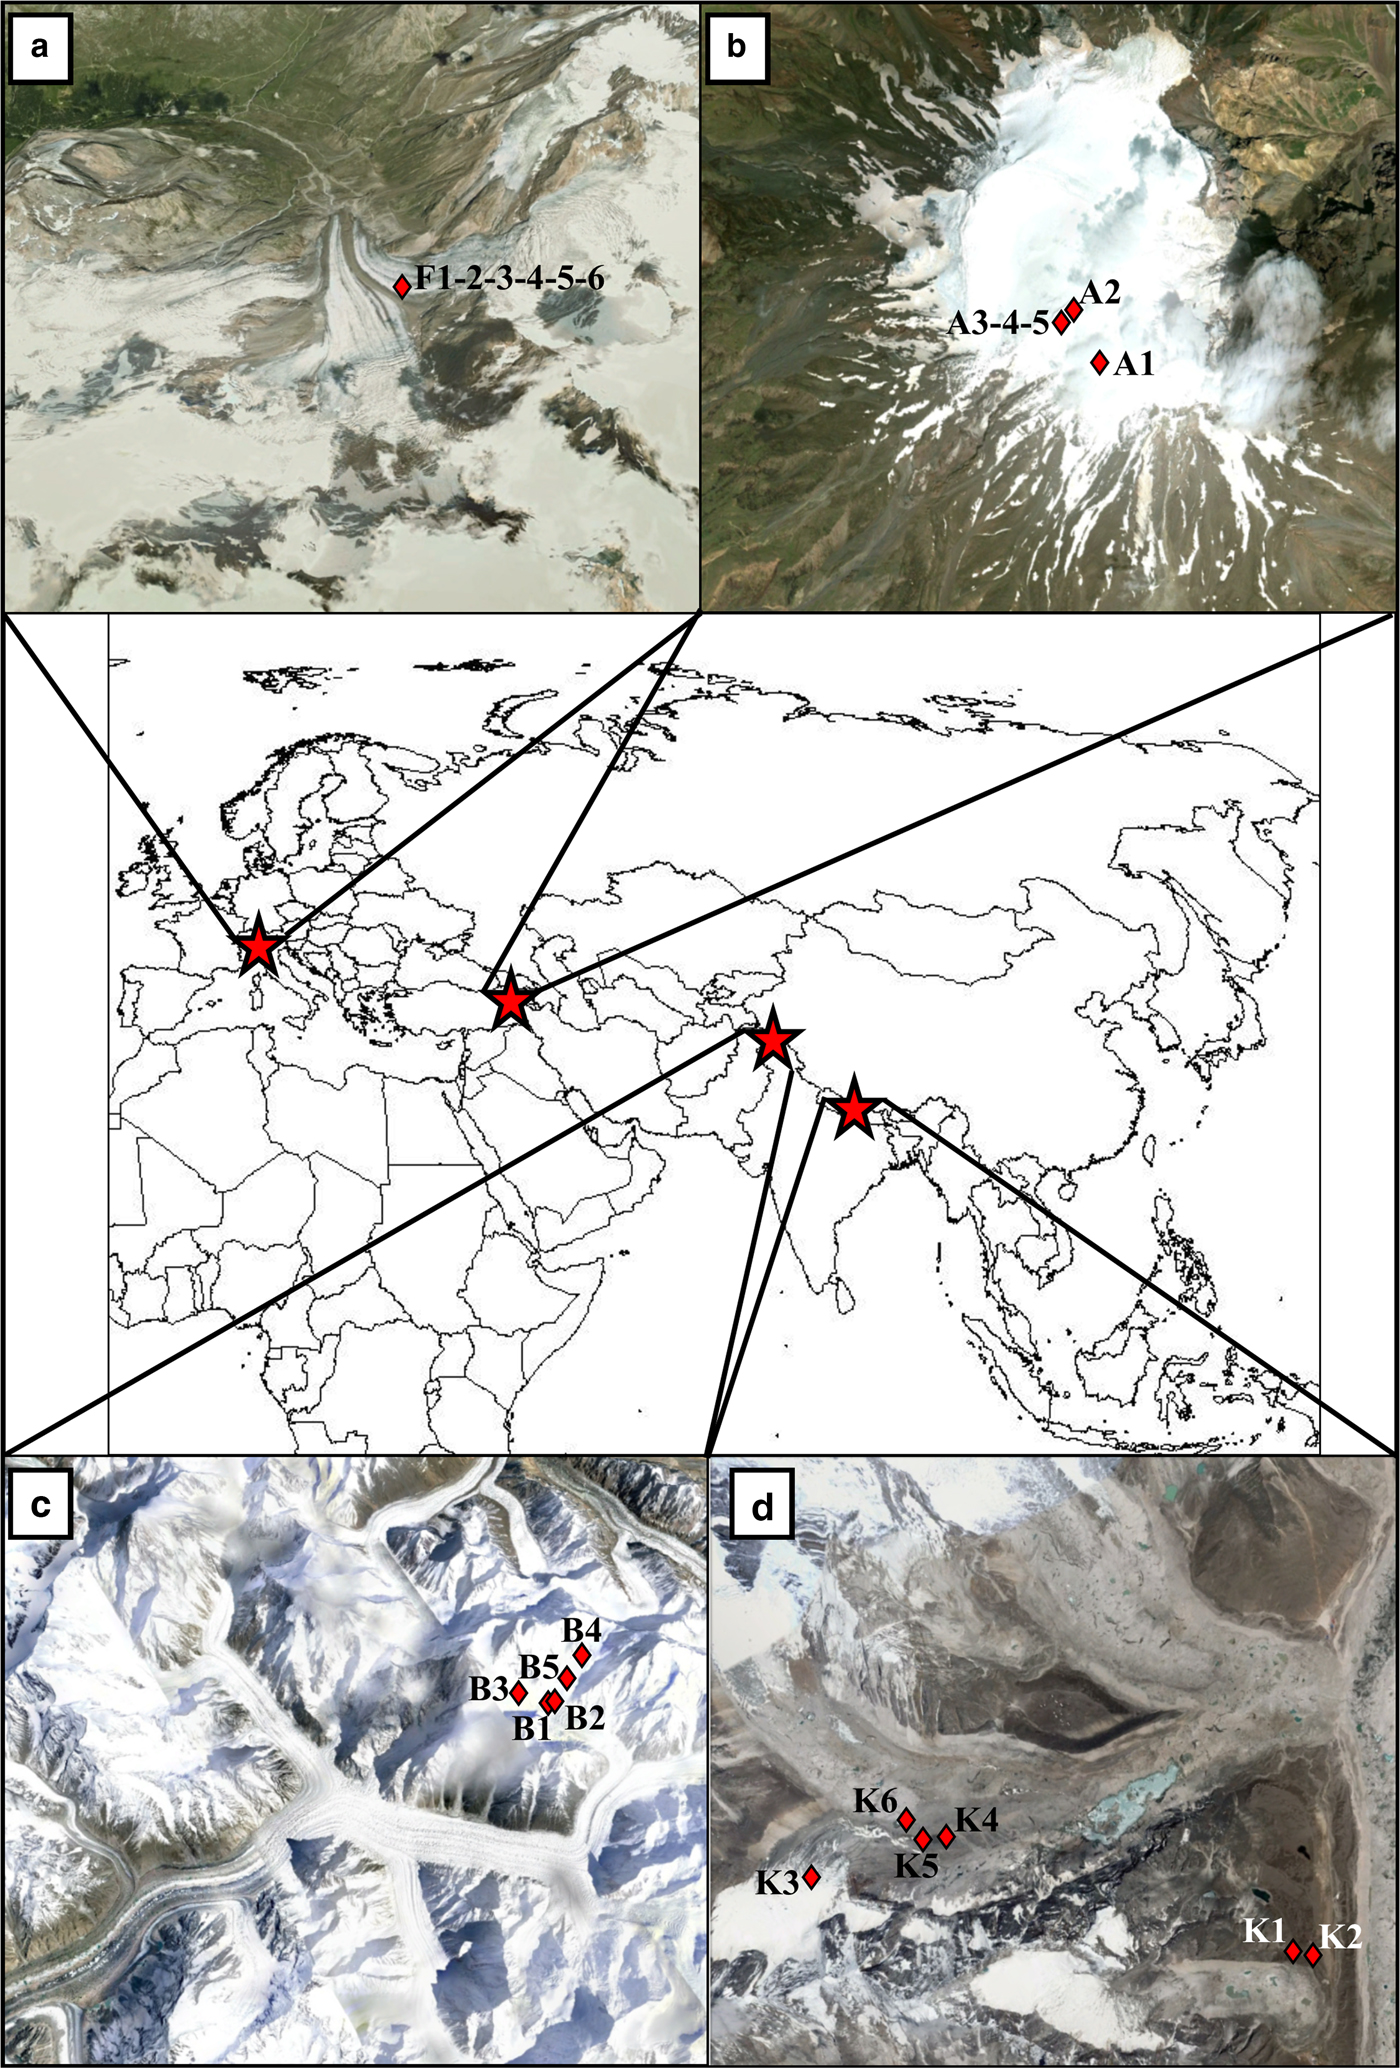
We collected snow samples during field campaigns conducted on four high-elevation areas: Alps (Forni Glacier, Central Alps, Italy, 2702 m a.s.l.), Eastern Anatolia (ice cap on the summit of Ararat/Ağri Daği, Turkey, 5020–5132 m a.s.l.), Karakoram (Baltoro Glacier, Central Karakoram, Pakistan, 5591–5861 m a.s.l.) and Himalaya (Khumbu Valley, Nepal, 5000–5507 m a.s.l.) (Fig. 1). In the first three sites, the samples were collected on the glacier surface only, whereas in the Khumbu Valley snow was sampled both on glacier (Changri Nup Glacier) and in an ice-free area near the Pyramid International Laboratory/Observatory. In this latter case, we assume no difference in the characteristics of the snow microbial assemblage between glacierized and ice-free area because in the Khumbu Valley snow samples were collected fresh immediately after precipitation. Overall, we collected 23 samples of snow during expeditions in 2013 and 2014. Specifically, we collected six old snow samples from four different snow events on Forni Glacier, five old snow samples on Ararat from undated snow events, five fresh snow samples from two separate snowfalls on Baltoro Glacier and seven fresh snow samples from two different snowfalls in Khumbu Valley (see Table 1 for more details on sampling dates and locations). The snow, fresh or old, depending on the prevailing conditions during each expedition, was aseptically collected in the field in sterilized aluminum boxes or in sterilized plastic bags. The snow shovel used for snow collection was cleaned with alcohol immediately before collecting each sample to minimize the risk of cross contamination, which is limited to the samples collected in the same sampling site. Samples were then transported to the base camp, hut or laboratory where they were melted and filtered on nitrocellulose filters with nominal porosity of 0.42 µm. The filtered water volume for each sample ranged between 1.5 and 2 L.
Geographical position of four sampled areas. Detailed maps (from) report the position of each sampling site (red diamonds) on Forni Glacier, Italy (a), Ararat/Ağri Daği, summit ice cap glacier, Turkey (b), Baltoro Glacier, Pakistan (c) and Khumbu Valley, Nepal (d). Multiple numbers indicate multiple samples collected in the same site. Images were taken from Google Earth™. The snow cover reported in the pictures does not correspond to that at the time of sample collection.
Details of snow samples collected in the four areas. The Roman numbers between brackets under the area of origin of each air mass refers to the back trajectories reported in Figure 5. Statistical analyses were performed only on samples with more than 3000 sequences

16S rRNA gene fragment sequencing, sequence processing and data analysis
For each sample, total DNA was extracted using the fastDNA Spin for soil kit (MB Biomedicals, Solo, OH, USA) according to the manufacturer's instructions. To characterize the bacterial diversity in the communities, the V5-V6 hypervariable regions of 16S rRNA gene were sequenced by using a MiSeq Illumina (Illumina Inc., San Diego, CA, USA) with a 250 bp × 2 paired-end protocol and PCR-amplified using 783F and 1046R primers (Huber and others, Reference Huber2007; Wang and Qian, Reference Wang and Qian2009). Preliminary tests at different dilutions of the DNA template and with black controls were carried out to detect optimal PCR conditions for the amplification, which resulted to be the following ones: initial denaturation at 94°C for 4 min; 28 cycles at 94°C for 50 s, 47°C for 30 s and 72°C for 45 s and a final extension at 72°C for 5 min. The amplicons were purified with the Wizard® SV Gel and PCR Clean-up System (Promega Corporation, Madison, WI, USA) and purified DNA was quantified using Qubit® (Life Technologies, Carlsbad, CA, USA). Groups of 9–12 amplicons bearing different barcode pairs were pooled together to build a single library. Further preparation with the addition of standard Nextera indices (Illumina, Inc., San Diego, CA, USA) and sequencing were carried out at Parco Tecnologico Padano (Lodi, Italy).
Reads from sequencing were demultiplexed according to the internal barcodes. The Uparse pipeline was used for the following elaborations (Edgar, Reference Edgar2013). Forward and reverse reads were merged with perfect overlapping and quality filtered with default parameters. Singleton sequences (i.e. sequence appearing only one time in the whole dataset) were removed from the whole dataset. Operational Taxonomic Units (OTUs) were defined on the whole dataset clustering the sequences at 97% sequence identity and defining a representative sequence for each cluster. The abundance of each OTU was estimated by mapping the sequences of each sample against the representative one and the taxonomic classification of the OTUs representative sequences was obtained by using RDP classifier (Wang and others, Reference Wang, Garrity, Tiedje and Cole2007).
Statistical analyses
To avoid any bias given by the different numbers of sequences retrieved in each sample, we randomly picked 3000 sequences from each sample (Table 1), and calculated alpha-diversity indexes on this dataset. Samples B1, B2 and K7 had less than 3000 reads, which we considered the minimum coverage for running analyses. These samples were therefore discarded from all the analyses. We used the number of OTUs as an index of alpha-diversity at each sample, and the Gini index to evaluate the evenness (Gini, Reference Gini and Cuppini1912). The Gini index is a measure of statistical dispersion that ranges from 0 to 1, with increasing values indicating lower evenness (Wittebolle and others, Reference Wittebolle2009). The comparison of the number of OTUs among samples from different areas was performed with a generalized linear model (GLM) assuming a Poisson error distribution and corrected for overdispersion, while the analysis of the Gini index was performed by a generalized least-squares (GLS) model similar to an ANOVA test, but accounting for heterogeneity of variance among samples (Zuur and others, Reference Zuur, Hilbe and Ieno2013). Both the Poisson GLM and the GLS were followed by post-hoc tests (Tukey method).
Analyses of community structure (beta-diversity) were based on subsets of 10 000 sequences randomly extracted from the whole set of sequences for those samples with more than 10 000 sequences, and on the number of sequences of each OTU normalized to 10 000 for the three samples with less than 10 000 sequences (Table 1). We explored similarity among community structures by a cluster analysis performed with the complete linkage method on the Hellinger distances among samples calculated using OTU abundances (Legendre and Legendre, Reference Legendre and Legendre1998; Borchard and others, Reference Borchard, Gillet and Legendre2011). In addition, we used redundancy analysis (RDA) to test if the structure of the Hellinger-transformed bacterial communities differed among sampling areas (Legendre and Legendre, Reference Legendre and Legendre1998; Borchard and others, Reference Borchard, Gillet and Legendre2011). We could not enter in the analyses variation in other conditions like e.g. snow pH, sampling altitude or snow age because of (i) the large variation in these parameters among sampling areas and (ii) the rather small number of samples collected at each region. Consequently, sampling area actually summarizes almost all the variation in the other parameters, while small sample size prevented any within-region analysis. Post-hoc pairwise comparisons between locations were performed by pairwise RDAs, whose significance was adjusted according to the false discovery rate (FDR) procedure (Benjamini and Yekutieli, Reference Benjamini and Yekutieli2001). The dataset rarefied to 10 000 sequences per sample was used also to assess the bacterial orders generally more abundant in all samples. All statistical analyses were performed in R 3.1.3 (R Core Team, 2015) with the nlme (Pinheiro and others, Reference Pinheiro, Bates, DebRoy and Sarkar2016), vegan (Oksanen and others, Reference Oksanen2016) and multtest (Pollard and others, Reference Pollard, Dudoit, van der Laan, Gentleman, Carey, Huber, Irizarry and Dudoit2005) libraries.
Back trajectory definition
The back trajectories of the air masses that generated the sampled snowfalls were estimated using the Hybrid Single Particle Lagrangian Integrated Trajectory (HYSPLIT) model developed by the Air Resources Laboratory of the National Oceanic and Atmospheric Administration (NOAA) (Stein and others, Reference Stein2015; http://ready.arl.noaa.gov/HYSPLIT.php). This tool is widely applied in climatological analyses with a particular focus on snowfall characterization and dust provenance (Shahgedanova and others, Reference Shahgedanova, Kutuzov, White and Nosenko2013; Mayer and others, Reference Mayer2014) or pollutant dispersion (Oh, Reference Oh2015). The back trajectory analysis has been widely used also in air microbiology studies to determine origin and sources of air microbial communities (Griffin and others, Reference Griffin, Westphal and Gray2006; Reference Griffin, Gray, Borden and Shinn2007; Smith and others, Reference Smith2013). The model was run for analyzing the trajectories of air masses starting from 72 h before each event at specific elevations for each area (i.e. 3000 m a.s.l. for the Forni Glacier, 5000 m a.s.l. for Baltoro Glacier and Khumbu Valley; we did not reconstruct back trajectories for Ararat/Ağri Daği, see below). For each event, the output of the model consisted of 27 different possible trajectories (‘ensemble technique’, Gneiting and Raftery, Reference Gneiting and Raftery2005) performed using slightly different initial meteorological conditions. A low spread between these trajectories is consistent with a good definition of the origin of the air mass (Stein and others, Reference Stein2015). We have chosen a 72 h time-span because the spread between the different trajectories recalculated a longer time (i.e. 96 or 120 h) was high and, consequently, the air mass movement reconstruction was unreliable.
We identified the potential origin of the air mass that produced a snow event as the area where the air mass could have effectively harvested particulate matter and bacteria based on the reconstruction of the vertical trajectory of the air mass and the elevation profile. In particular, for the potential source areas located in the Saharan desert, we considered that the air mass can have effectively harvested dust and bacteria when the vertical trajectory shows a mass movement above this area at an elevation lower than 3000 m a.s.l. because, above deserts, high dust concentrations can reach easily 2500–3000 m a.s.l. (Schwikowski and others, Reference Schwikowski, Seibert, Baltensperger and Gaggeler1995) and the harvesting process is effective also at this elevation. In contrast, when the back trajectory of the air mass showed that it always moved at high altitude above the ground, we only consider the provenance of the air mass investigating the last 72-h trajectory.
Snow samples of Baltoro Glacier and Khumbu Valley were collected fresh, so the exact day when each snowfall event occurred was known. On Forni Glacier, we could identify the snowfall day of each snow sample because each sample was collected from a single layer of snow, clearly identifiable in the snowpack, and a careful snowpack analysis conducted in situ by means of snow pits, allowed identifying the layers generated by each single snowfall by their different features (i.e. snow density, hardness, grain size and shape, liquid water and dust presence; see Senese and others, Reference Senese2018 for further information). Data from an automatic weather station located near the sampling site (46°23′N, 10°35′E; 2710 m a.s.l.) and equipped with a webcam that focuses on the glacier, further confirmed the accuracy of the dates of the snowfalls we sampled. In particular, the snowpack we sampled on Forni included two different layers of sediment-rich snow, clearly identifiable because of their distinctive orange-brown color (mostly due to the presence of silt and clay, see Azzoni and others, Reference Azzoni2016). These layers originated from the sediment-rich snowfalls of 4–7 February and 18–20 February 2014 observed in the whole Southern Alps (Meola and others, Reference Meola, Lazzaro and Zeyer2015). Thus, in the field, we could identify and sample the two sediment-rich snow layers (samples F2-F5 and F6), the sediment-free snow layer between them (samples F3 and F4), which originated from the snowfall of 10–15 February 2014, and the sediment-free snow layer immediately below the deepest sediment-rich layer (F1), which originated from the snowfall of 29 January–2 February 2014. Albeit the different strata were clearly identifiable in the field, we note that the thermal profile of the snowpack suggested an abundant water percolation (R.S. Azzoni and E. Meraldi, unpublished data). Snowfalls that originated the snow samples we collected on the Ararat/Ağri Daği could not be dated, so back trajectories were not reconstructed for that area.
RESULTS
Sample description
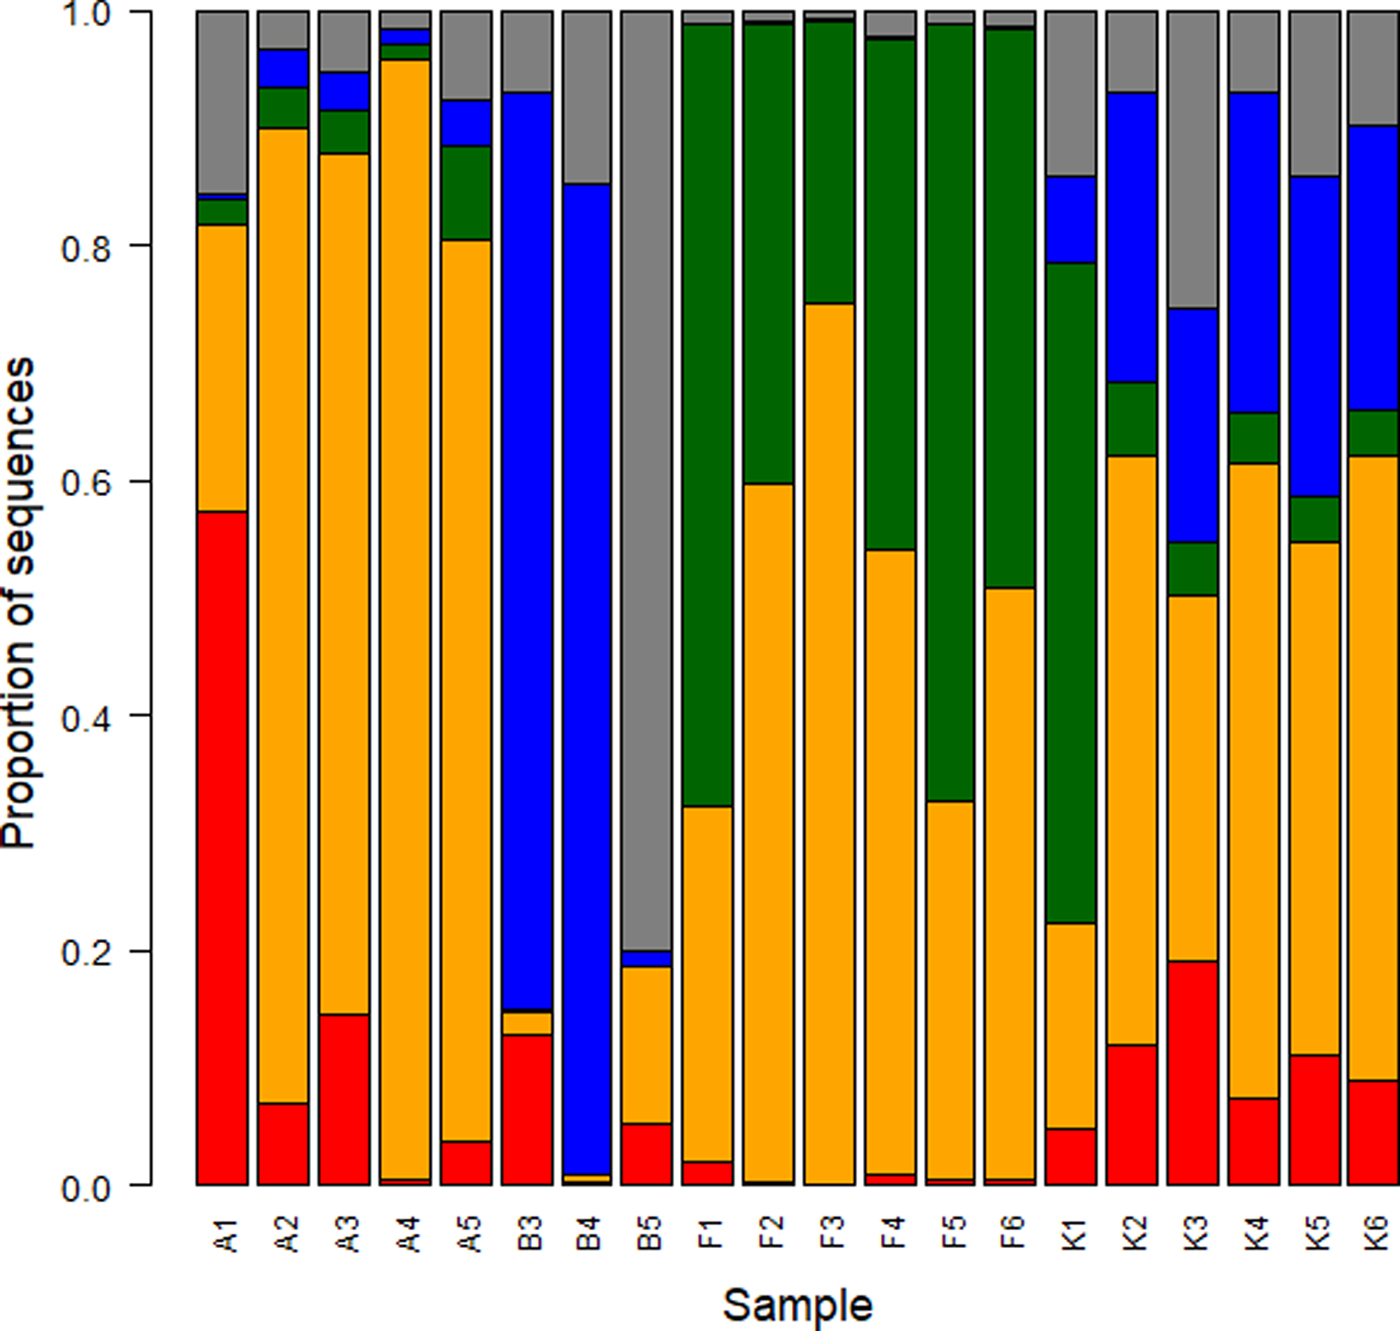
Number of mapping reads ranged in 930–78 941 sequences per sample (Table 1). In the 20 samples with >3000 sequences, we identified 514 OTUs. To describe the bacterial communities, we focused on the order level because the classification at the family or genus level had rather low confidence: in fact the percentage of OTUs not classified at the genus level was 54%, compared with 23% of the OTUs not classified at the order level. Burkholderiales (phylum Proteobacteria) was the most abundant order representing (mean ± SD) 45.9 ± 26.8% of all sequences (Fig. 2). Other abundant orders were Cytophagales (Bacteroidetes), Xanthomonadales (Proteobacteria) and Bacillales (Firmicutes) representing, respectively, 19.2 ± 24.1%, 15.3 ± 24.7% and 8.3 ± 12.8% of sequences. On Ararat/Ağri Daği, Burkholderiales were dominant (70.4 ± 27.1%), followed by Bacillales (16.6 ± 23.3%). On Baltoro, Xanthomonadales (54.5 ± 46.2%) and Pseudomonadales (23.7 ± 41.0%) were the most abundant orders. On Forni, Burkholderiales (50.0 ± 16.9%) and Cytophagales (47.7 ± 16.4%) were the most abundant orders. In the Khumbu Valley, Burkholderiales (41.5 ± 14.5%) and Xanthomonadales (21.7 ± 7.6%) were dominant. Furthermore, the abundance of Cyanobacteria was low in all samples.
Relative abundance of bacterial orders expressed as the percentage of sequences classified with confidence >90%. Most abundant orders are shown (red, Bacillales, orange, Burkholderiales, green, Cytophagales, blue, Xanthomonadales) while other orders are grouped and represented by the gray bars.
α-Diversity analysis
Number of OTUs at each sample, as calculated on samples rarefied to 3000 sequences, varied between 22 (sample B4 from Baltoro Glacier) and 211 (sample K3 from Khumbu Valley). A GLM revealed significant differences in OTU number between sampling areas (F 3,16 = 53.778, P < 0.001; Fig. 3a). Post-hoc tests (Tukey method) showed that samples from the Khumbu Valley hosted a significantly larger number of OTUs (mean ± SD: 174.17 ± 30.15) than those from all the other areas (|z| ≥ 6.061, P ≤ 0.001). Similarly, OTU number in the samples from Ararat/Ağri Daği (87.20 ± 21.34) was significantly larger than that in the samples from both Forni (44.67 ± 7.34) and Baltoro (39.00 ± 14.73) (|z| ≥ 3.860, P ≤ 0.001), which, in turn, did not differ significantly (z = 0.612, P = 0.924; Fig. 3a).
Boxplot of (a) number of OTUs and (b) Gini index in each area. The tight horizontal lines represent the median, boxes enclose values between 1st and 3rd quartiles. Whiskers indicate maximum and minimum values. Dots represent outliers. Different letters denote samples that differed significantly at post-hoc tests (P < 0.05). Samples B1, B2 and K7 were excluded from these analyses due to the low coverage (<3000 sequences).
A GLS model showed that Gini index varied significantly among sampling areas (F 3,16 = 16.607, P < 0.001; Fig. 3b) and post-hoc tests (Tukey method) revealed that samples from Baltoro showed significantly higher values (0.992 ± 0.002) than those from the other areas (|z| ≥ 3.419, P ≤ 0.003). In addition, samples from Forni (0.985 ± 0.004) showed higher values than those from Khumbu (0.954 ± 0.016) (z = 3.580, P = 0.001), while samples from Ararat/Ağri Daği (0.974 ± 0.011) showed intermediate values among those from Forni and Khumbu (|z| ≤ 2.504, P ≥ 0.050; Fig. 3b).
β-Diversity
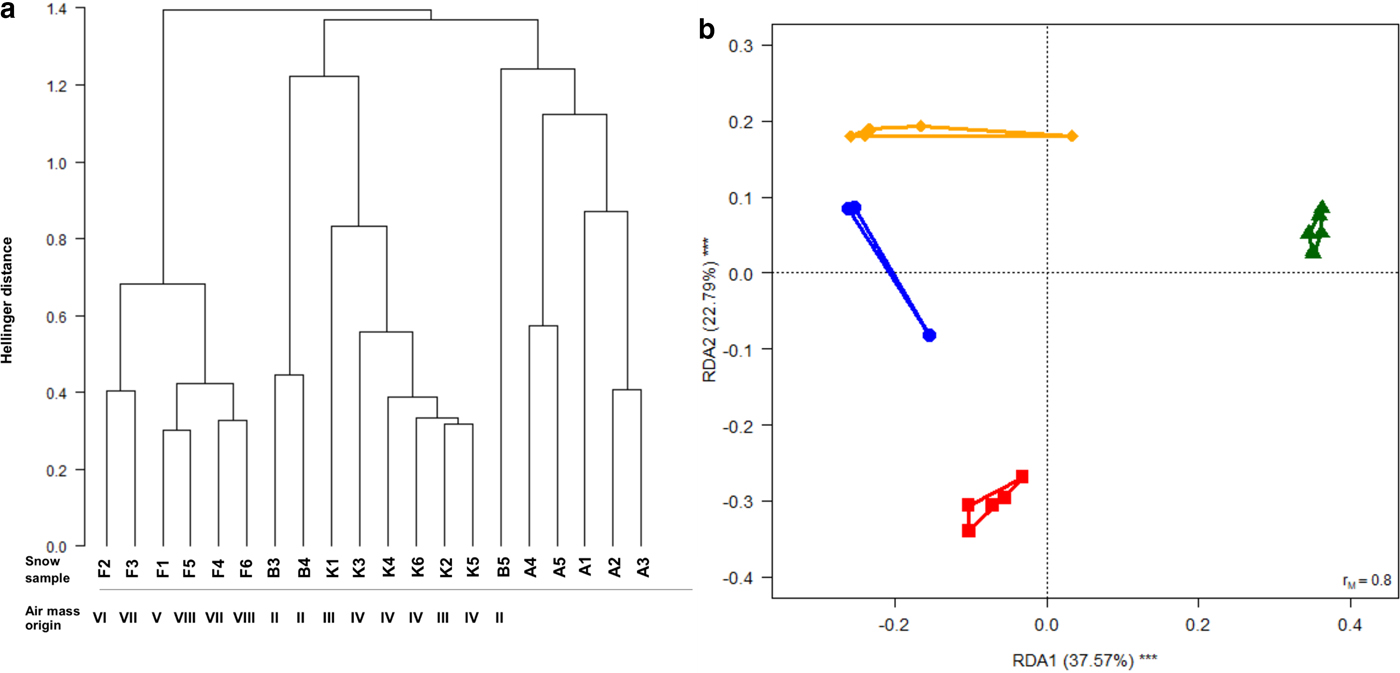
Cluster analysis showed that snow samples collected in the same area clustered together except for those from Baltoro that clustered with Khumbu ones (samples B3 and B4) or with samples from Ararat/Ağri Daği (sample B5; Fig. 4a). However, RDA analysis indicated that the structure of bacterial communities significantly differed among areas (F 3,16 = 10.643, P = 0.001, adjusted-R 2 = 0.604; Fig. 4b). Post-hoc tests disclosed significant differences among all pairs of areas (F 1,6 ≥ 4.368, P FDR ≤ 0.045). Beta-disper test (Anderson, Reference Anderson2006) revealed that dispersal (multivariate variance) did not differ among areas (F 3,16 = 1.402, P = 0.278), thus confirming that assumptions of RDA were not violated.
(a) Dendrogram from the cluster analysis of the structure of bacterial communities in snow samples. The clustering is based on Hellinger distance calculated on OTU abundances. A, Ararat/Ağri Daği, B, Baltoro, F, Forni, K, Khumbu. The Arabic numbers denote different samples collected in the same area. The Roman numbers denote the origin of the air masses according to the back trajectory of Figure 5. (b) Biplot from RDA of Hellinger-transformed bacterial OTU abundance on sampling area (red squares, Ararat/Ağri Daği, blue dots, Baltoro, green triangles, Forni, orange diamonds, Khumbu). Each symbol represents one sample and polygons include samples collected in the same area. The percentage of variance explained by each axis and its significance (***P < 0.001) are reported. r M is the Mantel correlation coefficient between the Hellinger distance between samples and the Euclidean distance between the corresponding symbols in the graph. Values close to one indicate that the graph correctly represents the distance between samples.
Back trajectories and origin of air masses
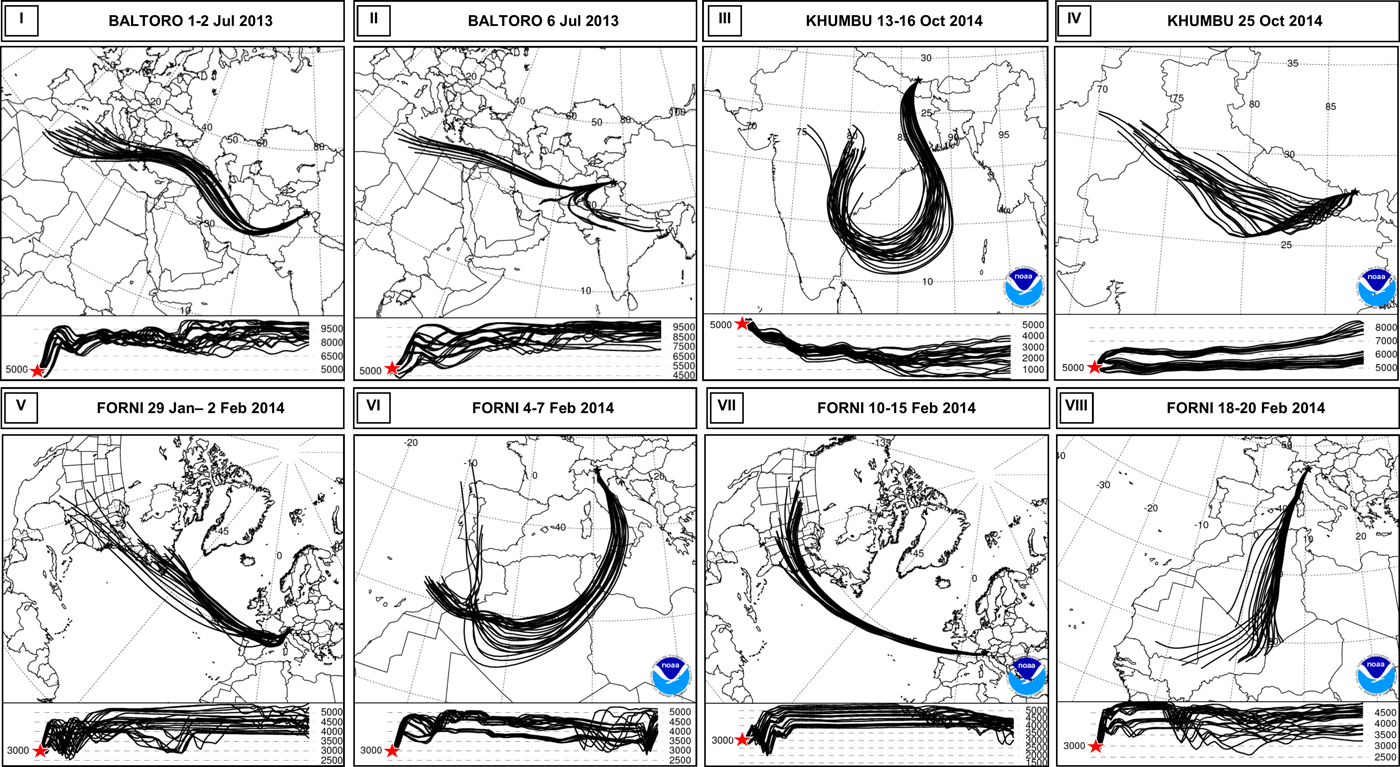
The back trajectories allowed reconstructing the motion and, in many cases, the origin of the air masses involved in the precipitations. The snow samples collected on Baltoro were deposited in two different snowfalls (1–2 July and 6 July 2013), both driven from a prevailing westerly circulation (Fig. 5). In these cases, the vertical trajectories were not consistent with an effective harvesting of bacteria in the crossed area. Snowfalls of 29 January–2 February and 10–15 February 2014 on Forni were driven by a western (Atlantic) circulation pattern, with vertical trajectories mostly above the boundary layer, whereas those of 4–7 and 18–20 February 2014 originated from the Western Sahara desert, where they could have harvested particulate matter (Fig. 5). The Khumbu samples were deposited in two different snowfall events. The one that occurred in 13–16 October 2014 was related to a typical monsoon circulation pattern, with an origin of the air mass in the Indian sub-continent. This event, in particular, was generated from a four-category Hudhud cyclone that brought huge snowfalls in Nepal area (Wang and others, Reference Wang, Gillies, Fosu and Singh2015). In this case, the vertical trajectories of the air mass were also compatible with the harvesting of dust and, potentially, microbes from the Indian sub-continent. The snowfall of 25 October 2014 originated from a westerly circulation pattern of an air mass that, according to vertical trajectories, always remained above the boundary layer (Fig. 5).
Back trajectories of the principal circulation pattern observed in the four sites during the snowfalls sampled. The lower panels show the vertical trajectory of the air masses: the sampling site is marked with a red star and the vertical profile of the air mass must be read from the right to the left. In particular, figures show the Westerly circulation of Baltoro snowfalls (I, II); cyclonic (III) and westerly circulation (IV) of Khumbu snowfalls; Atlantic (V, VII) and a Saharan origin of Forni snowfalls (VI, VIII).
DISCUSSION
We investigated the bacterial communities of snow samples from mid-latitude mountain areas (Alps, Eastern Anatolia, Karakoram and Himalaya) and identified 514 OTUs, which were mostly affiliated to Burkholderiales (Proteobacteria), Xanthomonadales (Proteobacteria), Cytophagales (Bacteroidetes) and Bacillales (Firmicutes). We observed low abundance of Cyanobacteria in all samples, compared with other studies of snow bacteria from both polar regions and other mountain areas (Hauptmann, Reference Hauptmann2014; Michaud and others, Reference Michaud2014; Cameron and others, Reference Cameron2015; Lopatina and others, Reference Lopatina2016; Wunderlin and others, Reference Wunderlin, Ferrari and Power2016). Interestingly, other studies conducted on Baltoro and Forni Glaciers reported high abundance of this taxon in supraglacial debris (cryoconite) (Franzetti and others Reference Franzetti2016, Reference Franzetti2017a, Reference Franzetti2017b; Ambrosini and others, Reference Ambrosini2017) collected during the same sampling campaign when the snow samples included in the current study were collected. This large difference in the abundance of Cyanobacteria between snow and ice environment in the same area is consistent with the findings of Yoshimura and others (Reference Yoshimura, Kohshima and Ohtani1997), who reported a low abundance of this phylum in the snow but an intense growth on the surface of a Himalayan glacier.
We observed a low number of OTUs and high values (0.93–0.99) of Gini index in all samples, as already documented by Rime and others (Reference Rime, Hartmann and Frey2016) on European Alps. In addition, the values of these alpha-diversity indexes were different in samples collected in different areas. Khumbu Valley samples, in particular, presented on average a larger number of OTUs than those from Ararat/Ağri Daği samples, which, in turn, presented more OTUs than Forni Glacier and Baltoro Glacier samples. A similar pattern was observed for community evenness. Some hypotheses can be made for interpreting these differences in alpha-diversity and evenness. First, we note that this pattern does not match differences between fresh and old snow samples, as snow was collected fresh in the Khumbu Valley and on Baltoro Glacier, and old on the Forni Glacier and on the Ararat/Ağri Daği. We can speculate that the Khumbu Valley samples may host a larger number of OTUs because the Himalayan range is close to highly polluted areas in the Indian subcontinent, which may enrich atmosphere of particulate matter, including bacteria, even at high altitudes (Ramanathan and others, Reference Ramanathan2007). This hypothesis is supported by findings of Santl-Temkiv and others (Reference Šantl-Temkiv, Gosewinkel, Starnawski, Lever and Finster2018), who reported that the airborne communities shared about half of the OTUs with potential local-source communities. However, Forni Glacier is similarly close to the Po Plain, which is among the areas in Europe with the highest concentrations of particulate matter (EEA, 2015), but snow samples showed much lower bacterial diversity. We can therefore hypothesize that the different characteristics of the surrounding areas (e.g. the abundance of vegetation, the distance from rocky walls or moraines, the distance from the proglacial plain, the duration of the snow cover) can also strongly affect the amount and composition of airborne particulate matter, including bacteria, present in the local air mass, which are then scavenged during snowfalls. The surroundings of the four study areas are extremely different. The sampling site on Ararat/Ağri Daği is far from ice-free and vegetated areas, because it is at the top of an isolated peak, but intense updraft winds can efficiently have mobilized dust. On Baltoro Glacier, samples were collected in an area surrounded by glacierized areas and rocky walls of mountains >7000 m high. The sampling sites of the Khumbu Valley are surrounded by moraines, rocky walls and by vegetated areas. Finally, the surroundings of the sampling area on Forni Glacier were covered by snow both at the time of sampling and during the snow events we sampled. This snow cover may have prevented the dust and bacteria harvesting from local sources.
The structure of bacterial communities found in samples from different geographical areas differed significantly to one another, as clearly indicated by the RDA analysis. Variation in snow bacterial communities seems therefore mainly linked to the area where the snowfall occurred, and to local air characteristics (temperature, humidity and dust content) at deposition sites Franzetti and others, Reference Franzetti, Gandolfi, Gaspari, Ambrosini and Bestetti2011, which seem to affect snow bacterial communities more than air mass origin or provenance. Such local effect could be appreciated on fresh snow samples from the Khumbu Valley, where snowfalls originated by an air mass coming from the Indian sub-continent and those from westerly's circulation pattern clustered together (Fig. 4a). Similarly, Forni samples related to the Saharan events and those from western provenance showed similar microbial communities (Fig. 4a). However, on Forni, snow was collected old, thus we cannot exclude that meltwater can have percolated into the snowpack transporting bacteria and homogenizing communities in different snow layers as reported by Lazzaro and others (Reference Lazzaro, Wismer, Scheenbeli, Erny and Zeyer2015), who observed that microbial communities tended to be homogeneously distributed through the whole depth of a snowpack in the Alps. The same process may have occurred on Ararat/Ağri Daği.
The hypothesis that the air mass origin may contribute, at least partly, to shape snow bacterial communities cannot be completely ruled out, however. Indeed, the snow fallen on the Alps on 18–20 February 2014 was investigated also by Meola and others (Reference Meola, Lazzaro and Zeyer2015) on samples collected on Jungfraujoch (Swiss Alps). They identified the Saharan origin of the air mass that determined the snowfall by mineralogical characterization of dust particles by means of a scanning electron microscope and X-ray spectroscopy analyses. They found that the Saharan dust-rich snow presented a dominance of Proteobacteria and Bacteroidetes (Meola and others, Reference Meola, Lazzaro and Zeyer2015), consistent with what we observed on Forni. Thus, despite the ‘local’ air mass (i.e. the lower boundaries of the atmosphere over an area) over Forni was presumably different from the one of Jungfrau (which is 200 km far from Forni), snow bacterial composition was similar, thus suggesting that a signature of the microbial communities of the origin area was retained. Evidence for a bacterial signature of air mass origin is therefore weak. However, this may be due to the rather small sample size we are considering, the large heterogeneity of our samples, which include both fresh and old snow collected in different years, and to the processes that determine the assemblage of bacterial communities in snowfalls.
Microbial growth after snow deposition and selective processes could also have contributed to determine the bacteria community structure we observed, as it is suggested by the high abundance of Burkholderiales in most of our samples. Indeed, the presence of abundant populations of Burkholderiales and other Betaproteobacteria has been extensively reported in previous studies in many cold environments (Darcy and others, Reference Darcy, Lynch, King, Robeson and Schmidt2011, Edwards and others Reference Edwards2011, Michaud and others, Reference Michaud2014) and it is probably due to their high metabolic versatility (Franzetti and others, Reference Franzetti2016). Particularly, some genera of Burkholderiales such as Polaromonas, Comamonas and Limnohabitans are aerobic anoxygenic phototrophs and can use carbon monoxide as a source of energy (Franzetti and others, Reference Franzetti2016). The high availability of light and carbon monoxide produced by photodegradation of organic matter in the snow might therefore favor Burkholderiales in the snow environment and explain their rather large abundance in this environment (Franzetti and others, Reference Franzetti2016). However, we found low abundance of Burkholderiales on Baltoro snow whereas members of this order were abundant in Baltoro cryoconite collected at the same time in an area few kilometers apart (Ambrosini and others, Reference Ambrosini2017). This could be explained, besides the different elevation of the sampling sites, by the fact that the snow samples on Baltoro were collected few days apart from the snowfall event. We can speculate that the few members of Burkholderiales could be metabolically active in the snow and were positively selected on the glacier surface.
CONCLUSIONS
Our analysis of the bacterial communities of snow from different high-elevation areas at the mid-latitudes showed that communities were dominated by similar phyla, particularly Proteobacteria, which were reported as dominant also in previous studies on snow from Arctic and Antarctica. However, each area hosted significantly different bacterial communities. This finding supports the hypothesis that the structure of snow bacterial communities is mainly driven by bacteria present in the atmosphere over the area where snowfall occurred. These ‘local’ air bacteria may be suspended from soil and vegetation together with particulate matter during e.g. thermal lift of air, wind or rock falls. However, some evidence suggests a possible contribution of the bacteria collected during air mass uplift, or, at least, of those taxa that can survive long atmospheric transport. Indeed, air masses can harvest dust and bacteria from the ground where the air is forced to uplift by orography or by warm surface (Parker and others, Reference Parker, Thorncroft, Buron and Diongue-Niang2005) and there is a wide availability of mineral aerosols due to the scarcity of vegetation and/or a very low soil humidity (Tourè and others, Reference Tourè, Konaré and Silué2012). After this uplift phase, the particulate and the bacteria can be transported over long distances with few changes in their composition and are deposited mainly by rainfalls or snowfalls (Marsham and others, Reference Marsham2008), where they mix with those in the local atmosphere during snowfall. We stress that we cannot exclude a post-depositional growth of bacteria after the snowfall, in particular of those organisms with high metabolic versatility such as Burkholderiales. Further studies on the temporal changes of bacterial communities in the snowpack are therefore needed for evaluating the evolution of snow bacterial communities.
Although the snow samples were collected opportunistically in four different expeditions with different snow conditions, this is the first comparison between snow bacterial communities from different areas investigated with the same method of analysis permitting a novel investigation of the main factors that shape the snow bacterial community.
ACKNOWLEDGEMENTS
We thank all the components of the three scientific expeditions on Ararat/Ağri Daği, Baltoro and Khumbu glaciers. In particular, the Ararat/Ağri Daği expedition was conducted within the framework of the Central Scientific Committee of the Italian Alpine Club with the participation of Riccardo Avanzinelli, Raffaello Cioni, Daniele Bocchiola, Simone Tommasini, Giulia Enrione and Luigi Vanoni. The Baltoro expedition was funded by the PAPRIKA project (supported by Ev-K2-CNR Association), by the SEED project (funded by the Italian and the Pakistani governments), by the Italian Ministry of Research (PRIN grant 2010AYKTAB to CS), with the participation of Daniele Bernasconi and Luigi Bonetti. We also thank Ev-K2-CNR Association for the organization and logistics of the Khumbu and Baltoro expeditions. This study was also funded by DARA (Department of Regional Affairs and Autonomies) of the Presidency of the Council of Ministers of the Italian government through the GlacioVAR project. We also gratefully acknowledge the NOAA Air Resources Laboratory (ARL) for the provision of the HYSPLIT transport and dispersion model and/or READY website (http://www.ready.noaa.gov) used in this publication.
DATA ACCESSIBILITY
Sequence data are available at European Nucleotide Archive (ENA), study accession number PRJEB27775 (http://www.ebi.ac.uk/ena/data/view/PRJEB27775).


 Open access