


Accurate data on dietary intake are important for several policy areas, including nutrition, agriculture and public health. Three types of sources are generally used for estimating food consumption in populations: food balance sheets (FBS), Household Consumption Expenditure Surveys (HCES) and individual intake surveys( Reference Hawkesworth, Dangour and Johnston 1 , Reference Naska, Berg and Cuadrado 2 ). FAO calculates annual FBS for countries, which estimate national-level availability of major food commodities, as a function of production, imports, exports and adjustments for waste. HCES are conducted on a frequent basis by national statistics offices, using nationally representative sampling frames, and collect data on household-level purchases of a comprehensive set of food commodities. Individual intake surveys come in a variety of designs, including FFQ, 24-h recall (24HR) surveys and weighed food records. These surveys are generally regarded as providing more accurate individual-level estimates of food consumption than FBS or HCES, though they are more difficult and expensive to conduct, and thus are more commonly used on specific study populations rather than at national levels( Reference Hawkesworth, Dangour and Johnston 1 ). The choice of data type used by researchers and policymakers often depends on availability.
Much nutritional research has focused on India, where historically high rates of undernutrition, as well as growing over-nutrition, impose heavy burdens on health and development( 3 – Reference Vaz, Yusuf and Bharathi 5 ). Several data sources exist in the country on dietary intake, and they have been variously used to study and describe, for example, consumption of major food groups and associated changes over time( Reference Shetty 4 , Reference Pingali and Khwaja 6 – 10 ), absolute micronutrient intake( Reference Bermudez, Lividini and Smitz 11 ) and health outcomes related to nutritional intake( Reference Shridhar, Dhillon and Bowen 12 , Reference Rao, Yajnik and Kanade 13 ), among others( Reference Stein, Meenakshi and Qaim 14 , Reference Fiedler 15 ).
Specifically, the Indian government’s National Sample Survey (NSS) HCES have been used to describe the country’s dietary transition from the 1980s to 2000s( Reference Shetty 4 , Reference Kumar and Mruthyunjaya 7 ). It has been suggested that several stages of transition with varying characteristics have unfolded in the country( Reference Pingali and Khwaja 6 , Reference Gaiha, Kaicker and Imai 9 ), though on the whole, diets have seen a decline in cereals, and an increase in energy content from vegetable- and animal-source fats. Alongside changes in food consumption over these years, recent estimates show that in 2014, about 27 % of Indian adults were overweight, whereas 39 % of children under 5 years were stunted( 16 ). Despite India’s growing economy, reductions in undernutrition have been materialising slowly( Reference Haddad 17 ).
However, challenges remain in using Indian dietary data to explain nutritional trends and drivers. Overall trends in dietary intake across time are still not fully clear, partly due to a lack of reliable data( Reference Deaton and Drèze 8 ). The NSS has shown a steady and counterintuitive decrease in consumed energy content from 1980 to 2010 as incomes have grown, with a small rebound in energy intake only in the last available data year of 2012( Reference Deaton and Drèze 8 , 18 ). Evidence suggests the recent decreasing energetic trends in these data may be a function of some underestimation in this survey, such as not fully accounting for increased consumption of food outside the home( Reference Smith 19 , Reference Gibson 20 ).
Measuring food consumption is generally a difficult exercise( Reference Livingstone and Black 21 ), and studies have shown that the choice of data methodology applied to a given population can affect the resulting intake estimates( Reference Gibson 20 , Reference Beegle, De Weerdt and Friedman 22 – Reference Grünberger 25 ). Intake data are therefore often compared against an alternative method for a given sample or population for the purposes of validation, or to determine relative differences between the compared methods( Reference Naska, Berg and Cuadrado 2 , Reference Beegle, De Weerdt and Friedman 22 – Reference Bowen, Bharathi and Kinra 26 ). Despite researchers’ and policymakers’ reliance on the NSS, it has not been compared with other sources of dietary data in the country.
We compare intake of major food groups using six national and sub-national sources of Indian food consumption, representing various dietary intake estimation methods, and assess the impact of these methods on relative differences in food consumption.
Methods
Data
National Sample Survey
The NSS is an annual, nationally representative HCES, representing a random sample of households across the country. The questionnaire records the quantity and value of approximately 250 food and beverage items purchased in the last 30 d, among other consumer goods( 18 , 27 ). We used rounds 61, 66 and 68 of the survey, conducted between July and June of 2004–2005, 2009–2010 and 2011–2012, respectively, to match the years of data collection as close as possible to our other compared data sources. We additionally compare the 2011–2012 data from an alternative NSS survey format (named ‘type 2’) that was recently implemented and used 7-d recall for meats, eggs, oils, fruits and vegetables (though it retained a 30-d recall for cereals, pulses and sugar)( 27 ).
India Health and Development Survey
The India Health and Development Survey (IHDS) was a nationally representative HCES, conducted over two waves in 2004–2005 and 2011–2012. It recorded, among other socioeconomic and health indicators, the quantity and value of purchased food groups in the last 30 d, such as vegetables, meats and legumes, as well as several commonly consumed individual items, such as rice and wheat( Reference Desai, Dubey and Joshi 28 ).
FAO food balance sheets
The FAO’s FBS provide a picture of food availability at the national level, and approximate per capita food availability by dividing national estimates by the total population( Reference Hawkesworth, Dangour and Johnston 1 ). We retrieved data for the years 2004, 2005, 2011 and 2012 from the FAOSTAT database( 29 ).
National Nutrition Monitoring Bureau rural surveys
The National Nutrition Monitoring Bureau (NNMB) conducts periodic surveys in ten Indian states, using multi-stage random sampling of households, and following the NSS sampling frame. The surveys recorded individual-level intake within households using one 24HR survey( Reference Ramachandran 30 ). The raw data from these surveys were not available, though NNMB reports provide mean individual-level intake of food groups by age for rural areas. We used these reported data for adults aged 18 years and above, from the surveys conducted on rural populations during 2004–2005 and 2011–2012( 31 , 32 ).
Indian Migration Study
The Indian Migration Study (IMS) was a health and nutrition study conducted in 2005–2007, which surveyed factory workers in the four urban centres of Hyderabad, Bangalore, Nagpur and Lucknow, and their siblings living in rural areas, the majority of whom resided within the same Indian state as the urban centre. The survey used a FFQ of 184 dishes and food items, and recorded the frequency of intake and number of servings of each item in the one-year period before the survey. The study also collected recipes for each of the FFQ items, separately for rural and urban areas of each study site( Reference Bowen, Ebrahim and De Stavola 33 ).
Andhra Pradesh Child and Parent Study
Andhra Pradesh Child and Parent Study (APCAPS) is a prospective birth cohort study of households in twenty-nine peri-urban villages of Ranga Reddy district in the Indian state of Telangana (previously Andhra Pradesh) that earlier took part in a food supplementation trial involving pregnant women and their offspring (1987–1990). It uses a FFQ of ninety-eight dishes and food items, based on the IMS FFQ and further refined for use in the APCAPS study setting. Here we used the third follow-up wave, which included children and their parents, conducted between 2010 and 2012( Reference Kinra, Radha Krishna and Kuper 34 ). The first wave was excluded as it did not collect detailed data on intake, whereas the second wave had a smaller sample size consisting of only children.
All data sources accounted for seasonality by using aggregated annual data or conducting fieldwork throughout the year (NSS, IHDS, FBS and NNMB), or by specifically recording the variation in intake by time of year (IMS and APCAPS). A summary of data sources, including sample sizes, is presented in Table 1.
Description of data sets
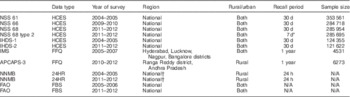
NSS, National Sample Survey; HCES, Household Consumption Expenditure Survey; IHDS, India Human Development Study; IMS, Indian Migration Study; APCAPS, Andhra Pradesh Child and Parent Study; NNMB, National Nutrition Monitoring Bureau; 24HR, 24-h recall; FBS, food balance sheets.
* 7-d recall for meats, eggs, oils, fruits, vegetables; 30-d recall for cereals, pulses, sugar.
† Data collected in ten Indian states, sample not designed to be nationally representative.
Analysis
We compare intake of major food groups, in g/person per d, between survey types, matching for relevant year of survey, regions, sex and economic groups, where available. HCES were used as the reference comparison against other methodologies (though strictly to assess relative differences rather than as a source of validation) due to the larger number of HCES data sets and the ability to match across the years and regions of other survey types. Food groups compared were cereals, pulses, dairy products (including butter), vegetable oils, meat (including fish), eggs, fruits and nuts and vegetables (including root vegetables). Beverages were excluded. Intake was calculated for adults aged 16–59 years, for men and women combined (NNMB data were only available for ages 18 years and over), though stratification by age was not possible for FAO data.
Household expenditure surveys were converted to individual intake using Indian energetic requirement adjustment factors based on age and sex( 32 ), and we used household weights to scale up to the national level. In the NSS data we additionally adjusted for high-income households which provide food to poorer households in exchange for labour or services, based on a standard methodology recommended by the NSS( 18 ). We converted intake of the IMS and APCAPS FFQ items into individual food intake using the recipe sheets generated for these surveys, and aggregated these foods into food groups. Intake of each food group in the IMS data was additionally adjusted based on the validation of the IMS against a series of three 24HR surveys( Reference Bowen, Bharathi and Kinra 26 ). Data from the FAO and NNMB surveys were extracted from publicly available reports, and aggregated into the relevant food groups. FAO data were averaged for the years 2004–2005, and 2011–2012, to match the corresponding NSS and IHDS survey rounds. The IMS (conducted during 2005–2007) and APCAPS (2010–2012) asked respondents to recall intake over the previous year, and we have therefore used the years of intake in these surveys as 2004–2006 and 2009–2011, respectively, and matched these data for comparison to the IHDS-1 conducted in 2004–2005 and the NSS 66 conducted in 2009–2010.
Comparisons using the IMS were additionally stratified by income groups, as the employed IMS respondents and their siblings may have represented a higher socioeconomic sample than the average Indian population. For this, we generated a common standard of living index (SLI) between the IHDS and IMS, based on the SLI methodology developed in the Indian National Family Health Survey( 35 ). The components of this index include ownership of various assets and utilities, and we compared intake between the surveys for SLI tertiles. APCAPS data were compared with NSS rural households in Ranga Reddy district. Although matching for the same specific APCAPS villages was not possible in the NSS, the mean SLI between the APCAPS sample and the district-level NSS sample was very similar.
Relative differences in total daily intake, and for individual food groups (both in g/d), were calculated for each dietary intake method comparison. We were not able to assess the statistical significance of the comparisons, as FAO and NNMB data do not allow for standard error calculations, and the main underlying uncertainty for all the methods is likely to be a function of measurement error rather than sample size. Spearman’s coefficients assessed the similarity of ranked food group intake across comparisons.
Ethics committee approval for IMS was obtained from the All India Institute of Medical Sciences Ethics Committee, and for APCAPS from the National Institutes of Nutrition, Hyderabad and Public Health Foundation of India, New Delhi. Ethics committee approval for this analysis was obtained from the London School of Hygiene and Tropical Medicine. Consent was sought from the factory managers for the Indian Migrant Study and from the community leaders in the villages for the APCAPS study.
Results
Individual intake of food groups was calculated for twelve Indian national and sub-national data sources, conducted between 2004 and 2012, representing four dietary intake estimation methods (Table 1).
National-level trends over time
Both the NSS and NNMB surveys showed a decline nationally in total intake of food, in g/d, between 2004–2005 and 2011–2012, though the IHDS and the FAO FBS showed an overall increase over the same years (Fig. 1). Changes in food group consumption between 2004 and 2012 were mostly consistent across the NSS, IHDS and FAO data; nationally, sources showed an increase in intake of pulses, dairy products, fats, eggs (no change in IHDS data), meat and fish and sugar, and a decrease in cereals (no change in the FAO data). Intake of fruits and vegetables showed a decrease in NSS, and an increase in IHDS and FAO data. The IHDS, NSS and IMS recorded higher overall intake in g/person per d in urban than rural areas, for all available survey rounds (online Supplementary Fig. S3 and S4).
Consumption of food groups at the national level, recorded in household expenditure surveys (National Sample Survey (NSS), India Human Development Study (IHDS)) and food balance sheets (FAO), in 2004–2005 and 2011–2012. ![]() , Sugars;
, Sugars; ![]() , fruit and nuts;
, fruit and nuts; ![]() , vegetables;
, vegetables; ![]() , meat and fish;
, meat and fish; ![]() , eggs;
, eggs; ![]() , oils;
, oils; ![]() , dairy products;
, dairy products; ![]() , pulses;
, pulses; ![]() , cereals.
, cereals.
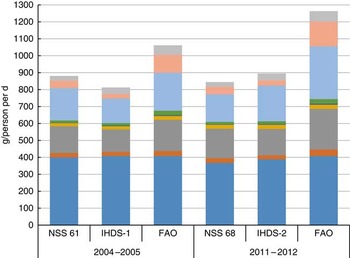
In 2012, the most recent year of data availability, intake (kg) in India was highest for cereals (about 30–45 %, depending on the data source), whereas consumption of dairy products and vegetables was also high (about 20–25 %). Eggs and meat constituted the lowest intakes (≤2 %), and consumption of pulses, oil and sugar were also low (about 3–5 %) (Fig. 1).
Overall differences across survey types
Relative differences in combined intake of all food groups across the individual data comparisons varied markedly, and ranged from 1 % between the IHDS-1 and the corresponding NNMB 24HR survey, to 50 % between the NSS round 68 and FAO FBS. The IHDS and NSS expenditure surveys were similar to each other, showing a relative difference in total intake of just 1 %, averaged across the two rounds of the surveys. Compared with HCES, FFQ and FBS showed higher absolute intake (on average, by 13 and 35 %, respectively), and the 24HR surveys lower intake (average of −9 %) (Table 2).
Relative differences in absolute intake of all food groups (g/person per d) between survey types
HCES, Household Consumption Expenditure Survey; IHDS, India Human Development Study; IMS, Indian Migration Study; NSS, National Sample Survey; APCAPS, Andhra Pradesh Child and Parent Study; FBS, food balance sheets; 24HR, 24-h recall; NNMB, National Nutrition Monitoring Bureau.
Type 1 and 2 formats were compared for round 68 of the NSS data (2011–2012). The type 2 survey showed substantially higher intake for those foods surveyed with the 7-d recall (vegetable oils, eggs, meat and fish, vegetables and fruit and nuts; with increases of 9, 66, 43, 48 and 63 %, respectively). Intake for the remaining foods that retained the 30-d recall in type 2 (cereals, pulses and sugar) showed minor relative differences of about 1 % compared with the same 30-d recall of these foods in the type 1 survey (online Supplementary Fig. S5).
Food group differences across survey types
Of all food groups, intake of cereals showed the smallest relative differences in g/person per d across the survey comparisons, ranging from −1 to 9 %, with an average difference of 5 %. Fruit and nuts, eggs, meat and fish and sugar had high average relative differences across the comparisons (120, 119, 56 and 50 % average differences, respectively). Fruit and nuts in particular had the highest variability in differences between comparisons, ranging from a −36 % difference between the NSS and IHDS HCES, to a 264 % difference between the expenditure surveys and FBS (Table 3).
Relative differences in intake (g/person per d) of food groups between survey types
HCES, Household Consumption Expenditure Survey; FBS, food balance sheets; 24HR, 24-h recall.
* Absolute magnitude, taking all relative differences as positive.
Spearman’s correlation analysis of food group ranks (intake of a food group as the proportion of total intake (kg)) showed very high correlation across surveys (Spearman’s ρ 0·8–1·0 across surveys, P=0·01 to P<0·0001).
Discussion
We present a comparison of several sources of Indian dietary data, representing a variety of intake estimation methods. This is, to our knowledge, the first such analysis. We found differences in estimates of overall and food group intake across these comparisons when matching sources for year, sex and region, which may be partly due to methodological differences across the surveys.
Compared with the national consumer expenditure surveys, relative differences in total estimated intake in g/person per d varied from 1 to 50 % across the other data sources. The two national expenditure surveys were most similar to each other, whereas the FFQs and FBS showed higher intake, and the 24HR surveys lower intake, in relation to these. Cereal consumption had high agreement across survey types, whereas fruit and nuts, eggs, meat and fish and sugar had the least.
Recent work has suggested that the Indian expenditure and 24HR surveys may to some degree underestimate food consumed out of home( Reference Smith 19 ), and this could partly explain the lower consumption recorded in these sources relative to FFQ and FBS data. The NSS records the value and number of snacks and meals, respectively, eaten out of the home from a single respondent (and IHDS records only the value of meals). This is generally the female adult of the household who recalls other household members’ intake( Reference Smith 19 ), and may therefore not be aware of some foods eaten out of the home( Reference Gibson 20 , Reference Gewa, Murphy and Neumann 36 , Reference Livingstone, Prentice and Coward 37 ). The NNMB 24HR surveys share a similar limitation, and to our knowledge, do not provide details on how the nutritional composition of recalled food is determined, or how food outside the home is accounted for. However, the NSS is the longest-running source of nationally representative data, and is frequently used to analyse consumption trends in India. Two factors may help improve estimates of dietary intake from these expenditure data. First is the use of the ‘type 2’ data, in which the use of a shorter recall period may help improve accuracy( 27 , Reference Smith, Dupriez and Troubat 38 ), particularly for nutrient-rich food groups. We calculated a 13 % higher total intake in g/person per d across all foods, and NSS-own estimates show about 6–9 % higher energy intake in rounds 66 and 68, when compared with the typical ‘type 1’ 30 d recall ( 18 , 27 ). Second, our calculations showed about 7–8 % of NSS households’ food expenditure was spent on snacks and food prepared outside the home (data not shown), and methods are needed to estimate intake from these sources. The two most recent NSS rounds have improved the specificity of food types eaten out of home( 18 , 27 ), and while the survey provides the average estimated energetic, fat and protein composition of these items, the data format still does not allow for direct intake estimates of food groups or key nutritional indicators such as sugar, salt or micronutrients.
The decline in overall intake between 2004–2005 and 2011–2012 in the NSS and NNMB data was not seen in the FAO FBS or the IHDS expenditure surveys. The FAO captures all food available at the national level, and may better assess all available food regardless of where it was purchased or eaten, though as the IHDS shares similar methodology to the NSS expenditure survey, it is not clear why they diverged on the direction of overall intake.
FAO FBS data have been shown to generally overestimate per capita intakes( Reference Naska, Berg and Cuadrado 2 , Reference Grünberger 25 , Reference Sibrian, Komorowska and Mernies 39 ), as they may not fully account for wastage along the value chain from production up to consumption( Reference Grünberger 25 ). However, the FBS are a common source for assessing trends over time in food availability( Reference Naska, Berg and Cuadrado 2 ). Comparisons of FBS to other data sources have found that despite the general overestimation, FBS can underestimate intake of certain food groups( Reference Del Gobbo, Khatibzadeh and Imamura 23 , Reference Grünberger 25 ). In our study, the FBS overestimated all food groups relative to NSS and IHDS expenditure surveys.
FFQ have been shown to have variable performance compared with other reference methods, in terms of direction and magnitude, though generally provide accurate ranking of food group intake( Reference Tabacchi, Filippi and Amodio 24 ). FFQ characteristics such as the number of recall items and recall period affect their accuracy( Reference Tabacchi, Filippi and Amodio 24 ). The IMS FFQ was calibrated against a series of three 24HR surveys( Reference Bowen, Bharathi and Kinra 26 ), which are often used as a reference standard. Our use of these adjustments lessened the differences between the IMS and expenditure survey considerably, as the original IMS data showed almost 50 % higher total intake than the HCES. A similar validation was not undertaken for APCAPS, and this may explain why the difference in intake between APCAPS and the HCES is higher than that between the IMS and the HCES.
As each dietary data method was designed for select purposes, it is expected that the dietary intakes in our comparisons would differ. Consumption of nutrient-rich food groups, as well as of sugar, showed high degrees of variability between the various data sources. This observation agrees with other recommendations that the dietary assessment methods we have reviewed may not be appropriate for precise assessment of individual-level energy or micronutrient intake( 40 – Reference Ferro-Luzzi 42 ). Instead, these data sources could be applicable for broader nutritional assessments, such as relative comparisons between population groups or identification of groups at nutritional risk, measures of dietary diversity, time trends, categorisation of dietary patterns and selection of foods for biofortification( 40 , Reference Ferro-Luzzi 42 , Reference Coates, Colaiezzi and Fiedler 43 ). For example, the FFQ used in the IMS and APCAPS data was designed to examine relative differences in food consumption, nutrition and health across population groups, and has been reported to be valid for such purposes( Reference Bowen, Bharathi and Kinra 26 ). Our findings of high correlation in ranked food group intake across all compared data sources also support these recommendations. Analyses of dietary impacts on health require the use of data sources that contain information on potential socioeconomic confounders, such as the IMS, APCAPS and IHDS (though IHDS only include anthropometric data, whereas IMS and APCAPS measured a range of health outcomes). However, even within the recommended uses of these data, additional limitations may exist for populations with unique dietary needs or intake patterns, such as children (for whom 24HR or FFQ would require knowledgeable respondent proxies, and difficult assumptions about individual allocation from household-level surveys) and minority populations (where FFQ may not be reflective of unique cultural foods). Users of these data sources should therefore examine their suitability for purposes other than what the data were originally designed for. The most precise method for energy intake remains doubly labelled water, and 7-d weighed food records for micronutrient intake, though their use is limited by their cost and time requirements. As such, there may be a trade-off between feasibility of national coverage and accuracy of individual-level intake. These above points apply to any uses of the data, including for research or programmatic needs.
This comparison of Indian dietary data has some limitations. First, it is not possible to validate the individual data sources as no gold standard reference exists for our use, and therefore our comparisons between sources are only in relative terms. We have matched data for major characteristics such as year, region, sex and socioeconomic levels, though other sampling factors may have contributed to the differences in intake we have calculated, particularly for the non-nationally representative data sources. The availability of data meant we could not compare all survey types against each other for a given time period, and for this reason, we used the expenditure surveys, for which several rounds are available, as the common reference comparison to other data sources. The year of the data source may have differentially affected our comparisons, for example, as increasing consumption out of home may have exacerbated differences between HCES and FBS for the more recent time period. All data sources, except the FBS, are also likely to suffer to some degree from recall bias. The conversion of HCES intake data from the household to individual level may have introduced some bias, as differences in intra-family food allocation likely exist( Reference Berti 44 ) outside of age- and sex- derived energetic requirements. However, despite these limitations, this is the first comparative analysis to bring these varied data sources together, and this work should serve as a useful platform to inform the many future uses of these data.
This analysis compares estimated food intake across several Indian data sources to contextualise broad relative differences across dietary intake estimation methods. Each methodological choice may have its own advantages and disadvantages for particular research uses, and further work is required to suggest specific improvements for current Indian dietary data sources. Of general usefulness would be the development of more comprehensive nutritional composition databases, and improved methods in the on-going national surveys for measuring food consumption out of home. Also crucial is generation of high-quality data that can be used to validate or calibrate the various current and future sources of dietary intake.
Acknowledgements
The authors would like to thank Dr Bharati Kulkarni for helpful comments on the draft, and Liza Bowen for help with the Indian Migration Study (IMS) data. The authors would also like to thank all the participants of the IMS and the Andhra Pradesh Children and Parents Study (APCAPS) who took part in the research as well as the study team in Hyderabad.
L. A. and M. T. are supported by a studentship from the Leverhulme Centre for Integrative Research on Agriculture and Health. R. G. is funded by a grant from the Wellcome Trust Our Planet, Our Health programme (grant no. 103932). The IMS and APCAPS were funded by the Wellcome Trust (grant nos GR070797MF and 084674, respectively). The funders had no role in the design, analysis or writing of this article.
L. A. and M. T. designed the study, and L. A. carried out the analysis, and drafted the paper. S. K. was involved in data collection of the APCAPS, and shared the IMS and APCAPS data. L. A. has primary responsibility for the final content. All authors were involved in data interpretation, critical revisions of the paper and approved the final version.
The authors declare that there are no conflicts of interest.
Supplementary material
For supplementary material/s referred to in this article, please visit https://doi.org/10.1017/S0007114517000563


