

1. Introduction
A long tradition in economics, management, and organization studies conceptualizes the relationship between managers and firm owners using a principal–agent framework (Jensen and Meckling, Reference Jensen and Meckling1976). Two mechanisms usually receive the most attention in terms of addressing the potential divergence of interests between owners and managers. On the one hand, owners may introduce financial incentives, such as tying executives' compensation to the long-term performance of the company. On the other hand, owners may implement direct control mechanisms, such as performing frequent audits and evaluations. In the last few decades, the standard agency framework has been criticized for relying on a restrictive set of behavioral assumptions (Pepper and Gore, Reference Pepper and Gore2015). Moreover, advances in experimental and behavioral economics have inspired a potential third mechanism, which focuses on having managers with the ‘right’ preferences as a way of reducing the wedge between owners and managers' interests (Akerlof and Kranton, Reference Akerlof and Kranton2005; Ben-Ner, Reference Ben-Ner2013; Besley and Ghatak, Reference Besley and Ghatak2005; Fehr et al., Reference Fehr, Gächter and Kirchsteiger1997).
If managerial preferences are relevant for aligning owners and managers' incentives and thus reducing agency costs, we should empirically observe firms controlled by different principals having managers with different preferences. In this paper, we compare economic preferences between managers employed in two sharply distinct organizational settings: employee-owned firms (worker cooperatives) and conventional investor-owned firms. Worker cooperatives are owned and democratically managed by their workers. This introduces a set of differences in their objectives compared to conventional firms (Bonin et al., Reference Bonin, Jones and Putterman1993). Two of these differences are particularly relevant for the managerial preferences examined in this paper. First, worker-owners' relatively low wealth and excessive concentration of financial and labor risk in the firm they own and work for make them less oriented to choose risky investment projects (Bonin et al., Reference Bonin, Jones and Putterman1993; Drèze, Reference Drèze1976; Hansmann, Reference Hansmann1988). Second, as in standard median-voter redistribution models, co-ops have relatively more egalitarian earning structures (Abramitzky, Reference Abramitzky2008; Burdín, Reference Burdín2016; Dow, Reference Dow2018; Kremer, Reference Kremer1997; Montero, Reference Montero2020).
We conduct a lab-in-the-field experiment to gather incentive-compatible measures of risk preferences, time preferences, and social preferences (altruism, reciprocity, and trust) from 196 Uruguayan managers. Half of these managers work in worker cooperatives and the other half in conventional private-sector firms. The two subsamples of managers are balanced in terms of demographic (age, gender, and education) and firm-level characteristics (size and industry composition). In order to have a benchmark for managers' preferences, we further implemented the same experiment with a sample of 92 first-year undergraduate students. We conducted the experiment in Uruguay using oTree, an open-source platform for implementing economic experiments (Chen et al., Reference Chen, Schonger and Wickens2016). The average payment in the experiment was two times higher than the average hourly managerial wage in the Uruguayan private sector. We measured risk aversion and impatience by using lottery choice and inter-temporal choice experiments based on multiple price lists (MPLs) (Falk et al., Reference Falk, Becker, Dohmen, Huffman and Sunde2016). To measure altruism, we relied on a standard Dictator Game. We elicited trust and positive reciprocity as first- and second-mover behavior in the Trust Game (Berg et al., Reference Berg, Dickhaut and McCabe1995). To measure negative reciprocity, we used subjects' minimum acceptable offer (MAO) in an Ultimatum Game (Güth et al., Reference Güth, Schmittberger and Schwarze1982). A crucial advantage of lab-in-the-field experiments is that they are conducted in a naturalistic environment targeting a theoretically relevant population without losing control of experimental conditions, combining the benefits of both laboratory and field experiments (Gneezy et al., Reference Gneezy, Leibbrandt and List2016).
We find that the fraction of risk-loving subjects among co-op managers is 10 percentage points lower than among conventional managers. Moreover, co-op managers are more altruistic than their conventional counterparts. Dictator game transfers are, on average, 6 percentage points higher for co-op managers compared to their conventional counterparts. We also find that co-op managers are significantly more (less) likely to implement the perfectly egalitarian (selfish) allocation than conventional managers. Importantly, because these differences in preferences could be correlated with other firm and manager characteristics differing between co-ops and for-profits, we report that preference differences are robust to controlling for a set of managers' characteristics (age, education, and gender) and firms' characteristics (size and industry). We do not observe significant differences between the two groups in terms of time preferences, trust, and reciprocity. Behavioral differences between co-op and conventional managers are broadly consistent with the fact that the two types of managers report to principals (employee-owners and investors, respectively) who have a different set of objectives and preferences (Ben-Ner et al., Reference Ben-Ner, Montias and Neuberger1993).
Our study contributes to the existing literature in two distinct ways. First, our paper adds to the literature on behavioral agency theory (Pepper and Gore, Reference Pepper and Gore2015; Wiseman and Gomez-Mejia, Reference Wiseman and Gomez-Mejia1998). We use incentivized lab-in-the-field experiments to uncover the prevalence of non-standard preferences among managers, providing a new reassessment of the behavioral assumptions of the standard agency framework. By comparing managers employed in conventional firms and worker cooperatives, we move beyond the traditional focus on family firms (Neacsu et al., Reference Neacsu, Gomez-Mejia and Martin2014).Footnote 1 In a study similar to ours, Fehr and List (Reference Fehr and List2004) compare the trusting behavior of CEOs and students and find that CEOs are significantly more trustful and display more trustworthiness than students. Koudstaal et al. (Reference Koudstaal, Sloof and van Praag2016) conduct a lab-in-the-field experiment comparing entrepreneurs to managers and employees in terms of risk preferences. They find that the three groups are not different in terms of risk aversion, but entrepreneurs are less loss-averse than managers and employees. Opper et al. (Reference Opper, Nee and Holm2017) study risk preferences in a sample of CEOs of private manufacturing companies in China and document correlations between elicited risk attitudes and corporate strategic choices and performance. Nee et al. (Reference Nee, Holm and Opper2018) elicit trust among Chinese CEOs and uncover a relationship between CEO experience in relational exchange and generalized trust. Finally, Holm et al. (Reference Holm, Nee and Opper2020) study the strategic behavior of CEOs of private firms in experimental games. They show that CEOs differ from other people in strategic decision-making and beliefs about the strategy of others. We add to this literature by comparing a wide range of economic preferences across managers employed in two sharply different organizational settings. Our findings are consistent with well-known facts about the behavior of worker cooperatives in market economies, such as their tendency to select into less risky and less capital-intensive industries and their more egalitarian compensation structures (Dow, Reference Dow2018). Hence, our paper also relates to behavioral strategy research, which highlights the connection between managers' behavioral preferences and firm-level strategic choices and outcomes (Powell et al., Reference Powell, Lovallo and Fox2011).
Second, we contribute to the study of worker cooperatives, employee ownership, and alternative enterprise forms. Despite their prominent economic role in modern economies (Hansmann, Reference Hansmann, Gibbons and Roberts2012), these alternative organizational forms have received far less attention than conventional profit maximizing firms in organization studies (Gibbons and Roberts, Reference Gibbons, Roberts, Scott and Kosslyn2015).Footnote 2 Importantly, the behavior of managers has been largely overlooked in the previous theoretical and empirical literature on worker cooperatives.Footnote 3 As pointed out by Atkinson (Reference Atkinson1973), this omission may be due to the long-standing practice of assuming that worker cooperatives coherently pursue a single objective of maximizing income per worker. This assumption rules out the problem of separation of ownership and control arising in any large (conventional or cooperative) firm operating under the control of appointed managers, rendering the issue of managerial behavior of only secondary analytical importance. Ben-Ner and Ellman (Reference Ben-Ner and Ellman2013) argue that the long-run success of worker cooperatives may depend on their ability to attract and retain the appropriate mix of behavioral types. They highlight the role of social preferences and personality traits in mitigating shop-floor work incentive problems, but do not address the issue of selection into top management positions. Few papers provide evidence on individuals' prosociality in cooperatives. Ruffle and Sosis (Reference Ruffle and Sosis2006) find that kibbutz members and non-members exhibit similar levels of cooperation when faced with anonymous outsiders. Gneezy et al. (Reference Gneezy, Leibbrandt and List2016) conduct economic experiments in two Brazilian fisherman societies that differ in their workplace organization and find that fishermen cooperate and trust more when fishing is organized in teams rather than as an individual activity. Hopfensitz and Miquel-Florensa (Reference Hopfensitz and Miquel-Florensa2017) find that cooperative farmers in Costa Rica do not contribute more than private market farmers to a common fund. A set of recent theoretical papers have analyzed the importance of attracting socially motivated managers for non-profit organizations and social enterprises (Besley and Ghatak, Reference Besley and Ghatak2005, Reference Besley and Ghatak2017). To our knowledge, our paper is one of the first attempts to use economic experiments to assess the behavioral pattern of selection of managers into worker cooperatives.
The paper is organized as follows. Section 2 presents the conceptual framework and hypotheses. Section 3 explains the experimental design. Section 4 presents our five main findings on managers' risk preferences, impatience, altruism, negative reciprocity, and trusting behavior. Section 5 concludes and discusses limitations and future research.
2. Conceptual framework and hypotheses
Controllers or principals are those members of the organization who collectively have the ultimate right to make decisions and delegate authority to managers or other agents (Bolton and Dewatripont, Reference Bolton, Dewatripont, Gibbons and Roberts2012; Hansmann, Reference Hansmann1988). Principals obtain their positions through the ownership of firms (Ben-Ner et al., Reference Ben-Ner, Montias and Neuberger1993). Principals are constrained by the extent to which managers are willing to cooperate and advance principals' goals. Managers may behave opportunistically and not follow owners' objectives (Jensen and Meckling, Reference Jensen and Meckling1979).
Firms can be classified according to the identity of the ultimate control group. Usually, the control group is made of persons or entities (‘patrons’) who share a common transactional relationship with the firm, either as buyers of the goods produced by the firm or as suppliers of production inputs (Hansmann, Reference Hansmann1988). In conventional investor-owned firms, control rights belong to capital suppliers. By contrast, in worker cooperatives the decisive authority collectively rests on the workforce. Given differences in the identity of their patrons, we expect to observe differences in economic preferences between managers employed in these two types of organizations. More importantly, we expect those differences to follow a pattern that is consistent with the reduction of agency costs. Next, we discuss which preferences may better align managers' decisions with owners' interests in different areas of the administration of the firm. We draw our hypotheses from existing theoretical and empirical studies on worker cooperatives.Footnote 4
2.1 Risk preferences
A long-standing explanation of the paucity of worker cooperatives in market economies rests on the idea that worker-owners may face a higher cost of risk bearing than investors. Members of a worker cooperative would be less able to cope with risk as their financial wealth and human capital are tied up in the same company (Bonin et al., Reference Bonin, Jones and Putterman1993; Drèze, Reference Drèze1976; Meade, Reference Meade1972). The preference for holding a diversified financial portfolio would be even more important when workers have firm-specific human capital (Dow, Reference Dow2018). Hence, risk-averse worker-owners would prefer to invest in relatively more conservative projects and rely on external funding.Footnote 5 Podivinsky and Stewart (Reference Podivinsky and Stewart2007) and Belloc (Reference Belloc2017) show, in fact, that worker cooperatives tend to avoid risky environments, i.e. they are less likely to enter industries in which the variance in profits is high. Moreover, there is extensive evidence showing that worker cooperatives absorb negative economic shocks through changes in income rather than layoffs (Burdín and Dean, Reference Burdín and Dean2009; Craig and Pencavel, Reference Craig and Pencavel1992; Pencavel et al., Reference Pencavel, Pistaferri and Schivardi2006).Footnote 6 This suggests that worker cooperatives attract members with a strong preference for job security (Dow, Reference Dow2018). When workers (instead of investors) act as principals in the owner–manager relationship, they may select managers that are relatively less willing to take risks.
Hypothesis 1. Co-op managers are less willing to take risks than managers employed in conventional firms.
2.2. Time preferences
Members of worker cooperatives make critical intertemporal choices regarding how to distribute the surplus between current and future consumption, i.e. between members' compensation in the current period and investment. A well-known argument states that worker cooperatives may suffer from the so-called ‘horizon problem’ (Furubotn, Reference Furubotn1976; Jensen and Meckling, Reference Jensen and Meckling1979).Footnote 7 If the assets of the cooperative are collectively owned, members have no claim on the return of investments after separation from their firm. Although the entrepreneur in a conventional business can fully pocket the investment proceeds, cooperative members can only enjoy investment returns while remaining in the firm. Hence, members' willingness to reinvest in the cooperative depends on how long they expect to stay in the firm and the expected return of the investment compared to workers' opportunity cost of the funds. If the expected employment period of members is shorter than the productive life of potential assets, this would imply that the rate of time preference (or discount rate) used in the evaluation of investment projects will be higher in cooperatives than in conventional firms.Footnote 8 Indeed, compulsory profit plow-back rules force worker cooperatives in many countries to accumulate a share of profits into asset locks (Navarra, Reference Navarra2016; Pérotin, Reference Pérotin2013). In our context, these rules could be interpreted as a commitment device aimed at helping worker-members to avoid self-destructing inter-temporal choices. Overall, we expect cooperative members would generally select and instruct managers to implement projects yielding smaller-sooner returns rather than larger-later returns.
Hypothesis 2. Co-op managers are more impatient than managers employed in conventional firms.
2.3 Social preferences
Social preferences have received increasing attention in organization studies (Ben-Ner, Reference Ben-Ner2013; Ben-Ner and Ellman, Reference Ben-Ner and Ellman2013; Camerer and Malmendier, Reference Camerer, Malmendier, Diamond and Vartiainen2007). The term refers to individuals' concern for the payoffs allocated to other individuals and the intentions that led to such payoffs (Camerer and Fehr, Reference Camerer, Fehr, Henrich, Boyd, Bowles, Camerer, Fehr and Gintis2004; Carpenter, Reference Carpenter and Macmillan2008). This definition includes altruism, reciprocity, and trusting behavior, among other prosocial behaviors.Footnote 9
Several management decisions entail within-firm distributional consequences with heterogeneous effects on different segments of the workforce. These decisions cover a wide range of managerial actions, from the definition of compensation schemes to the setting of rules regarding work conditions and required effort levels. Similarly to median-voter models of redistribution in democratic societies, cooperatives are democratic organizations and, as such, they tend to implement more egalitarian compensation schemes and working conditions (Kremer, Reference Kremer1997). Members may then want to recruit relatively more equality-oriented managers, so they are more likely to implement more egalitarian decisions.
A consequence of cooperatives' egalitarian policies that reinforces their preference for more equality-oriented managers relates to the brain-drain risks faced by this type of egalitarian organizations (Abramitzky, Reference Abramitzky2011; Burdín, Reference Burdín2016). Given that managers themselves will usually be the highest-paid worker in the co-op, they may be less likely to leave if they derive utility from themselves having a less advantageous position in the firm's earnings distribution. The lower managerial pay in cooperatives compared to conventional firms may also help to screen in more altruistic managers. Therefore, we expect altruistic preferences to be more important among co-op managers compared to their conventional peers.Footnote 10
In principle, we do not expect to observe differences between co-op and conventional managers in terms of other types of social preferences, such as reciprocity and trust. First, worker cooperatives are characterized by a dual-governance structure. On the one hand, workers-principals appoint managers, set objectives, and control how firm policies are implemented. On the other hand, managers act as quasi-principals organizing and monitoring the actions of the workers. However, although workers have the power to dismiss managers, managers cannot replace workers without a collective decision from the cooperative membership (Ben-Ner et al., Reference Ben-Ner, Montias and Neuberger1993). Overall, cooperatives offer little room for managers to reciprocate workers' actions, positively or negatively, by targeting rewards or imposing sanctions. Second, Ben-Ner and Ellman (Reference Ben-Ner and Ellman2013) highlight the role of trust in sustaining conditional cooperation in cooperatives. However, they also flag the risk of negative selection with opportunistic types seeking to join cooperatives to take advantage of trusting members.Footnote 11
Hypothesis 3. Co-op managers are more altruistic than managers employed in conventional firms.
3. Experimental design and procedures
3.1 Practical procedures
We collect experimental measures of risk, time, and social preferences. To do this, the standard procedure is to conduct incentivized experiments in a university computer laboratory using student subjects. Given the unconventional nature of our subject pool (managers), their relatively high opportunity cost of time (e.g. relevant for commuting to the laboratory site), and the complex logistics related to organizing conventional laboratory sessions, we decided to implement an online experiment. Online experiments have grown exponentially in the last few decades, particularly since the development of online labor markets such as Mturk. Horton et al. (Reference Horton, Rand and Zeckhauser2011) show that online experiments can quantitatively reproduce behavior from the physical laboratory. Eckel and Wilson (Reference Eckel and Wilson2006) discuss potential threats to the validity of online experiments. In the context of the present study, the use of online experiments is a pragmatic solution to the problem of recruiting subjects with a relatively high opportunity cost of time.
We implemented our online experiment using oTree (Chen et al., Reference Chen, Schonger and Wickens2016). oTree is an open-source software platform that allows running experiments remotely. oTree use provides a highly flexible solution as managers can participate in the experiment from their own locations at any time by relying on a wide range of devices (desktop computers, tablets, and phones). In total, 288 subjects participated in our study. This included 96 cooperative managers, 100 conventional managers, and 92 students. Managers correspond to the highest-ranked worker in firms' hierarchical structure. Thus, each manager in the experiment corresponds to a single firm. The sample of managers comes from a firm-level survey conducted by members of the research team in 2011 (Alves et al., Reference Alves, Burdin, Carrasco, Dean and Rius2012). Cooperatives in this survey were representative of the universe of Uruguay cooperatives. Conventional firms participating in the survey were representative of conventional firms in economic sectors with the presence of worker cooperatives.
The 96 cooperatives with managers participating in our experiment account for 22% of the population of Uruguayan worker cooperatives registered in 2016. Managers in cooperatives are appointed by worker-members and take care of the daily operation of the company, consulting members when it comes to making strategic decisions (e.g. investments). Uruguayan worker cooperatives usually fill managerial positions by relying on members rather than on hired labor.
Participation in the experiment was voluntary and subjects were free to quit the experiment at any time. A few manager subjects started the experiment but did not complete all of the experiment's phases or did not provide their bank account information to receive the payment. We do not consider these subjects in any of the paper's results. In the invitation letter distributed among participants, we explained the purpose of the study in very general terms (‘the objective of this research project is to analyse human behaviour in various situations’). This should mitigate concerns about potential experimenter effects, as participants had no clue about the details of the study.
We recruited students by e-mail through the student list of a first-year undergraduate course at the Business and Economics School of National University of Uruguay (Universidad de la República). An initial e-mail invitation was sent out asking for those interested in participating in the study. Responders were then contacted via e-mail providing them with information about the procedure to participate online, potential earnings, and rules of payment. Managers were contacted by phone and then received an e-mail invitation with information about the experiment's general procedure and expected earnings. After accepting to participate in the experiment, subjects received an e-mail with a unique URL to the experiment. These URLs contained a random code so even if participants communicated with one another, the link would not allow them to identify other players. This is particularly important for the Ultimatum and Trust games, which involve sequential strategic interactions. The same experimental protocol was applied to all subjects. Payoffs earned in the incentivized experiments were paid out to subjects by bank transfer in the same week they completed the experiment, except for the time discounting experiment that involved payments after 3 and 6 months. Online sessions lasted about 40 minutes and the average payoff was 1,027 Uruguayan pesos (34 US dollars at the time), including a show-up fee of 480 Uruguayan pesos. The stake is two times higher than the average hourly managerial wage in the Uruguayan private sector as reported in the official household survey. We conducted the experiment in 2018. The experiments with students extended over a couple of weeks between February and March and the experiments with managers took place between May and November.
In Table 1, we report descriptive statistics on observable characteristics for the three groups of subjects. The table shows that the subsamples of co-op and conventional managers are balanced in terms of demographic (age, gender, and education) and firm-level characteristics (size and industry composition). Students are obviously younger than managers on average.
Descriptive statistics
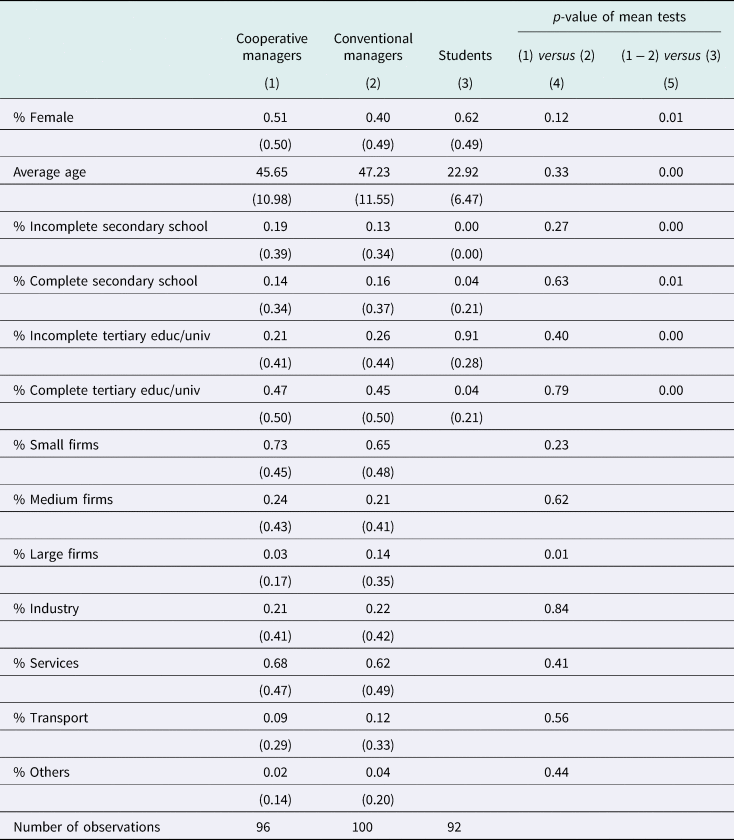
Notes: Firm size categories defined as follows: small firms (less than 20 employees), medium firms (20–99 employees), and large firms (100+ employees). Standard deviation in parenthesis. In column (4), we report the difference in means test between co-op and conventional managers. In column (5), we compare managers and students.
3.2 Description of experiments
We rely on standard incentivized tasks and experimental games designed to elicit risk preferences, impatience, altruism, trust, and positive and negative reciprocity. The experiments' design follows Falk et al. (Reference Falk, Becker, Dohmen, Huffman and Sunde2016) closely. Monetary stakes were presented in points (100 points = 21 Uruguayan pesos = 0.7 US dollars). All experimental games involving strategic interactions were one-shot games in order to avoid repeated game effects. Subjects were told that they were interacting with another (anonymous) participant remotely located and that they were not going to play with the same partner more than once. We did not make participants' identities, i.e. managers employed in cooperatives and conventional firms, salient in any particular way. Participants then knew that they were interacting with human subjects but did not know about any characteristics of those subjects. In the Dictator, Ultimatum, and Trust games (see below), each subject played the game twice, once in each role. As our focus is on between-subject comparisons, choice experiments were presented in the same order to all subjects.Footnote 12
3.2.1 Risk preferences
We elicited risk preferences by using an MPL in which subjects choose between a lottery and varying safe options (Charness et al., Reference Charness, Gneezy and Kuhn2013; Dohmen et al., Reference Dohmen, Falk, Golsteyn, Huffman and Sunde2017; Holt and Laury, Reference Holt and Laury2002). We presented participants a list of 21 decisions between two options: a safe one (option A) and a risky one with known probabilities (option B). In each row, option B corresponded to earning 1,000 points with a 50% chance or zero points with a 50% chance. The safe option A, on the contrary, gradually increased from zero (row 1) to 1,000 points (row 21). After a participant made a decision for each row, we randomly determined which row was relevant for the participant's payoff. Depending on the subject's choice in that row, her payoff would be either the safe option or the outcome of the lottery. This procedure guarantees that each decision is incentive-compatible (Dohmen et al., Reference Dohmen, Falk, Golsteyn, Huffman and Sunde2017). Our measure of risk is the value of the safe option at the switching row, i.e. the row in which subjects switch from preferring the lottery to the safe payment.Footnote 13 Following Holt and Laury (Reference Holt and Laury2002), as long as subjects have monotonic preferences, they will prefer the lottery up to a certain level of the safe option, and then switch to preferring the safe option in all subsequent rows of the price list. The value of the safe option at the switching point is usually interpreted as subjects' certainty equivalent. The higher the value of the safe option, the greater is the individual's willingness to take risks. Risk-averse subjects should prefer safe options that are smaller than or equal to 500 points (the expected value of the lottery) over the lottery. Only risk-loving subjects should prefer the lottery when the offered safe payment is greater than 500 points.
3.2.2 Time discounting
We elicited time preferences by using an MPL, in which subjects choose between a payment today (400 points) and a larger delayed payment in 3 months. The early payment was always 400 points and the delayed payment increased by 10 points in each subsequent row, starting from 430 points in the first row and reaching 660 points in the 24th row. The first-row value implied an inflation-discounted annual return rate of around 24% and the value in the 24th row reached an annual return rate of around 600%. Our experimental measure of impatience is the value of the delayed payment (the implied rate of return) that is necessary to induce the subject to wait 3 months, i.e. the row in which the subject switches from the early payment to the delayed payment.Footnote 14 Similar to the procedure used in the domain of risk, after participants made a decision in each row, we randomly determined which row was relevant for the participant's payoff. To reinforce subjects' credibility about the experiment and its associated payment, we attached a letter signed by the School's Dean. We also implemented a second MPL in which we introduced front-end delay (shift horizon design): subjects choose between an early payment in 3 months and a larger payment in 6 months. The within-subject comparison between the front-end delay and no front-end delay choice sets conveys information on the extent of present bias or dynamic inconsistency among subjects (Frederick et al., Reference Frederick, Loewenstein and O'Donoghue2002).
3.2.3 Altruism
We measured altruism by the share of the endowment (300 points) transferred by dictators in a standard Dictator game. In this game, the Dictator decides how to split the endowment between herself and another player, the Recipient (Forsythe et al., Reference Forsythe, Horowitz, Savin and Sefton1994; Kahneman et al., Reference Kahneman, Knetsch and Thaler1986). The standard prediction assuming self-regarding dictators is that subjects would share nothing with the Recipient and keep the whole endowment for themselves.
3.2.4 Trust
We elicited trust as the first mover's behavior in the Trust game (Berg et al., Reference Berg, Dickhaut and McCabe1995). More precisely, we measure trust as the amount sent by the first mover (‘Trustor’) in this game. In our trust game, a Trustor and Trustee each receive an initial endowment of 250 points. The Trustor can invest all or part of her money by sending any amount y ∈ {0, 50, 100, 150, 200, 250} to the Trustee. The experimenter then triples the amount sent, so that the Trustee receives 3y. The Trustee then decides to return any amount z between 0 and 3y + 250 to the Trustor. As a result of these decisions, the Trustor and Trustee's final payoffs are 250 − y + z and 250 + 3y − z, respectively. The standard prediction is that self-regarding trustees will return z = 0. Anticipating that, a self-regarding Trustor should transfer nothing (y = 0).
3.2.5 Reciprocity
Following Fehr and Gächter (Reference Fehr and Gächter2000), a preference for reciprocity is the desire to punish others seen as harming one (negative reciprocity) and the desire to benefit others seen as benefiting one (positive reciprocity). We measured negative reciprocity with the MAO in the Ultimatum game (Güth et al., Reference Güth, Schmittberger and Schwarze1982). In the Ultimatum game, a Proposer makes an offer y regarding the division of an initial endowment (500 points) between herself and a Responder. The Responder can either accept or reject the offer. In the latter case (y < MAO), both players earn zero. If the Responder accepts the offer (y ≥ MAO), she earns y and the Proposer earns 500 − y. The higher the MAO, the more subjects are willing to forgo their monetary gain in order to punish unfair offers. The standard prediction for this game is that self-regarding responders will accept any positive offer and that Proposers will offer the smallest possible positive amount. Finally, we elicit positive reciprocity as the second mover behavior in the Trust game and measure it as the amount sent back in that game. We relied on the strategy method, which implies that participants make conditional decisions for the same discrete set of predetermined offers.Footnote 15
4. Results
This section presents our main findings. We are interested in understanding whether managers employed in cooperatives exhibit different economic preferences than managers employed in conventional enterprises. For each preference domain, we compare the two subsamples of managers. We also report the results for the student pool in order to have a conventional subject pool as a benchmark.
Result 1. The share of risk-loving subjects is significantly lower among co-op managers than among managers employed in conventional firms.
We measure risk attitudes by looking at the value of the safe option at the switching row for each individual, i.e. the point in which the individual switches from the lottery to the safe payment. The higher a subject's certainty equivalent, the greater her willingness to take risk.
In Figure 1 (panel a), we plot the mean safe option for each of the three groups. The difference between co-op and conventional managers is not significant according to a Mann–Whitney test (p-value = 0.3168).Footnote 16 The associated median coefficient of relative risk aversion lies within the interval 0.13–0.24 for cooperative managers and 0–0.13 for conventional managers and students.Footnote 17
Risk preferences. (a) Mean safe payment at switching row. (b) Distribution of risk preferences by group.
Notes: In panel (a), the figure displays the average value of the safe payment at the switching row by group. Mann–Whitney test co-op versus conventional (student): p-value = 0.3168 (0.1169). N: Co-op managers = 83, conventional managers = 88, students = 90. In panel (b), the figure displays the distribution of risk preferences in terms of risk loving, risk averse and risk neutral subjects. Fisher's exact test (risk lovers) co-ops versus conv.: p-value = 0.051. N: Co-op managers = 96, conv. managers = 99, students = 92.
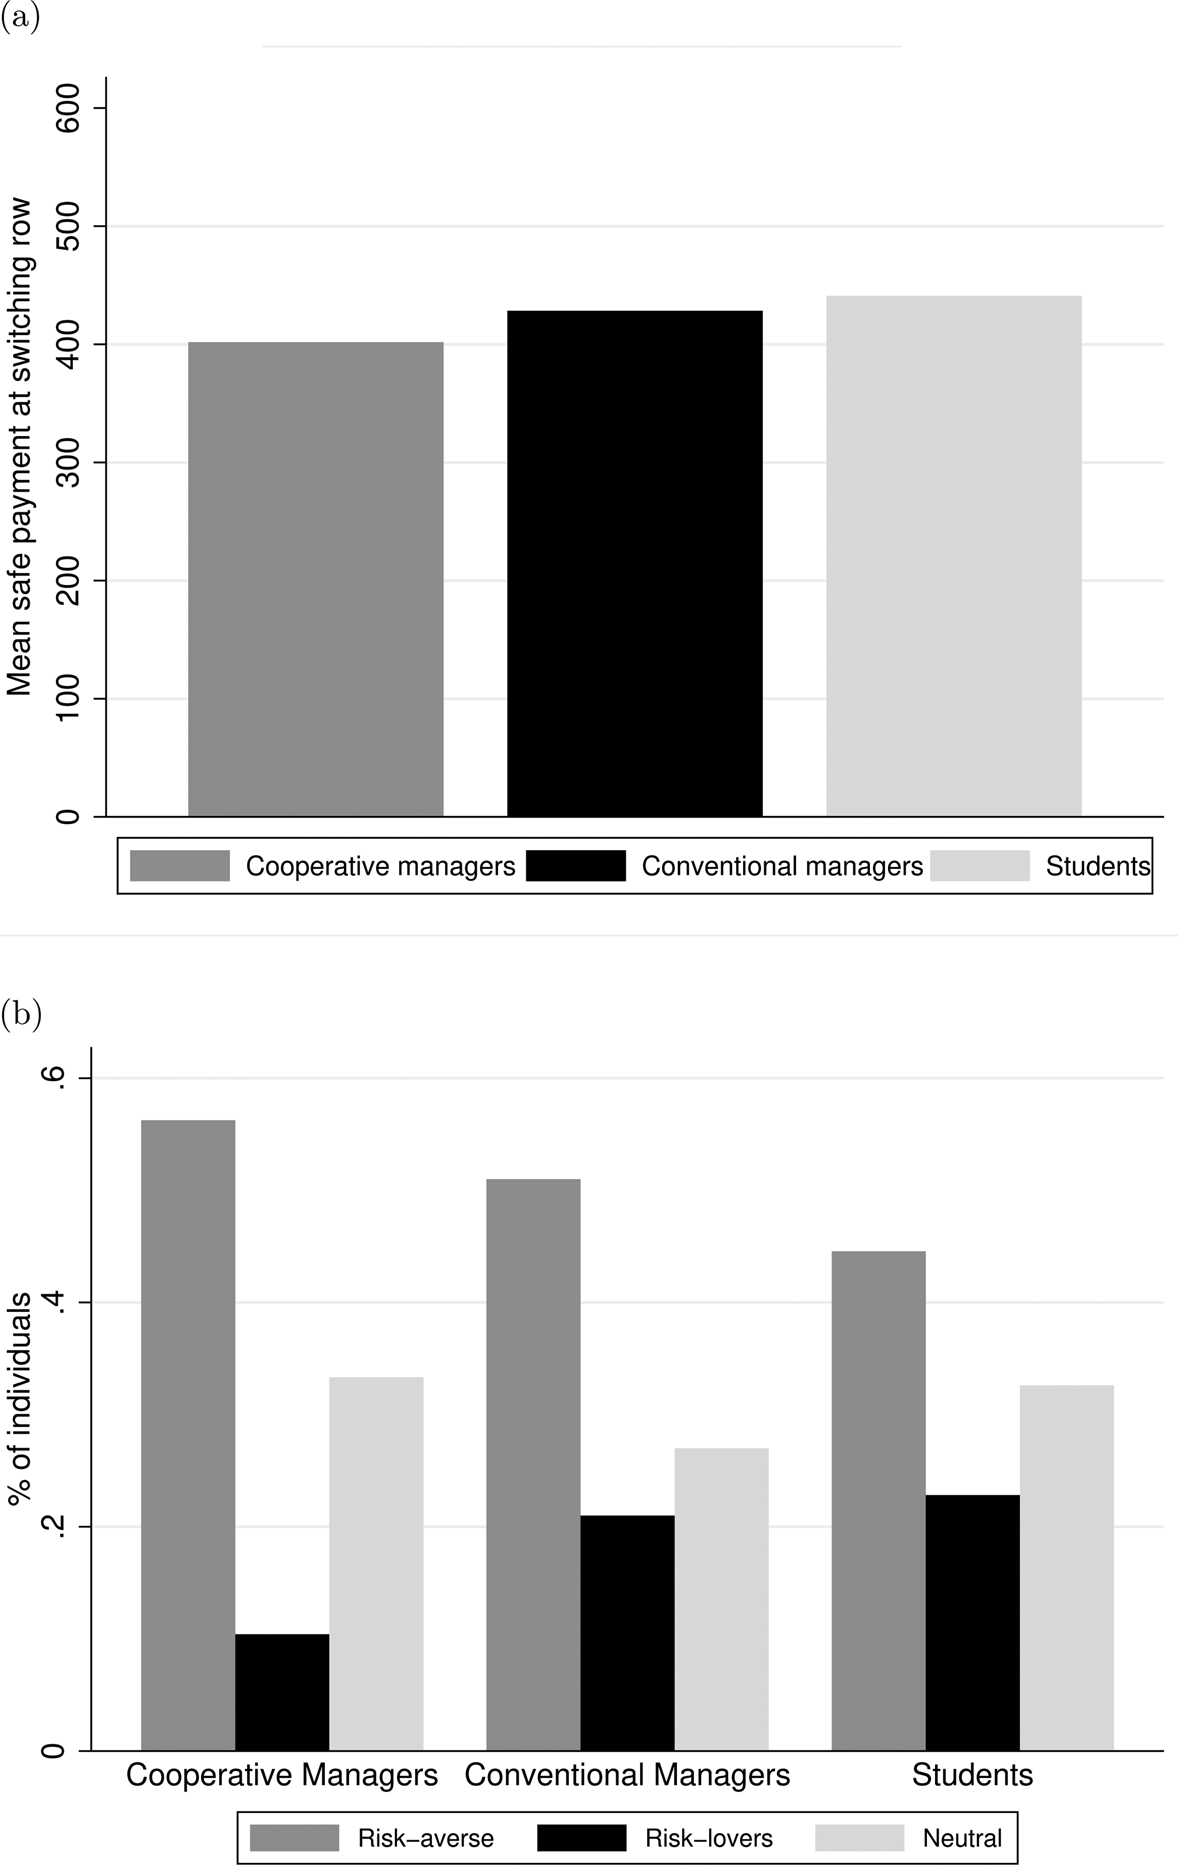
As shown in Figure 1 (panel b), the proportions of risk-neutral, risk-loving, and risk-averse subjects differ between co-op and conventional managers. Subjects are risk-neutral if they prefer the safe option to a lottery with the same expected value (i.e. 500 points) but choose the lottery for smaller values of the safe option; or if they play the lottery when the safe option is 500 points but do not play the lottery when the safe option is greater than the lottery's expected value. Subjects are risk-loving (risk-averse) if they prefer (not) to play the lottery when the safe option is larger (smaller) than the lottery's expected value. The share of risk-neutral and risk-averse subjects is not statistically different across groups at conventional values but there is a significant difference of around 10 percentage points between cooperative managers and both conventional managers and students in the share of risk-loving subjects.
To investigate this difference further, we estimate a series of Probit models in which the dependent variable equals 1 if the subject is risk loving and 0 otherwise, and the independent variable of interest is a co-op dummy. We further control for gender, age, and education. Results reported in Table A.1 in the online Supplementary Appendix reinforce the conclusion of risk-loving subjects being more common among the sample of conventional managers. The status of co-op manager is associated with a significant reduction of 10 percentage points in the probability of being a risk-loving subject, even after controlling for managers' characteristics (gender, age, and education) and firms' size and industry (column 3).Footnote 18
Result 2. There are no differences in the average degree of impatience between co-op and conventional managers. The share of dynamically inconsistent subjects is also similar across groups.
In the inter-temporal choice experiments, subjects made choices between a fixed immediate payment (400 points) and a (larger) payment to be received in 3 months. As explained in section 3, subjects also made inter-temporal choices across a 3–6 months' time horizon. As described above, the delayed payment becomes increasingly attractive as we increased its value from 430 points in row 1 to 660 points in row 24. Our experimental measure of impatience is the value of the delayed payment at the row in which subjects switch from the immediate to the delayed payment. The higher the value of the delayed payment required to postpone an immediate reward, the more impatient the subject is.
In Figure 2 (panel a), we display the mean delayed payment for the three groups in the no front-end delay (0–3 months). The difference between co-op and conventional managers is not significant according to a Mann–Whitney test (p-value = 0.7557). Regression analysis further confirms that there are no differences between the two types of managers (Tables OA.3.3 to OA.3.6 in the online Appendix). Figure 2 does not include subjects who were always impatient or always patient. Figure A.4 in the online Appendix shows the fraction of always-impatient (panel A) and always-patient (panel B) subjects by group under both the no front-end delay (left) and front-end delay condition (right). About 18% of co-op managers and 15% of conventional managers behave in that way in the no front-end delay condition. The conclusions do not change if we impute extreme values of the delayed payment to these subjects.Footnote 19
Time preferences. (a) Mean delayed payment by group. (b) Distribution of time preferences by group.
Notes: In panel (a), the figure displays the average delayed payment at the switching row by group (0–3 months). Mann–Whitney test co-op versus conventional (student): p-value = 0.7557 (0.2162). N: Co-op managers = 79, conventional managers = 85, students = 81. In panel (b), the figure displays the distribution of subjects' types in terms of constant discounters, future-biased, and present-biased subjects. Fisher's exact test (constant discounters) co-op versus conv.: p-value = 0.3390. N: Co-op managers = 87, conventional managers = 90, students = 79.
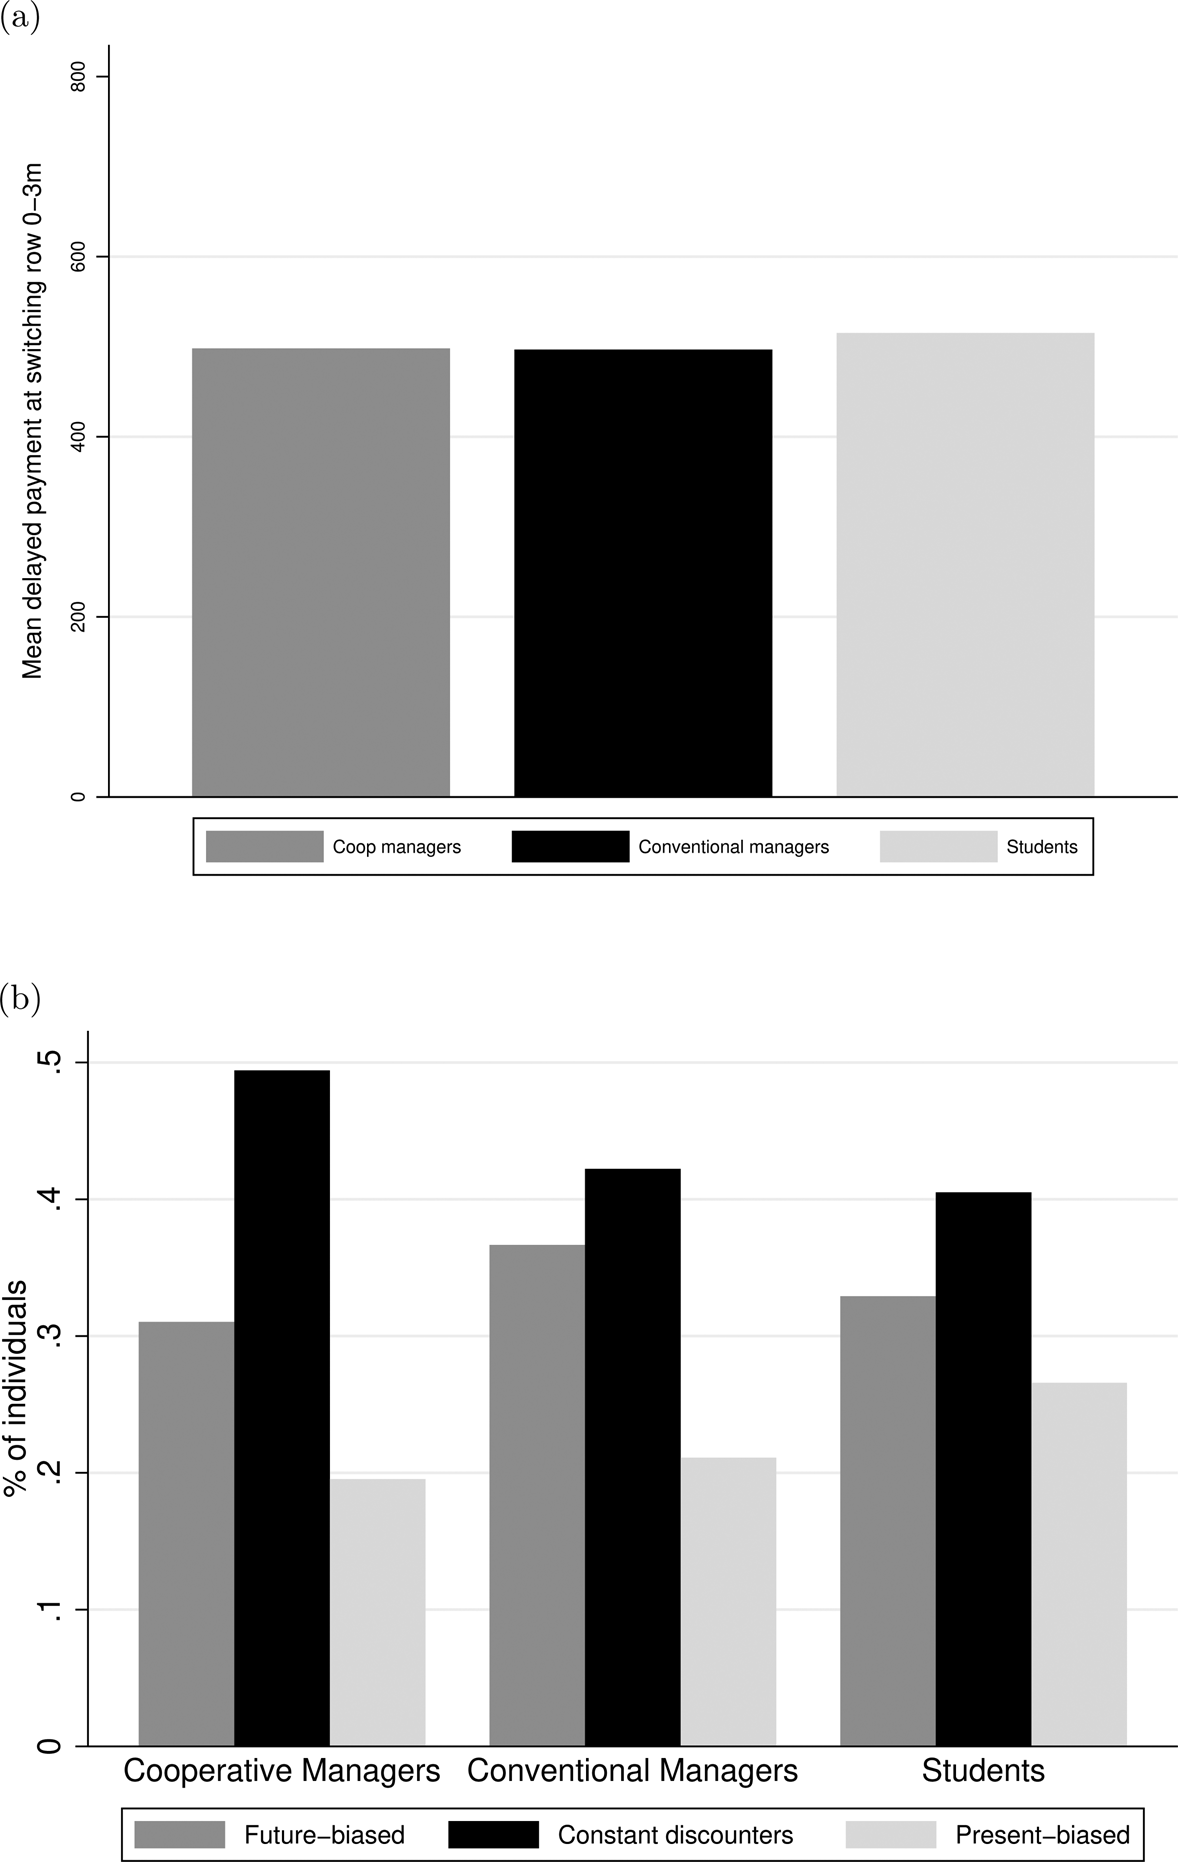
We exploit the within-subject comparison of intertemporal choices made under the two time frames to assess the extent of dynamic inconsistent behavior among cooperative managers. More precisely, we compute the fraction of subjects who were more, less, or equally patient in the 0–3 months than in the 3–6 months' horizon. We classify subjects as present-biased if they behave more impatiently (i.e. greater delayed payment at switching row) in 0–3 months than in 3–6 months. In other words, present-biased individuals are more impatient in the present than in the future. On the contrary, future-biased subjects behave more impatiently in the 3–6 month choice set than in the 0–3 month choice set. Finally, constant discounters are those who were equally patient in both choice sets. We report the composition of the three groups in Figure 2 (panel b). Approximately half of the cooperative managers made choices consistent with constant discounting. The share of present-biased subjects is similar across groups, ranging from 20 to 27%. None of the differences is statistically significant according to Fisher's exact tests.
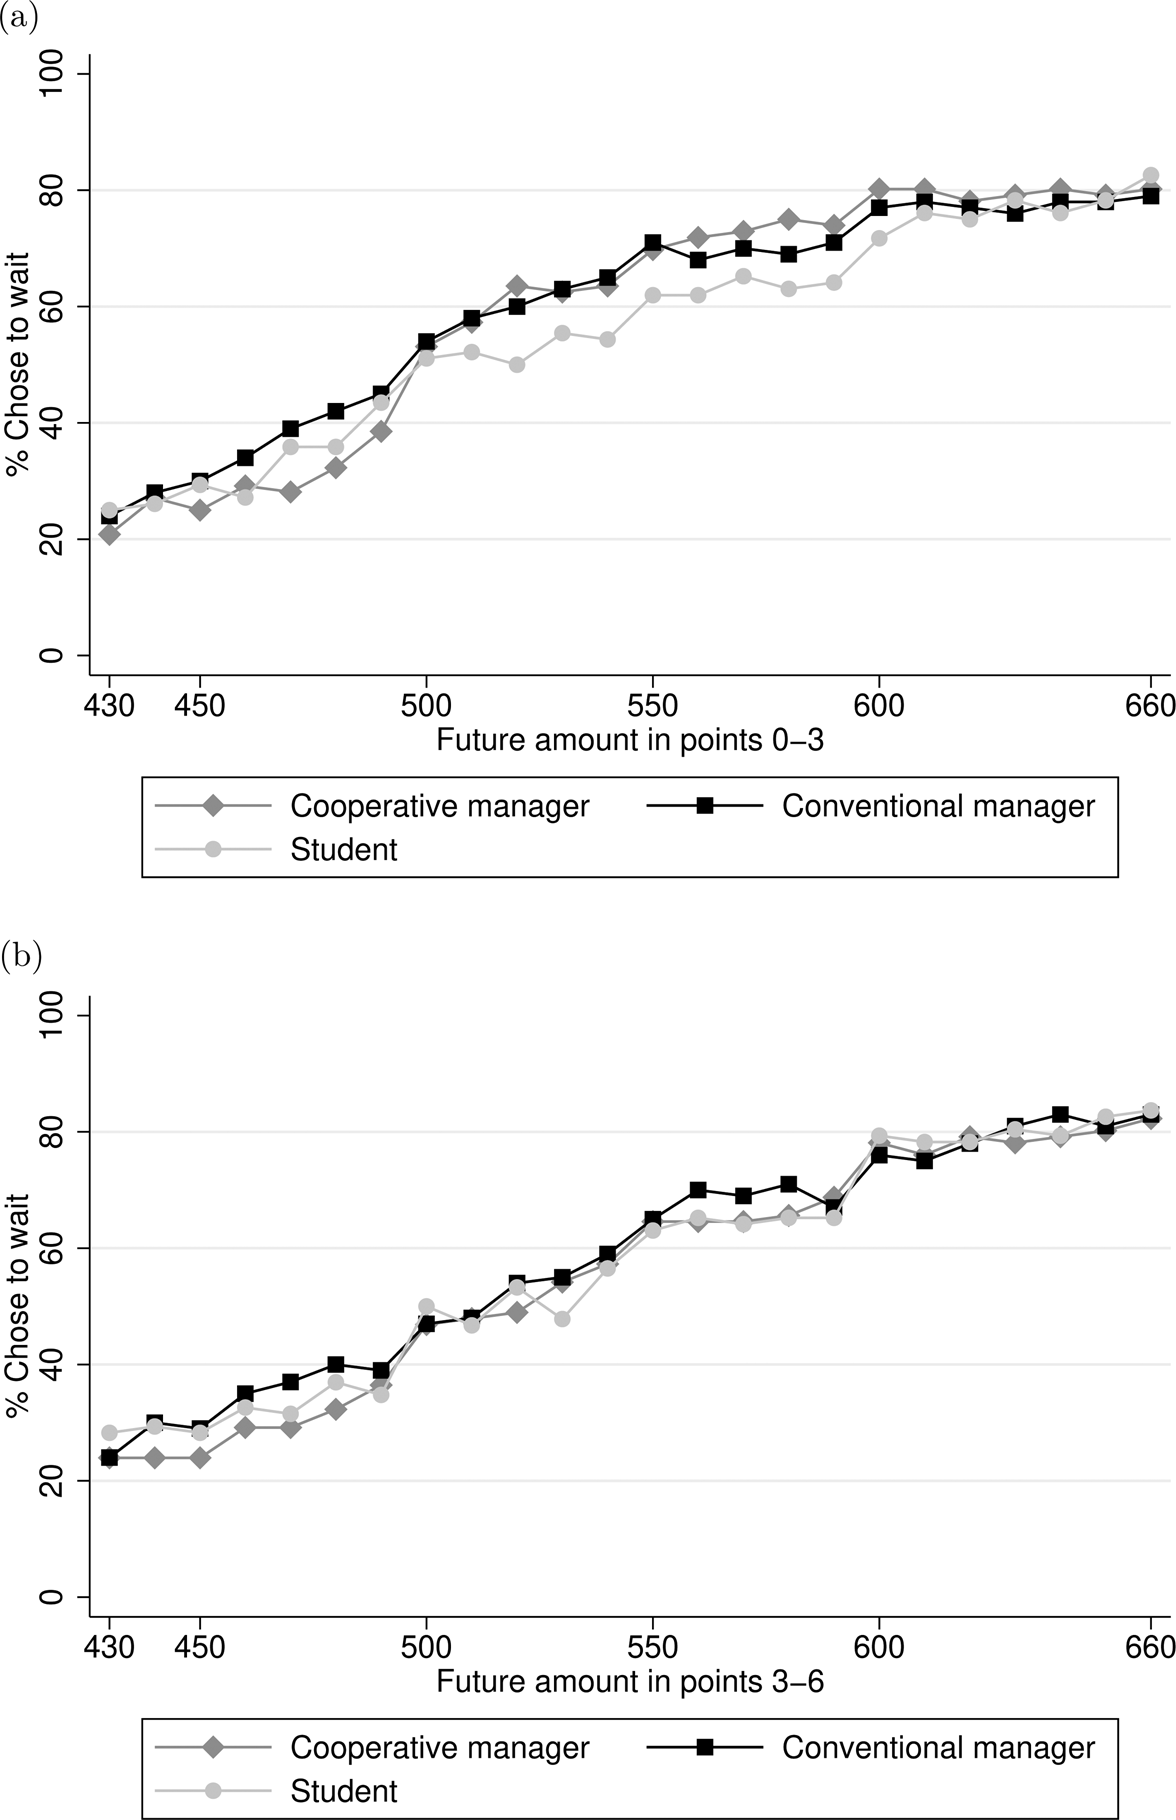
In Figure 3, we plot the fraction of patient subjects at each decision row for each group in both intertemporal choice sets (0–3 months and 3–6 months). This reinforces the idea that cooperative managers' time discounting behavior is similar to the other two groups. As expected, the fraction of subjects choosing to wait increases with the amount of the delayed payment for all groups and in both choice sets. This is reassuring considering that subjects' revealed time preferences in the 0–3 months' choice may be confounded with risk aversion and credibility concerns. Individuals may attach greater risk to delayed compensation than to the immediate payment. In the 3–6 months' choice, as both payments are dated in the future, we are holding constant any perceived risk attached to future payments (Bettinger and Slonim, Reference Bettinger and Slonim2007).
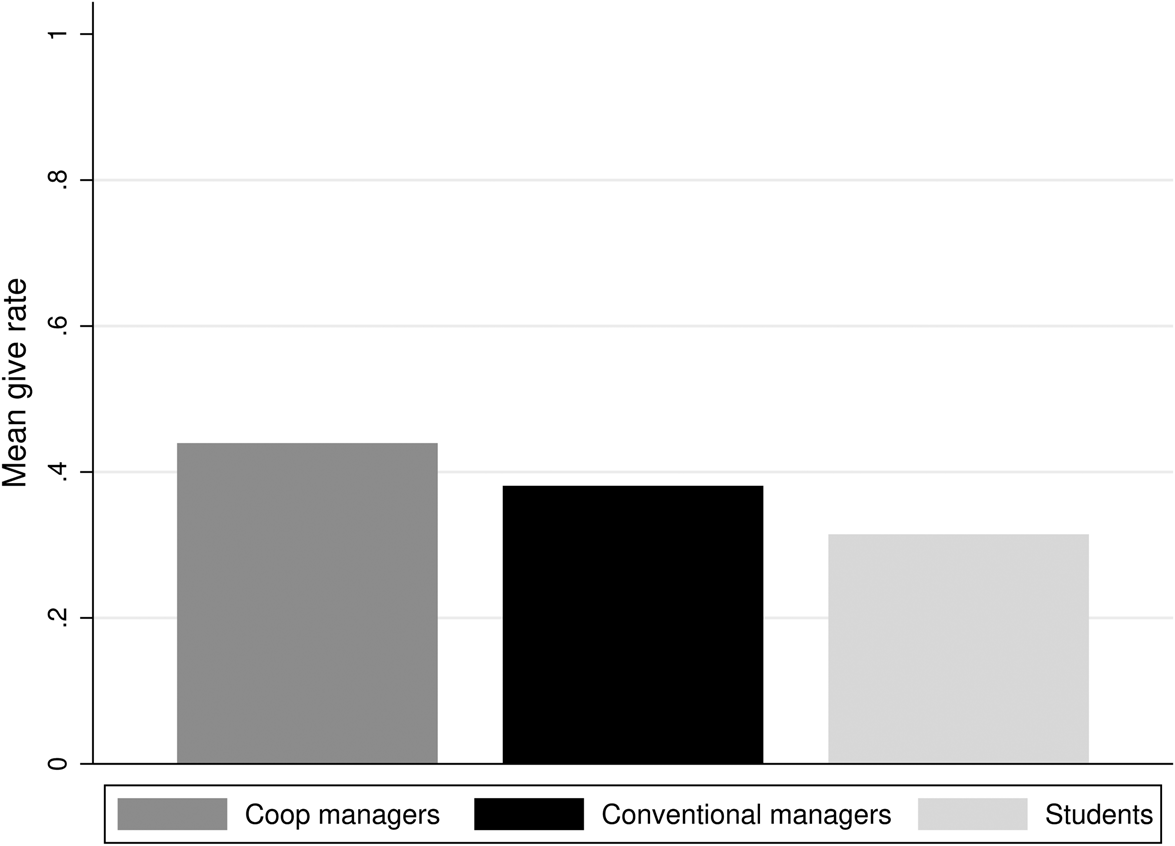
Result 3. Co-op managers appear to be more altruistic than their conventional counterparts, according to their behavior in the Dictator game. The share of subjects implementing the perfectly egalitarian (selfish) allocation is higher (lower) among cooperative managers.
Fraction of patient subjects by group. (a) No front-end delay (0–3 months). (b) Front-end delay (3–6 months).
Notes: This figure displays the fraction of subjects that chose the larger-later payment for each value of the later payment. Panel (a): no front-end delay condition (0–3 months). Panel (b): front-end delay condition (3–6 months).
Our measure of altruism is the fraction of the endowment transferred to the other subject in a standard Dictator game. Figure 4 reports the mean give rate by group. On average, co-op managers transferred 44% of the initial endowment. This compares to a mean give rate of 38 and 31% among conventional managers and students, respectively. Differences in generosity between co-op and conventional managers are statistically significant (Mann–Whitney test: p-value = 0.0382). Students are the least generous group in our experiment, even though their average contribution is in line with previous studies.Footnote 20
Give rate in Dictator game by group.
Notes: This figure displays the fraction of Dictators' endowment transferred to Recipients (give rate) by group. Mann–Whitney test co-op versus conventional (student): p-value = 0.0382 (0.000). N: Co-op managers = 96, conventional managers = 100, students = 92.
In Table A.2 in the online Appendix, we report Tobit model estimates in which we regress the give rate on a co-op dummy and controls for managers' age, gender, education, firm size, and industry dummies. Estimates of the coefficient associated with the co-op dummy are consistently positive with a magnitude around seven percentage points, but imprecisely estimated.
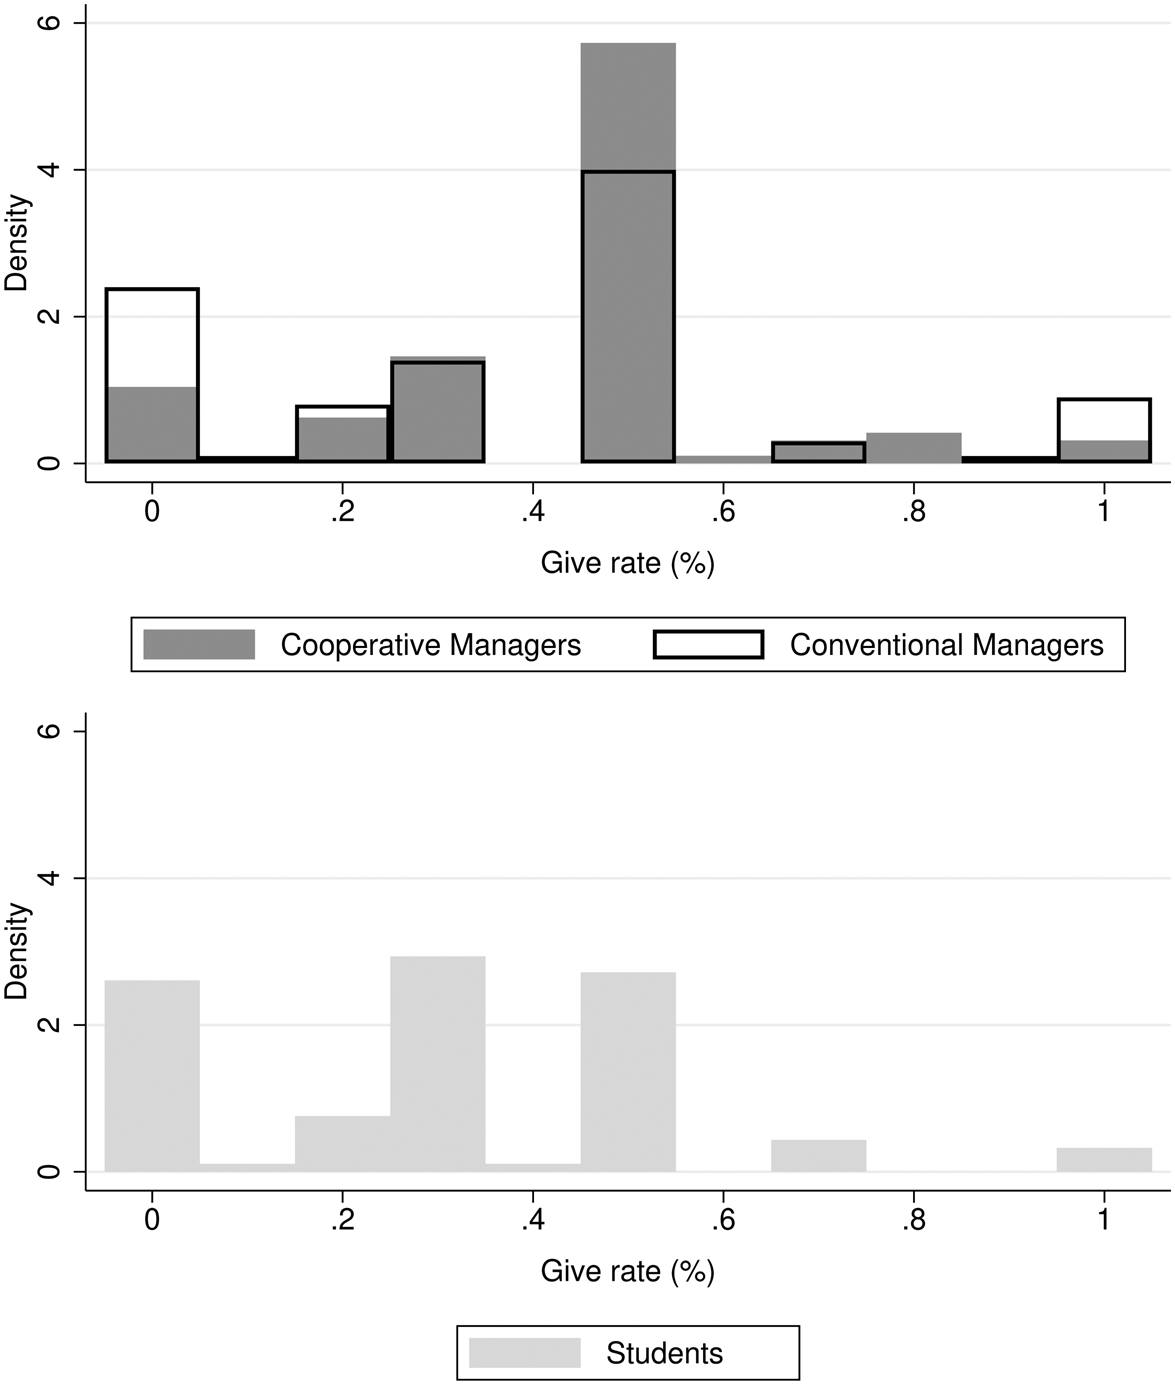
In Figure 5, we report the distribution of give rates by group. For managers, in line with previous studies, we find a bimodal distribution with one main mode at giving nothing and the other one at splitting the endowment equally. On the one hand, about 56% of co-op managers split the endowment equally. This compares to 37 and 27% of conventional managers and students, respectively. On the other hand, the fraction of co-op managers whose behavior conforms to the standard prediction based on selfish players is 5%. This share rises to 18 and 22% for conventional managers and students, respectively. Regression analysis reported in Table A.3 in the online Appendix further confirms these differences. The fraction of cooperative managers implementing the egalitarian allocation is 21 p.p. higher compared to conventional managers, after controlling for individual and firm-level characteristics (column 3). Consistently, the fraction of purely selfish players is 13 p.p. lower among cooperative managers (column 6).
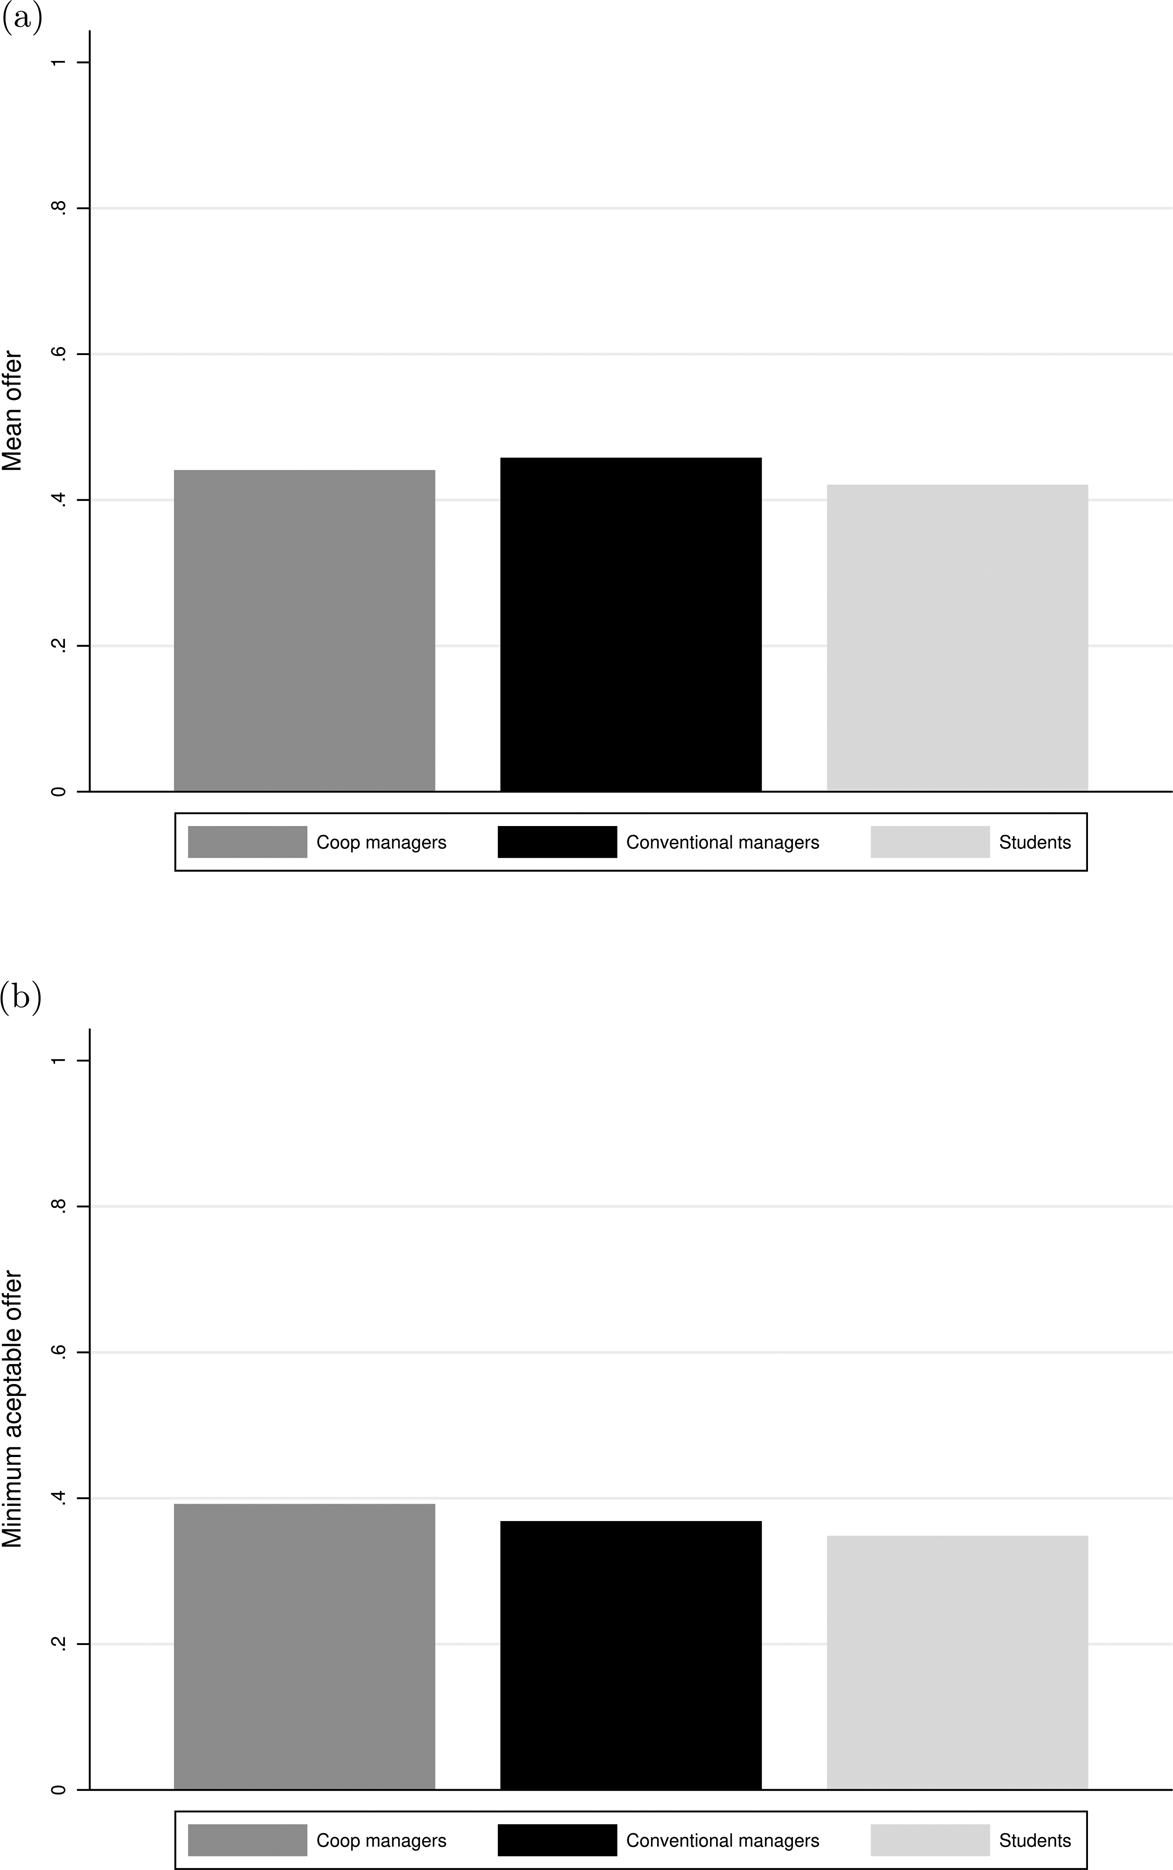
Result 4. There are no differences in the share of the endowment offered in the Ultimatum game. Moreover, the comparison of minimum acceptable offers does not reveal significant differences in terms of negative reciprocity.
Distribution of give rates in Dictator game by group.
Notes: This figure displays the distribution of give rates by group. N: Co-op managers = 96, conventional managers = 100, students = 92.
In Figure 6, we report the mean offer (panel a) and the MAO (panel b) for each group. The observed range of average offers is in line with previous studies (Oosterbeek et al., Reference Oosterbeek, Sloof and Kuilen2004) and we find no significant differences in the behavior of subjects playing as proposers. Co-op managers offered, on average, 44% of the endowment, whereas offers by conventional managers and students were 46 and 42%, respectively.Footnote 21
Ultimatum game. (a) Proposers: mean offer. (b) Respondents: MAO.
Notes: In panel (a), the figure displays the mean offer made Proposers in the Ultimatum game. Panel (a): Mann–Whitney test co-op versus conventional (student): p-value = 0.3020 (0.0291). In panel (b), the figure displays the MAO elicited from Respondents. Panel (b): Mann–Whitney test co-op versus conventional (student): p-value = 0.1931 (0.0181). Both panels: N: Co-op managers = 96, conventional managers = 100, students = 92.
The comparison of the Dictator and Ultimatum games reveals some suggestive patterns. The strategic nature of the UG implies that subjects with different degrees of altruism may exhibit similar choices. For example, in the canonical Fehr and Schmidt (Reference Fehr and Schmidt1999) model of inequity aversion, under moderate degrees of other-regarding preferences UG proposals do not depend on proposers' degree of inequity aversion but only on their expectations about receivers' preferences. In our context, this might explain why co-op and conventional managers exhibit similar proposer behavior in the UG game although DG results show that co-op managers are more altruistic. In relative terms, co-op managers transferred the same amount in the two games. By contrast, the behavior of the other two groups (conventional managers and students) reacted sharply to the new strategic incentives embedded in the Ultimatum game, rising their transfers by 8–11 p.p. compared to the Dictator game.
In Figure A.7 in the online Appendix, we report the cumulative distribution function of the fraction offered in the DG and UG. The distributions for conventional managers and students exhibit the usual pattern. The dictator game's cumulative distribution is consistent with DG offers being less generous than UG offers. Precisely, the only group for which we cannot reject the equality of the two distributions is the group of co-op managers (Kolmogorov–Smirnov test: p-value = 0.139). Acting in the role of proposers and given the veto power that responders have in this game, conventional managers and students' behavior partly reflects the strategic concern of avoiding a rejection.
Turning to responders' behavior, we rely on the MAO in the UG as a measure of negative reciprocity, i.e. a subject's willingness to punish unfair proposers at a material cost to herself. In Figure 6 (panel b), we report the average MAO by group. Acting as responders, co-op managers' MAO is approximately 40% of the endowment. Conventional managers are willing to accept slightly lower offers. However, the difference between the two groups is not statistically significant. The resulting average rejection rate was roughly 25% and similar across groups.
Result 5. Subjects' behavior in the Trust game reveals that trust and trustworthiness are not significantly different between co-op and conventional managers.
Trust can be defined as a subject's deliberate willingness to make herself vulnerable to the actions of another party (Kocher et al., Reference Kocher, Pogrebna and Sutter2013; Rousseau et al., Reference Rousseau, Sitkin, Burt and Camerer1998). In the context of the Trust game, the Trustor's trust is the willingness to transfer a positive amount to the other player with the expectation that the other person will reciprocate at her own cost. The amount returned by the trustee is commonly interpreted as a proxy for this subject's trustworthiness. Although trusting behavior allows implementing Pareto-superior allocations, it is risky for the trustor because a selfish trustee has an incentive to keep everything. Hence, trusting trustors are vulnerable to exploitation.
Figure 7 reports information on trustors (panel a) and trustees' behavior (panel b), respectively. On average, managers transferred 60% of the endowment.Footnote 22 There are no differences between co-op and conventional managers. Interestingly, students trust significantly less than managers in our experiment. This is consistent with previous evidence comparing CEOs and students and with the fact that trust increases with age (Fehr and List, Reference Fehr and List2004). This may be explained by managers' greater reliance on relational exchange in markets compared to students (Nee et al., Reference Nee, Holm and Opper2018).
Trust game. (a) Mean Trustor's transfer. (b) Trustee's back-transfers for each possible Trustors' transfer value.
Notes: In panel (a), the figure displays the mean Trustors' transfer by group. Mann–Whitney test co-op versus conventional (student): p-value = 0.6070 (0.0074). N: Co-op managers = 96, conventional managers = 100, students = 92. In panel (b), the figure displays Trustees' back-transfers elicited for each possible Trustors' transfer value using the strategy method.
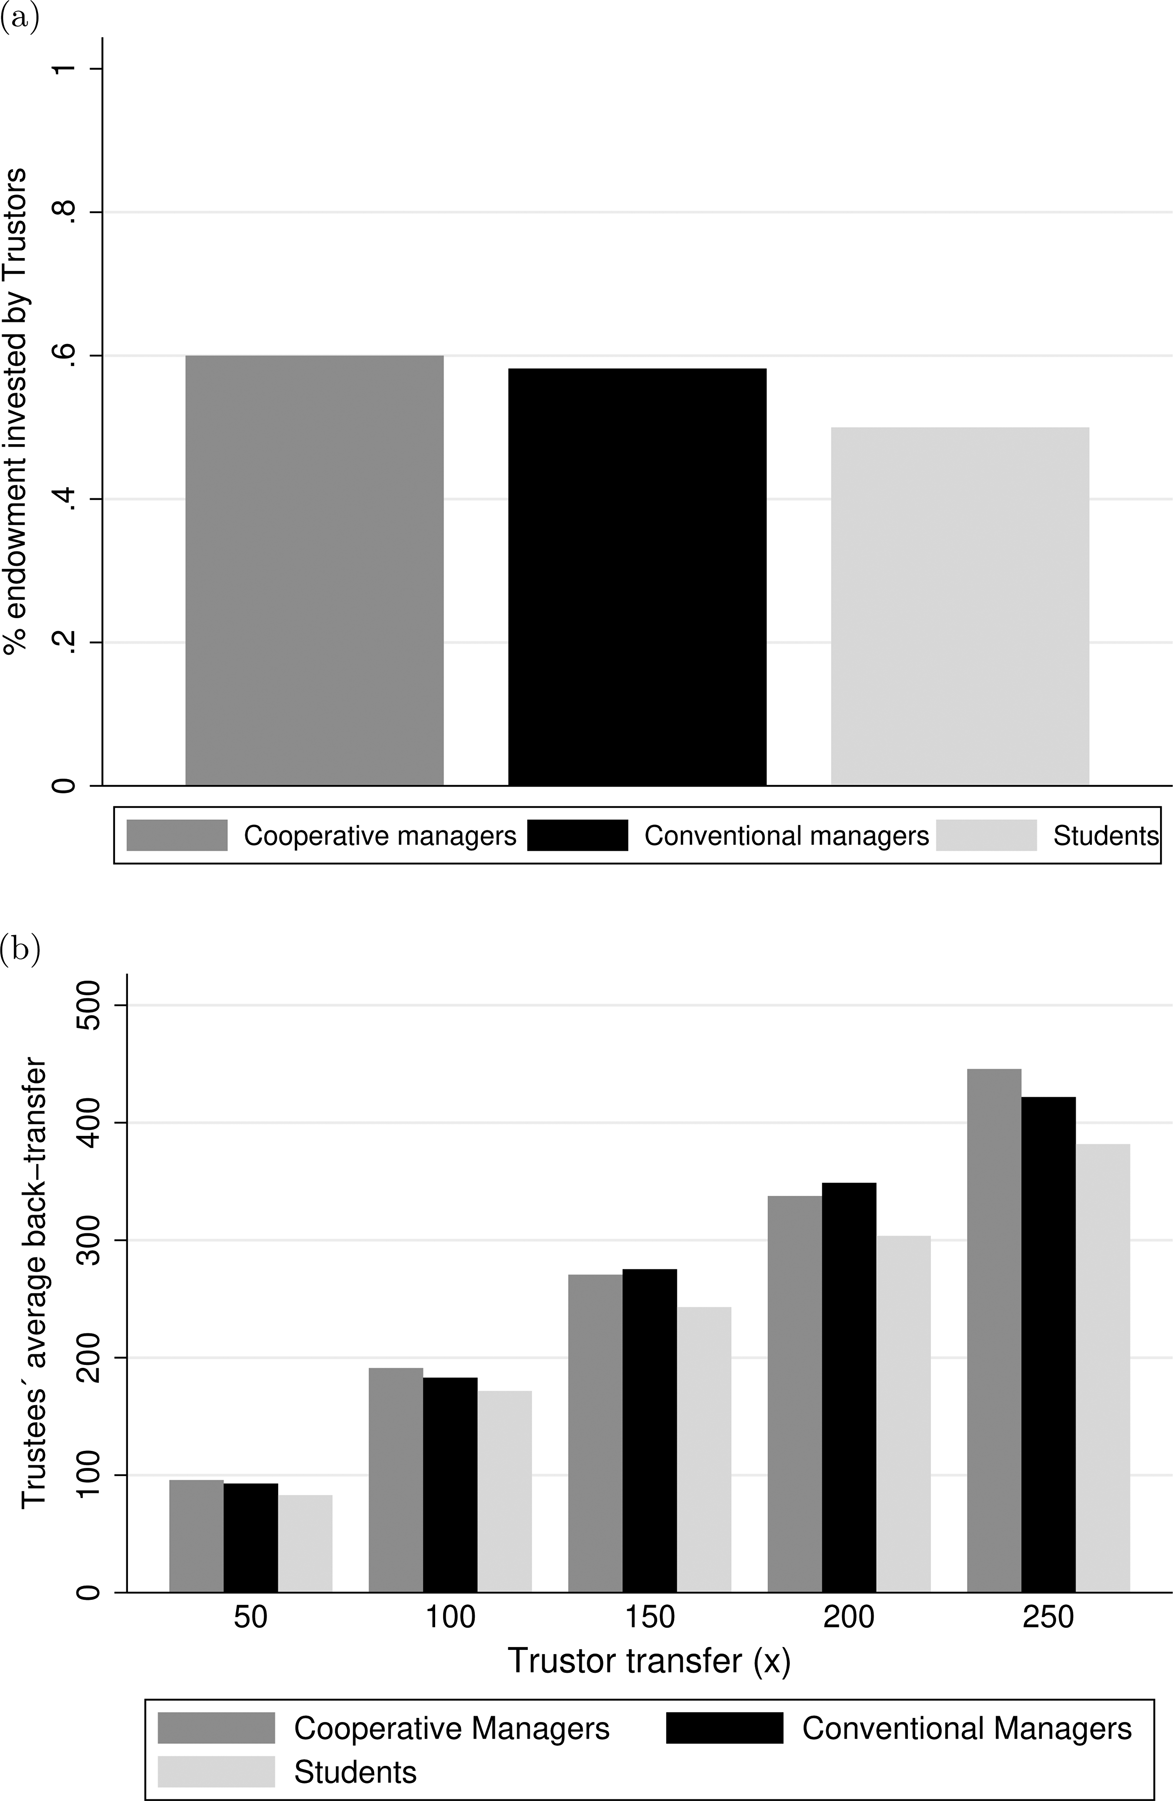
The behavior of trustees suggests a similar pattern. We elicit trustees' choices using the strategy method. Panel b of Figure 7 reports the amount returned by trustees for each possible value of trustors' transfers.Footnote 23 On average, trustees return 34.7% of the total amount available to return. We do not observe differences in subjects' trustworthiness between co-op and conventional managers. This is confirmed when controlling for their socioeconomic characteristics (age, gender, and education), for firms' characteristics, and for managers' risk attitudes.Footnote 24 The amount returned by trustees increases with the amount transferred by trustors. There is also some indication that managers exhibit greater trustworthiness than students. Results from Mann–Whitney tests indicate that these differences between both groups of managers and students become significant for trustors' transfers of at least 150 points.
5. Discussion and conclusion
Co-op and conventional managers are accountable to different principals: worker-members and investors. In this paper, we compare the economic preferences of the two types of managers using incentive-compatible measures of risk preferences, time preferences, reciprocity, altruism, and trust gathered in the context of a lab-in-the-field experiment. Our analysis supports two main conclusions. First, the fraction of risk-loving subjects is lower among co-op managers compared to conventional managers. Second, co-op managers appear to be more altruistic than their conventional counterparts. We do not observe significant differences between the two groups across other preference domains, such as impatience, trust, and reciprocity.
As managers' preferences mediate important strategic decisions within firms, our results have important implications for understanding the behavior of cooperatives in competitive markets. Observed differences between co-op and conventional managers in terms of risk preferences and altruism seem consistent with well-documented facts about the actual behavior of cooperative firms, such as their concentration in less risky and less capital-intensive industries (Podivinsky and Stewart, Reference Podivinsky and Stewart2007) and their egalitarian compensation policies (Abramitzky, Reference Abramitzky2011; Burdín, Reference Burdín2016; Montero, Reference Montero2020). Our findings indicate that the different identity of principals in worker cooperatives and conventional firms induces different patterns of behavioral selection among managers. The observed pattern is consistent with the alignment of preferences of managers and worker-principals, which, in turn, may contribute to reducing agency costs in worker cooperatives.Footnote 25
Our results suggest that less risk-prone and more altruistic individuals tend to self-select into cooperative management positions. One limitation of our research design, however, is that we cannot distinguish between selection and endogenous preference formation channels. Observed behavioral differences between individuals in worker cooperatives and conventional firms could also be due to the fact that firm ownership shapes individual preferences. The idea that preferences are malleable and may change because of contextual factors or the long-term exposure to certain institutions is now widely accepted (Bowles, Reference Bowles1998; Fehr and Hoff, Reference Fehr and Hoff2011). Experimental studies have shown that democratic institutions affect cooperative behavior (Dal Bó et al., Reference Dal Bó, Foster and Putterman2010) and organizational decision processes affect ethical behavior toward outsiders (Ellman and Pezanis-Christou, Reference Ellman and Pezanis-Christou2010). Carpenter and Seki (Reference Carpenter and Seki2011) provide field experimental evidence from Japanese fishermen supporting the idea that social preferences are endogenous to the adoption of a cooperative institution. Ben-Ner and Ellman (Reference Ben-Ner and Ellman2013) specifically discuss the potential effects of organizational design on employees' preferences.Footnote 26
Moreover, more research is needed to understand whether differences in economic preferences between co-op and conventional managers correlate with industry characteristics and translate into different management practices, organizational design, and performance.
Supplementary material
The supplementary material for this article can be found at https://doi.org/10.1017/S1744137421000783.
Acknowledgements
We are grateful to Ran Abramitzky, Avner Ben-Ner, Peter Howley, Neel Ocean, Louis Putterman, Tommaso Reggiani, the editor Geoffrey Hodgson and three anonymous referees, and conference and workshop participants at Ciriec (Bucharest), IAFEP (Lubjiana), SIOE (Stockholm), N.G.O. (Rome), and LACEA (Mexico) for helpful comments and suggestions. An earlier version of this paper circulated under the title ‘The Economic Preferences of Cooperative Managers’. This study was funded by Comisión Sectorial de Investigación Cientifíca, Universidad de la República (Uruguay).


 Open access