


Non-technical Summary
This study explores how changes in the environment affect the way species evolve or remain morphologically unchanged over time. Although scientists have long studied evolution and stasis (the tendency of species to stay the same morphologically), many questions remain about what environmental factors drive these patterns. In this study, we examine these patterns within the context of climate change. We tested the “Plus ça change” model, which suggests that species are more likely to evolve when the environment is stable (e.g., tropical latitudes or greenhouse climates) and more likely to stay the same when the environment is unstable (e.g., temperate latitudes or icehouse climates). To investigate this, we looked at the evolution of nuculid bivalves during three different climate intervals: the stable Late Cretaceous greenhouse climate, the moderately stable Neogene transitional climate; and the less stable Quaternary icehouse climate. We measured changes in the size and shape of these bivalves over time. Our findings show that nuculid bivalves evolved more during stable climate intervals and remained mostly unchanged during unstable ones. These results suggest that the stability of the climate plays a significant role in whether species evolve or stay the same morphologically. The study supports the idea that broad environmental factors, such as climate, must be considered when examining how species change morphologically over time and highlights the relevance of the Plus ça change model in explaining these patterns.
Introduction
Eldredge and Gould (Reference Eldredge, Gould and Schopf1972) argued that the dominant evolutionary pattern through time is not akin to Darwin’s (Reference Darwin1859) notion of gradual change—that is, phyletic gradualism—but instead is characterized by what they termed “punctuated equilibrium.” Their idea would lead to a significant reevaluation of the nature of evolutionary patterns observed in the fossil record as well as the mechanisms responsible for both prolonged periods of morphological stasis and sudden bursts of evolutionary change (e.g., Erwin and Anstey Reference Erwin and Anstey1995; Gould Reference Gould2002; Hunt Reference Hunt2006, Reference Hunt2007). Despite the substantial knowledge gleaned on this topic, many questions related to the processes that drive different patterns remain unresolved (e.g., Lieberman et al. Reference Lieberman, Brett and Eldredge1995; Lieberman and Dudgeon Reference Lieberman and Dudgeon1996; Eldredge et al. Reference Eldredge, Thompson, Brakefield, Gavrilets, Jablonski, Jackson, Lenski, Lieberman, McPeek and Miller2005). This gap in understanding reflects the focus of most evolutionary studies on documenting the legitimacy and frequency of different evolutionary patterns, while largely ignoring their underlying environmental context and potential controls (e.g., Kelley Reference Kelley1984; Stanley and Yang Reference Stanley and Yang1987; Erwin and Anstey Reference Erwin and Anstey1995).
Considerable debate currently surrounds the analyses of mechanisms controlling patterns of evolution and stasis, with some researchers emphasizing environmental factors (Sheldon Reference Sheldon1996, Reference Sheldon, Bijlsma and Loeschcke1997), whereas others focus on intrinsic factors, such as genetic constraints or developmental processes (Lieberman and Dudgeon Reference Lieberman and Dudgeon1996; Gould Reference Gould2002; Eldredge et al. Reference Eldredge, Thompson, Brakefield, Gavrilets, Jablonski, Jackson, Lenski, Lieberman, McPeek and Miller2005). In paleobiology, most studies examining the relationship between physical environmental change and evolution have typically utilized compilations, such as the Paleobiology Database (www.paleodb.org), to investigate broadscale controls on macroevolutionary patterns of diversification over large spans of geological time (e.g., Alroy et al. Reference Alroy, Koch and Zachos2000; Cárdenas and Harries Reference Cárdenas and Harries2010; Cárdenas-Rozo and Harries Reference Cárdenas-Rozo and Harries2016). This lack of focus on the environmental context or controls on microevolutionary processes and patterns is due to the assumption that evolutionary responses to environmental change almost always result in adaptive evolutionary changes in traits or the extinction of species (McKinney Reference McKinney1993). In contrast, morphological stasis has been thought to be controlled by intrinsic mechanisms, including developmental constraints and genetic homeostasis, or extrinsic controls, such as habitat tracking, stabilizing selection, or metapopulation dynamics (Hecht et al. Reference Hecht, Eldredge and Gould1974; Lieberman and Dudgeon Reference Lieberman and Dudgeon1996; Gould Reference Gould2002; Eldredge et al. Reference Eldredge, Thompson, Brakefield, Gavrilets, Jablonski, Jackson, Lenski, Lieberman, McPeek and Miller2005).
Sheldon’s (Reference Sheldon1996) “Plus ça change” model, which conceptually translates to “the more things change, the more they stay the same,” challenges the notion that environmental factors and their variability plays a minor, if any, role in determining patterns of evolution and stasis. From an evolutionary perspective, this model hypothesizes that rapid and pronounced environmental variability will result in morphological stasis until an environmental threshold is breached, which triggers rapid speciation (i.e., punctuated equilibrium); whereas reduced environmental variability, particularly when it approximates the rate of adaptation in a given clade, will drive more gradual morphological changes (i.e., phyletic gradualism). In this model, short-term and frequent physical environmental changes limit the amount of time phenotypic change can accumulate in response to a given set of environmental parameters before those conditions vary to the extent that any accumulated morphological response is overprinted by subsequent morphological changes. Thus, stabilizing selection dominates, and morphological stasis is maintained. With slower and more consistent environmental change, phenotypic evolution increases due to the longer intervals of relative environmental stability, resulting in gradual morphological change. In this model, lineages that persist in a changing environment over geological timescales are those that are relatively unaffected by each environmental shift, whereas, susceptible lineages that are unable to adapt to these environmental shifts are filtered out through extinction. Furthermore, this model predicts that species inhabiting more unstable environmental settings, such as shallow shelves and temperate or high-latitude regions, are more likely to display stasis, whereas settings with more stable environments, characteristic of the deep sea and the tropics, are more likely to display gradualism (Sheldon Reference Sheldon1996; Reference Sheldon, Bijlsma and Loeschcke1997).
These predictions for the environmental context of different evolutionary patterns inherent in the Plus ça change model should also be associated with the well-documented, broadscale climatic trends through the Phanerozoic. These trends depict the long-term oscillation between two end-members: ice- and greenhouse climatic regimes, which are predominantly controlled by the interplay of plate tectonics and orbital forcing (Frakes et al. Reference Frakes, Francis and Syktus1992; Zachos et al. Reference Zachos, Pagani, Sloan, Thomas and Billups2001; De Vleeschouwer et al. Reference De Vleeschouwer, Vahlenkamp, Crucifix and Pälike2017). Icehouse climates show the greatest amount of short-term environmental fluctuations largely within the Milankovitch frequencies, whereas greenhouses display dampened variation. There are also transitional states characterized by intermediate conditions with generally cooler intervals punctuated by shorter ice- and greenhouse phases (Wolfe and Upchurch Reference Wolfe and Upchurch1987; Frakes and Francis Reference Frakes, Francis, Ginsburg and Beaudoin1990; Wright Reference Wright1992; Steuber et. al. Reference Steuber, Rauch, Masse, Graaf and Malkoč2005; Crippa et al. Reference Crippa, Angiolini, Bottini, Erba, Felletti, Frigerio and Hennissen2016; Herbert et al. Reference Herbert, Lawrence, Tzanova, Peterson, Caballero-Gill and Kelly2016). Despite evolutionary tempo and mode being important for understanding both micro- and macroevolution, limited attention has been given to examining them within a broadscale climatic context. Harries and Allmon’s (Reference Harries and Allmon2007) reanalysis of the various studies contained within Erwin and Anstey (Reference Erwin and Anstey1995) revealed that all examples of gradual change, with or without stasis, are limited to greenhouse climate regimes, which highlighted the need to reassess evolutionary patterns within an environmental context.
The primary goal of this study is to deepen our understanding of evolutionary patterns by examining their environmental context and specifically testing predictions from Sheldon’s (Reference Sheldon1996) Plus ça change model. This study focuses on evolutionary patterns during intervals dominated by the two most common broadscale climate regimes: greenhouses and icehouses. By investigating morphological changes in various species of the marine bivalve Nucula Lamarck, Reference Lamarck1799, across these contrasting climate regimes, we aim to clarify the climatic influences on different evolutionary patterns.
Background
Broadscale Climatic Setting
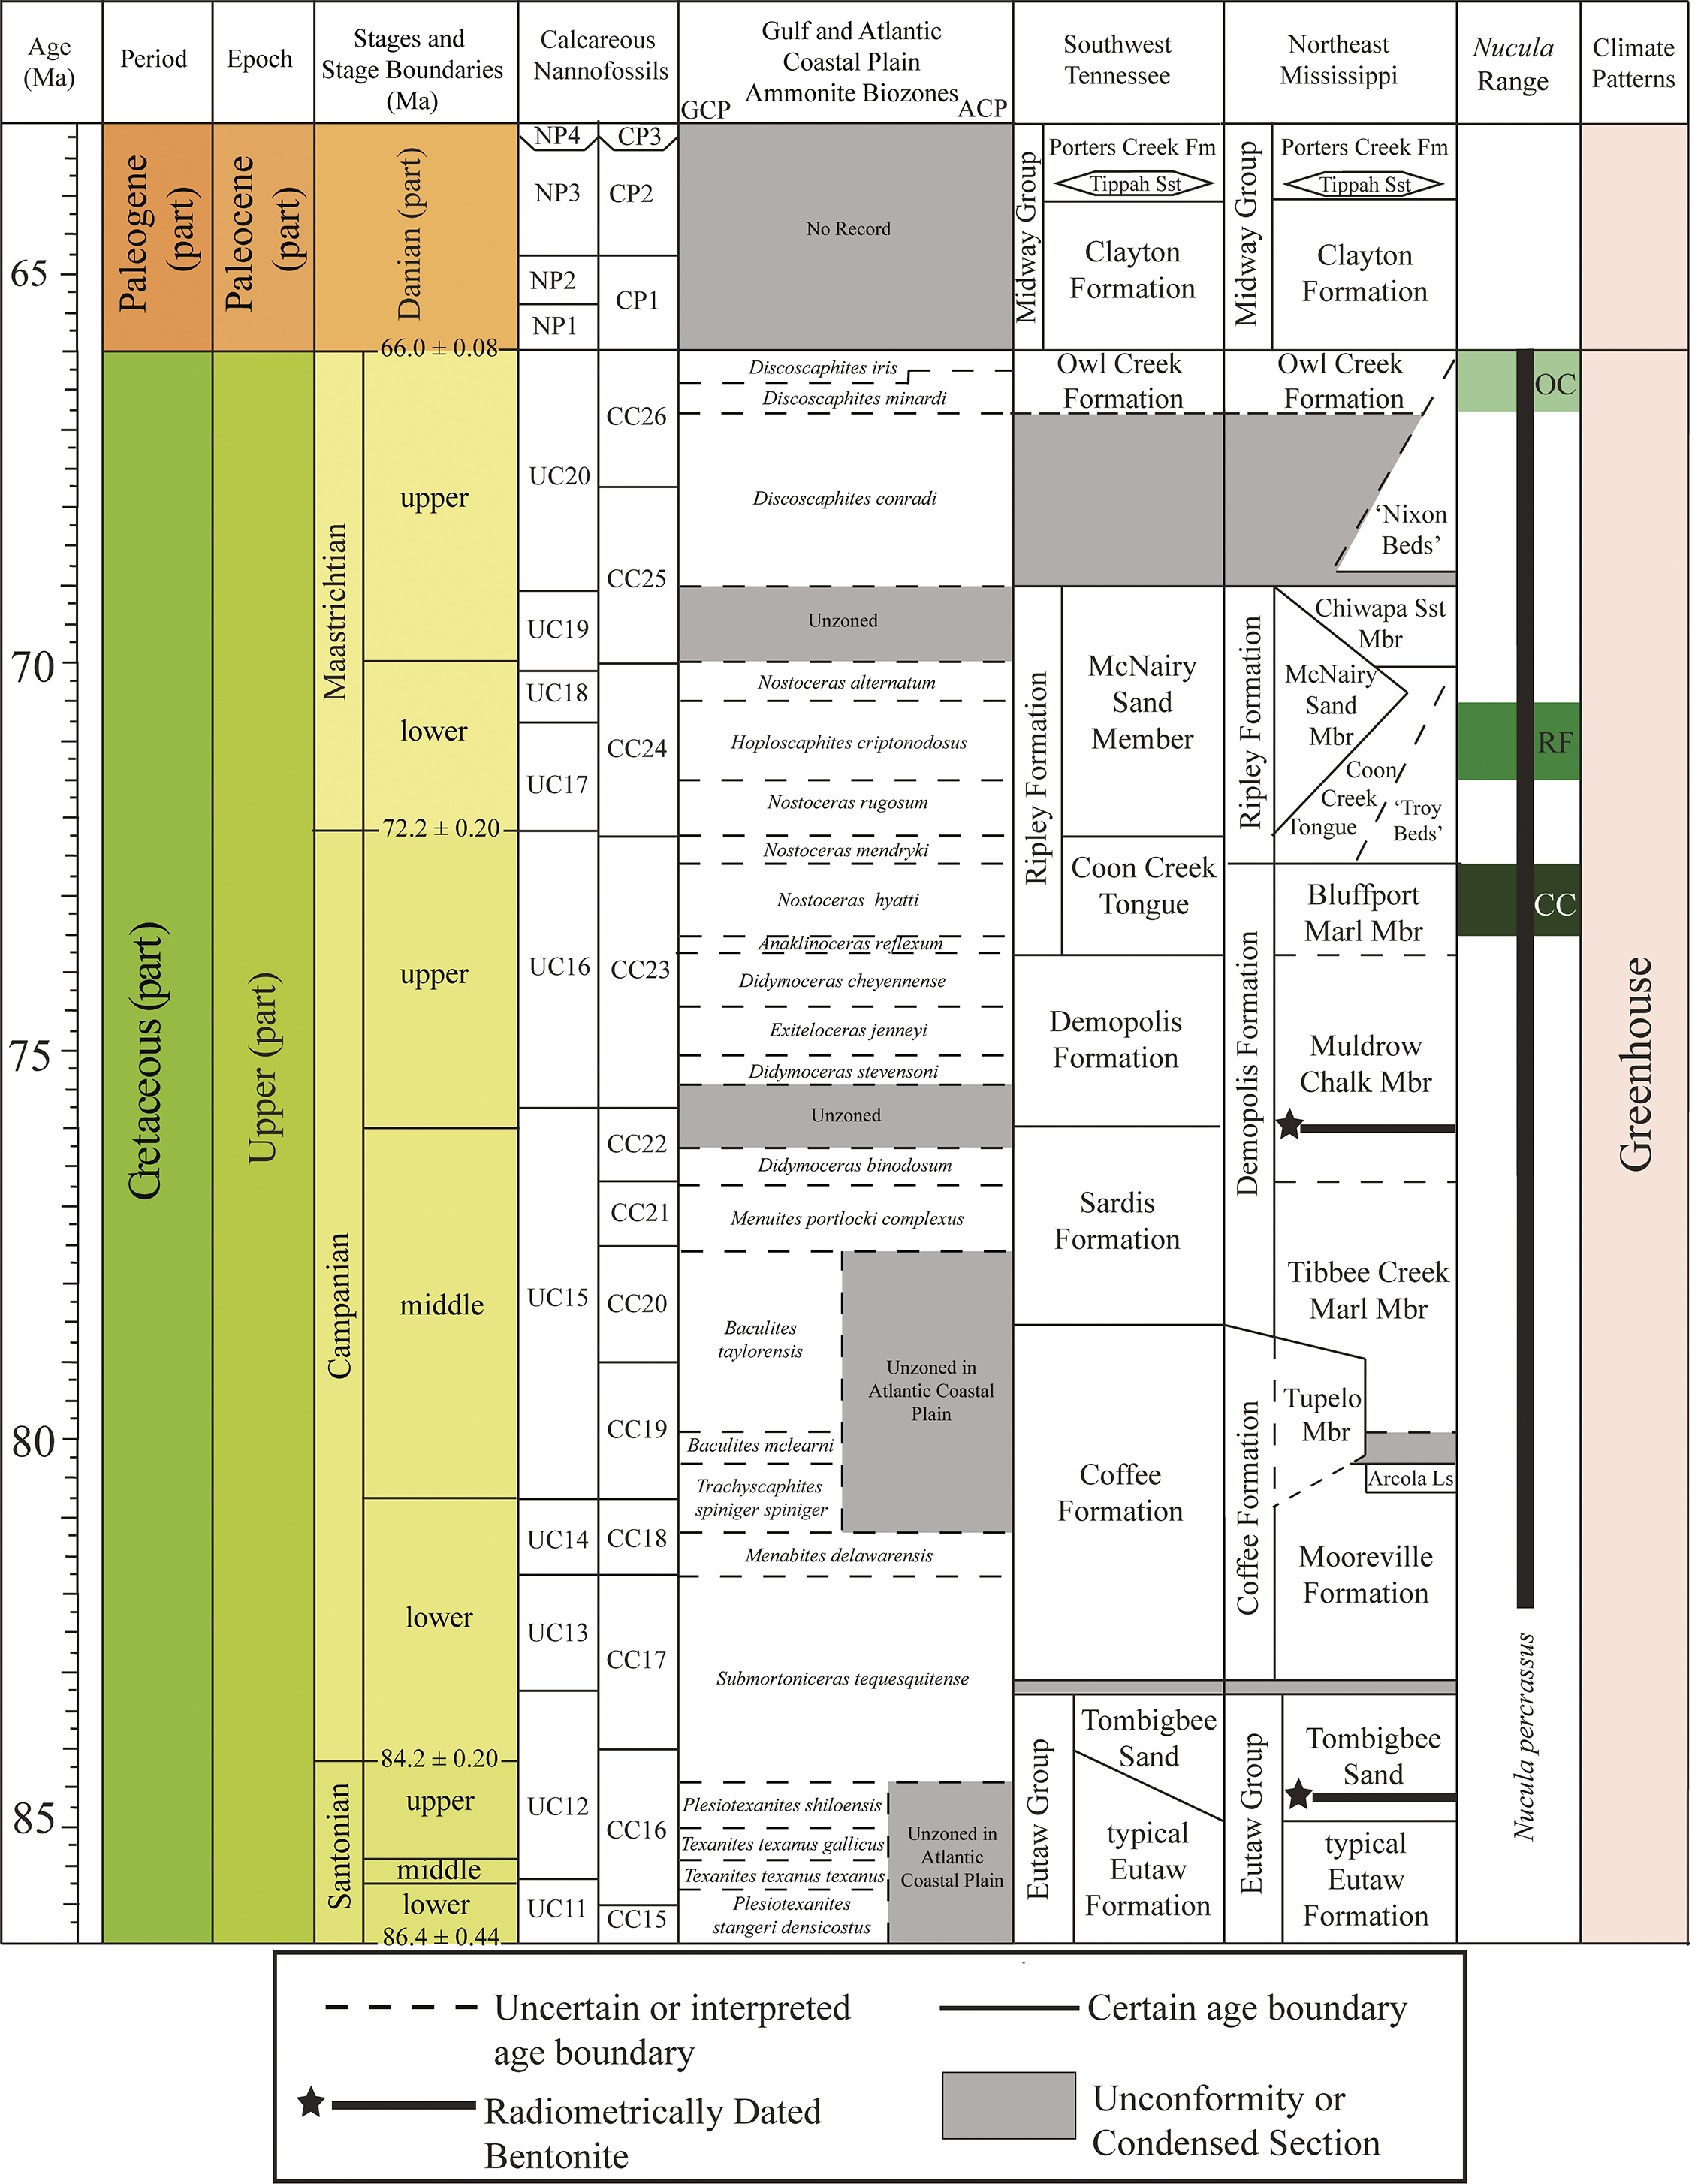
To test the Plus ça change model’s prediction that reduced environmental variability promotes evolutionary change, this study traces morphological change within the infaunal bivalve Nucula through the late Late Cretaceous, which is characterized by a greenhouse climate (Fig. 1). This interval is distinguished by elevated atmospheric pCO2 levels, forced by increased magmatism at mid-ocean ridges and associated subduction-derived volcanism (Arthur et al. Reference Arthur, Dean, Schlanger, Sundquist and Broecker1985; McKenzie et al. Reference McKenzie, Horton, Loomis, Stockli, Planavsky and Lee2016). Due to greenhouse conditions, the effects of higher-order (104 to 105 years) Milankovitch-controlled climate and sea-level changes were dampened as compared with cooler climatic intervals resulting in stable environmental conditions (i.e., little change in marine shelf areas or temperature) over long intervals (Wolfe and Upchurch Reference Wolfe and Upchurch1987; Frakes and Francis Reference Frakes, Francis, Ginsburg and Beaudoin1990; Wright Reference Wright1992; Steuber et al. Reference Steuber, Rauch, Masse, Graaf and Malkoč2005; Slattery et al. Reference Slattery, Cobban, McKinney, Harries, Sandness and Bingle-Davis2015).
Stratigraphic interval of Cretaceous Nucula percrassa Conrad, Reference Conrad1858 samples from the Gulf Coastal Plain used in study (see Fig. 3 for geographic distribution), total range of Cretaceous N. percrassa, and broadscale climate patterns (modified from Wingard and Sohl Reference Wingard and Sohl1990; Frakes et al. Reference Frakes, Francis and Syktus1992; Singer et al. Reference Singer, Jicha, Sawyer, Walaszczyk, Landman, Sageman and McKinney2024; Slattery et al. Reference Slattery, Minor, Harries, Johnson, Sandness, Slattery, Larson, Sandness, Bingle-Davis, Bingle-Davis and Grahamin press). Colored intervals on range chart correspond to time intervals and geological units sampled for this study. Abbreviations: GCP, Gulf Coastal Plain; ACP, Atlantic Coastal Plain; CC, Coon Creek; RF, Ripley Formation; OC, Owl Creek Formation.
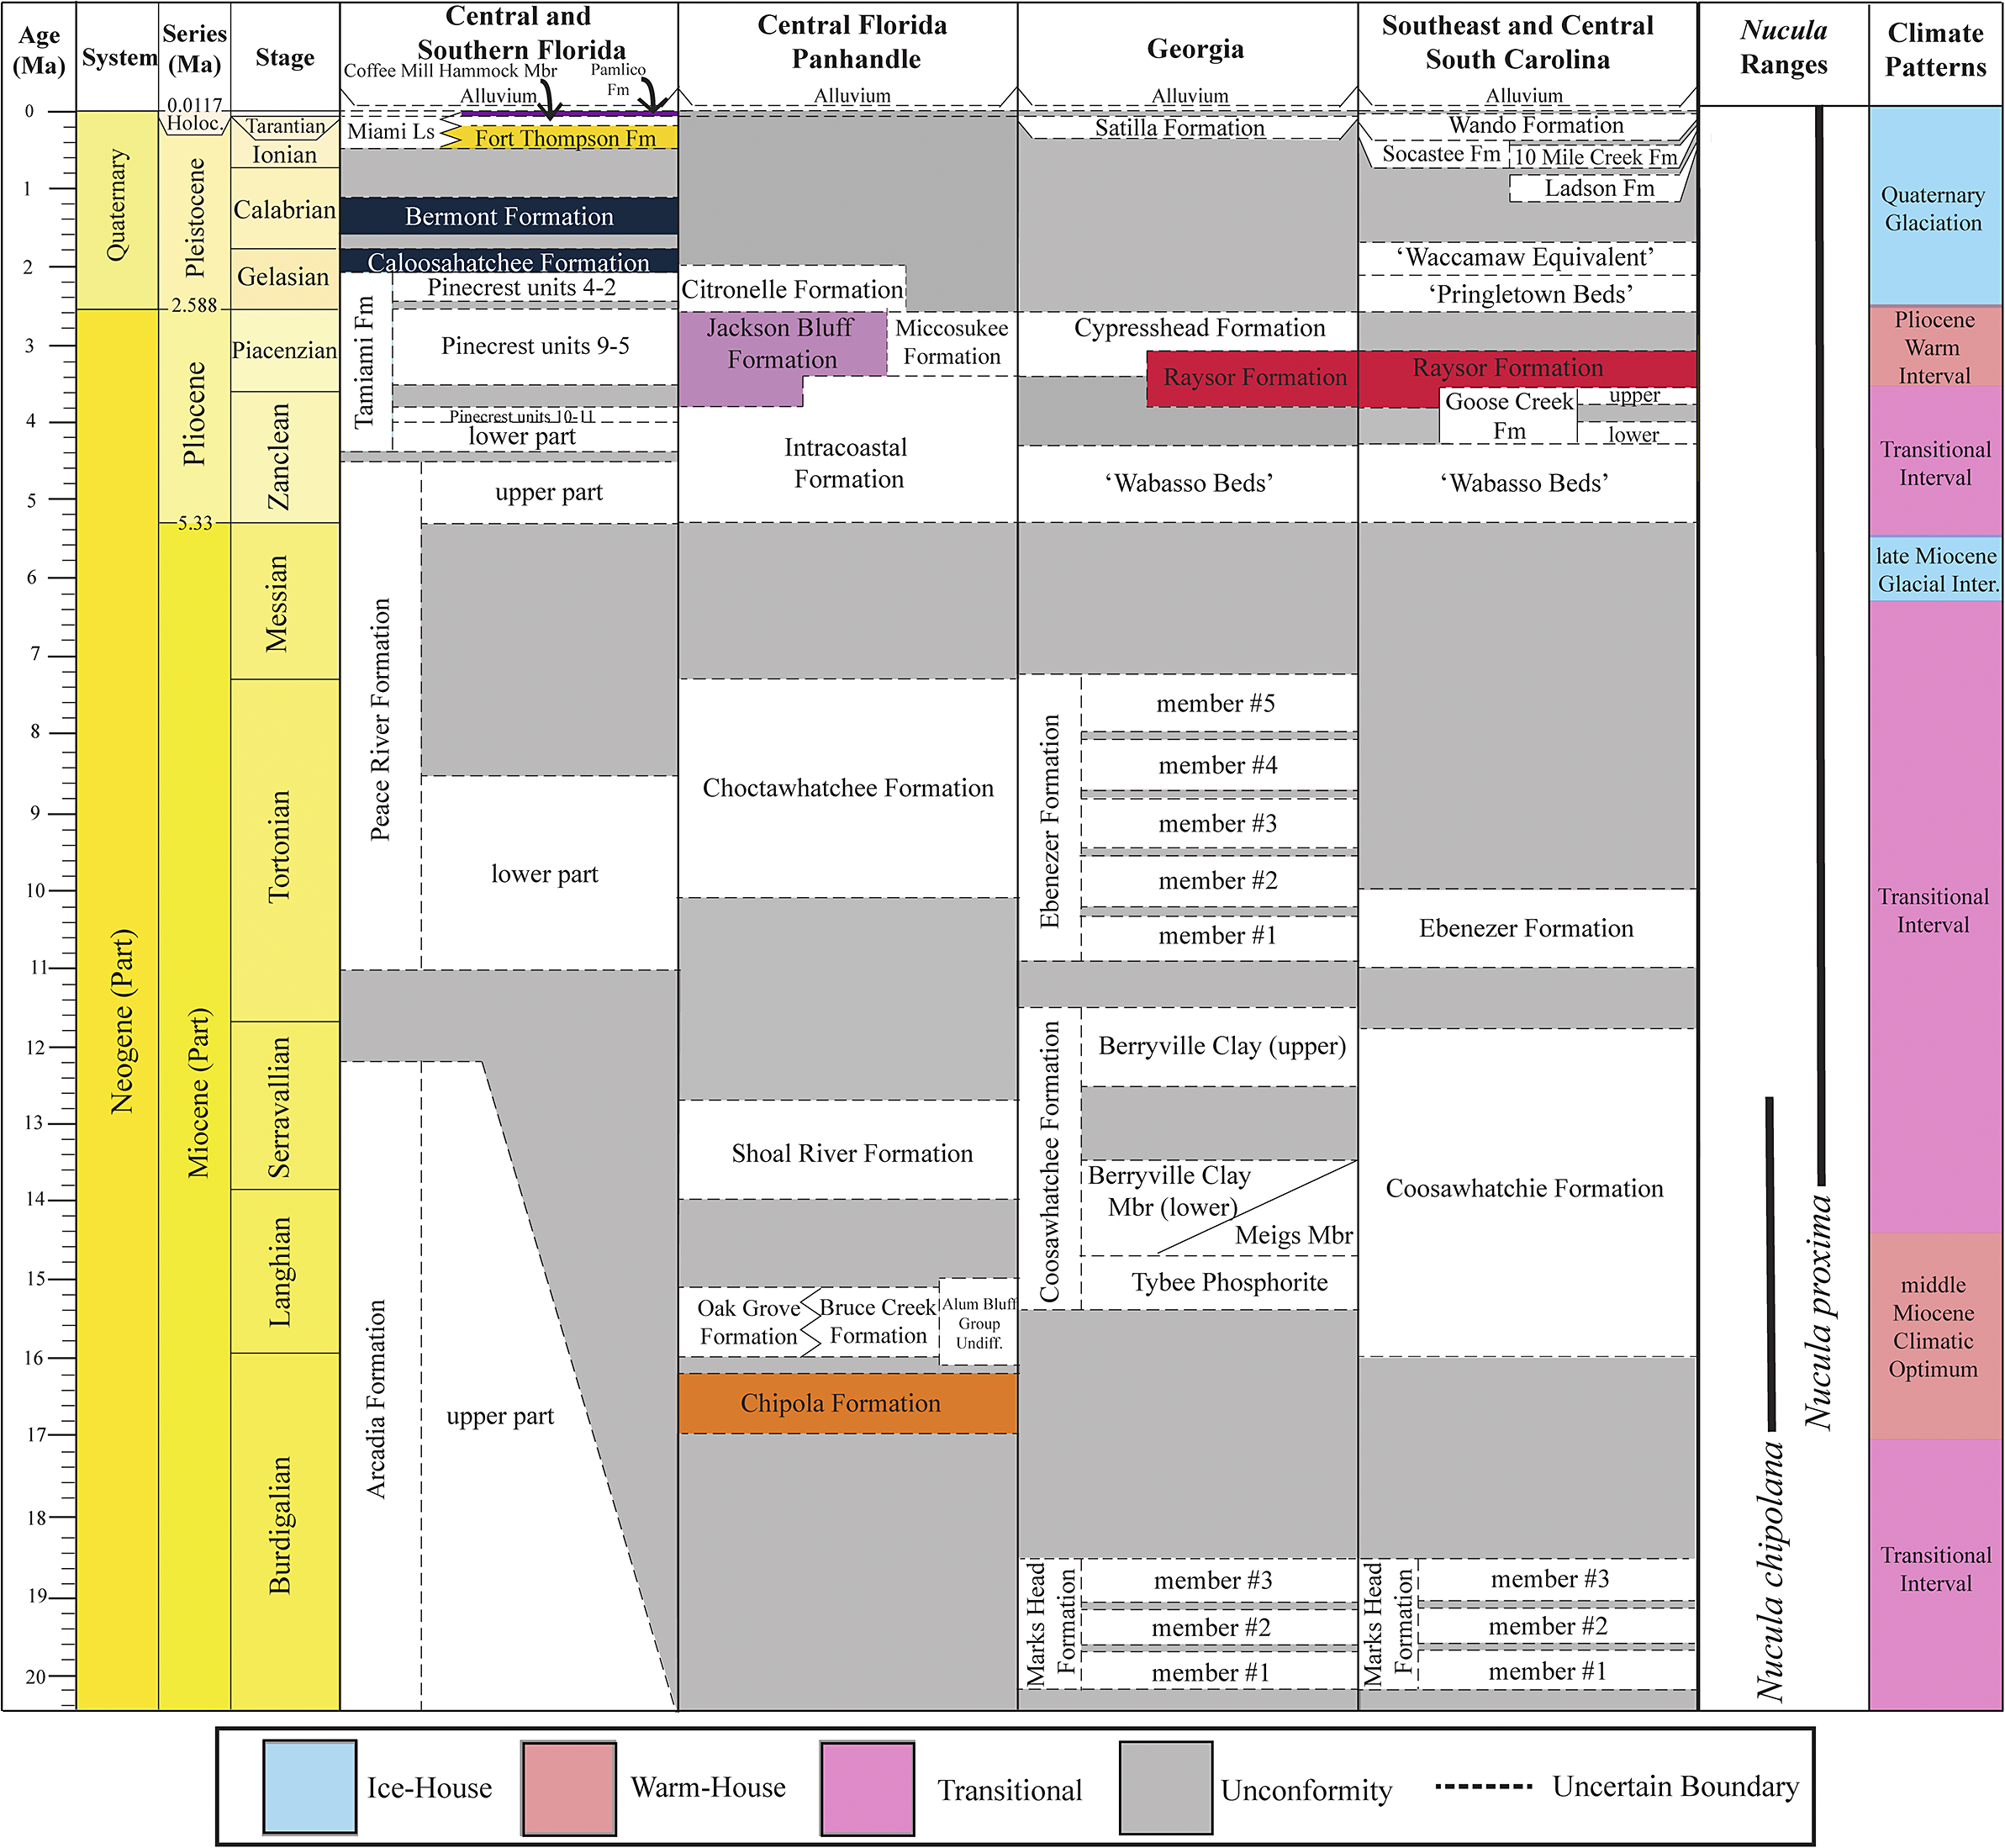
To test the Plus ça change model’s prediction that elevated environmental variability limits net evolutionary change, this study also examines the evolution of Nucula through the Neogene–Quaternary (Fig. 2). The Neogene transitional regime was dominated by two 6.0 to 8.0 Myr long, moderately cool intervals that were interrupted by shorter (~0.4 to 2.7 Myr) cooler as well as warmer intervals (Fig. 2). Neogene temperatures and sea levels were higher than those in the Quaternary, but were declining due to a decrease in pCO2 levels (Zachos et al. Reference Zachos, Pagani, Sloan, Thomas and Billups2001; Miller et al. Reference Miller, Kominz, Browning, Wright, Mountain, Katz, Sugarman, Cramer, Christie-Blick and Pekar2005; De Vleeschouwer et al. Reference De Vleeschouwer, Vahlenkamp, Crucifix and Pälike2017). Temperature and sea-level fluctuations were still moderate during the Neogene and were, for the most part, influenced by the 41 kyr obliquity band of Milankovitch variations (Zachos et al. Reference Zachos, Pagani, Sloan, Thomas and Billups2001; Miller et al. Reference Miller, Kominz, Browning, Wright, Mountain, Katz, Sugarman, Cramer, Christie-Blick and Pekar2005).
Stratigraphic interval of Neogene–Quaternary Nucula samples from the U.S. Atlantic and Gulf Coastal Plains used in study (see Fig. 3 for geographic distribution), total ranges of Nucula species, and broadscale climate patterns (modified from Huddlestun Reference Huddlestun1984; Weems and Edwards Reference Weems and Edwards2001; Zachos et al. Reference Zachos, Pagani, Sloan, Thomas and Billups2001; Weems and Lewis Reference Weems and Lewis2002; Weems et al. Reference Weems, Self-Trail and Edwards2004; Edwards et al. Reference Edwards, Barron, Bukry, Bybell, Cronin, Poag, Weems and Wingard2005; Weems and George Reference Weems and George2013; Saupe et al. Reference Saupe, Hendricks, Portell, Dowsett, Haywood, Hunter and Lieberman2014; Powars et al. Reference Powars, Edwards, Kidwell, Schindler, Brezinski, Halka and Ortt2015; Hastings and Dooley Reference Hastings and Dooley2017; Slattery et al. Reference Slattery, Brown, Harries, Sandness and Portell2024).
Temperature decline and sea-level oscillations accelerated in the Quaternary in association with the initiation of permanent Northern Hemisphere glaciation, which resulted in the greater expression of Milankovitch-scale variations that modulated the glacial–interglacial cycles characteristic of this interval (Zachos et al. Reference Zachos, Pagani, Sloan, Thomas and Billups2001; Miller et al. Reference Miller, Kominz, Browning, Wright, Mountain, Katz, Sugarman, Cramer, Christie-Blick and Pekar2005). By the middle Pleistocene (~950 ka), there was a significant shift in the amplitude and frequency of the glacial–interglacial cycles from the lower-amplitude 41 kyr (obliquity) variations to the higher-amplitude 100 kyr (eccentricity) changes (Zachos et al. Reference Zachos, Pagani, Sloan, Thomas and Billups2001). The middle Pleistocene climate shift resulted in a change from more temporally symmetrical glacial–interglacial cycles to more asymmetrical cycles with very long, cold glacial periods punctuated by short, warmer interglacials (Mudelsee and Schulz Reference Mudelsee and Schulz1997; Zachos et al. Reference Zachos, Pagani, Sloan, Thomas and Billups2001; Tziperman and Gildor Reference Tziperman and Gildor2003). Overall, the Pleistocene is characterized by an increase in variance in the climatic spectrum (Frakes et al. Reference Frakes, Francis and Syktus1992).
Geological Setting
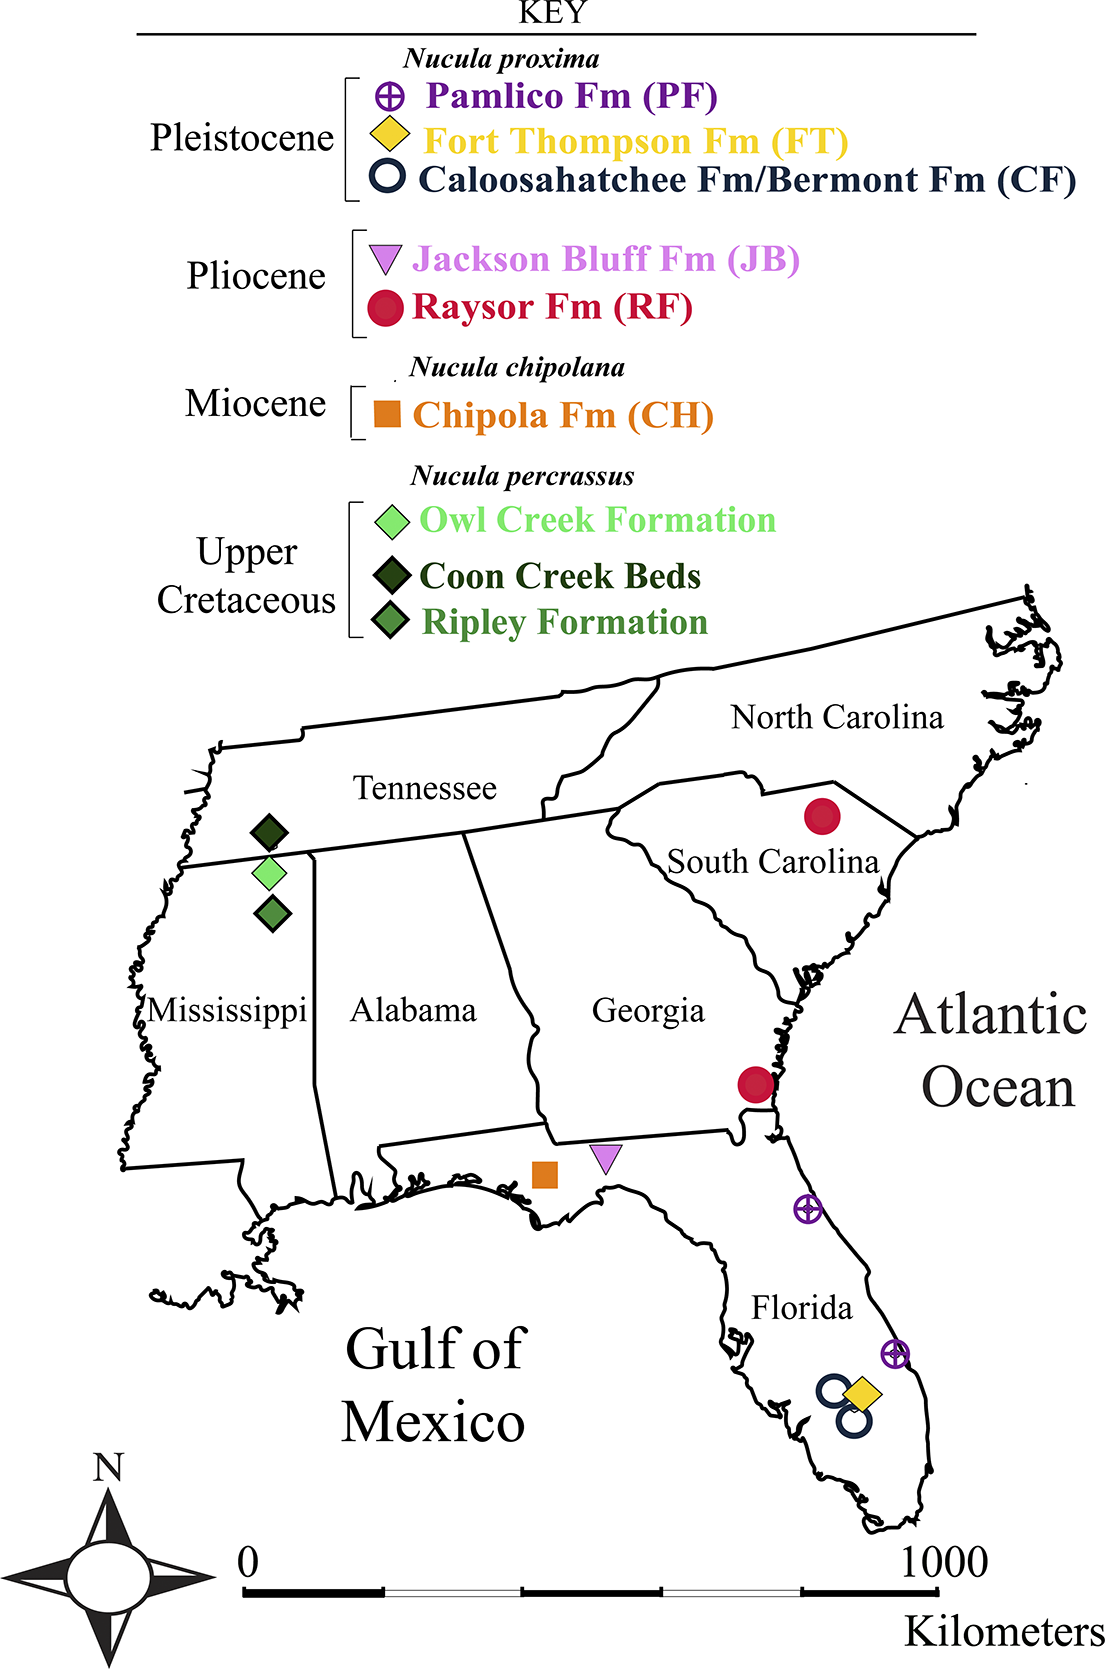
Cretaceous and Neogene–Quaternary Nucula specimens were collected from the passive-margin settings of the U.S. Atlantic and Gulf Coastal Plains (Fig. 3). Cretaceous localities sampled in this study are characterized as sandy clay-rich units with well-preserved aragonitic shells, which were deposited in shallow, lower shoreface to proximal offshore-transitional shelf settings. Neogene–Quaternary formations sampled in this study were deposited during highstands and are separated by substantially longer intervals that are recorded in lowstand unconformities. Neogene–Quaternary localities are represented by sandy, shell-rich units with well-preserved aragonitic shells deposited in shallow, upper shoreface to proximal offshore-transitional shelf settings (Allmon Reference Allmon1992, Reference Allmon1993; Slattery et al. Reference Slattery, Brown, Harries, Sandness and Portell2024; Gomes et al. Reference Gomes, Petersen, Portell and Riemersma2025).
Cretaceous and Neogene–Quaternary Nucula localities in the U.S. Atlantic and Gulf Coastal Plains sampled for this study.

Systematic and Evolutionary Overview among Nucula Analyzed in Study
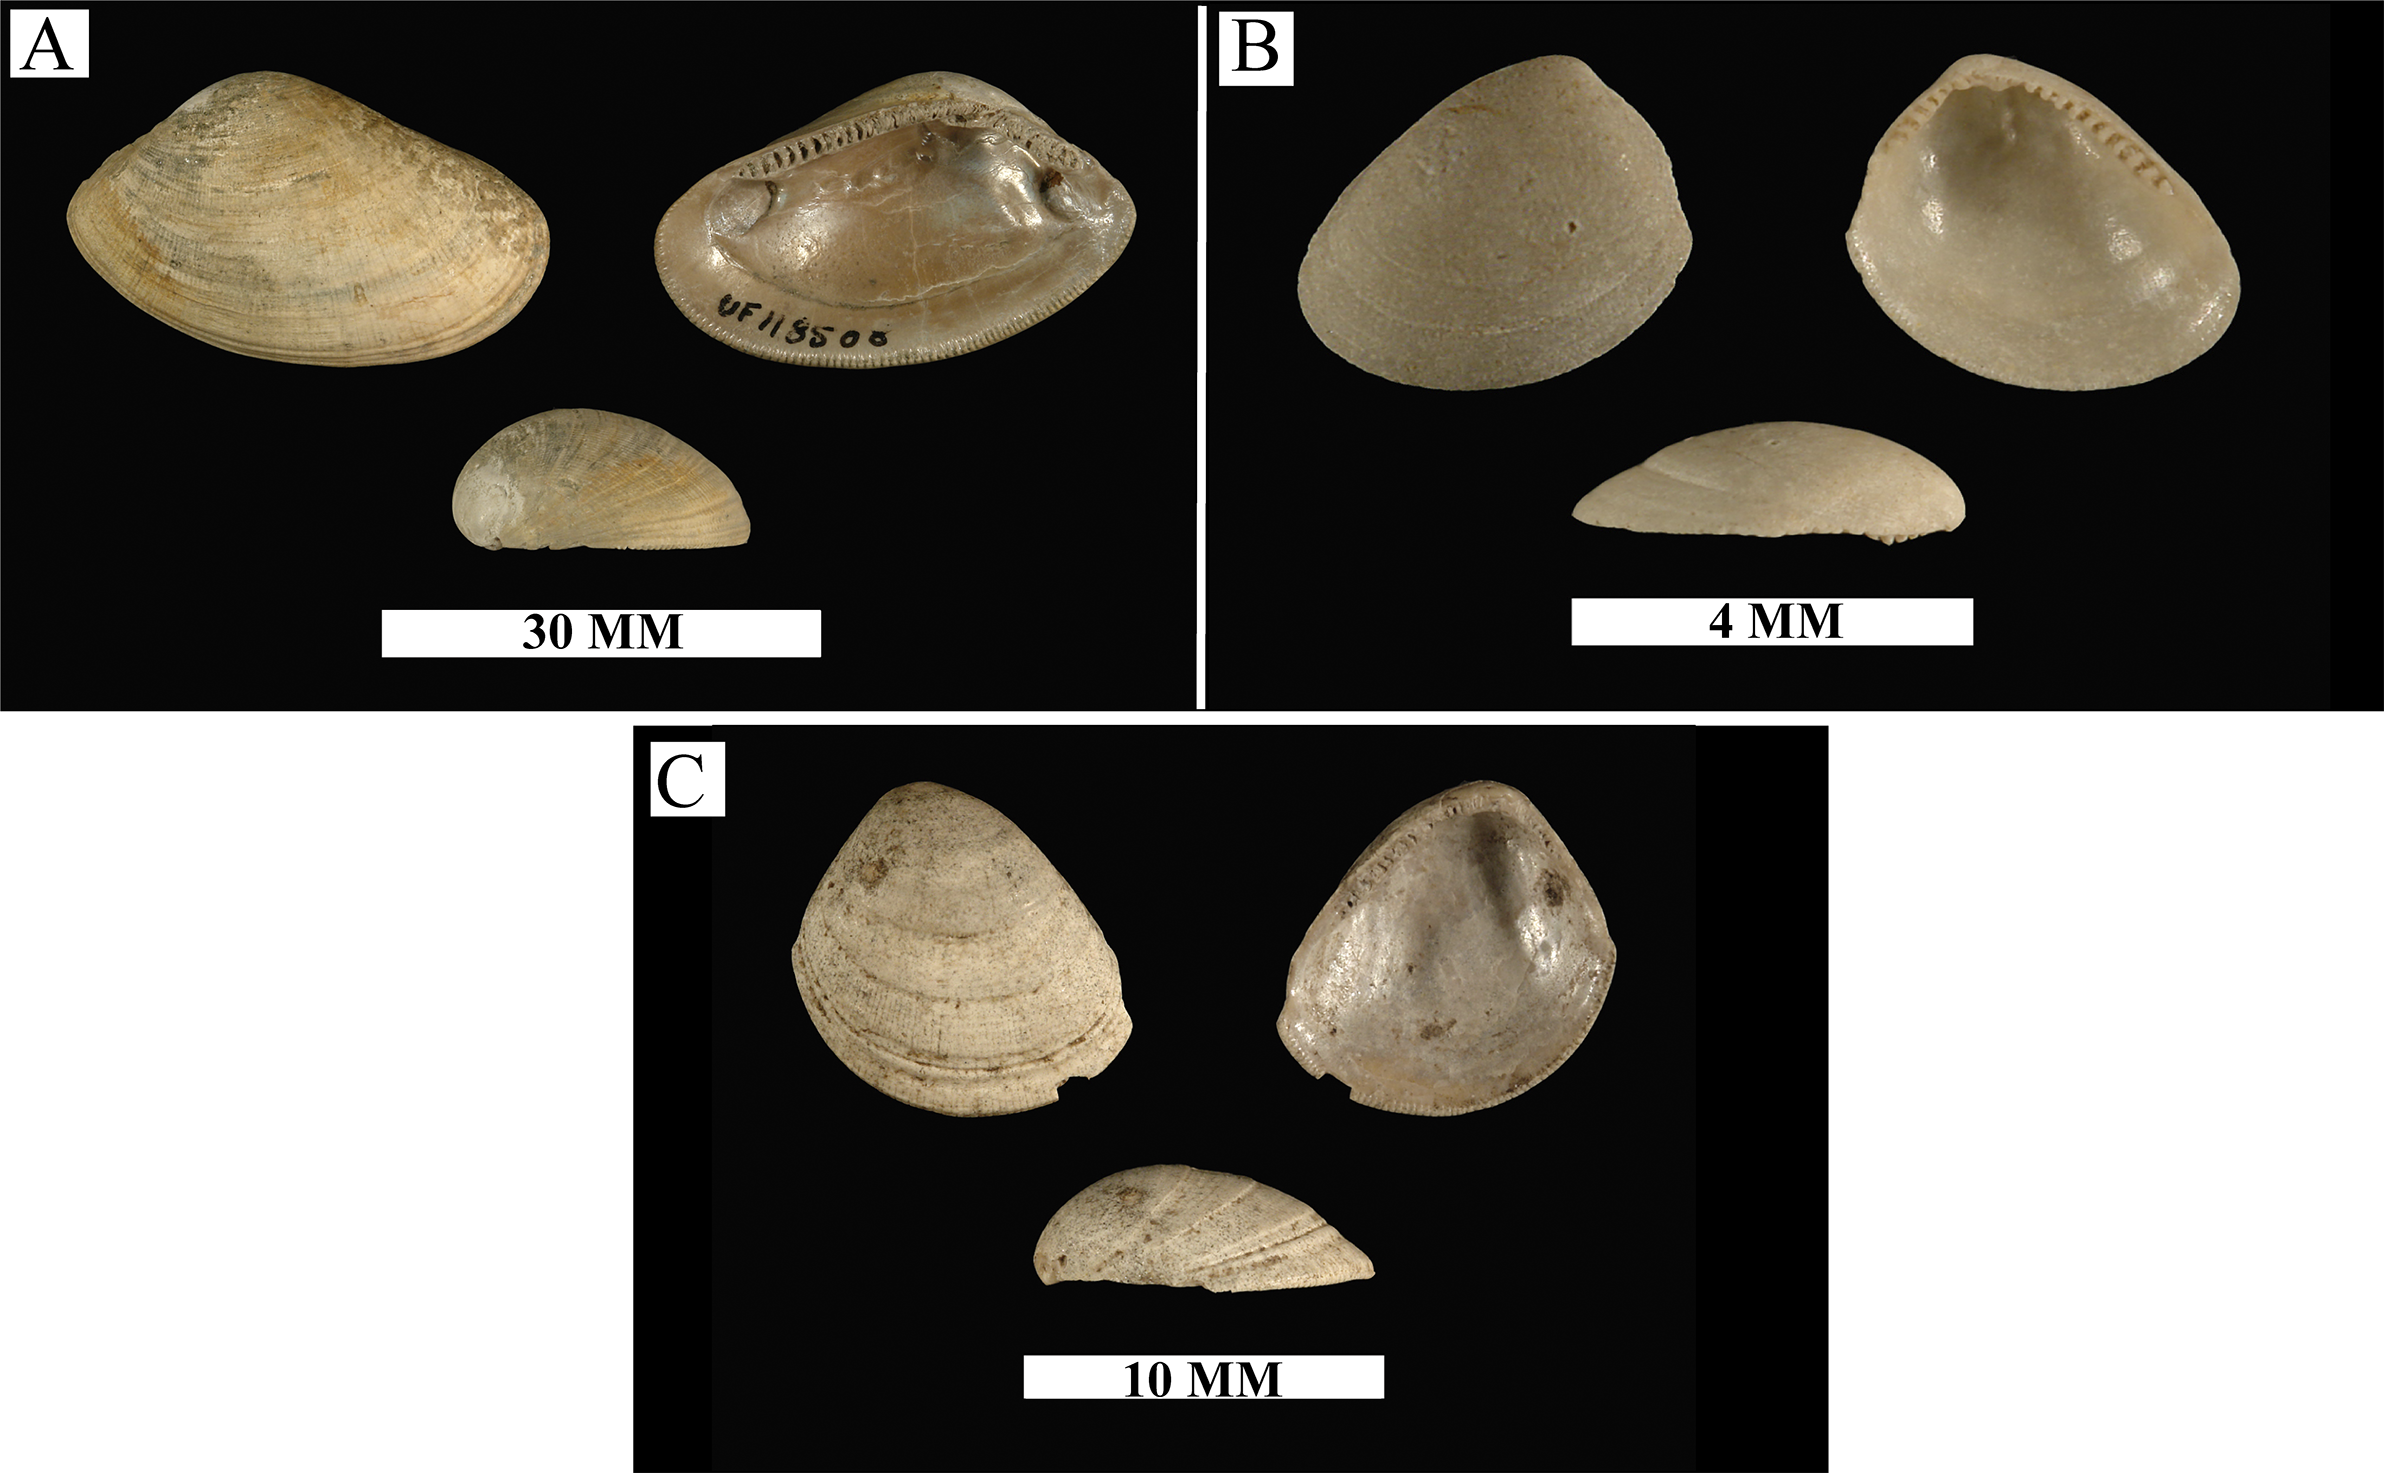
This study examined one Cretaceous and two Neogene–Quaternary species of Nucula (Figs. 1–4). These species were selected because of their excellent aragonitic preservation, abundance, and long stratigraphic ranges. The Cretaceous portion of this study is focused on N. percrassa Conrad, Reference Conrad1858 (Fig. 4A), which ranges from the lower Campanian up to the Cretaceous/Paleogene (K/Pg) boundary (Speden Reference Speden1970; Wingard and Sohl Reference Wingard and Sohl1990; Fig. 1). The Neogene–Quaternary component of this analysis includes two taxa: N. chipolana Dall, Reference Dall1898 and N. proxima Say, Reference Say1822 (Fig. 4B,C). The former ranges from the Burdigalian to Serravallian (Dall Reference Dall1898; Gardner Reference Gardner1926; Portell et al. Reference Portell, Polites and Schmelz2006; Fig. 2), whereas the latter ranges from the Serravallian to Holocene (Richard and Harbison Reference Richards and Harbison1942; Gardner and Mansfield Reference Gardner and Mansfield1943; Edwards et al. Reference Edwards, Barron, Bukry, Bybell, Cronin, Poag, Weems and Wingard2005; Portell et al. Reference Portell, Polites and Schmelz2006; Mikkelsen and Bieler Reference Mikkelsen and Bieler2007; Fig. 2).
Examples of Nucula species examined in this study, including: (A) Cretaceous N. percrassa Conrad, Reference Conrad1858 (UF118500); (B) Miocene N. chipolana Dall, Reference Dall1898 (UF133012); and (C) Pliocene to Holocene N. proxima Say, Reference Say1822 (UF267837). Photos courtesy of R. Portell, Florida Museum of Natural History, University of Florida.

The evolutionary relationships among the Nucula species analyzed in this study are poorly known. A major contributing factor to this lack of understanding is the absence of comprehensive phylogenetic analysis of both fossil and living species within this group. The challenge is further compounded by the numerous homoplasies observed within the clade and, due to their simple shell morphology, the limited availability of morphological characters suitable for robust phylogenetic reconstructions. Despite having a relatively similar biogeographic range, the Cretaceous species are separated in time from the Neogene–Quaternary species by ~40 Myr. Therefore, it is unclear whether the latter are descendants of the former or whether the latter represent an unrelated, smaller-sized lineage.
The two Neogene–Quaternary species are likely from one lineage and are possibly the same species based on their pronounced morphological similarity, including shape outline, inflation, hinge line, and relative shell thicknesses (see Fig. 4B,C). The most distinguishing contrast between the two species is their size, with N. chipolana and N. proxima typically having mean lengths of 3–4 mm and 10 mm, respectively. They also overlap in their biogeographic range, and the last appearance of the former species overlaps with the first appearance of the latter species in the lower Serravallian (see Fig. 2). This stratigraphic range overlap possibly represents a speciation event or possibly misidentification of one of the taxa at this stratigraphic level.
Methods
Sample Localities
Cretaceous Nucula specimens used in this study were collected from three localities in the Gulf Coastal Plain (Figs. 1, 3): the Upper Campanian Coon Creek Tongue of the Ripley Formation at Coon Creek, Tennessee, the lower Maastrichtian Ripley Formation at Blue Springs, Mississippi, and the upper Maastrichtian Owl Creek Formation at Owl Creek, Mississippi. The ages of these localities are constrained by ammonite and inoceramid biostratigraphy; however, due to their condensed biostratigraphic records and the extended age ranges of Gulf Coastal Plain ammonite biozones, many of these localities span relatively long intervals of time (i.e., >1–2 Myr; also see Slattery et al., Reference Slattery, Minor, Harries, Johnson, Sandness, Slattery, Larson, Sandness, Bingle-Davis, Bingle-Davis and Grahamin press). The Coon Creek locality is the oldest site and correlates with the Nostoceras hyatti Biozone (73.5–72.6 Ma). The Blue Springs locality correlates with the Hoploscaphites criptonodosus Biozone (71.7–70.5 Ma). The Owl Creek locality is the youngest Cretaceous site and correlates with the Discoscaphites minardi and D. iris Biozones (66.8–66.0 Ma). Therefore, the samples studied here range across ~7.5 Myr from the late Campanian to the late Maastrichtian.
Neogene–Quaternary Nucula specimens analyzed in this study come from six formations and seven localities (Figs. 2, 3). The age ranges of these formations are derived from micro- and macrofossil biostratigraphy, isotopic dating, and relative stratigraphic relationships (Huddlestun Reference Huddlestun1984; Weems and Edwards Reference Weems and Edwards2001; Zachos et al. Reference Zachos, Pagani, Sloan, Thomas and Billups2001; Weems and Lewis Reference Weems and Lewis2002; Weems et al. Reference Weems, Self-Trail and Edwards2004; Edwards et al. Reference Edwards, Barron, Bukry, Bybell, Cronin, Poag, Weems and Wingard2005; Weems and George Reference Weems and George2013; Saupe et al. Reference Saupe, Hendricks, Portell, Dowsett, Haywood, Hunter and Lieberman2014; Powars et al. Reference Powars, Edwards, Kidwell, Schindler, Brezinski, Halka and Ortt2015; Hastings and Dooley Reference Hastings and Dooley2017; Slattery et al. Reference Slattery, Brown, Harries, Sandness and Portell2024). These formations span ~17 Myr; however, this record is clearly discontinuous, as these formations are all bounded by hiatuses or unconformities, which span from tens of millions to hundreds of thousands of years. Nucula chipolana specimens were collected from the middle Miocene Chipola Formation (17–16.3 Ma) at a single locality in Florida. These samples are separated by a ~12.5 Myr gap in the Nucula record ranging from the middle Miocene Chipola Formation to the Pliocene Raysor and Jackson Bluff formations (16.3–3.6 Ma; see also Fig. 2). This gap in the Nucula record reflects a lack of available material due to numerous and relatively long unconformities that span >1 Myr as well as relatively poor preservation of fossil mollusks in the existing deposits (i.e., steinkern preservation). The Pliocene to Pleistocene N. proxima record ranges from 3.6 to 0.04 Ma and is more complete due to both the better representation of specimens from different intervals in museum collections and the shorter time intervals represented by unconformities as well as better preservation. Pliocene specimens come from individual localities in Florida, Georgia, and South Carolina, whereas the Quaternary specimens are all derived from six sites in Florida.
Samples
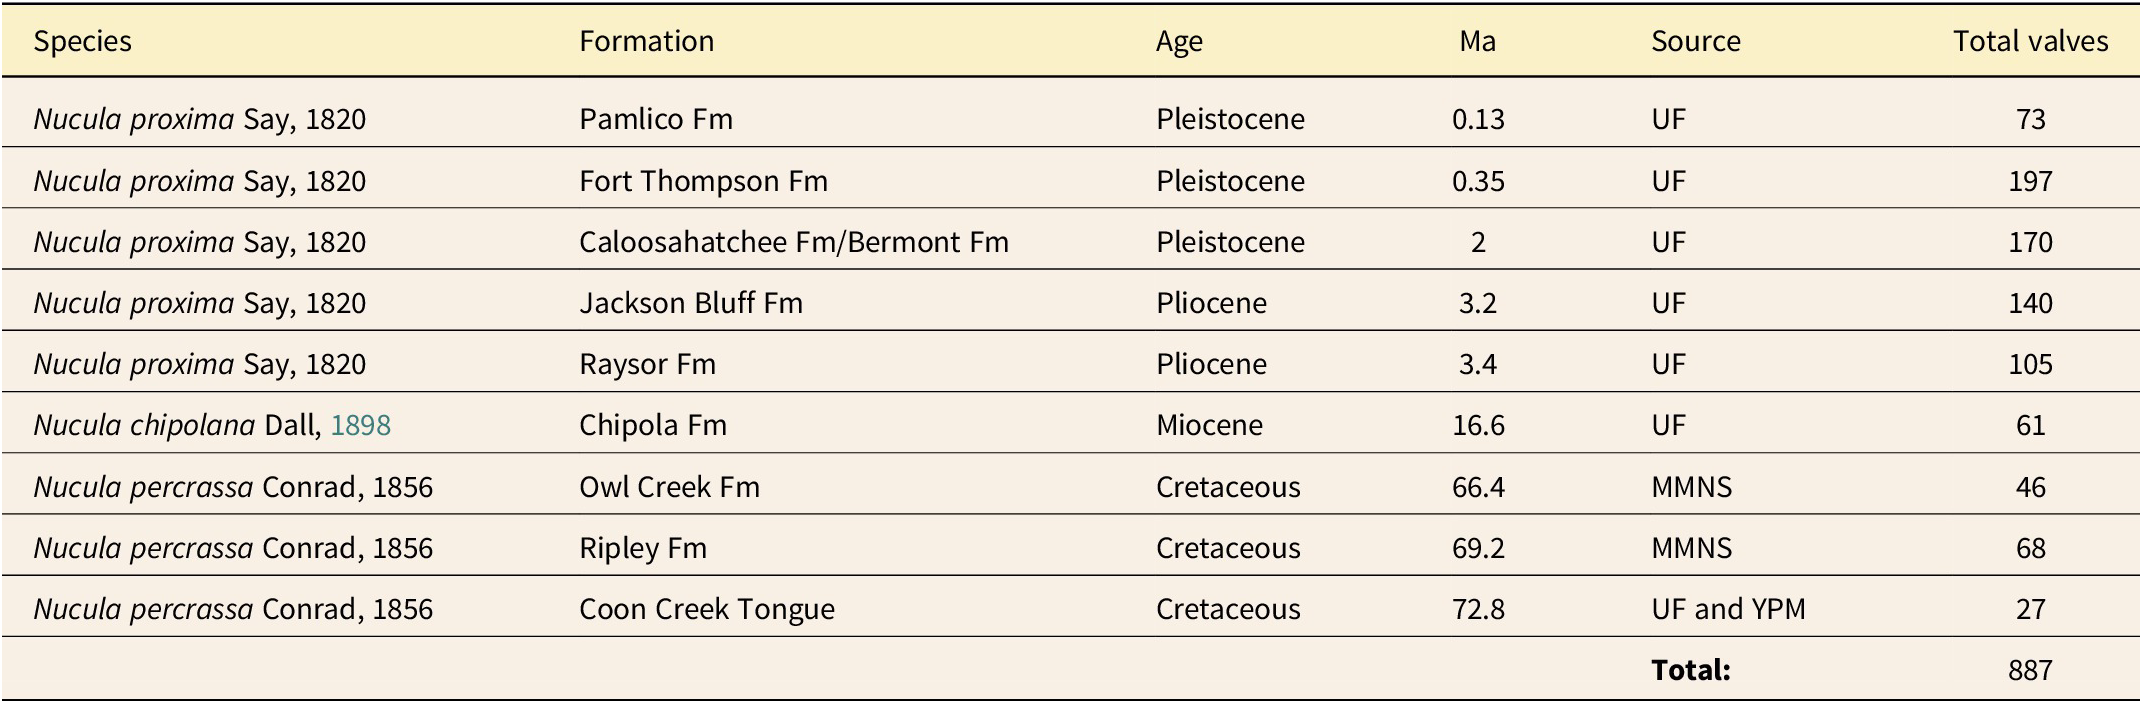
A total of 887 pooled right and left valves of Cretaceous and Neogene–Quaternary Nucula specimens were analyzed for this study (Table 1; Supplementary Table 1). Out of these, 141 are Cretaceous N. percrassa valves and 746 are Neogene–Quaternary Nucula valves (Table 1). These specimens are reposited in the collections at the Mississippi Museum of Natural Science (MMNS), Florida Museum of Natural History, University of Florida (UF), and Yale Peabody Museum of Natural History (YPM). All associated data for these specimens are available through the Dryad Digital Repository (https://doi.org/10.5061/dryad.sqv9s4ndb).
Number of Nucula specimens used in study along with their ages and repositories. MMNS, Mississippi Museum of Natural Science; UF, Florida Museum of Natural History, University of Florida; YPM, Yale Peabody Museum of Natural History.
Morphometric and Quantitative Analysis
We document the evolutionary patterns among Nucula lineages during contrasting climatic regimes using two elements: size measurements and outline shapes. The morphometric techniques used in this study were chosen to accurately capture the true biological patterns of size and shape change, minimizing distortion or bias that could arise from measurement or analytical methods.
Photography and Image Editing
To obtain measurements and outline shapes, Nucula were photographed against a clean, low-reflectivity, black surface using an Olympus Stylus Tough camera set to macro and mounted onto an adjustable copy stand under four-point lighting. Each Nucula specimen was photographed concave down with the umbo oriented toward the bottom of the image. These methods provide high-quality images that reduce potential motion blur. The adjustable copy stand allows the standardization of the working distance between the specimens and the lens, which, if varied between photographs, could impact the scale of the image for collection of size data.
Images sampled for shape data were uploaded into the GNU Image Manipulation Program (GIMP) (Solomon Reference Solomon2009). In GIMP, images were converted to grayscale, and their contrast or threshold was adjusted to produce a black-and-white silhouette, which facilitated the extraction of shape data. Images were then cleaned to remove small specks (e.g., loose sediment) surrounding the valves, which could result in the capture of inaccurate shape outlines.
Outline Shape and Size Data Extraction and Analysis
The National Institutes of Health shareware program FIJI (a modified version of ImageJ; Schindelin et al. Reference Schindelin, Arganda-Carreras, Frise, Kaynig, Longair, Pietzsch and Preibisch2012) was used to collect outline-shape data. Edited images were imported into FIJI, where the shells were selected using the Wand Tracing Tool to replicate the outline. Once the shell outline was demarcated, the xy-coordinates (>10,000 coordinates per specimen) were extracted.
To extract size data, centroid sizes were calculated by summing the squared distances between all landmarks on Nucula specimens and the centroid (Webster and Sheets Reference Webster and Sheets2010). A 10 mm scale included with Nucula images was used as a reference to calculate centroid sizes in metric units (Bookstein Reference Bookstein1989, Reference Bookstein1997; Rohlf and Bookstein Reference Rohlf and Bookstein2003; Frieß Reference Frieß2003; Jonke et al. Reference Jonke, Schaefer, Freudenthaler, Prossinger and Bookstein2003; Hammer and Harper Reference Hammer and Harper2006; Webster and Sheets Reference Webster and Sheets2010).
Preparation of Outline Data and Elliptical Fourier Analysis of Outlines
Elliptical Fourier analysis (EFA) was used to quantitatively describe Nucula’s morphological form. This mathematical method was specifically developed by Kuhl and Giardina (Reference Kuhl and Giardina1982) to quantitatively describe closed outline shapes.
Before Fourier analysis, the outline data from the right and left valves were pooled, smoothed, and aligned on their centroids to increase sample sizes and eliminate artifacts caused by variations in raw xy-coordinate position, size, translation, rotation, and starting position, which could influence the outcome of EFA. To pool the outline data, Nucula right-valve semi-landmarks were mirrored on the y-axis. The xy-coordinates defining the outline shapes of the bivalves were smoothed through 100 iterations to remove digitization noise and then interpolated to 400 evenly spaced points using methods discussed by Claude (Reference Claude2008). The outlines were scaled to the same centroid size (i.e., all centroid sizes = 1) and rotated using an unpublished, point-independent method of outline rotation developed by Jarrett (Reference Jarrett2016) with an R script (R Development Core Team 2015). Smoothed and interpolated outlines were compared with the original configurations to ensure that the outline was not significantly affected by these processes. The rotation methods used in this study involve determining the angle of the first Fourier ellipse relative to the horizontal plane by utilizing its two extreme points (Supplementary Fig. 1A). The angle required to align this line horizontally is then calculated, and the shape is rotated by this angle. Jarrett’s (Reference Jarrett2016) approach results in a more accurate outline rotation as compared with the commonly used Procrustes methods (Supplementary Fig. 1B,C). Finally, a standardized starting position for the outline trace was calculated using the function setstart, which places the starting position of the outlines at a point that is the most morphologically similar among all outlines. This is important, because EFA is sensitive to the starting position and could, without correction, reflect variation in starting position rather than shape (Haines and Crampton Reference Haines and Crampton2000). EFA was used to calculate Fourier coefficients from the corrected xy-coordinates using methods provided by Claude (Reference Claude2008). This decomposition method was employed to reduce the dimensionality and remove redundant information from the cleaned xy-coordinates. To decompose the data, EFA uses harmonically related trigonometric curves (i.e., progressively higher sine and cosine functions), that are summed to replicate open or closed outlines (Davis Reference Davis1986). This approach was selected because it effectively recreates specimens or characters with relatively simple shapes (e.g., roughly ovate outlines shapes), such as the outlines of bivalves and brachiopods (Crampton Reference Crampton1995; Haines and Crampton Reference Haines and Crampton2000). Computational details of EFA are described in more detail in Kuhl and Giardina (Reference Kuhl and Giardina1982), Ferson et al. (Reference Ferson, Rohlf and Koehn1985), and Crampton (Reference Crampton1995). EFA methods have been criticized because returned harmonics are not independent of each other. Notably, Haines and Crampton (Reference Haines and Crampton2000) posit that this non-independence may result in “spurious correlations.” However, the methods applied here were tested by Jarrett (Reference Jarrett2016) on extant Chione elevata (Say Reference Say1822). Results show correct separation and grouping based on ecophenotype as well as separability of subtle morphological differences between right and left valves.
Evolutionary Analysis
To examine changes in size over time, centroid size data were visualized by time interval using: (1) box-and-whisker plots and (2) ridgeline plots. As size measurements varied across several orders of magnitude, size data were log transformed so that they could be plotted on a proportional scale to make them more comparable, as recommended by Hunt and Carrano (Reference Hunt and Carrano2010).
To examine changes in shape over time, Fourier coefficients of Nucula were analyzed in R using principal component analysis (PCA). PCA—a statistical technique that has typically been used to examine the variance among specimens (e.g., Mitteroecker and Bookstein Reference Mitteroecker and Bookstein2011; Zelditch et al. Reference Zelditch, Swiderski and Sheets2012)—is an eigenvalue-eigenvector analytical method that sorts variation in multivariate datasets along two or more independent (uncorrelated) axes, which are ranked in order of decreasing importance (Zelditch et al. Reference Zelditch, Swiderski and Sheets2012). Here, we examine only the first three axes of the PCA plots, referred to as PC 1, PC 2, and PC 3. These axes explain 68.3%, 12.6%, and 5.9% of the morphological variation, respectively. Cumulatively, these axes reflect 86.5% of the total morphological variation. Additional PCA axes were not examined for this study because they explain progressively smaller amounts of the variation, thus yielding diminishing explanatory power. The mean PCA scores were plotted along each axis with 95% confidence ellipsoids for comparison.
The time-series analysis R package paleoTS (Hunt Reference Hunt2015) was used to examine the magnitudes of morphological changes over time among Nucula. This was done by applying sample covariance and likelihood-based methods to both size data as well as PC 1 and PC 2 results. To measure the magnitude of morphological change over time between samples, among sample variation (omega) was computed using the fitSimple function available in paleoTS by fitting the stasis model to both Cretaceous and Neogene–Quaternary samples, respectively, without pooling the data. Specific evolutionary patterns (e.g., unbiased random walk, generalized random walk) for size and shape data were not evaluated using Akaike support in the R package paleoTS due to the limited number of time bins; in the Cretaceous and Neogene–Quaternary there were three and six, respectively. This is based on Hunt’s (Reference Hunt2012, Reference Hunt2015) analysis, which showed that a minimum of seven time bins are necessary to undertake a robust determination of evolutionary patterns using Akaike support.
The geomorph package in R was used to calculate morphological disparity (Procrustes variance). These data were bootstrapped by culling 25 specimens at random from each sample and computing the disparity 100 times each, which allowed for the calculation of standard error for disparity.
Allometry
To ensure that morphological patterns reflect changes in shape over time rather than changes in shape with ontogeny, Nucula PCA axes 1 to 3 scores were compared with centroid sizes (Bookstein Reference Bookstein1989, Reference Bookstein1997; Rohlf and Bookstein, Reference Rohlf and Bookstein2003; Freissias 2003; Jonke et al. Reference Jonke, Schaefer, Freudenthaler, Prossinger and Bookstein2003; Hammer and Harper 2008). If the shape variation, as primarily explained in PCA axes 1 to 3 scores, correlates with centroid size (i.e., allometric growth), then the primary element being compared in the analysis is size dependent and thus reflects ontogenetic variation within populations rather than variation in shape over geological time and must be corrected. However, if the shape variation reflected by PCA scores does not correlate with centroid size, then the primary shape element being compared in the analysis is size independent and thus reflects variation in shape over geological time.
Results
Size Change
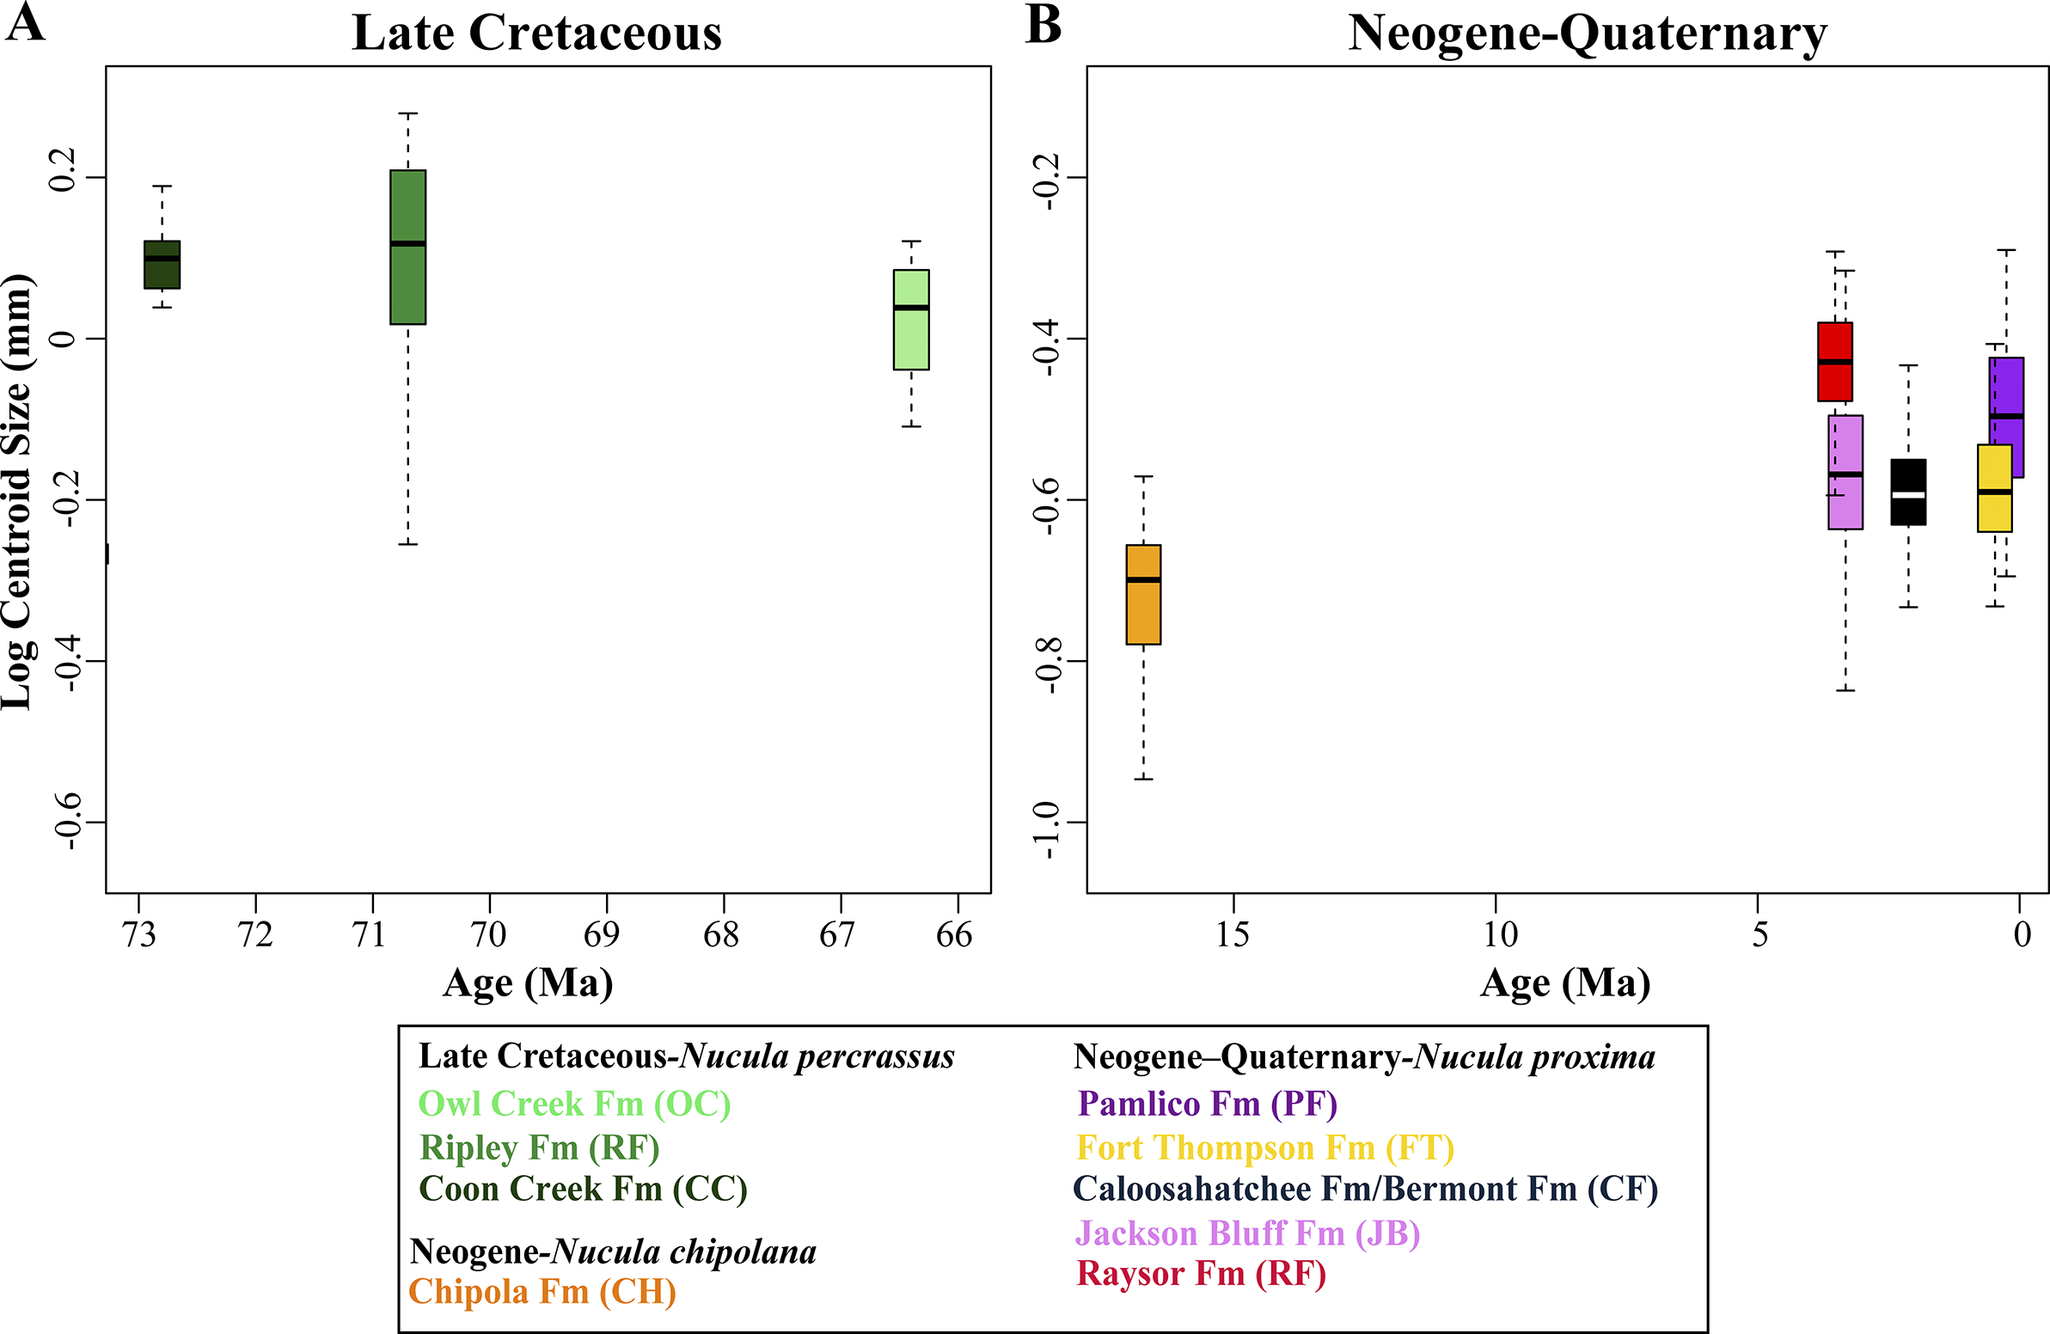
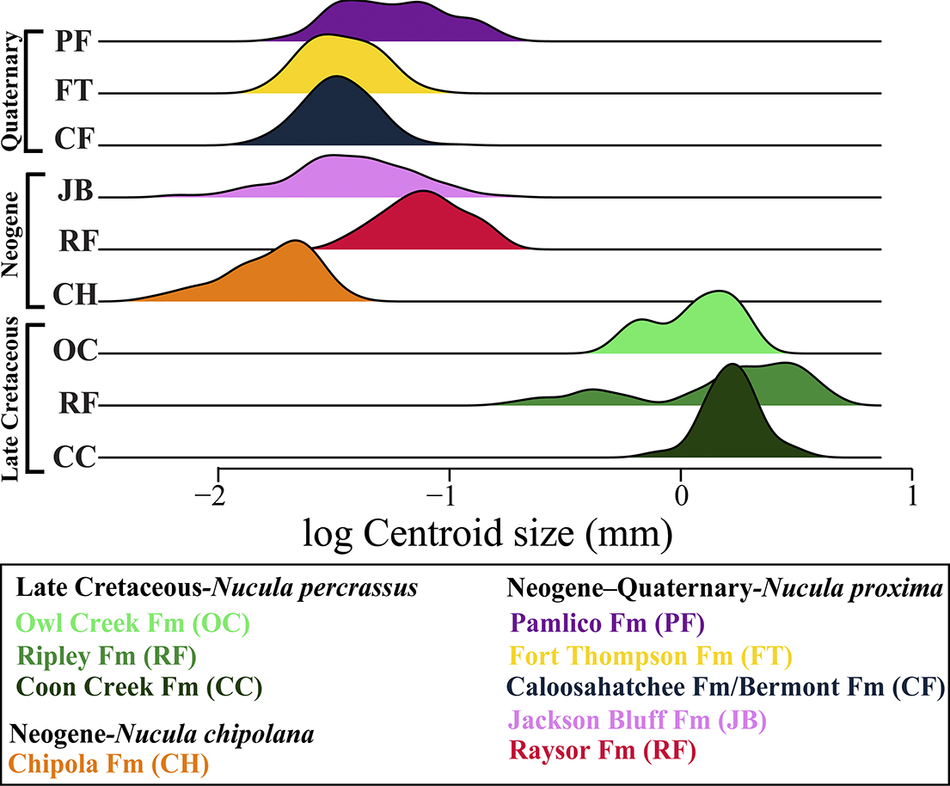
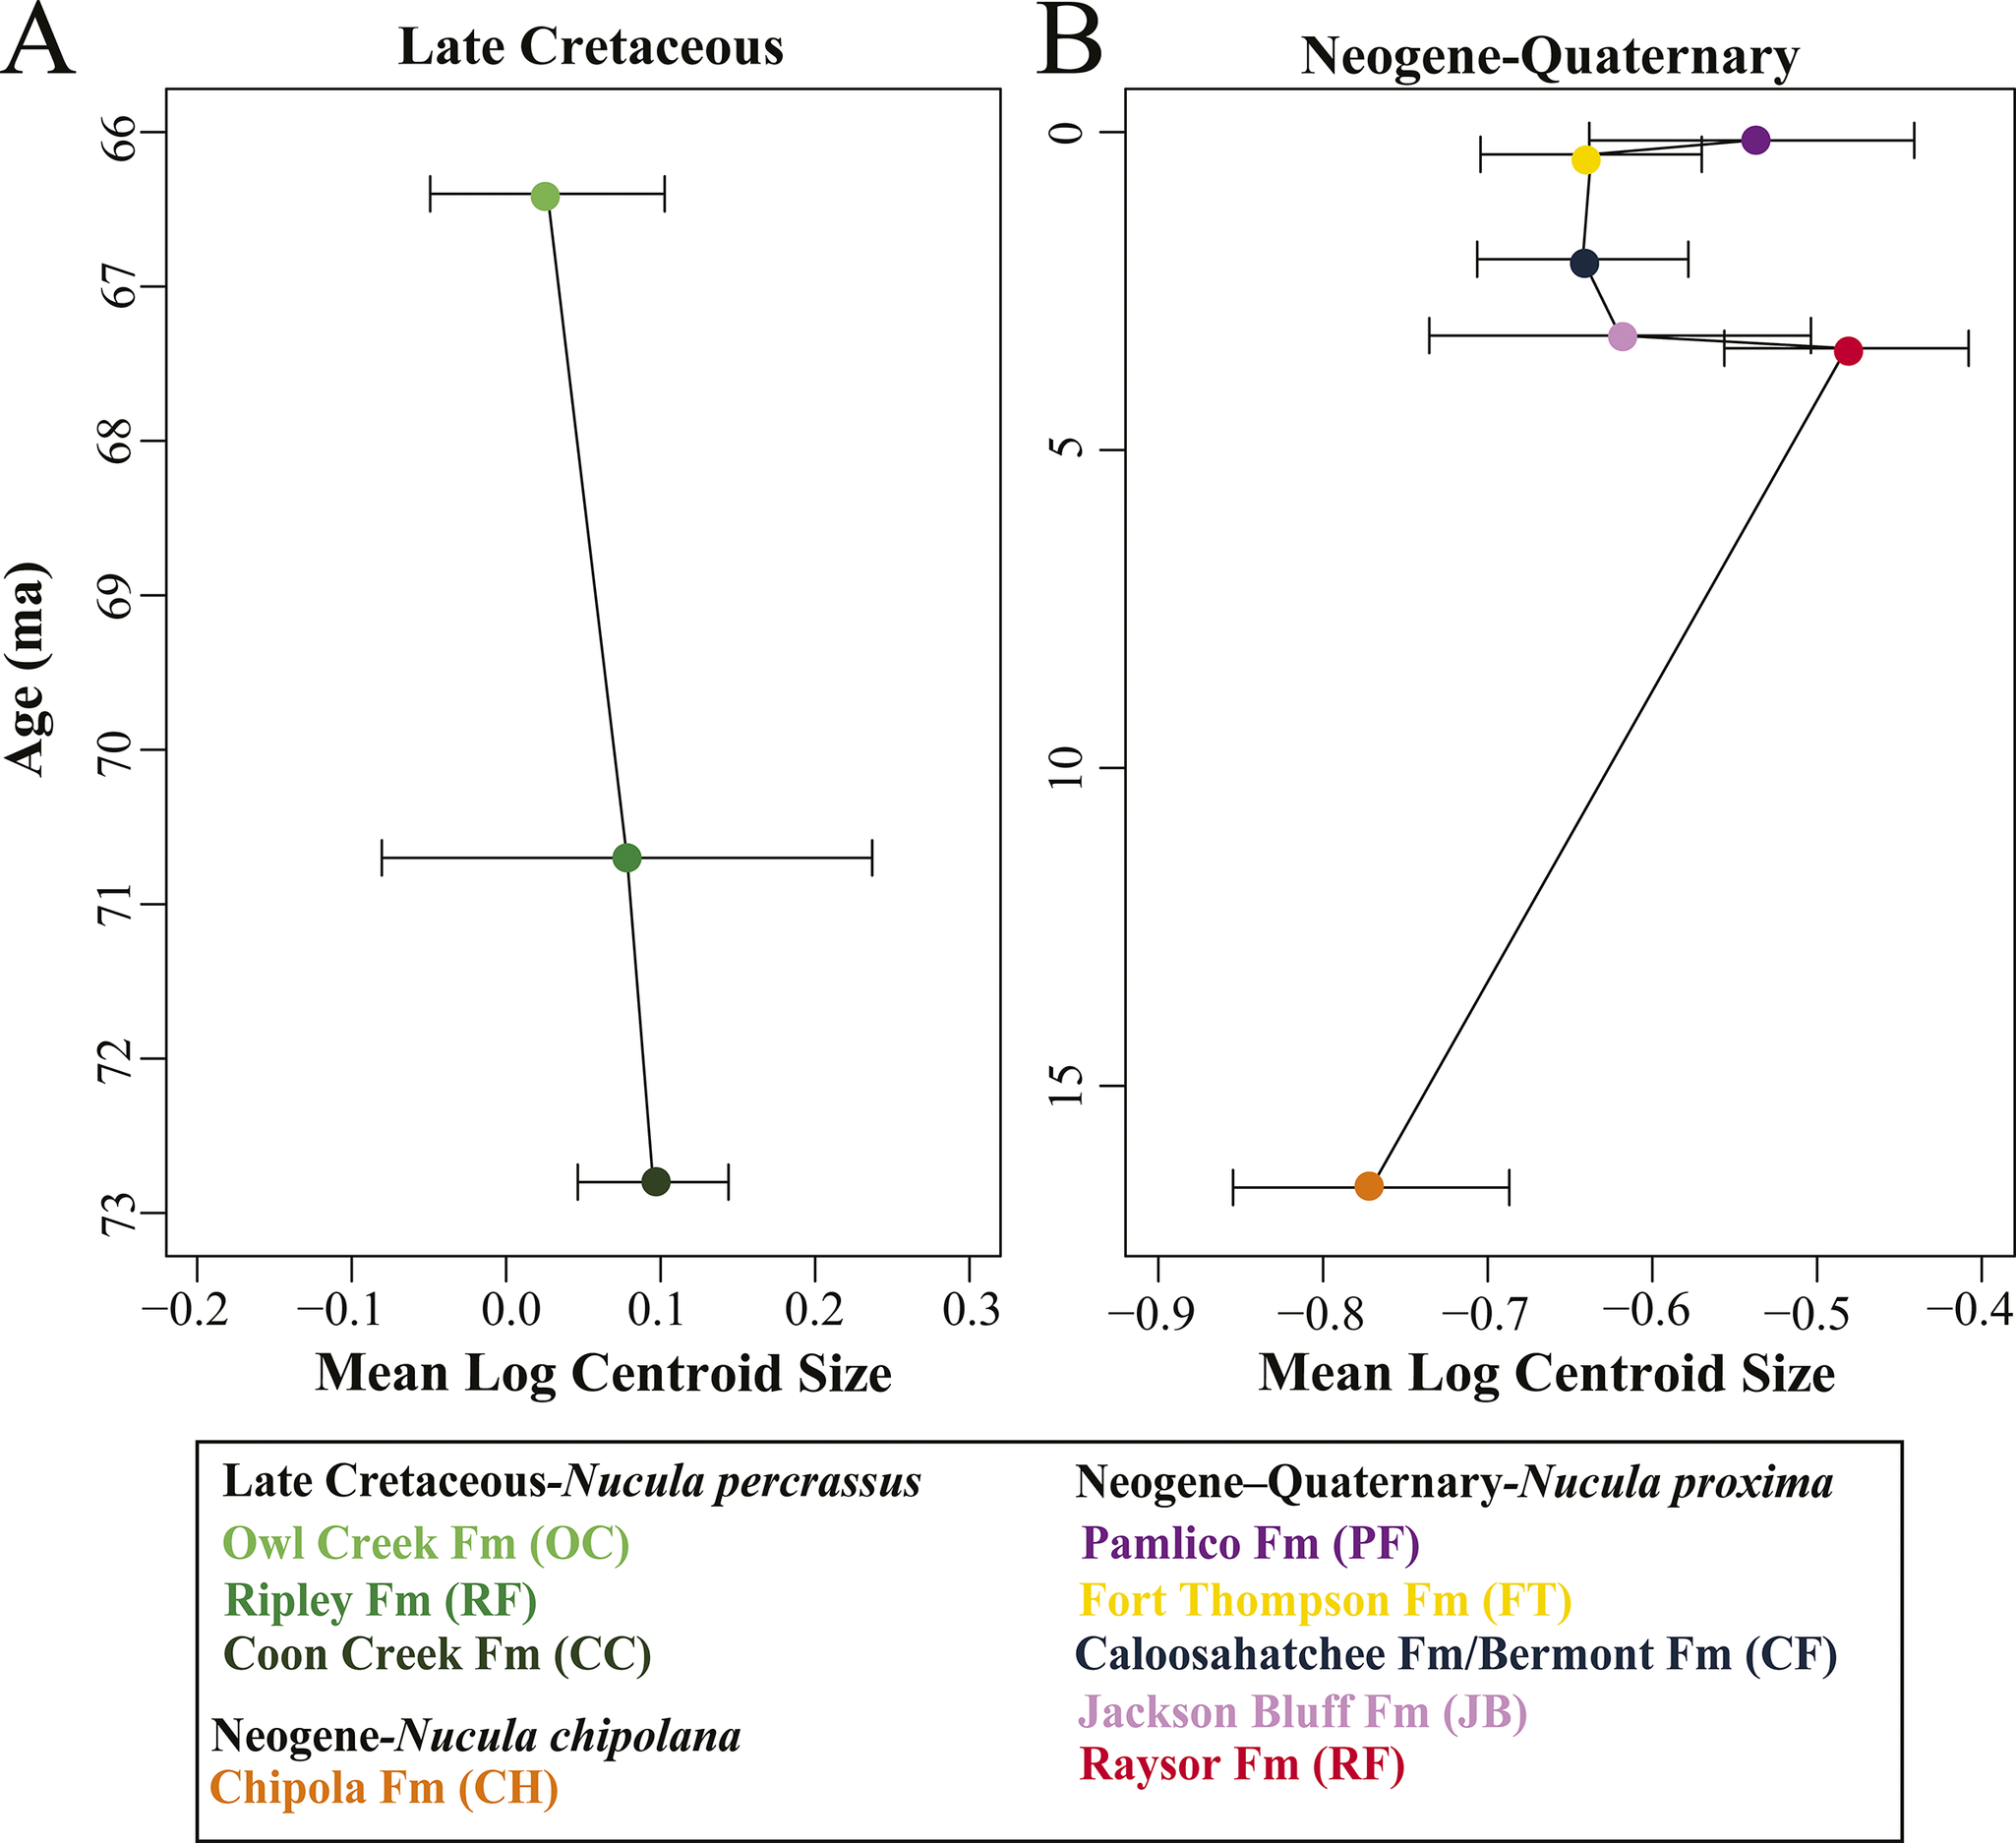
Cretaceous Nucula decrease in mean log centroid size over the 7.5 Myr interval in the late Campanian (log centroid size = 0.22) to late Maastrichtian (log centroid size = 0.09) (Figs. 5A, 6, 7A, Supplementary Table 2). The mean log centroid size of Late Campanian Nucula are 18% and 72% larger than early and late Maastrichtian age specimens, respectively. However, the median sizes of late Campanian and early Maastrichtian age specimens are similar. The difference in mean sizes is primarily due to the presence of small specimens in the early Maastrichtian age Ripley Formation. In addition, the early Maastrichtian Ripley Formation and, to a lesser degree, the late Maastrichtian age Owl Creek Formation Nucula show bimodal distributions in size, which is not apparent for the late Campanian Coon Creek Nucula.
Box plots showing log centroid sizes of Late Cretaceous (A) and Neogene–Quaternary (B) Nucula.
Ridgeline plot showing changes in log centroid sizes for Nucula during the Late Cretaceous and Neogene–Quaternary.

Time series showing changes in mean log centroid size of Late Cretaceous (A) and Neogene–Quaternary (B) Nucula.

Cenozoic Nucula show changes in mean log centroid size during the Neogene and then little change from the late Pliocene through latest Pleistocene (Figs. 5B, 6, 7B, Supplementary Table 2). Nucula increase 37% in size from the middle Miocene to middle Pliocene and then decrease by 29% in mean log centroid size from the middle to late Pliocene. Their mean log centroid size remains identical (i.e., ~−1.46 mm) from the late Pliocene to middle Pleistocene and then increases by 15% into the latest Pleistocene. The middle Pliocene Raysor Formation and latest Pleistocene Pamlico Formation Nucula have the largest mean centroid sizes and are the only samples from the Atlantic Coastal Plain.
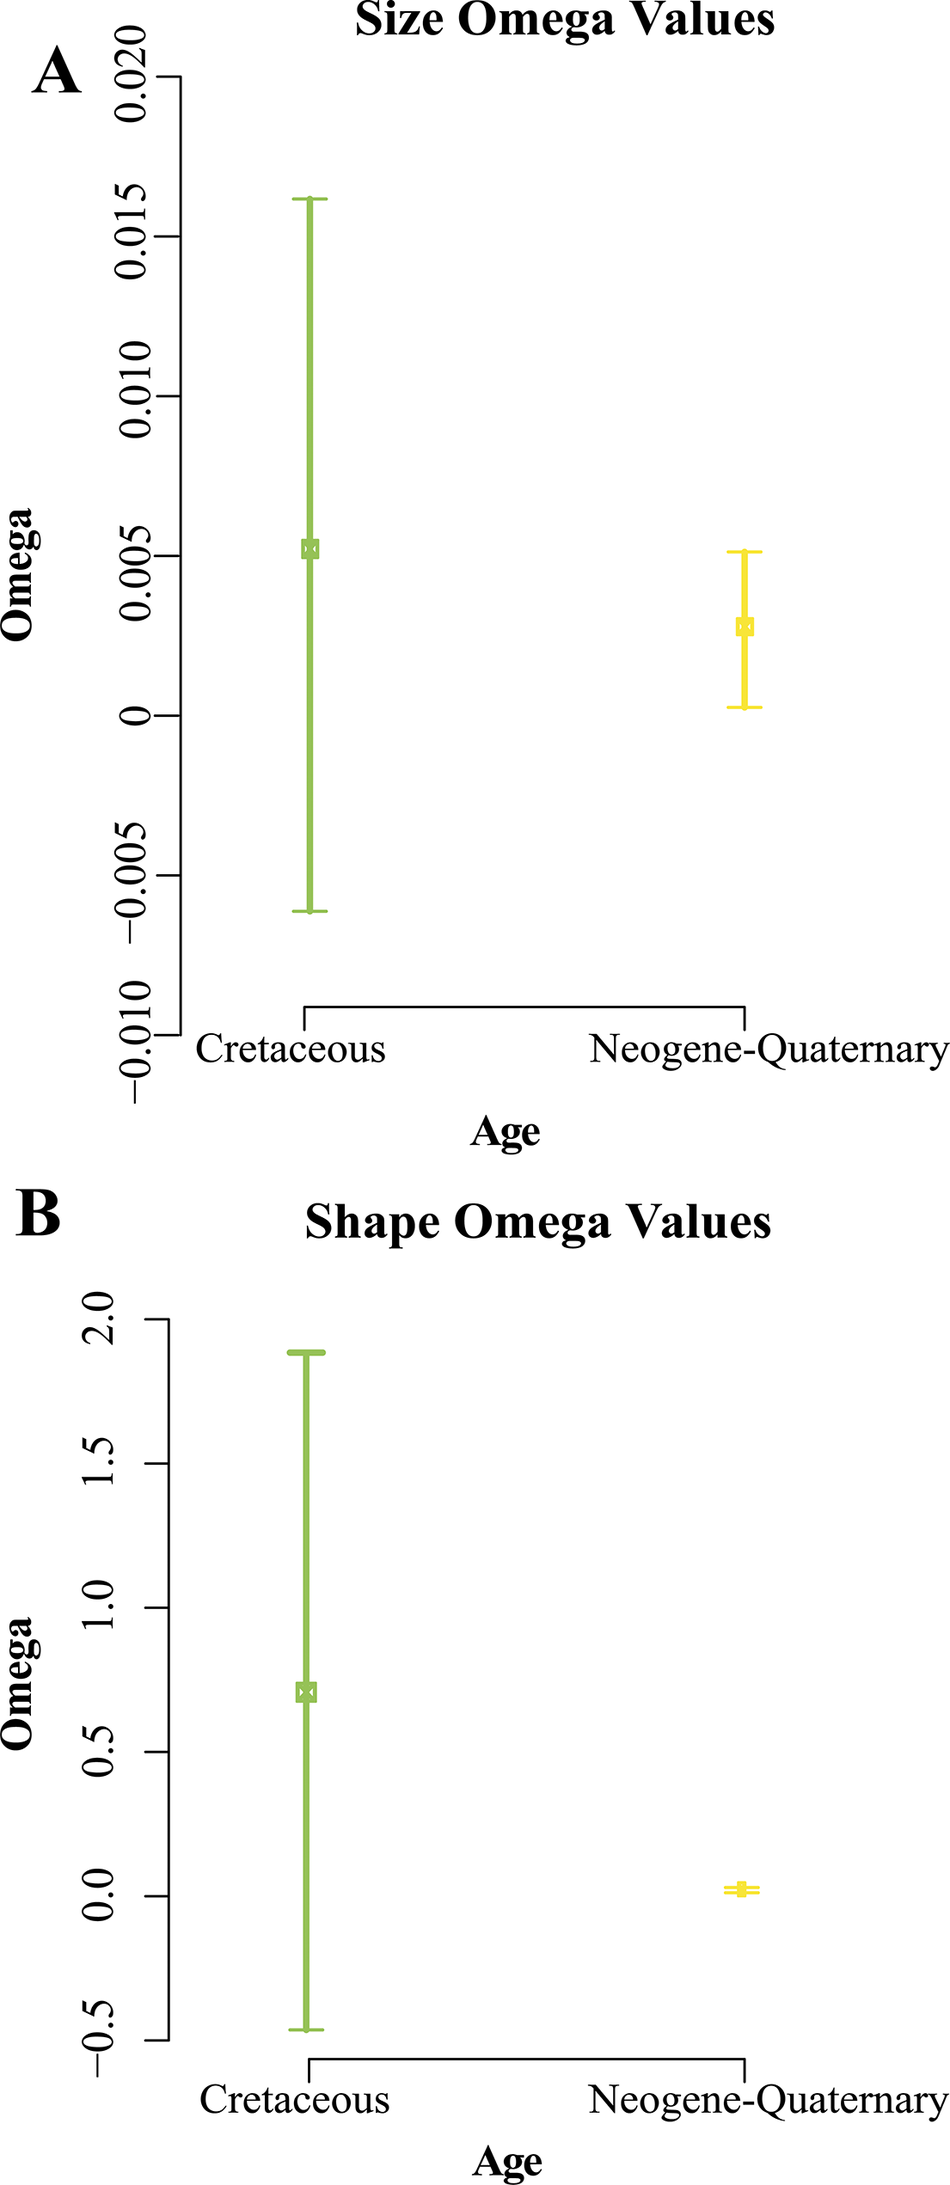
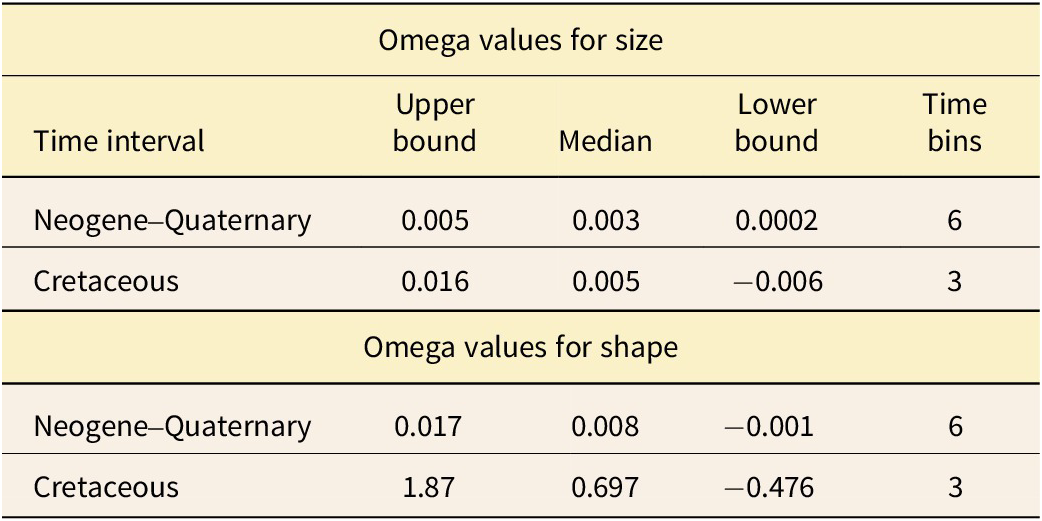
The omega values based on mean log centroid size are greater for the Cretaceous Nucula percrassa compared with the Neogene–Quaternary Nucula chipolana–proxima lineage (Fig. 8A, Table 2). The omega value for the Cretaceous Nucula is 0.005, whereas the Neogene–Quaternary specimens have a value of 0.003. Thus, the omega value for size data in the Cretaceous Nucula is approximately 1.9 times greater than in the Neogene–Quaternary specimens. The broader confidence limits for Cretaceous Nucula compared with Neogene–Quaternary forms are likely due to the smaller sample sizes for the older nuculids (Fig. 8A, Table 2).
Comparison of omega values for changes in the magnitude of size (A) and shape (B) for Late Cretaceous and Neogene–Quaternary Nucula.

Omega values for determining the magnitude of size and shape changes for Cretaceous and Neogene–Quaternary Nucula.

Shape Changes
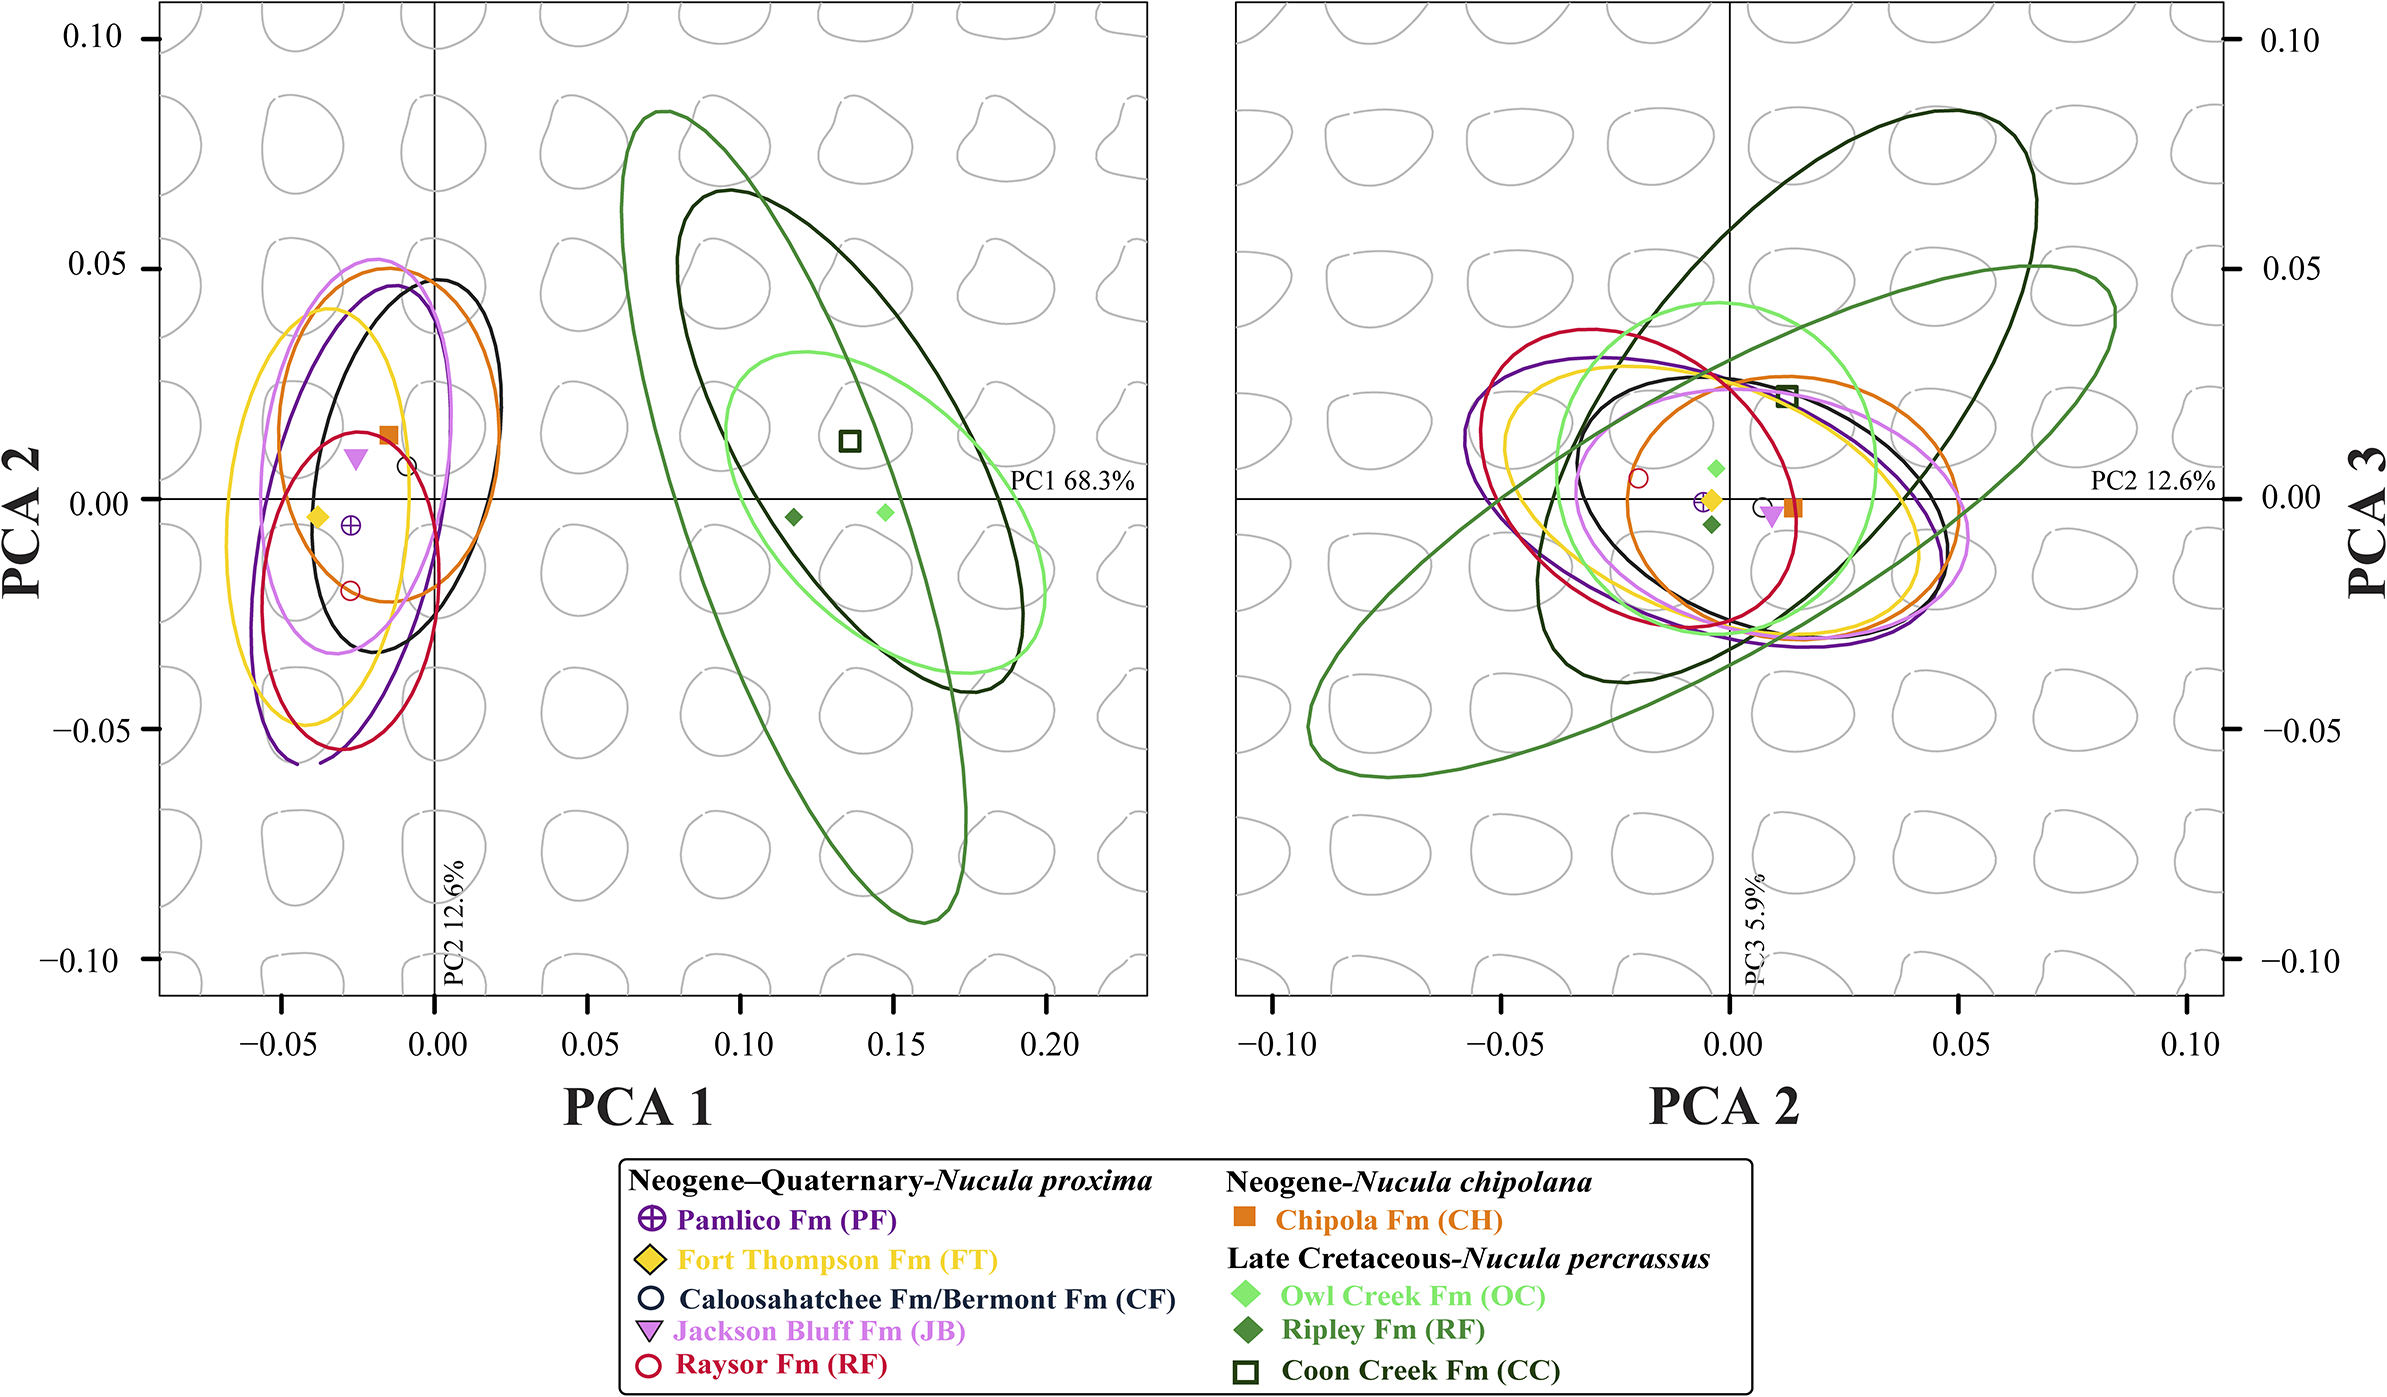
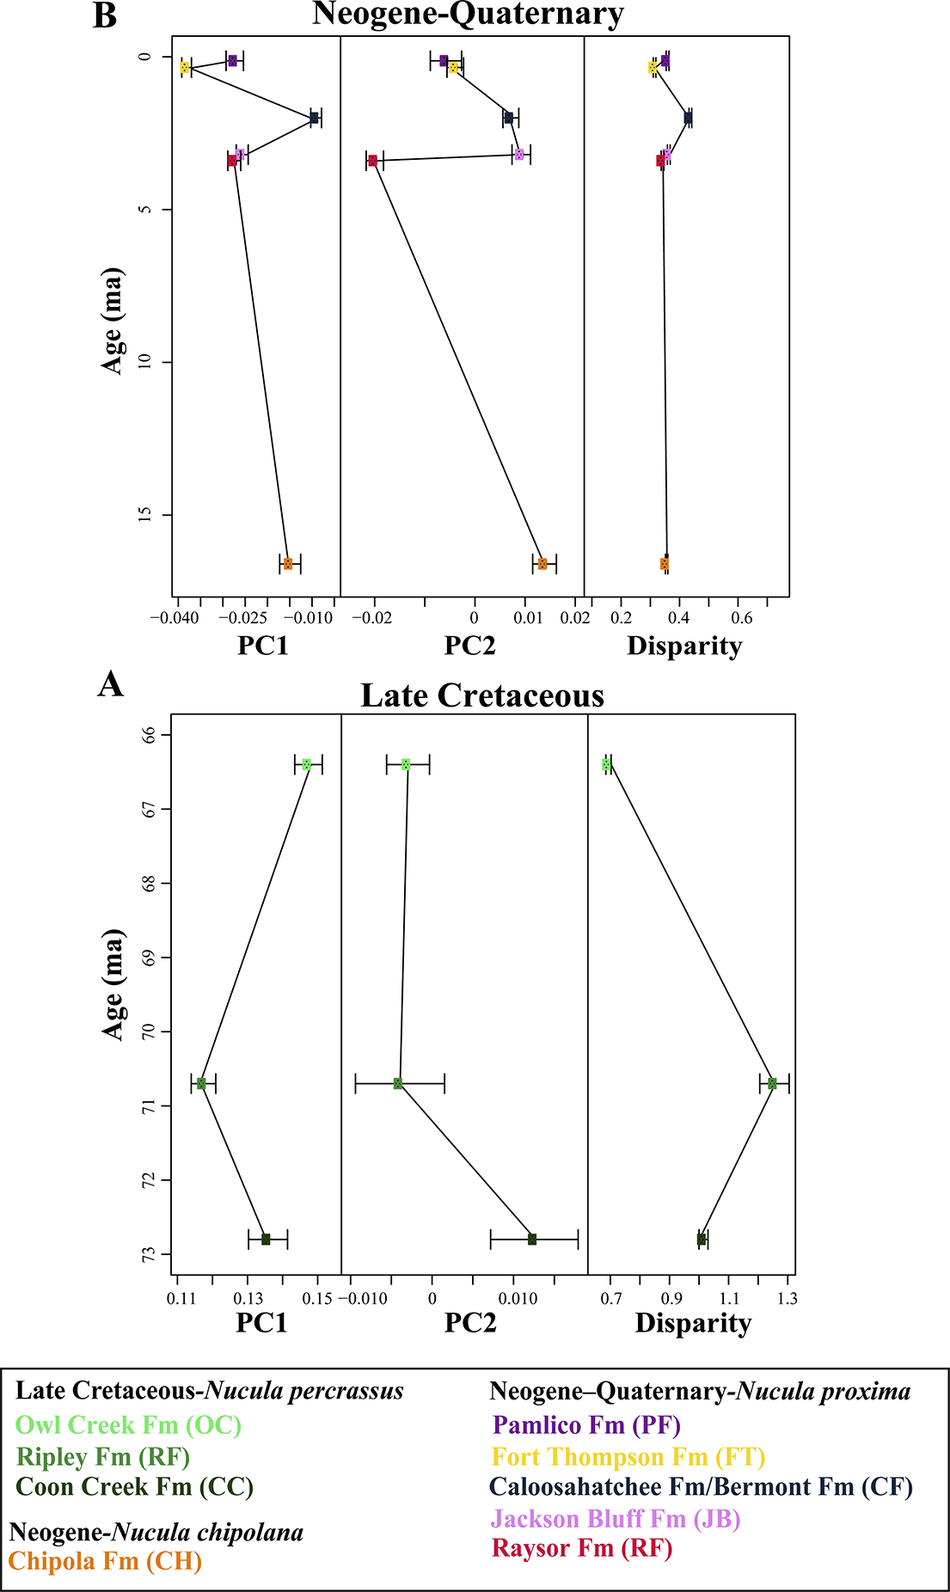
PC 1 to PC 3 scores for Nucula reveal pronounced shape similarities among Neogene–Quaternary specimens, but reduced morphological similarities among Cretaceous specimens (Figs. 9–11, Supplementary Table 3). This is despite the Neogene–Quaternary specimens spanning almost twice the time interval (i.e., 16.5 Myr vs. 7.5 Myr) compared with the Cretaceous specimens. PC 1 scores of Cretaceous and Neogene–Quaternary Nucula explain 68.3% of the observed shape variation, whereas PC2 and PCS explain 12.6% and 3.5% of the observed shape variation, respectively. The variation along PC 1 primarily reflects changes in shell length, whereas variation along PC 2 reflects differences in umbo shape and prominence. Along PC 1, Neogene–Quaternary Nucula exhibit negative scores, whereas Late Cretaceous Nucula exhibit positive scores. Along PC 2, both Neogene–Quaternary and Cretaceous Nucula have scores that vary around the zero-axis line. All 95% confidence intervals around mean scores for Neogene–Quaternary Nucula specimen closely overlap along both PC 1 and PC 2. In contrast, Cretaceous Nucula specimen 95% confidence intervals around mean scores from the different intervals show reduced overlap (Fig. 9).
Principal component analysis (PCA) axes 1 to 3 scores for Late Cretaceous and Neogene–Quaternary Nucula. Back-transformed shapes (gray) in background show Nucula outline shape variation in morphospace. Ellipses represent 95% confidence intervals around mean PCA scores.

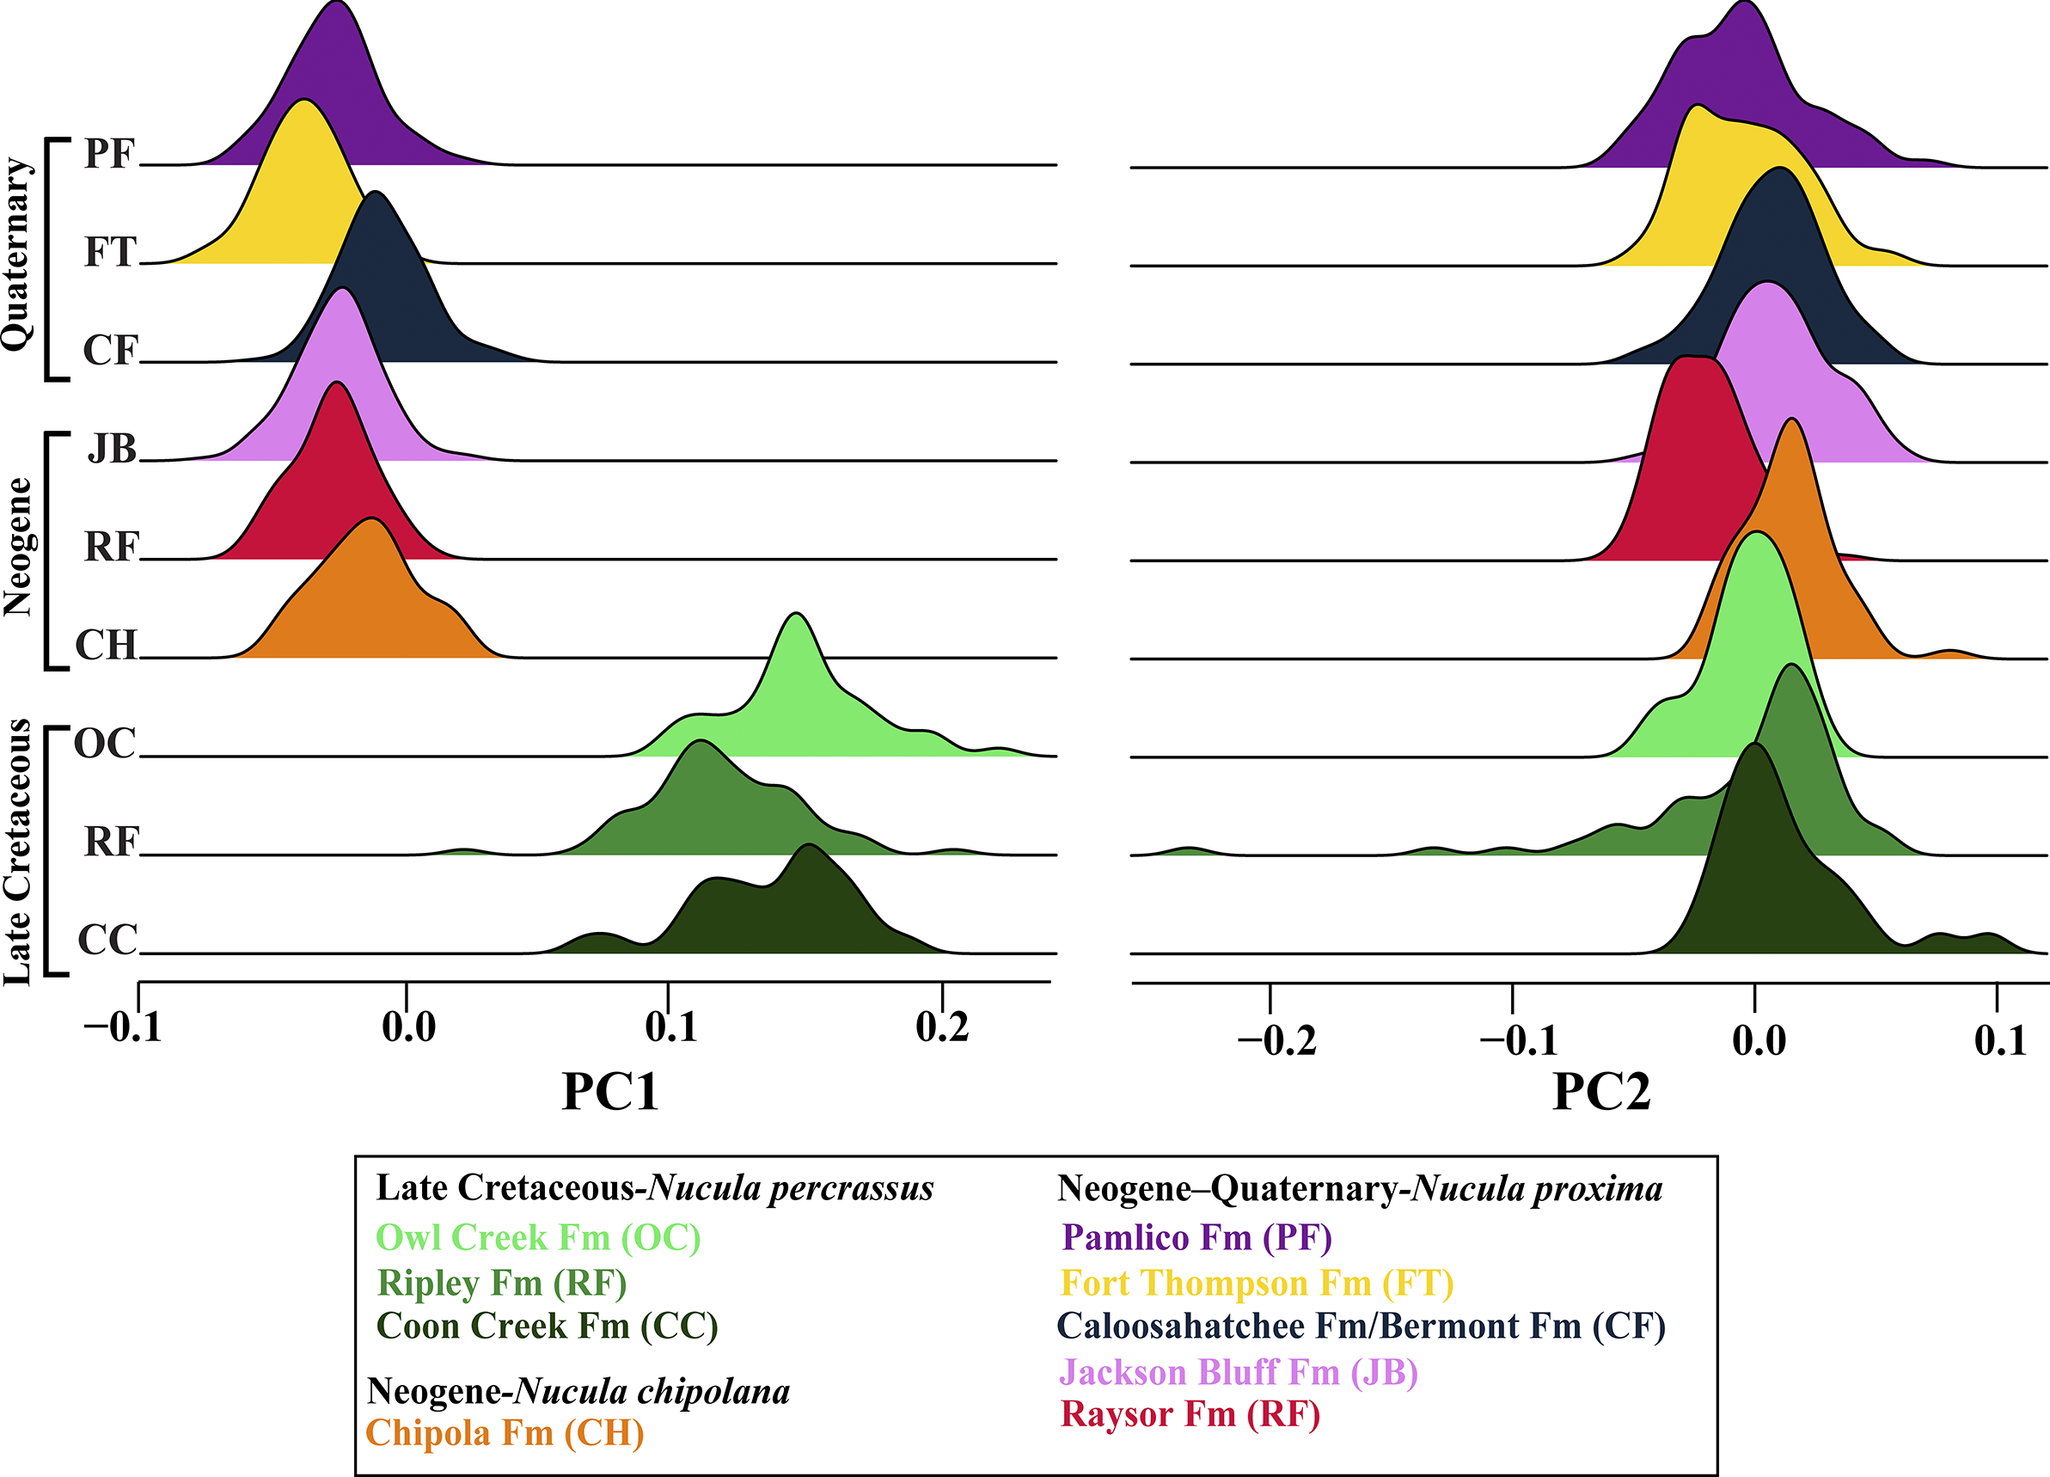
Ridgeline plots showing changes in Nucula principal component analysis (PCA) axes 1 and 2 scores for the Late Cretaceous and Neogene–Quaternary.

Time series showing changes in Nucula mean morphology and disparity during the Late Cretaceous (A) and Neogene–Quaternary (B).

Disparity (i.e., morphological variance) among Cretaceous Nucula is greater, with a range between 0.73 and 1.26, compared with Neogene–Quaternary species, which vary between 0.32 and 0.44 (Fig. 11A, Supplementary Table 3). During the late Campanian to early Maastrichtian age, Nucula disparity increased from 1.05 to 1.25 and then decreased during the early to late Maastrichtian to 0.73 (Fig. 11A). Morphological disparity remained the same through the Neogene and then varied over a narrow range during the Quaternary (Fig. 11B, Supplementary Table 3). Disparity among Nucula decreased from 0.35 in the Miocene down to 0.33 during the late Pliocene. It then varied between 0.36 to 0.32 from the early and middle Pleistocene to late Pleistocene.
The omega values based on PCA of shape are greater for the Cretaceous N. percrassa compared with the Neogene–Quaternary N. chipolana–proxima lineage (Fig. 8B, Table 2). Specifically, the omega value for the Cretaceous Nucula is 0.697, whereas the Neogene–Quaternary specimens have a substantially lower value of 0.008. Therefore, the omega value for the Cretaceous Nucula is approximately 3.81 times greater than that of the Neogene–Quaternary Nucula. As noted earlier, the larger confidence limits for Cretaceous versus Neogene–Quaternary Nucula are due to the smaller sample size for the former group (Fig. 8B, Table 2).
Allometry
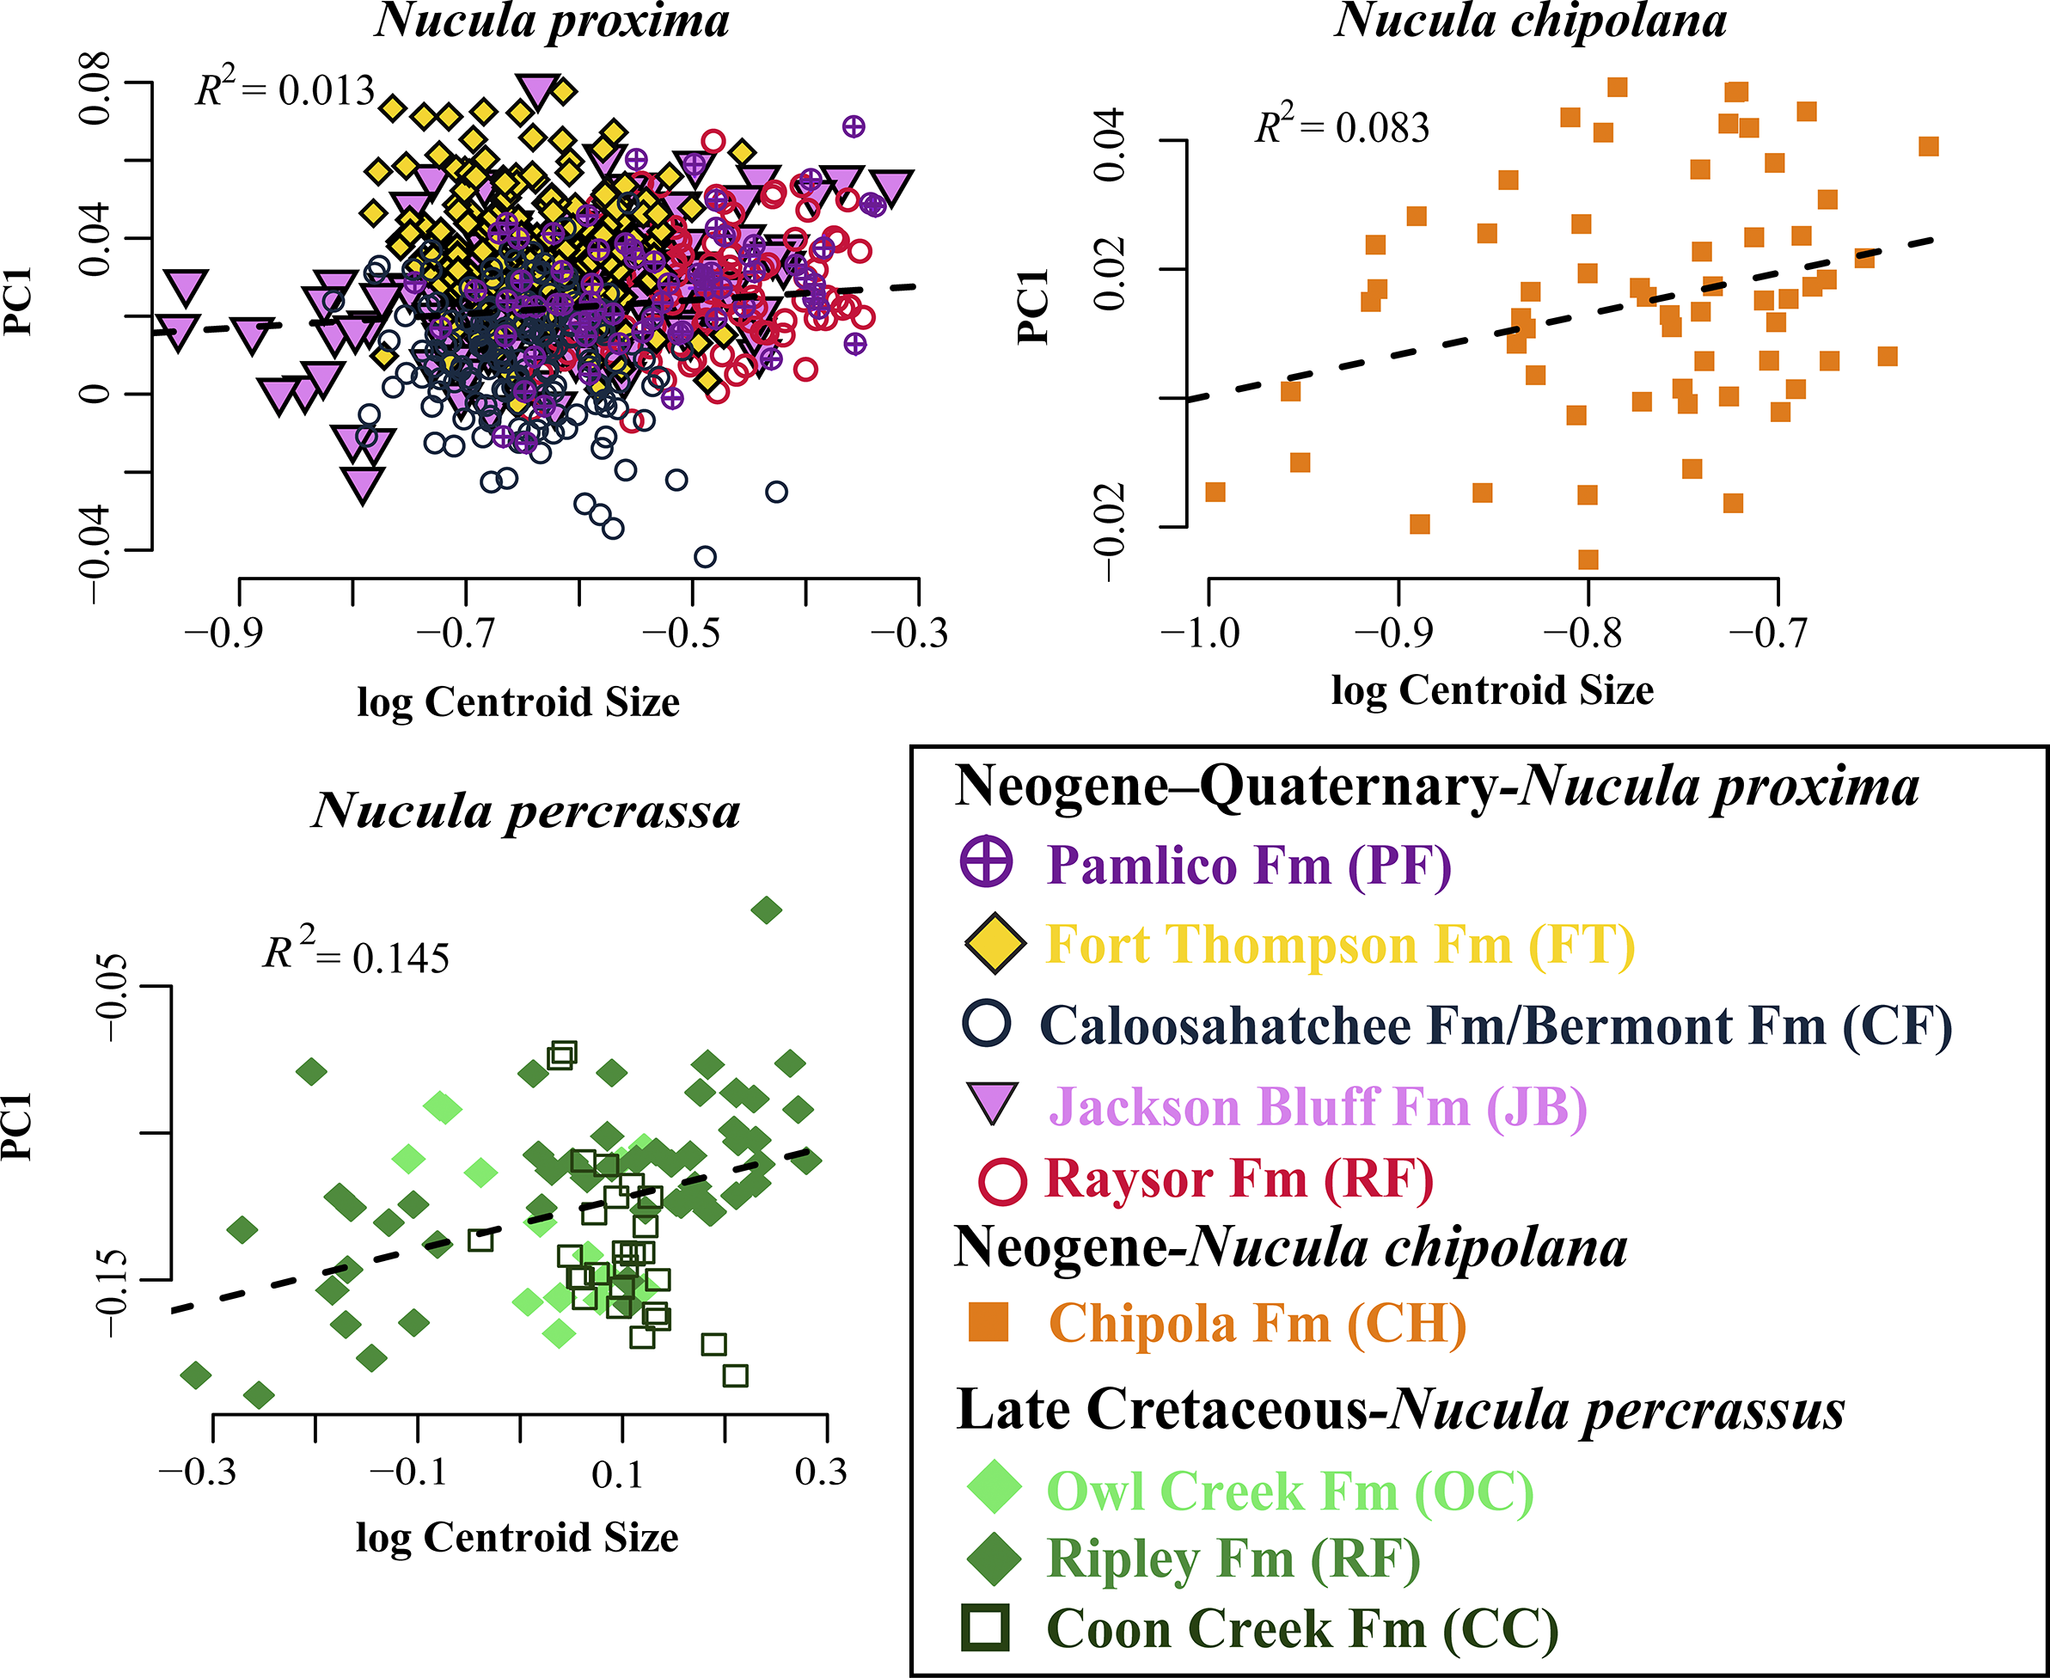
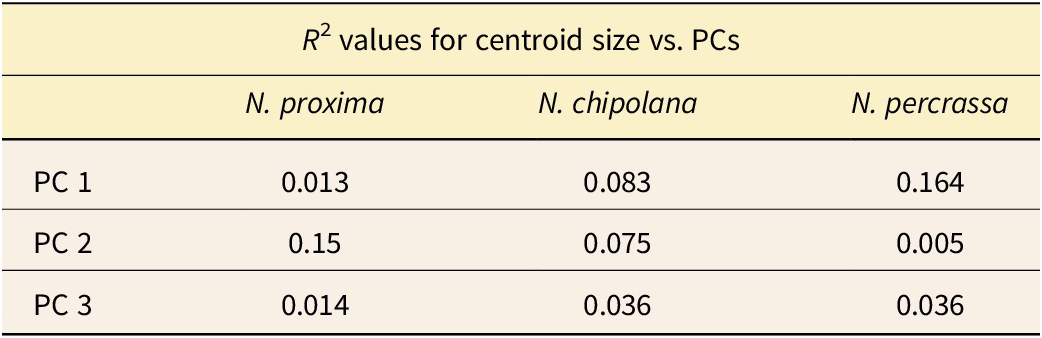
The relationship between size and shape (i.e., allometry) for the Cretaceous and Neogene–Quaternary Nucula shows limited correlation for PCA axes 1 to 3 scores (Fig. 12, Table 3). The trend between principal components (i.e., a measure of shape) and centroid sizes (i.e., a measure of size) of Cretaceous Nucula as well as the Neogene–Quaternary Nucula have small R 2 values (see Fig. 12).
Allometric test of principal component analysis (PCA) axis 1 scores (i.e., a measure of shape) and centroid sizes (i.e., a measure of size) of Late Cretaceous Nucula percrassa Conrad, Reference Conrad1858, Miocene N. chipolana Dall, Reference Dall1898, and Pliocene to Holocene N. proxima Say, Reference Say1822.

R² values for Cretaceous and Neogene–Quaternary Nucula centroid sizes versus principal component analysis (PCA) axes 1 to 3 scores.

Discussion
Size Trends
Box, ridgeline, and time-series plots as well as omega values for Cretaceous Nucula reveal a size decrease over time (Figs. 5A, 6, 7A, Table 2). This trend is related to either progressively shorter life spans through the latest Cretaceous or heterochronic changes in development (e.g., see Haveles and Ivany Reference Haveles and Ivany2010; McNamara Reference McNamara2012; McKinney and McNamara Reference McKinney and McNamara2013). The former explanation requires a decrease in longevity through time, whereas the latter explanation involves a progressive reduction in the timing of maturity. Both factors would have been driven by changes in extrinsic environmental factors through the latest Cretaceous. To determine the efficacy of these potential mechanisms, a combination of detailed stratigraphic refinement in environmental proxies and sclerochronologic approaches are required to determine if this decrease in size was driven by either ecologic or evolutionary factors.
The bimodal size distributions of Nucula from the early Maastrichtian age Ripley Formation and the late Maastrichtian age Owl Creek Formation have several possible explanations (Fig. 6). These specimens, representing different time intervals, were collected from closely spaced localities within the eastern Mississippi Embayment (Fig. 3), making geographic differences an unlikely cause for the bimodal size distribution. The most parsimonious explanation is that the bimodal size distributions result from the preferential collection of certain size classes or sampling from different stratigraphic horizons in the Ripley Formation and Owl Creek Formation, which contain Nucula of different sizes.
The N. chipolana–proxima lineage shows an increase in mean centroid size from the middle Miocene to the Pliocene (Figs. 5B, 6, 7B). This size increase occurred during a progressive global cooling trend from the middle Miocene climatic optimum to the beginning of the Pliocene warm interval (Zachos et al. Reference Zachos, Pagani, Sloan, Thomas and Billups2001). Similar patterns of late Neogene size increase have been observed in other Western Atlantic bivalves and clades across the Gulf and Atlantic Coastal Plains (e.g., Gardner Reference Gardner1926; Thompson Reference Thompson2001; Slattery Reference Slattery2019). Several non-mutually exclusive factors could explain this trend, including: (1) Bergmann’s rule, which posits that species are larger in colder climates (Hunt and Roy Reference Hunt and Roy2006; Crouch and Clarke Reference Crouch and Clarke2019); (2) Cope’s rule, which suggests that organisms increase in size over time (Cope Reference Cope1887, Reference Cope1896; Newell Reference Newell1949; Stanley Reference Stanley1973; Jablonski Reference Jablonski1997; Alroy Reference Alroy1998); (3) increased longevity over time; (4) higher growth rates due to increased productivity (Haveles and Ivany Reference Haveles and Ivany2010); or (5) heterochronic changes in development (Haveles and Ivany Reference Haveles and Ivany2010; McNamara Reference McNamara2012; McKinney and McNamara Reference McKinney and McNamara2013).
Determining the specific drivers of this size change is challenging due to gaps in the stratigraphic record that limit our ability to constrain the timing of morphological shifts and their relationship to environmental changes. To determine the driver of this size change, higher-resolution stratigraphic sampling of Nucula through this interval, combined with sclerochronological analysis of shell growth rates and improved chronostratigraphic data, would enable more precise correlations with environmental changes documented in continuous stratigraphic successions (i.e., data documented from deep-sea cores).
Box, ridgeline, and time-series plots as well as omega values reveal that N. proxima maintained a relatively similar mean size from the Pliocene into the late Pleistocene (see Figs. 5B, 6, 7B). Limited size change suggests that N. proxima was under stasis for a minimum of 3.6 Myr. The potential maximum duration of stasis could be considerably longer, but the lack of latest Miocene and early Pliocene age stratigraphic successions from which to collect additional well-preserved specimens prohibits the inclusion of nuculids from this interval.
During the Pliocene and latest Pleistocene, N. proxima exhibited a decrease and increase in size, respectively (Figs. 5B, 6, 7B). These patterns reflect either an evolutionary response to ocean–climate shifts or geographic size differences between N. proxima populations along the Atlantic and Gulf of Mexico margins. For example, the size decrease and increase correlate with the Pliocene warm interval and with global cooling following the middle Pleistocene climatic transition, respectively. While it could be argued that these patterns reflect evolutionary changes in response to climate, they are more likely due to geographic factors. The larger N. proxima specimens come from the Pliocene age Raysor Formation and the latest Pleistocene age Pamlico Formation of the Atlantic Coastal Plain, where bivalves are generally larger than those in the Gulf Coastal Plain (Slattery Reference Slattery2019). The variation in N. proxima sizes between these regions is likely influenced by a combination of factors, including Bergmann’s rule, geographic differences in longevity, or variation in growth rates due to differences in productivity between the Western Atlantic and Gulf of Mexico shelves. Identifying the cause of this variation is beyond the scope of this study and requires both sclerochronological approaches and geochemical datasets to investigate the environmental context of these size changes/differences.
Shape Trends
PCA and omega values of outline shapes indicate greater morphological differences over time for Cretaceous Nucula. These differences are shown by a decreased overlap in PCA 95% confidence intervals and changes in morphological distributions over time (Figs. 9–11). The larger omega values for Cretaceous Nucula support a greater magnitude of morphological change from the latest Campanian to the latest Maastrichtian (Fig. 8B, Table 2).
In contrast, the greater overlap of PCA 95% confidence intervals and morphological distributions over time, along with smaller omega values, support stasis for Nucula during the Neogene–Quaternary (Figs. 9–11). The pronounced overlap in shape outlines indicates minimal morphological change for the N. chipolana–proxima lineage from the middle Miocene through the Pleistocene and supports the interpretation that N. chipolana and N. proxima are the same species. However, a broader range of characters needs to be analyzed to rigorously evaluate whether these are the same species.
As compared to Neogene–Quaternary specimens, Cretaceous Nucula exhibit broader morphological distributions on ridgeline plots and larger disparity values (Figs. 10, 11), which indicate greater morphological variability and, consequently, more raw phenotypic variation for natural selection among Cretaceous species (e.g., West-Eberhard Reference West-Eberhard1989, Reference West-Eberhard2003; Lloyd and Gould Reference Lloyd and Gould1993; Sheldon Reference Sheldon, Lees and Edwards1993; Day and McPhail Reference Day and McPhail1996; Yacobucci Reference Yacobucci2004). The specific mechanism(s) driving this variability are still debated, but it is likely related to the timing and duration of relative environmental stability, ecological interactions, environmental change, and potential interactions between these components (Simpson Reference Simpson1944; Parsons Reference Parsons1987; Ayala et al. Reference Ayala, Valentine, Delaca and Zumwalt1975; Sheldon Reference Sheldon, Lees and Edwards1993; Pigliucci Reference Pigliucci2001, Reference Pigliucci2005; Pigliucci et al. Reference Pigliucci, Murren and Schlichting2006; Yacobucci Reference Yacobucci2004). However, there remains considerable debate around the conditions and environments that drive increases in phenotypic variability. Parsons (Reference Parsons1987) suggests that high phenotypic variability is characteristic of high-stress environments, as greater variability would be advantageous for adaptation. Conversely, Ayala et al. (Reference Ayala, Valentine, Delaca and Zumwalt1975) and Sheldon (Reference Sheldon, Lees and Edwards1993) hypothesize that high phenotypic variability is more likely to occur in stable environments, as these conditions provide greater opportunities for phenotypic experimentation and the accumulation of directional change. A more stable environment allows taxa to evolve along various trajectories throughout their biogeographic range without environmental change “resetting” those trends. The greater shape variability in Cretaceous Nucula suggests that the more stable environments of this interval allowed this evolutionary response that is reflected in increased morphological variation. In contrast, the limited morphological variability in Neogene–Quaternary Nucula suggests that more frequent and pronounced environmental changes did not allow sufficient time for the expression of morphological variation in the group. Reduced variability is supported by the decrease in morphological disparity from the stable early Neogene to the increasingly unstable late Neogene (Fig. 11B).
Allometric Effects on Shape
Allometric effects must be considered in shape analysis, as morphological differences might reflect ontogenetic stage rather than changes over time. Many species exhibit allometric effects, where shape proportions change through ontogeny (Bonner Reference Bonner2006). However, the weak correlation between size and shape for Cretaceous and Neogene–Quaternary Nucula indicates that size plays a limited role in controlling specimen shape (Fig. 12, Table 3). The weak correlation suggests that Nucula species grow isometrically, with all shell dimensions expanding at identical rates. Therefore, the shell characteristics of large individuals are indistinguishable from those of small individuals. Isometric growth indicates that the observed patterns in Nucula shape reflect true changes over time and are not being confounded by ontogenetic changes.
Implications for the Plus ça Change Model
The empirical data presented here support the Plus ça change model, which predicts that environmental stability during different climatic regimes is linked to varying evolutionary patterns. The results, which are derived from a single genus to avoid potential confounding issues associated with taxonomic variation, also indicate that morphological disparity is related to environmental stability over geological timescales. Furthermore, the analysis suggests that ocean–climate interactions play a significant role in shaping environmental stability, and, consequently, selection pressures.
The changes in size and shape documented here for Cretaceous Nucula support the Plus ça change prediction that reduced environmental variability is associated with directional evolutionary responses. During greenhouse intervals, the amplitudes and rates of environmental variation are sufficiently reduced that they do not substantially alter marine habitats over the long term. This fosters greater ecological stability, providing marine faunas more time to adapt to both environmental shifts and non-environmental selection pressures. Thus, the slowly changing environment of the Late Cretaceous greenhouse reduced environmental selection pressures and led to more consistent biotic interactions over geological timescales, permitting Nucula to evolve in response to non-environmental pressures, such as competition or escalation. These conditions also allowed for reduced environmental selection pressures to promote greater phenotypic variation which, in turn, provided more raw material for natural selection among the Cretaceous species, potentially resulting in gradual phyletic evolution over the long term.
The limited size and shape changes observed in Miocene to Pleistocene Nucula further support the Plus ça change hypothesis, which predicts that increased environmental variability, such as that characteristic of climate variation during the late Cenozoic, is more likely to be associated with morphological stasis. During transitional and icehouse regimes, environmental fluctuations due to the pronounced impact of Milankovitch band variation are rapid and reduce overall stability, leading to fluctuating selection pressures on marine species (Roy et al. Reference Roy, Valentine, Jablonski and Kidwell1996). These rapidly fluctuating conditions and changing selection pressures in transitional and icehouse climates promote stasis through four possible, non-mutually exclusive mechanisms: (1) limited time available for species to adapt to rapidly changing conditions, (2) reduced phenotypic disparity, (3) coordinated stasis, and (4) change in morphological traits tracking and constrained by the boundaries of climatic fluctuations.
The first mechanism suggests that environmental fluctuations drive species to track shifting habitats, resulting in populations fragmenting and reforming over time (Potts Reference Potts1983; Pease et al. Reference Pease, Lande and Bull1989). This process is akin to a reticulate evolutionary model (sensu Sylvester-Bradley Reference Sylvester-Bradley, Kauffman and Hazel1977) but occurs over time intervals that are too short for new species or lineages to originate, as they are recombined before sufficient evolutionary differentiation can occur to produce genetic isolates (Futuyma Reference Futuyma1987; Liebermann et al. Reference Lieberman, Brett and Eldredge1995; Eldredge et al. Reference Eldredge, Thompson, Brakefield, Gavrilets, Jablonski, Jackson, Lenski, Lieberman, McPeek and Miller2005). Over the long term, this short-term instability reduces the ability of species to produce an evolutionary response before the dynamic environmental system changes again (Roy et al. Reference Roy, Valentine, Jablonski and Kidwell1996). Under these conditions, organisms do not display evolutionarily significant morphological variation over geological timescales and accommodate most changes ecologically through habitat tracking.
The second mechanism suggests that the amplitude and rapidity of environmental changes reduce morphological disparity, as exemplified by the Neogene–Quaternary Nucula. This decrease in disparity limits the raw phenotypic variation available for natural selection, restricting the ability of Nucula to evolve a broader range of forms. As a result, the limited size and shape changes documented during this interval are a consequence of this constrained phenotypic variation.
A third mechanism that may explain stasis during transitional and icehouse regimes is coordinated stasis. This model posits that, despite environmental and climatic fluctuations, stable habitats persist over time, which species track (Brett et al. Reference Brett, Ivany and Schopf1996; Ivany et al. Reference Ivany, Brett, Wall, Wall and Handley2009; Brett Reference Brett and Talent2012). In this context, morphological stasis is promoted when multiple coexisting species undergo minimal evolutionary change. Limited morphological change across many coexisting species reinforces stasis in each species, as minimal change in one species reduces selective pressures on the others. This dynamic helps maintain a steady ecological assemblage over time, with each species preserving relatively constant forms within the community. Coordinated stasis should also operate under greenhouse conditions, when stable habitats may be more prevalent. However, the data presented here suggest that morphological change is associated with less variable environmental conditions. Therefore, while coordinated stasis is a plausible mechanism, it fails to account for the lack of stasis during greenhouse regimes.
The final mechanism, first proposed by Hunt et al. (Reference Hunt, Bryan and Mullarney2015), suggests that rather than accumulating morphological changes over time, traits track temperatures bounded by glacial–interglacial cycles. These fluctuating traits enable species to adapt and maintain stability during each cycle, resulting in dynamic stasis—a pattern of minor evolutionary changes without significant net change. According to this model, the short-term nature of climate variation during icehouse regimes, compared with a species’ total temporal range, ensures that morphological characters remain within the bounds of glacial–interglacial cycles. As a result, traits exhibit stasis, fluctuating within these boundaries. Although this model explains how stasis can occur during environmental change, it also predicts that morphological variation should be greater during icehouse regimes than during greenhouse periods, because the environmental variation (or bounds) are more pronounced in the former over an identical time interval. Based on this prediction and our morphological data, we infer that bounded climatic fluctuations likely played a minimal role in promoting stasis among Nucula, as the morphological variation in Neogene–Quaternary species was smaller than that observed in the Cretaceous examples.
Paleobiological Implications
While this study supports the Plus ça change model, it represents just one analysis that explicitly examines the influence of extrinsic controls on morphological change over time. Since Sheldon’s (Reference Sheldon1996) hypothesis was published, only a limited number of studies have explicitly tested the hypotheses inherent in this concept (e.g., Kim et al. Reference Kim, Sheets and Mitchell2009). The limited number of case studies testing the Plus ça change model underscores the need for further research to elucidate how the duration and types of stability influence evolutionary responses of various clades. This is particularly important, because most studies on evolutionary processes emphasize biological/ecological agents over broader environmental factors (e.g., Palmer Reference Palmer1979; Dietl Reference Dietl2003; Audino et al. Reference Audino, Serb and Marian2020; Pigot et al. Reference Pigot, Sheard, Miller, Bregman, Freeman, Roll, Seddon, Trisos, Weeks and Tobias2020), creating a critical gap in understanding how large-scale environmental changes impact evolution.
As Gould, Eldredge, and others have emphasized, the debate over contrasting evolutionary patterns are not about whether different tempos and modes exist, but rather their relative frequencies throughout geological time. Understanding these frequencies is crucial for uncovering how species respond to environmental changes, identifying the drivers of biodiversity, and clarifying the mechanisms that shape life’s evolutionary history. More case studies explicitly testing the relationship between evolutionary tempo and mode and paleoenvironmental context—particularly those employing standardized methods and analyzing multiple traits within well-constrained lineages and settings—are needed to provide deeper insights into how environmental variables shape evolutionary patterns and processes.
Conclusions
Understanding the processes driving evolutionary change is a major challenge in paleobiology. Despite its significance, much of the discourse in the field has centered on theoretical debates, with relatively few empirical studies directly documenting the morphological change inherent in species, lineages, or groups. Most evolutionary tempo and mode studies using the fossil record focus on identifying different evolutionary patterns, often neglecting the underlying processes that drive them. Furthermore, in the rare examples where underlying processes are considered, biological/ecological agents typically receive more attention than broader environmental factors, leaving an important gap in our understanding of how large-scale environmental changes influence evolution.
This study demonstrates that the bivalve Nucula underwent morphological change during the Cretaceous greenhouse, while remaining in stasis during the Neogene–Quaternary transitional and icehouse climate intervals. These findings align with the predictions of Sheldon’s (Reference Sheldon1996) Plus ça change model, which posits that increased environmental variability, such as during transitional and icehouse intervals, fosters stasis, whereas reduced variability, such as during greenhouse intervals, allows for the accumulation of progressive morphological change. By linking evolutionary patterns to distinct climatic regimes, this study provides deeper insights into how environmental processes have the potential to shape evolutionary outcomes over geological timescales.
The limited number of case studies testing the Plus ça change model underscores the need for further research to document the prevalence of different evolutionary patterns in their environmental and climatic contexts over geological time. Rather than debating the existence of different evolutionary patterns, the focus should shift to their relative frequencies and the mechanisms driving them to better understand morphological change, speciation, and diversification. To advance our understanding of evolutionary processes, future studies must integrate paleoenvironmental contexts, use standardized methodologies, and examine multiple traits within well-defined lineages and settings. Such efforts will not only enhance our understanding of evolutionary patterns but will also shed light on the underlying processes behind them.
Acknowledgments
We sincerely thank E. Saupe and J. Kastigar for their invaluable support in shepherding our manuscript through the review process. Thanks to G. Hunt, L. Ivany, B. Andres, N. Landman, M. Meyer, K. Minor, M. Puckett, R. Ostrander, and M. Olney for their helpful suggestions and critical input on this paper. We acknowledge A. and B. Carroll (Mississippi), M. Gibson (University of Tennessee Martin), W. Creel (Pink Palace Museum), and P. Broadbent (Coon Creek Science Center) for their assistance in accessing localities. We also thank R. Portell (Florida Museum of Natural History), G. Phillips (Mississippi Museum of Natural Science), K. McKinney (United States Geological Survey), S. Butts (Yale Peabody Museum of Natural History), and J. Utrup (Yale Peabody Museum of Natural History) for help accessing and photographing museum specimens. Partial funding for this research has been provided by National Science Foundation through Grant EAR 1053517 to P.J.H. Funding was also provided to J.S.S. by the Tampa Bay Fossil Club Louis Villei Memorial and Research grants, St. Petersburg Shell Club Research Grant, University of South Florida School of Geosciences Richard A. Davis Jr. Endowed Fellowship in Geology Research Award, Paleontological Research Institute J. Thomas Dutro Jr. Student Award in Systematic Paleontology, Association of Applied Paleontological Services Rene M. Vandervelde Research Grant, American Museum of Natural History Lerner Gray Fund for Marine Research and Collection Study Grant, Geological Society of America Student Research Grant, Florida Paleontological Society Gary S. Morgan Award, Gulf Coast Association of Geological Societies Student Grant Program, Yale Peabody Museum of Natural History Schuchert and Dunbar Grant in Aid Program, and Sigma-Xi Grants-in-Aid-of-Research.
Competing Interests
The authors declare that they have no competing interests.
Data Availability Statement
Data available from the Dryad Digital Repository: https://doi.org/10.5061/dryad.sqv9s4ndb.


 Open access