

The French Agency for Food, Environmental and Occupational Health & Safety (ANSES) is responsible for assessing food-related health and nutritional risks and benefits in France. Assessing dietary exposure or nutrient intakes requires detailed data on the food consumption and eating habits of individuals. For this reason, ANSES carries out the Individual and National Studies on Food Consumption (INCA surveys). Two previous surveys were carried out in 1998–1999 (INCA1)( Reference Volatier 1 ) and 2006–2007 (INCA2)( 2 ). The time interval between the two surveys (8 years) highlighted changes in the dietary and nutrient intakes of the French population( Reference Dubuisson, Lioret and Touvier 3 , Reference Lioret, Dubuisson and Dufour 4 ). A regular update of food consumption data therefore appears essential to ensure reliable food-related risk assessments and the third INCA survey (INCA3) was conducted in 2014–2015( 5 ). Its main objective was to update the data on the foods, beverages and food supplements consumed, the nutrient intakes, the weight status, the physical activity and sedentary behaviour, the eating habits and the food purchasing, preparation and preservation practices for individuals living in mainland France.
The INCA3 survey marked a methodological turning point. It was carried out in the framework of the EU Menu Project of the European Food Safety Authority (EFSA), which is seeking to harmonize food consumption data between the Member States of the European Union. The INCA3 survey thus followed the general principles for the collection of national food consumption data drawn up by EFSA in 2009( 6 ) and updated in 2014( 7 ). The final Guidance took into account the results of two pan-European pilot studies designed to test the EU Menu methodology: (i) the Pilot study for the Assessment of Nutrient intake and food Consumption Among Kids in Europe (PANCAKE) among children aged 0–10 years old( Reference Ocké, de Boer and Brants 8 ); and (ii) the Pilot study in the view of a Pan-European dietary survey (PILOT-PANEU) among individuals aged 11–79 years old( Reference Ambrus, Horvath and Farkas 9 ). Regarding the INCA surveys, the dietary data collection method was changed considerably to comply with the EU Menu methodology: the seven-consecutive-day food record used in the previous INCA surveys was replaced by two or three non-consecutive 24 h recalls. This major methodological change may have affected the participation in the survey, as well as the quality of the collected dietary data.
Given this background, the present paper describes the methodology implemented in the INCA3 survey along with the participation rate and gives some insights on dietary data quality.
Methods
The French INCA3 food consumption survey is a national cross-sectional survey carried out by ANSES in mainland France between February 2014 and September 2015. Its methodology was developed in order to comply as much as possible with EFSA requirements at every stage of the protocol( 7 ).
The INCA3 survey received the ‘public interest and statistical quality’ seal of approval from France’s National Council for Statistical Information and the mandatory authorization from the French Data Protection Authority.
Sampling design
The study population includes all individuals aged from birth to 79 years old and living in mainland France. Institutionalized individuals, individuals moving out of their home within 2 months and individuals not able to be interviewed were considered ineligible.
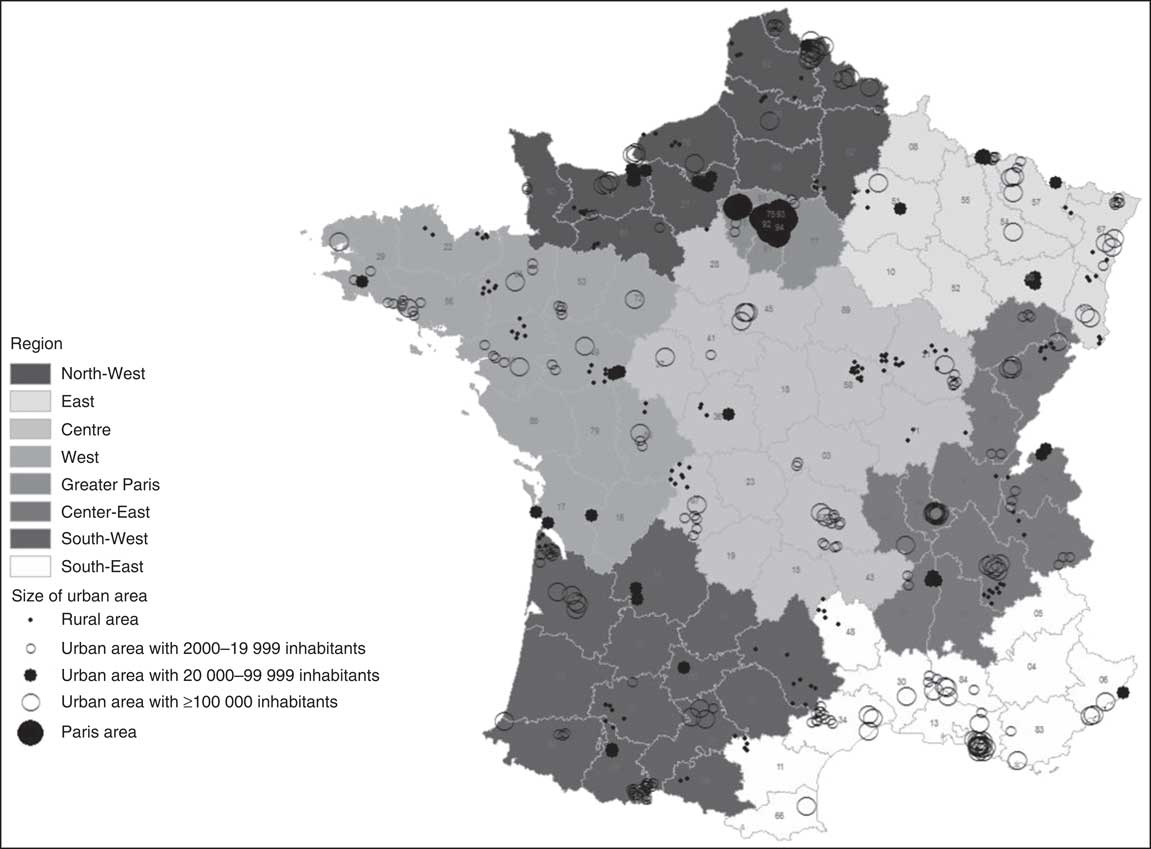
The sampling design was developed in cooperation with the National Institute of Statistics and Economic Studies in accordance with the EFSA Guidance document( 7 ). Two independent random samples of 0- to 17-year-old children and 18- to 79-year-old adults were drawn using a three-stage cluster sampling design (geographical units, households and individuals). At the first level, 181 geographical primary sampling units were selected (Fig. 1). They fully included the thirty-seven primary sampling units containing more than 40 000 residences. The 144 remaining primary sampling units were randomly selected with probability proportional to the number of main residences, after stratification by region of residence and size of the urban area. At the second level, 25 981 households surveyed in the 2011 annual national census were randomly selected within the primary sampling units, following an allocation by region of residence and size of the primary sampling unit. Two independent household sampling frames were set up: the child (n 11 197) and the adult (n 14 784) samples. In every stratum, the households were then randomly assigned to one of the five waves of survey to ensure national representativeness at each season of the year. At the third level, an interviewer randomly selected within each household the eligible individual whose birth date (day and month) was the nearest to the recruitment date. This method was easy to perform manually during the face-to-face recruitment.
Location of the 181 geographical primary sampling units of the INCA3 survey according to region and size of urban area (INCA3, Third French Individual and National Food Consumption Survey 2014–2015)
Recruitment
After receiving an information letter, the individuals were recruited by telephone or directly face-to-face. Face-to-face recruitment was chosen for the households for which a telephone number could not be found, which remained non-contactable by telephone after fifteen attempts or whose head was 65 years old or over. Recruitment required two contacts (household, then selected individual). At the household level, all eligible persons were listed to randomly select the individual to be interviewed. At the individual level, the oral consent for participation had to be obtained directly from the selected individual as well as from his/her representative for children up to 17 years old. At both levels, multiple contacts were tried (up to fifteen by telephone and four face-to-face on different days and at different times) before classifying the household/individual as ‘unresolved’. In case of refusal, the main reasons were identified. The objective was to reach 4000 participants in the survey, divided into 2000 children and 2000 adults. This sample size met the minimum EFSA requirements to estimate high percentiles in age–gender subgroups( 7 ) and proved to be sufficient for risk assessment analysis at the national level with the previous INCA2 survey.
Data collection and measurements
Data connected to food-related and nutrient risk–benefit assessment and required by the European harmonization process were collected: dietary information, physical activity and sedentary behaviour, anthropometric characteristics, health status and sociodemographic characteristics. Data related to food sufficiency and security and eating habits were also gathered to meet national-specific needs. The data were collected with questionnaires administered by interviewers, face-to-face (FAF; using a computer-assisted personal interview system) and by telephone (using a dietary software), as well as with a self-administered (SA) questionnaire available either on paper or via the Internet (using a computer-assisted web interview system). The questionnaires were completed by the individual (or his/her representative, for children aged 0–10 years). Table 1 presents a brief overview of all the data collected.
Summary of data collected in the INCA3 survey and methods of data collection
INCA3, Third French Individual and National Food Consumption Survey 2014–2015; FAF, administered face-to-face; SA, self-administered.
Dietary information
Dietary information was collected following the method recommended by EFSA as closely as possible. Detailed information on the consumption of foods and beverages was collected over three non-consecutive days (two weekdays and one weekend day including public holidays) spread over three weeks. The 24 h recall method was used for individuals aged 15 to 79 years old and the 24 h open-ended food record method for individuals aged 0 to 14 years old. In both methods, the dietary information was collected by a telephone interview using the standardized and computerized 24 h recall program GloboDiet (formerly EPIC-Soft) developed by the International Agency for Research on Cancer( 10 – Reference Voss, Charrondiere and Slimani 13 ). The GloboDiet methodology has already been proved to produce reliable dietary data for epidemiological studies( Reference Slimani, Bingham and Runswick 14 ) and food consumption surveys( Reference Cyupers, Lebacq and Bel 15 – Reference Crispim, Nicolas and Casagrande 18 ) and its use was successfully validated in a French context during the European Food Consumption Validation (EFCOVAL) project( Reference Crispim, de Vries and Geelen 19 , Reference Crispim, Geelen and Souverein 20 ). An updated French-specific version of GloboDiet was prepared for the INCA3 survey.
In the French version, each 24 h food recall/record was divided into ten eating occasions including four main meals (breakfast, lunch, afternoon snack, dinner) and six between-meals snacks (before breakfast, during the morning, pre-lunch aperitif, during the afternoon, pre-dinner aperitif, during the evening/the night). In the case of 0- to 5-month-old infants, the day was divided into four periods of 6 h (morning, afternoon, evening, night). The individuals were asked to report their dietary intake by identifying all the foods and beverages consumed during the day or at night, describing them through a sequence of nineteen possible ‘facets’ and their descriptors (Table 2) and quantifying the consumed portion sizes. In the case of breast-fed infants, only the breast-feeding frequency was collected, as recommended by EFSA( 7 ) and tested in the PANCAKE study( Reference Ocké, de Boer and Brants 8 ). Food portion sizes were estimated using pictures of food servings and household measures (glass, cups) or drawings of food shapes and thickness, or directly expressed by weight/volume or standard units (such as commercial food portions). A picture book was specially developed for the INCA3 survey. It included a selection of photographs from the PANCAKE study and EPIC-Soft picture books( Reference Trolle, Vandevijvere and Ruprich 21 , Reference Van Kappel, Amoyel and Slimani 22 ), supplemented by pictures of French-specific dishes taken following the protocol used for the PANCAKE picture book. It also included drawings of full-scale shapes of slices of bread, cakes, pies or pizzas commonly found in France. The perception of the new food serving pictures and drawings( Reference Nelson and Haraldsdottir 23 ) was validated on 509 individuals following the protocol used for the validation of the PANCAKE pictures( Reference Trolle, Vandevijvere and Ruprich 21 ) (C Dubuisson, C Moquet & P Drouillet-Pinard, unpublished results).
Description of the facets used in the INCA3 survey to describe foods and beverages
INCA3, Third French Individual and National Food Consumption Survey 2014–2015.
The food consumption data collected on the three days were supplemented by a self-reported FFQ dealing with the consumption frequency of seventy-five food groups (including alcoholic beverages) over a reference period (one month for infants aged 0–15 months, three months for toddlers aged 16–24 months, six months for toddlers aged 25–35 months and twelve months for individuals aged 3–79 years). In addition, intake of food supplements was collected using a FAF questionnaire dealing with the five most frequently consumed food supplements over the past one to twelve months depending on the age of the participant as for the FFQ. Five products were sufficient to cover the whole consumption since only 0·8% of adults and 0·2% of children reported having consumed more than five products during the preceding year.
Sociodemographic background
Information on the household income, wealth and food sufficiency and security, and on the occupational and education levels of the selected person (or their caregivers for children aged 0–17 years) and of the head of the household (according to the National Institute of Statistics and Economic Studies’ definition( 24 )) was gathered during the home visit. The questions related to income, occupational and education levels were derived from the French census questionnaire( 25 ), while the questions on food security came from the US Household Food Security Survey Module six-item short form( 26 ). Additional data on geographical characteristics and household composition were available in the sampling frame or collected during the recruitment.
Physical activity and sedentary behaviour
The physical activity and sedentary behaviour of the participant were collected using the Recent Physical Activity Questionnaire (RPAQ) for adults aged 18–79 years( Reference Golubic, May and Benjaminsen Borch 27 ), the Youth Risk Behaviour Survey (YRBS) questionnaire for children aged 11–17 years( Reference Troped, Wiecha and Fragala 28 ) and a French-specific questionnaire for children aged 3–10 years, developed by Santé Publique France and compared with an accelerometer in children aged 6–10 years old (Santé Publique France, unpublished results). No information was collected for infants and toddlers.
Anthropometric characteristics and health status
Body weight and height of the individual were measured during the home visit. For participants aged 2–79 years, weight was measured in light clothes and without shoes to the nearest 0·1 kg using an electronic scale (Beurer GS 320; max. 180 kg). Height was measured to the nearest centimetre, in a standing position without shoes, with a tape measure and a set square. For children aged 0–24 months, weight was calculated by the difference between the weight of the caregiver holding the child and the weight of the caregiver alone, and height was measured in a lying position. In case of refusal, the participant was asked to declare his/her body weight and height.
A few questions on health status of the selected person were included in the SA questionnaire to identify special diets, like food allergy or vegetarianism, as well as pregnant and breast-feeding women. Participants were also asked about their smoking habits.
Eating habits
Data on eating habits were collected using the SA questionnaire divided into two sections (individual and household). The individual section was completed by the selected person (or his/her representative for children aged 0–10 years) and dealt with habits regarding eating occasions and locations, consumption of foods grown or bred by the household (e.g. vegetable garden, chicken breeding), of foods collected in the wild (e.g. hunting, fishing, gathering), of raw foods of animal origin and of organic foods. Individual habits regarding food-related information sources and the reading of food labels were also collected. The household section was completed by the person(s) responsible for food purchases and meal preparation in the household and gathered information on habits related to food preparation and storage, treatment of drinking-water, as well as selection criteria and usual places of food purchase. Specific questions on breast-feeding, feeding-bottle preparation and storage, and diet diversification were also asked for children aged 0 to 35 months old.
Finally, the temperature in the refrigerator was measured using a probe thermometer and use-by dates for pre-packaged fresh produces stored in the refrigerator were read during the home visit.
Study design
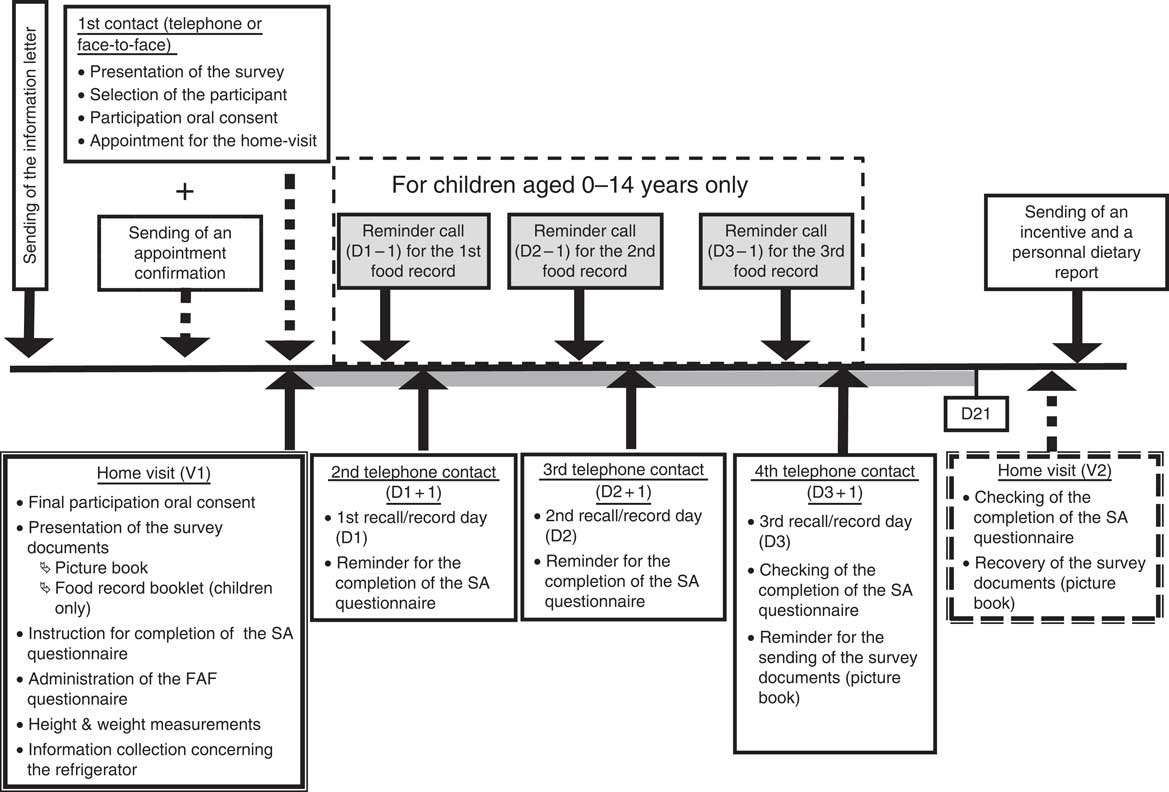
All seasons and days of the week were covered to account for variations in the seasonal and day-to-day food intake. After the recruitment phase, data collection started with a home visit (Fig. 2). During this home visit, the FAF questionnaire was administered, the SA questionnaire and the tools required for the dietary interviews (picture book, food record for children) were delivered and the participant was given explanations on how to use or complete them. Finally, the anthropometric measurements and the readings from the household’s refrigerator were taken. After the home visit, participants were telephoned three times to perform the dietary interviews. The three days of 24 h record for the 0- to 14-year-old children were planned during the home visit and a reminder was issued the day before by a telephone call, whereas no appointments were made for the 24 h recalls for the 15- to 79-year-old individuals. For the latter, the capture of two weekdays and one weekend day was controlled by a computerized algorithm. If the participants did not have the picture book at the moment of the call, an appointment was made later in the day to perform the interview. At the end of the third dietary interview, the completion of the SA questionnaire and the FFQ was checked.
Protocol of the INCA3 survey for the participants (INCA3, Third French Individual and National Food Consumption Survey 2014–2015; SA, self-administered; FAF, administered face-to-face; V1/V2, visit 1/visit 2; D1/D2/D3/D21, day 1/day 2/day 3/day 21)
Interviewers
The data collection was subcontracted to a professional polling organization. Its professional interviewers were chosen for the INCA3 survey based on their experience on studies with a similar protocol or topic. Although they had no specific background in nutrition, they were used to recruiting participants and to collecting information by computerized questionnaires. Two kinds of interviewers were involved: 148 ‘home-visit’ interviewers in charge of the home visits and forty-seven ‘telephone’ interviewers (working on-site at the polling organization) in charge of the administration of the dietary interview with the GloboDiet software. They were also all in charge of recruitment of participants.
To ensure data quality and reliability, all interviewers were trained. The home-visit interviewers followed a one-day training session in the recruitment of participants, the survey protocol, the administration of the FAF questionnaire, the weight and height measurements, the refrigerator measurements and the explanation of the survey tools. The interviewers were given detailed written instructions and lists of arguments to help persuade individuals participate in the survey. The telephone interviewers followed a half-day training session on the recruitment of participants and a three-day session on the collection of dietary information using the GloboDiet software. The latter was specifically adapted to their background. It focused on the information to collect and mixed half theoretical explanations and half practical exercises following step by step the GloboDiet questionnaire. By the end of the training session, the interviewers were able to perform a complete interview. For the fieldwork, a questionnaire was established for the ‘quick list’ step of the interview (quick listing of all foods and beverages consumed over the ten different occasions). This questionnaire included useful reminders on consumption occasions or foods usually forgotten when reporting dietary intake and the interviewers were asked to strictly follow it. Questions for the description and quantification steps were also labelled and included in the GloboDiet software and provided useful reminders of the information to collect. After the training session, dietary interviews were monitored to check that they were being administered correctly. Interviewers were notified of any improvable points. During all the fieldwork, two dietitians were also available on-site throughout the interview sessions to help the interviewers in coding good information when necessary.
Throughout the fieldwork period, both the home-visit and telephone interviewers’ work was followed up daily regarding several performance indicators: recruitment rate, interview duration and dietary information accuracy. When problems were raised, corrective actions were implemented. However, because no improvement was noticed, eight ‘home-visit’ interviewers and two ‘telephone’ interviewers were excluded.
Data analysis
Participation rates
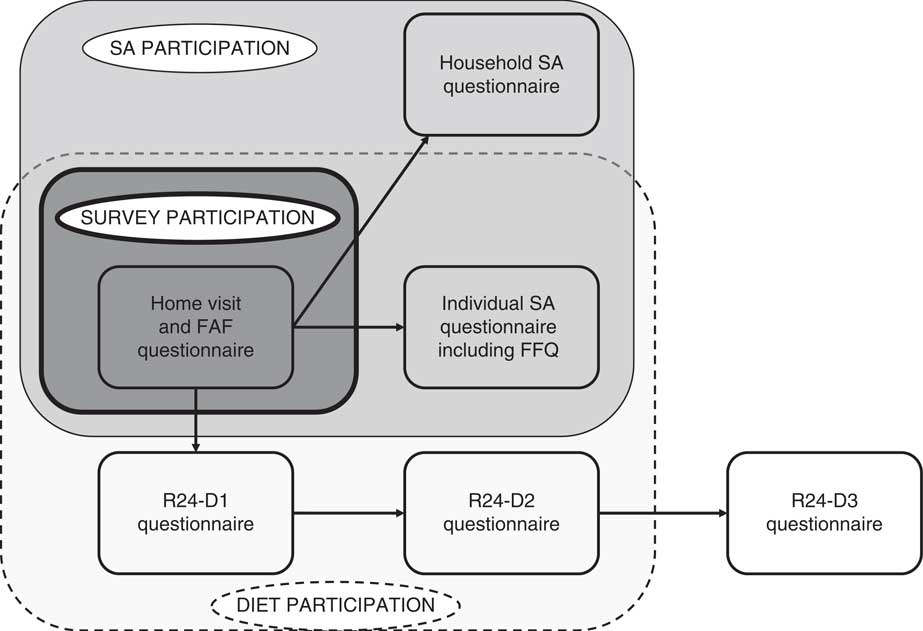
Three levels of participation were defined to keep the largest number of participants in each part of the survey: (i) SURVEY participation corresponded to participation in the home visit only; (ii) SA participation corresponded to participation in the home visit and completion of both individual (including FFQ) and household sections of the self-administered questionnaire; and (iii) DIET participation corresponded to participation in the home visit, completion of the individual section (including FFQ) of the SA questionnaire and completion of at least two dietary interviews (Fig. 3). Household (HH) participation was also defined for the household contact level: it was validated by the selection of the individual to be interviewed.
Three different levels of participation defined in the INCA3 study (INCA3, Third French Individual and National Food Consumption Survey 2014–2015; SA, self-administered; FAF, administered face-to-face; R24; 24 h recall/record; D1/D2/D3, day 1/day 2/day 3)
The participation rates were calculated following the EFSA recommendations, based on the definitions provided by the European Health Examination Survey( Reference Tolonen 29 ):
1. Participation rate 1 (PR1)=(number of participants)/(number of eligible AND unresolved individuals/households);
2. Participation rate 2 (PR2)=(number of participants)/(number of eligible individuals/households).
Weighting
The individual weighting factors were estimated to ensure the national representativeness of the final samples. The method consisted of a non-response correction followed by a margin calibration applied successively at the household and individual levels. The non-response correction intended to reduce the sampling bias by correcting the initial probability of inclusion( Reference Caron 30 ). The probability of inclusion was modelled by a logistic regression which included explicative variables available in the sample frame (region of residence, size of urban area, size of housing, number of rooms, professional category of the head of household, size of household and occupancy status of household) or coming from the study field (method of recruitment). The margin calibration aims at reducing the sampling variance by calibrating the distribution of several characteristics observed in the survey sample on national reference data( Reference Deville and Särndal 31 ). The calibration was applied on region of residence, size of urban area, professional category of the head of household and size of household, gender, age, education level and season of interview. The reference margins were derived from the 2014 national continuous employment survey except for season (25% per season). To correct the over-representation of weekend days, an additional weighting factor was applied for the DIET sample, accounting for the type of day. Weighting factors were calculated for each level of participation (SURVEY, SA, DIET and HH). Thanks to this process, the final samples were representative for the variables used for the calibration at the national level. Both final individual weighting factors and the sampling design effect were taken into account for appropriate individual data analysis.
Assessment of food and nutritional intakes
As required by EFSA for harmonization purposes, all foods and beverages recorded in the survey, as well as their descriptors, were recoded according to the EFSA food classification system (FoodEx2)( 32 ).
In addition, to assess nutrient intakes, all the dietary data were linked to a survey-specific food composition table derived from the database on the nutritional composition of foods from the French Information Centre on Food Quality (CIQUAL) updated in 2016( 33 ). Each CIQUAL food item was associated with a composition in fifty-four nutrients including energy, macronutrients, eleven minerals, thirteen vitamins and fourteen fatty acids.
Assessment of physical activity levels
The physical activity level (PAL) was assessed differently by age class, taking the WHO recommendations into account. For the 3- to 10-year-old children, frequencies of playing outdoors, physical education at school and physical education outside school and means of transport to go to school were used to classify them into low PAL (2 d/week or less with physical activity (PA) and passive transport), high PAL (5 d/week or more with PA and active transport) or moderate PAL (other situations). For the 11- to 17-year-old adolescents, low PAL was attributed to those practising moderate or intense PA fewer than 5 times/week and intense PA fewer than 3 times/week; high PAL to those practising moderate or intense PA daily or intense PA at least 5 times/week; and moderate PAL to the other situations. For the 18- to 79-year-old adults, the relevant RPAQ activities were classified according to their metabolic equivalents of task (MET) into moderate (3 to 5·99 MET) or intense (6 or more MET) PA. Then, high PAL was defined as at least 3 d with intense PA reaching 1500 MET-min/week, or at least moderate or intense PA daily reaching 3000 MET-min/week. Moderate PAL was defined as at least 3 d/week with intense PA during an average 25 min/d, or at least 5 d/week with intense PA during an average 30 min/d, or at least 5 d with moderate or intense PA reaching 600 MET-min/week. Low PAL corresponded to other situations.
Dietary data quality indicator
The main features of the dietary interviews were assessed using two indicators published by the International Agency for Research on Cancer( 10 ) (interview duration and number of foods per interview), completed by the mean energy intake per interview. At the individual level, the dietary data quality was assessed through three indicators calculated by age–gender subgroup: (i) mean energy intake (EI); (ii) mean reported EI:BMR; and (iii) prevalence of energy misreporters. BMR was estimated from the Henry equations taking into account age, gender, height and weight information( Reference Henry 34 ). Misreporters were identified at the individual level using the method recommended by EFSA( 35 ) consisting of the Goldberg cut-off method( Reference Goldberg, Black and Jebb 36 ), updated by Black( Reference Black, Goldberg and Jebb 37 ). It is based on the comparison of EI:BMR according to cut-off values depending on the individual’s PAL (low, moderate or high as defined above). Dietary energy misreporting was estimated for the DIET participant samples, after exclusion of the children under 1 year old and breast-fed children (n 62).
All analyses were computed using the statistical software package on STATA/MP version 14.2. The svyset function was used to account for the complex INCA3 sampling frame design. A P value of 0·05 was used as the threshold of significance.
Results
Participation rates
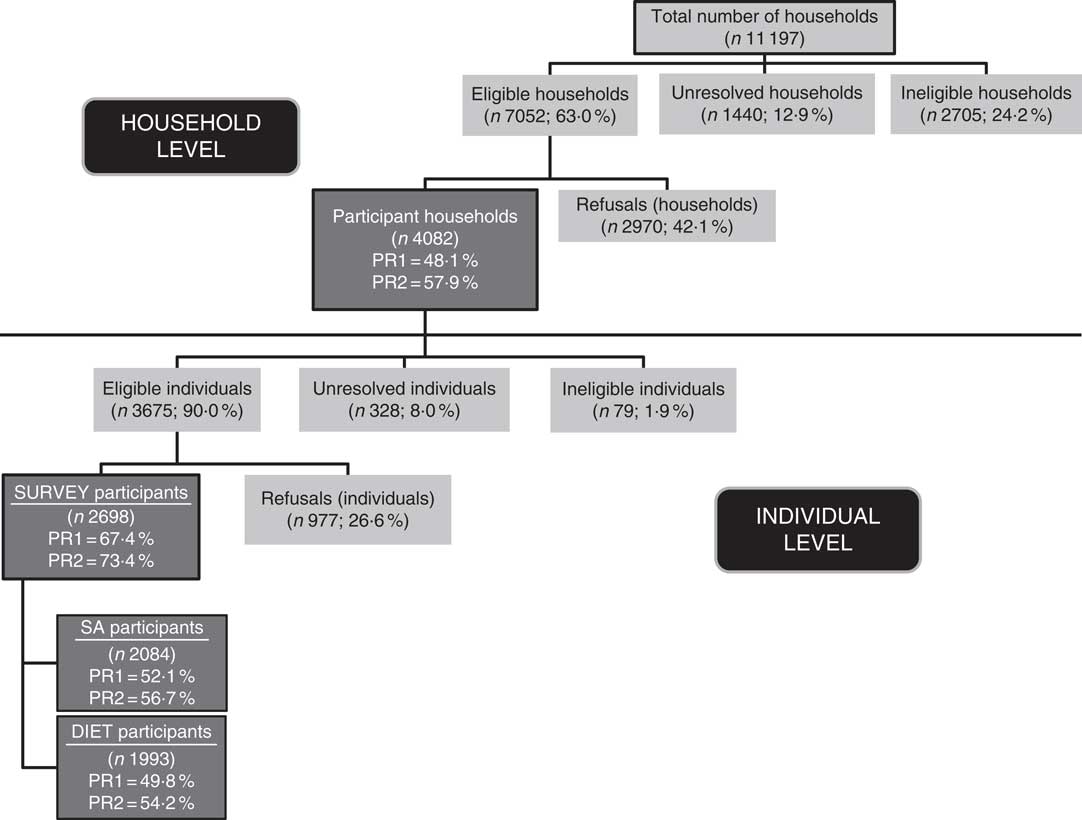
At the household level, the HH participation rates PR1 and PR2 were respectively 48·1 and 57·9% for the child sample (Fig. 4) and 41·4 and 52·1% for the adult sample (Fig. 5). The child sample showed a greater rate of ineligible households (24·2 v. 14·4% for adult sample) but a lower rate of unresolved households (12·9 v. 17·6%). Among the eligible and contacted households, 42·1% for the child sample and 47·9% for the adult sample refused to list the household’s eligible individuals preventing a participant from being selected.
At the individual level, a total of 5855 individuals (2698 children and 3157 adults) completed the home visit (SURVEY participation), 4372 (2084 children and 2288 adults) also completed the SA questionnaire (SA participation) and 4114 (1993 children and 2121 adults) validated the third level of participation (DIET) reaching the expected sample size (Figs 4 and 5). However, almost one-quarter of children and one-third of adults dropped out during the protocol. Finally, the DIET participation rates PR1 and PR2 were respectively 49·8 and 54·2% among children and 41·5 and 44·9% among adults. Among the eligible and contacted individuals, 26·6% for the child sample and 33·2% for the adult sample refused to participate.
Description of the participation for the child sample in the INCA3 study (INCA3, Third French Individual and National Food Consumption Survey 2014–2015; SA, self-administered; PR1 (participation rate 1)=number of participants/(number of eligible AND unresolved individuals or households); PR2 (participation rate 2)=number of participants/number of eligible individuals or households)
Description of the participation for the adult sample in the INCA3 study (INCA3, Third French Individual and National Food Consumption Survey 2014–2015; SA, self-administered; PR1 (participation rate 1)=number of participants/(number of eligible AND unresolved individuals or households); PR2 (participation rate 2)=number of participants/number of eligible individuals or households)

Overall, the main reasons for ineligibility were the quality of the addresses themselves (destroyed/imprecise or uninhabited/secondary residence; 7 to 8% of the household sampling frame), age range non-compliance (1·5% of the household sampling frame for adults and 12·4% for children), non-French speaking (2%) or long-term unavailability of the selected person (1 to 1·4%). The main reasons for refusal were ‘not interested’ (49% at the household level and 34% at the individual level) and ‘no time or not available’ (respectively 16 and 33%), as well as the refusal of the home visit (12%) at the individual level.
Description of the participants
The unweighted breakdown of the SURVEY, SA and DIET participants according to age, gender, education level and size of the household compared with national reference data is presented in Table 3 for the child sample and in Table 4 for the adult sample.
Raw breakdown (%) of the SURVEY, SA and DIET participants in the INCA3 survey for the child sample according to sociodemographic characteristics, compared with national population statistics

SA, self-administered; INCA3, Third French Individual and National Food Consumption Survey 2014–2015.
† National continuous employment survey (EEC 2014) carried out by the National Institute of Statistics and Economic Studies.
Raw breakdown (%) of the SURVEY, SA and DIET participants in the INCA3 survey for the adult sample according to sociodemographic characteristics, compared with national population statistics

SA, self-administered; INCA3, Third French Individual and National Food Consumption Survey 2014–2015.
† National continuous employment survey (EEC 2014) carried out by the National Institute of Statistics and Economic Studies.
Child sample
For the child sample, the gender breakdown of the final survey sample was similar to the national reference data. But this was not the case for the other characteristics. Children aged 0–3 years were under-represented and adolescents aged 11–17 years were over-represented. This age distribution distortion remained the same irrespective of the participation level (SURVEY, SA or DIET). The children whose household head held at least the French high-school leaving certificate (Baccalauréat) were over-represented, this trend becoming more marked with the participation level. Inversely, children whose household head was unqualified were more and more under-represented according the participation level. Finally, children from large families (five persons or more) were constantly under-represented irrespective of the level of participation, as opposed to the children from families of three or four persons.
Adult sample
For the adult sample, differences with regard to the national population were observed for each characteristic and mostly increased with the participation level. Regardless of the participation level, women were over-represented. Young adults (18–44 years old) were under-represented, mainly among the SA and DIET participants, whereas the elderly (65–79 years old) and to a lesser extent the middle-aged adults were over-represented in the same categories of participants. As observed for the child sample, individuals with at least the French high-school leaving certificate were over-represented and unqualified individuals under-represented. Finally, a large over-representation of single adults and a slight over-representation of adults from two-person households were constantly observed irrespective of the participation level, when compared with other adults.
The distortions observed in the final samples proved the need for the weighting process to reduce sampling bias. The weighted breakdown was thus in line with the national breakdown.
Dietary data quality
The main characteristics of the 12 210 dietary interviews are presented in the Table 5. Only few deviations from the protocol were observed. Almost 97% of the participants completed the three dietary telephone interviews and about 99% of the children and 97% of the adults respected the two weekdays and one weekend day repartition. It took on average 22 d and 36 d to collect the three dietary interviews in the child and adult samples, respectively, which was more than expected for the adult sample. The dietary interviews were well distributed over the seven days of the week in the child sample (between 12 and 17% according to the day) but more fluctuant in the adult sample (only 7·7% for Fridays and 20·0% for Sundays). Adults reported on average more foods by interview (twenty-four foods) than children (eighteen foods), corresponding to a mean energy intake of respectively 8648 kJ (2067 kcal) and 7376 kJ (1763 kcal) per interview. Only in the child sample was a small decrease in mean energy intake observed between the first and the third interview (–335 kJ (−80 kcal); P<0·01).
Description of the dietary interviews in the INCA3 survey according to the sample (row data)
INCA3, Third French Individual and National Food Consumption Survey 2014–2015; R24, 24 h recall/record.
† To convert to kJ, multiply kcal values by 4·184.
Regarding the DIET participants, the mean individual energy intake was assessed at 7222 kJ/d (1726 kcal/d) for children (Table 6) and 8795 kJ/d (2102 kcal/d) for adults (Table 7). It was associated with age and gender in both samples: energy intake being lower in women, young children and elderly. Mean EI:BMR was 1·56 for children and 1·40 for adults and was linked to age in children and to gender in adults (up to 65 years old). Finally, 13·9% of the children and 17·8% of the adults were identified as under-reporters, while respectively 2·2 and 2·6% were identified as over-reporters. The proportion of under-reporters was associated with age in children (regardless of gender), increasing from 1·5% for children aged 4–6 years to 40·4% for adolescents aged 15–17 years. Under-reporting was not associated with age or gender in adults. Among the age–gender subgroups, one (15- to 17-year-old girls) appeared to be particularly biased for reported energy intake (with mean EI:BMR=1·13 and rate of under-reporters=47%).
Energy intake (mean and sd), EI:BMR (mean and 95 % CI) and prevalence of under-reporters (% and 95 % CI) among 1- to 17-year-old children (n 1934) in the INCA3 survey according to age and gender
EI, energy intake; INCA3, Third French Individual and National Food Consumption Survey 2014–2015.
† Test by gender: *P<0·05, **P<0·01, ***P<0·001.
‡ To convert to kJ, multiply kcal values by 4·184.
§ Test by age: *P<0·05, **P<0·01, ***P<0·001.
Energy intake (mean and SD), EI:BMR (mean and 95% CI) and prevalence of under-reporters (% and 95% CI) among 18- to 79-year-old adults (n 2121) in the INCA3 survey according to age and gender
EI, energy intake; INCA3, Third French Individual and National Food Consumption Survey 2014–2015.
† Test by gender: *P<0·05, **P<0·01, ***P<0·001.
‡ To convert to kJ, multiply kcal values by 4·184.
§ Test by age: *P<0·05, **P<0·01, ***P<0·001.
Discussion
The INCA3 survey provides an update of the French database on dietary and nutrient intakes, eating habits regarding food safety issues, and physical activity and sedentary behaviour based on a representative sample of individuals aged 0–79 years.
Participation rates
At the individual level, the SURVEY participation rate PR1 was 67% for children and 62% for adults. This rate decreased to 50% for children and 42% for adults for the DIET level. In the previous INCA2 survey, the participation rates were 75% for children and 70% for adults for the SURVEY level and respectively 70 and 64% for the DIET level. Thus, the participation declined by 8 points for the SURVEY level and by almost 20 points for the DIET level between the two surveys. The trend in decrease for the SURVEY participation was similar to those observed in health surveys in Europe (estimated at 1 to 1·5 points per year) and may be linked to an overall tendency for lower participation of the European population in surveys( Reference Mindell, Giampaoli and Goesswald 38 , Reference Tolonen, Helakorpi and Talala 39 ). However, the decrease was much more marked for the DIET level, raising the question of the impact of the new protocol on response rate. Indeed, the four contacts necessary to complete the whole protocol for the INCA3 survey left more opportunities of dropping out (about −20 points between SURVEY and DIET participation rates) than the two home visits required in the INCA2 survey (−6 points). A negative impact of the multiple-contacts protocol on participation rates has already been observed in health surveys, with a significant decrease of 40 points from the beginning to the end of the protocol( Reference Mindell, Giampaoli and Goesswald 38 ). In the INCA3 survey, the dropouts were mainly divided into refusals (51% in adults and 43% in children) and loss to follow-up (33% in adults and 25% in children). The completion of dietary interviews without appointment for adults may explain the higher rate of loss to follow-up. They were more difficult to join, as illustrated by the greater number of days needed to perform the three dietary interviews.
The participation rate remains a crucial issue, since high participation rates limit the risk of sampling bias in the results and conclusions derived from the survey( Reference Volken 40 ). Therefore, many measures were taken in the INCA3 survey to reach as high a participation rate as possible. First, awareness of the survey was boosted locally and nationally by a media campaign and an information letter sent to the town hall of each geographical primary sampling unit. Second, the number of unresolved or dropout cases was limited by switching from telephone to FAF recruitment when the household/individual remained non-contactable and by reminder emails sent to the participants after a period without any contact. These emails proved to be very efficient for increasing the participation rate, as already observed( Reference Christensen, Ekholm and Glumer 41 ). Despite all these actions, the rate of DIET participation remained below the initial expectations (60%) and distortions regarding sociodemographic characteristics compared with the national population reference data were observed. The non-response determinants in the INCA3 survey were in accordance with those already known for dietary or health surveys: gender (in adults), age, size of household and socio-economic characteristics( Reference Volken 40 – Reference Martikainen, Laaksonen and Piha 43 ). Studies on health surveys have underlined that the non-respondents usually behave differently, and mainly in an unhealthier way, from the respondents, leading to underestimating the rate of unhealthy behaviours in the population( Reference Volken 40 , Reference Christensen, Ekholm and Glumer 41 , Reference Tolonen, Dobson and Kulathinal 44 , Reference Tolonen, Laatikainen and Helakorpi 45 ). For the INCA3 survey, no information was available to assess whether the non-respondents eat differently from the respondents, since no information on their dietary habits was collected. On the contrary, we can assume that the eligibility criteria for the survey did not impact the reliability of the survey to assess dietary exposure for the national population aged 0–79 years. Indeed, the high rate of ineligibility was mainly explained by the quality of the addresses from the sampling frame rather than by a strong selection bias in the population.
Dietary data quality
The quality of the dietary data collected in the INCA3 survey was assessed through several indicators.
Regarding the characteristics of the dietary interviews, the average number of foods reported per day by adults in our study (twenty-four) was in the high range of those reported in PILOT-PANEU (from sixteen in Bulgaria to twenty-five in Finland)( 10 ). Regarding a global indicator like energy intake misreporting, the proportion of over-reporters was negligible (fewer than 100 individuals among the 4114 DIET participants) while under-reporting was more prevalent but remained under 20% in both the child (14%) and adult (18%) samples. In children, an inverse association with age was observed with a maximum of 40% of under-reporters among adolescents aged 15–17 years which is consistent with findings from other studies( Reference Forrestal 46 ). The high rate of under-reporter adolescents should be taken into account for food-related risk assessment, by comparing the dietary exposure assessed while keeping or excluding the under-reporters before deriving conclusions. More generally, the percentages of under-reporters identified in the INCA3 survey are in the lower range of what is usually observed for dietary studies, proving the quality of the collected dietary data. Indeed, the percentage of under-reporters in studies using the 24 h recall method ranged from 22 to 31% in adults( Reference Poslusna, Ruprich and de Vries 47 ) and from 16 to 57% among children aged 8–18 years( Reference Forrestal 46 ). In particular, using the same method for dietary information collection and identification of misreporters, under-reporters in PILOT-PANEU accounted for 31% in 11- to 14-year-old children, 40% in 15- to 17-year-old adolescents and 31% in 18- to 69-year-old adults( Reference Ambrus, Horvath and Farkas 9 ) against respectively 23, 40 and 18% (for 18- to 79-year-old adults) in the INCA3 survey. Similarly, the under-reporters were higher in the national Belgian dietary survey carried out with GloboDiet in the same period (2014): 5% in 3- to 9-year-old children, 36% in 10- to 17-year-old adolescents and 31% in 18- to 64-year-old adults( Reference De Ridder 48 ). This demonstrates that the administration of GloboDiet dietary interviews by professional interviewers rather than dietitians ensured the collection of reliable dietary data. Nevertheless, it required some adaptations of the GloboDiet protocol. Regarding the software updating, the terms used for the food identification and description were labelled to be as understandable as possible for both interviewers and interviewees and common brand names were added as synonyms in the food list. Regarding the training, its content and organization were specially designed to meet the interviewers’ skills and help them learn how to use GloboDiet and collect the right information. The additional questionnaires developed for the quick list, the description and quantification steps were very useful for interviewers with no background in nutrition and ensured standardization of the dietary data collected between interviewers and interviewees.
Even though EFSA recommends at least one face-to-face interview, we chose to perform all the INCA3 dietary interviews by telephone in order to supervise the dietary interviewers on-site and limit the interviewer training cost. Our choice should not have impacted the data quality since telephone interviews proved to be as efficient as face-to-face interviews for collecting dietary data with GloboDiet( Reference Brustad, Skeie and Braaten 49 ).
Strengths and limitations of the harmonization process for the INCA3 survey
The INCA3 survey was designed to comply as much as possible with the EFSA Guidance. Compared with the previous INCA surveys, the major changes concerned the inclusion of infants and toddlers, the change of the dietary data collection method (from a self-administered food record to telephone-administered 24 h recalls/records) and the interview protocol.
Moving from one methodology to another had a cost. First, the new methodology was more time-consuming, particularly regarding the use of the GloboDiet software. Indeed, it took time to revise seventy unrelated .txt files of the software, considering that nearly all of them interacted with each other, but also to check and clean the collected data (with regard to their complexity) and to code them according to the FoodEx2 classification. Afterwards, GloboDiet was considered user-friendly by our interviewers and proved to be appropriate to collect very detailed dietary data in a nutrient intake or risk assessment perspective and in a harmonized way. Second, the new methodology increased the fieldwork costs. Actually, the costs of the interviewers’ training and worktime were higher with the EFSA methodology since the dietary recalls/records were administered whereas the previous INCA food record was self-administered. Third, as previously described, the new protocol doubled the number of contacts required to complete the whole protocol which may have had a negative impact on response rate. This led to extending the fieldwork duration (from 12 to 19 months) in order to recruit the expected number of individuals. Finally, from a national public health point of view, the dietary and nutrient intakes collected in the INCA3 survey are no longer comparable with the results of the previous INCA surveys. Thus, it is not possible to monitor the changes in the dietary and nutrient intakes of the French population using the three INCA surveys.
On the other hand, by taking part in the harmonization process, the INCA3 survey provides dietary data for the French population that are standardized and more easily comparable with data from the other European countries involved in the EU Menu Project. This will allow food safety and nutrient intakes in France to be compared with those of other European countries and possibly identify specific risks for the French population. Moreover, the very detailed description of the dietary intake required by EFSA will enable more refined food-related health and nutritional risk assessments at the national level too. The methodological changes also seemed to improve the collection of the dietary intake. The rate of under-reporters was 3 points lower and total energy intake from out-of-home dietary intake 6 points higher (up from 3 to 9%) in the INCA3 survey than in the INCA2 survey. These improvements can be partly explained by the standardized questionnaires implemented for the quick list, description and quantification steps of the GloboDiet interview. The administration of standardized questionnaires also helped to collect data with a more homogeneous quality between participants and enabled to better capture the precise description of the food eaten than the previous self-administered food record. In addition, the limitation of the number of surveyed days (three instead of seven) avoided the fatigue effect observed with the 7 d food record( Reference Dufour, Dubuisson and Volatier 50 ). No difference was shown in the energy intake between the interviews according to their order.
Conclusions
The French national dietary survey (INCA3) updated the national data on dietary intake of the French population in a harmonized way with European practice. This harmonization process implied major adaptations of the previous methodology of the INCA survey according to the EFSA Guidance, particularly with regard to collecting the dietary information. Many challenges during the survey preparation or the fieldwork were faced and overcome successfully.
The new survey tools proved to be efficient for collecting very detailed and reliable data on dietary intake that will be very useful for food-hazard and nutrient risk assessment as well as for underpinning nutrition and food policies, at both national and European levels.
Acknowledgements
Acknowledgements: The authors would like to thank the GfK team (interviewers, dietitians and supervisors) for the collection of the data and all families for their cooperation. They also want to thank the scientific experts involved in the survey scientific committee and working group for their help for the design of the survey. Financial support: The INCA3 survey was supported by EFSA (contract number CT/EFSA/DCM/2011/02/02) and Santé Publique France (contract number G639A); by grants from the Ministries for Health and Agriculture; and by ANSES. Conflict of interest: The authors declare that there are no conflicts of interest. Authorship: C.D. designed the study, analysed and interpreted the data, and wrote the manuscript. A.D. contributed to the study design, data collection and analysis, and assisted in writing the paper. S.C., P.D.-P., S.H. and J.-L.V. contributed to the study design, data collection and analyses. All the authors reviewed the manuscript. Ethics of human subject participation: This study was conducted according to the guidelines laid down in the Declaration of Helsinki and all procedures involving human subjects were approved by the Comité Consultatif sur le Traitement de l’Information en matière de Recherche dans le domaine de la Santé (CCTIRS; Advisory Committee on Information Processing in Health Research). Verbal informed consent was obtained from all subjects. Verbal consent was witnessed and formally recorded.


