


1. Introduction
Designing without sketching is like trying to run with your arms tied behind your back – yes, you can do it, but it is not going to help you get to the finish line. Freehand sketching is an integral part of the design process (Ferguson Reference Ferguson1994; Cross Reference Cross2001; Dym et al. Reference Dym, Agogino, Eris, Frey and Leifer2005). Sketching reduces the cognitive workload for the designer (Bilda & Gero Reference Bilda and Gero2005), sketching is essential for communication (Goldschmidt Reference Goldschmidt2007) and sketching provides designers with a fast visual representation to guide design decisions (Suwa & Tversky Reference Suwa and Tversky1997). Freehand sketching is a powerful tool during the conceptual design phase, and beyond that, it needs to be leveraged more effectively (Ullman, Wood, & Craig Reference Ullman, Wood and Craig1990).
Sketching has been shown to positively correlate with design outcomes (Song & Agogino Reference Song and Agogino2004; Yang Reference Yang2009) demonstrating that more frequent sketching during design promotes good designs. The decisions we make earlier in the design process have the greatest impact on design outcomes (Dieter & Schmidt Reference Dieter and Schmidt2009; Tan, Otto, & Wood Reference Tan, Otto and Wood2017). Sketching enables designers to reason with their designs and learn from them (Goldschmidt Reference Goldschmidt1991). A fast and fluid visual representation allows real-time evaluation and improvement of design ideas, so it makes sense why the design process is benefitted by frequent sketching. Protocol studies have shown that designers do not just use sketches as external memory, but they leverage sketches as visual settings in which to solve design problems (Suwa, Gero & Purcell Reference Suwa, Gero and Purcell1998). However, it seems, based on prior literature and this study that engineering students may not be receiving support for their sketching skills, and they are not using sketching effectively (Westmoreland, Ruocco, & Schmidt Reference Westmoreland, Ruocco and Schmidt2011).
Studies of engineering design projects looked at how students are using sketching in capstone design reports (Westmoreland et al. Reference Westmoreland, Ruocco and Schmidt2011). Students documented their entire process in their capstone design reports. In the conceptual design chapter of their reports, they were asked to provide at least five sketches of contemplated concepts for their project. The sketches were not evaluated for quality, but the authors hypothesized that the students would include the highest quality sketches for their reports. They found that graduating engineering students are largely sketching at low levels of detail and exhibiting low sketching skills. Engineering students often receive insufficient sketching education and this lack of training results in engineers not using sketching effectively in the design process. Engineers’ lack of understanding of the importance of sketching (Schmidt, Hernandez, & Ruocco Reference Schmidt, Hernandez and Ruocco2012) and lack of sketching ability could, therefore, have negative impacts on their design outcomes or on the contribution of an individual designer (Kwon & Kudrowitz Reference Kwon and Kudrowitz2019).
Therefore, understanding catalysts and inhibitions around engineering designer sketching behavior is of critical importance. Unlocking this tool could have positive design outcomes for future projects. Researchers have tested some interventions to encourage sketching behavior with positive results. Students used sketching more effectively after being taught a brief lesson on the value of sketching (Ruocco, Westmoreland, & Schmidt Reference Ruocco, Westmoreland and Schmidt2009), when they were explicitly assigned to sketch (Schmidt et al. Reference Schmidt, Hernandez and Ruocco2012) and when given a two-lecture workshop on freehand sketching technique (Booth et al. Reference Booth, Taborda, Ramani and Reid2016). These studies hold promise that designers’ sketching behavior is easily influenceable. However, there is still more to be understood about what encourages designers to sketch during design.
The goal of the current paper is to further understand some of the implicit factors that make designers more or less inclined to implement sketching behavior in design. Understanding underlying factors associated with sketching behavior will provide insight into designers’ motivations for using specific design tools. This insight could then potentially be leveraged to further improve designers’ use of sketching. In this paper, we explore several factors potentially connected to a designer’s sketching behavior. Sketching behavior is measured through self-reported data on how frequently students used sketching during the design process and what tasks they used sketches to accomplish.
1.1. Background
Visual representation is absolutely essential for design. The need for visual representation for engineering is dichotomous – engineers have the need for both formal drafting skills as well as informal freehand sketching skills (Ullman et al. Reference Ullman, Wood and Craig1990). These informal freehand sketching skills are of critical importance in the conceptual stages of design as designers create, evaluate and refine ideas. Sketches serve as dynamic stimuli that can prompt designers to form new ideas in group idea generation (Shah et al. Reference Shah, Vargas‐Hernandez, Summers and Kulkarni2001). The messiness of sketches allows them to be misinterpreted, which can lead to unexpected design concepts. Sketching is often contrasted with Computer Aided Design (CAD), which is construed as overly rigid for early-stage design. However, a recent study showed that designers, when given the choice to use tools freely, will switch back and forth between CAD and sketching, leveraging each tool for its afforded usefulness (Shih, Sher, & Taylor Reference Shih, Sher and Taylor2017).
Sketching offloads the working memory of the designer, freeing them up to continue in the design process (Bilda & Gero Reference Bilda and Gero2005). The fast and fluid visual representation reduces the need to visualize every design decision mentally. These external visuals give designers a space to perceive the work they have done so far and make further design decisions and alterations (Suwa & Tversky Reference Suwa and Tversky1997, Suwa et al. Reference Suwa, Gero and Purcell1998). Sketching allows designers to test their solutions in real-time and identify any errors they have made (Schütze, Sachse, & Römer Reference Schütze, Sachse and Römer2003). Sketching also enables expert designers to identify restructuring design moves that are less intuitive more effectively (Verstijnen et al. Reference Verstijnen, Van Leeuwen, Goldschmidt, Hamel and Hennessey1998). Lastly, sketching supports these functions of developing ideas all the more by its inherent cognitive benefits: time effectiveness, requiring minimal cognitive resources, being tolerant of incompletion or inaccuracy and providing (unexpected) cues (Goldschmidt Reference Goldschmidt2014). Sketching is a powerful tool for design in many ways.
Given the clear benefits of sketching in the design process, it is not surprising that there is strong evidence that more frequent sketching in design correlates with positive design outcomes. Through studies of design logbooks, several studies have shown a relationship between the number of sketches and project outcomes, although with slight differences between the findings. Song and Agogino (Reference Song and Agogino2004) found a positive correlation between the number of sketches generated during the design process and design project ranking. They found that this correlation was strongest with sketches completed in the later part of the design process. Yang (Reference Yang2009) similarly found that the number of sketches correlated with final design grades. However, they only showed a relationship with dimensioned sketches completed earlier in the design process. Yang (Reference Yang2009) posited that dimensioned sketches earlier in the process were connected with prototyping early on, which helped designers make improvements more quickly. Lastly, this finding was corroborated by Das and Yang (Reference Das and Yang2022), who found that the number of sketches throughout a project course correlated positively with the score on the final project. Their study also looked at sketch quality, and they found that sketching frequency was correlated with sketch quality, but sketch quality was not correlated with design outcomes.
Few studies have examined the role that sketching skills play in design. The studies described above demonstrate the power that sketching can have in design, but it is still unknown what degree of sketching skills are needed to reap those benefits. There is some evidence that sketching skills correlate with using sketching more frequently during design. Yang and Cham (Reference Yang and Cham2007) measured sketch quality through two tasks: a drawing facility task that involved sketching a live model, and a novel visualization task that involved sketching a three-dimensional object from a verbal description. They found a positive correlation between sketching skills and frequent use of sketching. Das and Yang (Reference Das and Yang2022) measured sketch quality by evaluating conceptual design sketches from logbooks on metrics for line smoothness and proportion/accuracy. They found that sketching skills measured this way also correlated positively with the frequency of sketching during the design project. Sketching skills also play an important role in how designers perceive concepts. The sketch quality of an idea influences how designers perceive both the idea quality and creativity (Kudrowitz, Te, & Wallace Reference Kudrowitz, Te and Wallace2012; Kwon & Kudrowitz Reference Kwon and Kudrowitz2019). There is a positive correlation between the perceived goodness of a concept and the skill with which it was represented. This creates a potential bias in the design process. If the representation of an idea is better, then designers perceive that idea as favorable.
It is understandable that more work has not been done with sketching skills because there is very little consensus on how to evaluate sketching skills (Merzdorf et al. Reference Merzdorf, Jaison, Weaver, Zakharov, Linsey, Hammond and Douglas2023). Prior work on teaching freehand sketching in engineering courses demonstrated that five weeks of sketching instruction meaningfully improved students sketching skills, but three weeks of instruction had negligible impact on measured skill (Weaver et al. Reference Weaver, Ray, Hilton, Dorozhkin, Douglas, Hammond and Linsey2022). However, drawing self-efficacy improved in both instruction conditions showing that even a small amount of sketching instruction can boost confidence. Sketching instruction plays an important role in engineering education beyond just improving skills. Traditional engineering sketching exercises, including isometric drawing, have been shown to have a positive impact on spatial skills (Sorby Reference Sorby2009). Improving spatial skills benefits performance in other engineering courses and improves educational outcomes for female students in engineering (Sorby, Veurink, & Streiner Reference Sorby, Veurink and Streiner2018). Sketching instruction focused on freehand perspective sketching improves spatial skills equally well compared to traditional engineering sketching instruction focused on projection and mental rotation (Hilton et al. Reference Hilton, Linsey, Li and Hammond2018b). Freehand perspective sketching instruction also has the added benefit of equipping students with better skills for visual representation (Hilton et al. Reference Hilton, Linsey, Li and Hammond2018b).
1.2. Research questions and hypotheses
The overarching research question for this project is the following:
RQ: What factors influence sketching behavior in a design project course?
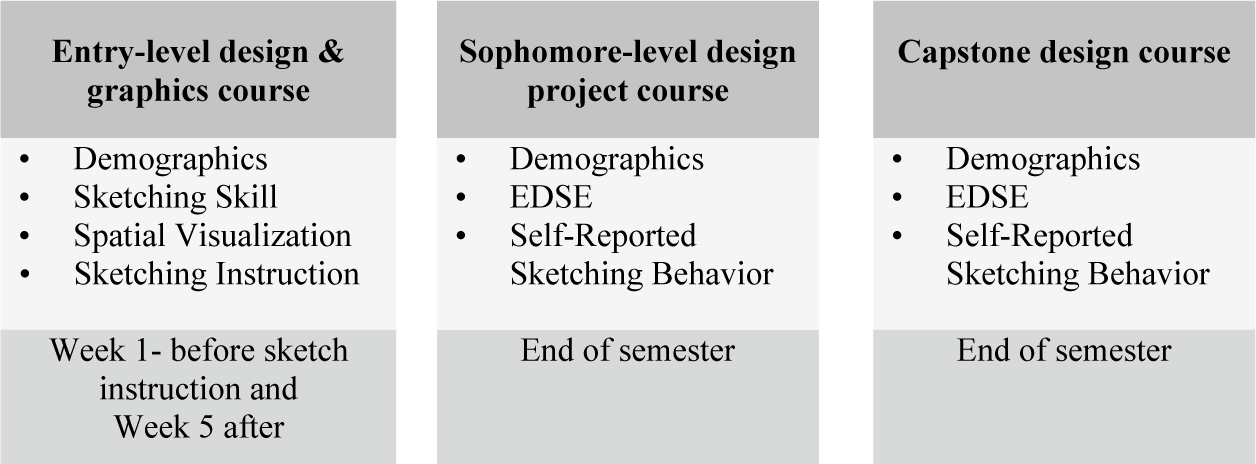
This research question is executed by evaluating engineering students on a variety of measures likely connected to sketching behavior including sketching skills, spatial visualization and design self-efficacy. Then students’ self-reported sketching behavior is surveyed in two design courses to understand how these factors influence their use of sketching. Students were evaluated in three different courses: (1) an entry-level design and graphics course, (2) a sophomore-level design project course, and (3) a senior-level capstone design course. In the entry-level course, students were evaluated on sketching skills and spatial visualization skills. In the entry-level course, students received one of two types of sketching instruction: traditional engineering sketching instruction or perspective sketching techniques derived from industrial design (examples in Figure 1). Traditional engineering sketching taught isometric and orthographic projects on grid paper as outlined in Lieu and Sorby (Reference Lieu and Sorby2016), and we use this to define traditional engineering sketching in this paper. In the sophomore and capstone design courses, students were surveyed after completing their projects on their Engineering Design Self-Efficacy (EDSE) (Carberry, Lee, & Ohland Reference Carberry, Lee and Ohland2010), demographics and how frequently they used sketching during the design process. Analyses between these factors will reveal relationships with sketching behavior. We are interested in reported sketching behavior and any differences in behavior between the two design courses. Primarily, we are interested in how the measured constructs predict sketching behavior.
Example of a traditional engineering sketch – isometric (top) and a perspective sketch (bottom).

The specific research questions addressed in this paper are the following:
RQ 1. To what extent does sketching behavior differ between a sophomore-level and capstone design course?
RQ 2. To what extent do the following constructs correlate with sketching behavior during a design project course?
2.1 Sketching Skills
2.2 Spatial Visualization Skills
2.3 Type of Sketching Instruction
2.4 Engineering Design Self-Efficacy
Each of the constructs measured is hypothesized to predict sketching behavior in engineering designers. Provided below is the current supporting evidence for examining each of the factors included in the study.
If engineers are more versed in sketching, then the cognitive workload associated with producing a sketch will be reduced and the skill may be more readily accessible as they are designing. Essentially, improving skill could reduce inhibition toward using sketching as a tool (Booth et al. Reference Booth, Taborda, Ramani and Reid2016). Through a study of engineering logbooks, researchers found that there was a positive correlation between sketching ability and frequency of sketching (Yang & Cham Reference Yang and Cham2007). The current study looks at sketching skills measured in an entry-level engineering graphics course and sketching frequency in future design courses. This relationship speaks to the power and the longevity of the relationship between sketching skills and sketching frequency. We hypothesize that differences in sketching ability will be maintained throughout the engineering degree. Sketching is not taught outside of the entry-level course, but students do have opportunities to leverage sketching on design projects throughout the curriculum. Therefore, we predict students’ sketching skills will influence their use of sketching on future projects.
H2.1: Engineering students’ sketching skills have a positive effect on frequency of sketching during a design project.
Spatial visualization skills in this study are evaluated using the Purdue Spatial Visualization Test (PSVT:R) (Yoon Reference Yoon2011) and the Mental Rotations Test (MRT) (Peters et al. Reference Peters, Laeng, Latham, Jackson, Zaiyouna and Richardson1995). Both tests evaluate the ability to mentally rotate images. Yang and Cham (Reference Yang and Cham2007) found a negative correlation between a mechanical recall task and students’ frequent use of sketching in design notebooks. They posited that this negative relationship could potentially be due to improved spatial skills exhibited in the mechanical recall task. If a designer can see more in their mind’s eye, then potentially they would not need to sketch as often. It has been shown that expert architects’ design quality is not significantly impacted by removing the use of sketching for short design tasks (Bilda, Gero, & Purcell Reference Bilda, Gero and Purcell2006). The current study employs commonly utilized tests of spatial skills to further shed light on the relationship between spatial visualization and sketching.
H2.2: Engineering students’ spatial visualization skills have a negative correlation with frequency of sketching during a design project.
Freehand sketching skills are only taught minimally in some engineering curriculums (Weaver et al. Reference Weaver, Ray, Hilton, Dorozhkin, Douglas, Hammond and Linsey2022). Some engineering programs have begun to incorporate new sketching techniques, such as perspective sketching, that emphasize freehand sketching abilities more than the traditional engineering sketching curriculum did (Weaver et al. Reference Weaver, Ray, Hilton, Dorozhkin, Douglas, Hammond and Linsey2022). These sketching techniques hold the promise of improving student sketching behavior during design by giving students stronger freehand sketching skills. The current study compares students who received two-point perspective sketching instruction and students who received traditional sketching instruction. Traditional engineering sketching instruction is focused on transformations between isometric and orthographic views and largely focuses more on visual understanding and precision than artistic visualization. Students are only asked to sketch representations in one specific angle (isometric) and there is no teaching of line quality or other visualization practices. Perspective sketching focuses more on developing freehand sketching abilities by having students represent objects from a variety of views and providing a framework to depict complex shapes. Perspective sketching instruction, rooted in industrial design, provides a stronger artistic background that teaches more elements of style such as line quality, lighting and shading (Hilton et al. Reference Hilton, Li, Newton, Alemdar, Pucha and Linsey2016a, Reference Hilton, Linsey, Li and Hammond2018b). We predict that the emphasis on freehand sketching abilities in the perspective instruction will increase the frequency of sketching in later design courses.
H2.3: Students who received two-point perspective sketching instruction sketch more frequently than students who received traditional engineering sketching instruction.
Designers’ self-efficacy plays an important role in their behavior. Carberry et al. (Reference Carberry, Lee and Ohland2010) conducted validation of a survey to evaluate EDSE. They showed that the survey instrument differentiated effectively between designer experience levels. EDSE has also been shown to correlate with other design-related activities, such as involvement in makerspaces (Hilton et al. Reference Hilton, Talley, Smith, Nagel and Linsey2020). How confident students are in the arena of design could predict how readily they will put pencil to paper during a design project.
H2.4: Engineering students’ engineering design self-efficacy has a positive effect on frequency of sketching during a design project.
These measures will shed light on why designers sketch during the design process. Understanding motivations and other underlying factors will improve our understanding of design behavior and will inform interventions to help designers sketch more frequently during the design process.
2. Methods
2.1. Research design
The goal of this study is to examine engineering students’ sketching skill development in their early coursework and track how that impacted behavior in future design project courses. Students were studied during the only early course where they were taught sketching skills and then surveyed in two later design project courses about their use of sketching during the design projects. Data for this study were collected from three courses: an entry-level design and graphics course, a sophomore-level design project course and a senior-level capstone design course. The aim of the research was to follow students as they progressed through the engineering curriculum. Therefore, data collection was conducted in each course for a number of semesters to maximize the number of students that would participate in all data collection points. Data were collected in the entry-level course in the Fall 2015 and Spring 2016 semesters. Data collection in the two design project courses was conducted alongside a separate project studying students’ use of makerspaces on academic campuses (Hilton et al. Reference Hilton, Talley, Smith, Nagel and Linsey2020). Data were collected in the sophomore-level design course in the Spring 2018 and Fall 2018 semesters and were not the same students in the entry-level course. The semesters of data collection for the sophomore-level design course did not correspond with the timing of the data collection in the entry-level course due to the difference in timing of the two separate research projects. Data were collected in the capstone design course in all of the semesters between the Fall 2017 and Fall 2019 semesters capturing many of the students from the entry-level course.
To evaluate the research questions there are three data sets involved. There is the longitudinal data between the entry-level course and the capstone course, where the same participants were measured during each course. The remaining two data sets are survey data in the sophomore-level and capstone design courses, where students were asked about EDSE, demographics and self-reported sketching behavior. These two data sets allow us to analyze the relationship between design self-efficacy and self-reported sketching behavior in both a sophomore-level and a capstone design course.
In the entry-level graphics course, students are taught sketching for the first third of the class (five weeks) and then CAD for the second two-thirds. During the course, students were tested on sketching skills and spatial skills. Students were evaluated on these measures before and after receiving sketching instruction to track their development. Pre-sketching instruction evaluations took place in the first week of classes, and post-sketching instruction evaluations took place in the fifth week of classes immediately after the sketching instruction concluded. Students were assigned to one of two conditions of sketching instruction: traditional engineering sketching instruction or perspective sketching instruction, which has a larger emphasis on freehand sketching abilities. Students were assigned to the sketching instruction based on which section of the course they signed up for and which professor was instructing that section. The researchers could not impose a random course assignment on students to respect students’ autonomy in choosing their own course schedule.
Data were collected in the sophomore-level and capstone design course through surveys on students’ use of sketching during the course (self-reported), demographic factors and their EDSE at the end of the semester. The data collected in each course is displayed in Figure 2. These data sources allow us to study how sketching skills, spatial skills, sketching instruction and self-efficacy impact the use of sketching during the design process. Outlined below are the details of the participant characteristics, the sampling procedures and the independent and dependent measures used in the study.
Breakdown of data collected in each course in the study.
2.2. Participants
The primary focus of this study is students’ sketching behavior in the two engineering design project courses during their sophomore and senior years. Because sketching behavior is the construct of interest, data used from the entry-level graphics course was limited to only those students who later participated in one of the two design courses. In all, 769 students participated in the design course surveys. There was limited overlap in students who participated in both design courses: 374 students participated in the sophomore-level design course and 431 students participated in the capstone design course data collection. Of the 769 students, 185 were women, 531 were men, 1 was non-binary and 52 preferred not to disclose. The group was racially/ethnically diverse: 463 White, 166 Asian, 40 Black, 12 Hispanic, 5 Middle Eastern, 35 identified as two or more races and 48 students preferred not to disclose. About 15% of participants (118 of the 769) identified as first-generation college students. The vast majority of students were pursuing degrees in mechanical engineering.
There were only a small number of students that participated in both the entry-level graphics course study and the sophomore-level design course survey ( $ n=12 $
). This small sample size was due to a misalignment of the data collected in the entry-level course and the sophomore-level design course. Because of the small sample size, analyses were not conducted between the entry-level course measures and the sophomore-level course data. However, there were 157 students who participated in the entry-level course and the capstone design survey. This allows analysis of how sketching instruction and sketching skills impact future design performance. The mechanical engineering curriculum and pre-requisite structure tend to be rather rigid, causing the prediction of when students will take the design courses to be rather consistent. We knew how many semesters were expected to be between the sophomore and capstone design courses and began collecting data about two semesters before students were expected to be in capstone and continued to collect data until we saw a significant decrease in the number of participants from the freshman course. The number of semesters between the two courses varied for participants. Table 1 shows the distribution of the number of semesters between the two courses for students who participated. The mean and median number of semesters between the two courses was 6, and the mode was 7 semesters.
$ n=12 $
). This small sample size was due to a misalignment of the data collected in the entry-level course and the sophomore-level design course. Because of the small sample size, analyses were not conducted between the entry-level course measures and the sophomore-level course data. However, there were 157 students who participated in the entry-level course and the capstone design survey. This allows analysis of how sketching instruction and sketching skills impact future design performance. The mechanical engineering curriculum and pre-requisite structure tend to be rather rigid, causing the prediction of when students will take the design courses to be rather consistent. We knew how many semesters were expected to be between the sophomore and capstone design courses and began collecting data about two semesters before students were expected to be in capstone and continued to collect data until we saw a significant decrease in the number of participants from the freshman course. The number of semesters between the two courses varied for participants. Table 1 shows the distribution of the number of semesters between the two courses for students who participated. The mean and median number of semesters between the two courses was 6, and the mode was 7 semesters.
Number of semesters (amount of time, not accounting for enrollment) between completing the entry-level design & graphics course and the capstone design course

2.3. Sampling procedures
Data in the entry-level engineering design and graphics course were collected from nine sections of the course in the Fall 2015 semester and another nine sections in the Spring 2016 semester. All research activities were conducted during class time. Students were asked to complete a task of sketching skills followed by a survey. All participation was voluntary. Students were offered the choice of extra credit in the course or a small monetary compensation for participating. Only a handful of students chose monetary compensation.
Participants in the two design courses were recruited from all sections of the courses during the semesters of data collection. At the end of the semester, students were offered the opportunity to complete the survey. Participation was entirely voluntary. Students were offered the choice of extra credit in the course or a small monetary compensation for participating. Data collection in all courses was approved by the institutional review board.
2.4. Design project courses
Capstone design at Georgia Tech is a one-semester design project course. Students form teams and work on all aspects of a project, from problem definition to functioning prototype. Student teams work with sponsors or on individual projects. Each team has a faculty advisor that they have regular meetings with to guide their project. The course ends with a large expo to show off the student projects where awards are given for the best designs.
The sophomore-level design course, in which data were collected, differs in several ways from capstone. Overall, the course is more scripted than a capstone design project. Design teams are given specific deliverables that are benchmarked in design reports. Each consecutive report asks them to implement and document a series of design tools. In the design reports, students are tasked with explicitly creating sketches for idea generation. This is significantly different than capstone, where sketching may only be mandated by some faculty advisors. Another large difference is that the sophomore-level design course incorporates three different design projects to help expose students to more of the design process. The first two projects are short – one is only a couple of days, and the second one is only a few weeks. The last project takes up the majority of the semester and is the focal point for the course, but it is not the entire semester like capstone. The course ends with a large design competition focused on the prototypes constructed for the last and largest project.
The entry-level graphics course consists of five weeks of sketching instruction at the beginning of the course, and the remainder is spent on CAD instruction in Solidworks. The course includes weekly lab assignments in CAD. The class generally includes an individual CAD project where students often 3D print their object and a team CAD project. For the team project, students can CAD any object they choose and are encouraged to be creative and CAD something that does not exist. The projects are approved by the instructor and are complex enough that they warrant teams of 4–6 students. There is some variation in the individual and team projects based on the semester and the instructor.
2.5. Sketching instruction
Students in the entry-level graphics course received one of two types of instruction: traditional engineering sketching instruction or perspective sketching instruction. Traditional engineering sketching instruction consisted of sketching isometric and orthographic views. The focus of traditional engineering sketching instruction is more on spatial visualization skills: students are asked to picture an object from one perspective and project it onto a plane or rotate it. This type of sketching practice serves a key function in engineering education – helping to improve students’ spatial visualization skills (Sorby, Veurink, & Streiner Reference Sorby, Veurink and Streiner2018). However, it may not help students improve their freehand sketching skills. Traditional instruction focuses almost exclusively on isometric and orthographic views, emphasizing sketching accuracy (e.g., correct lengths of lines) over sketching quality (e.g., straight, smooth lines). Most sketches are completed using dot grid paper or graph paper and incorporate instruction on multi-view representations and dimensioning instead of realistic 3D visual representations. This type of sketching instruction serves as a precursor to CAD focused on representing images similar to those found in engineering drawings.
Perspective sketching instruction intentionally develops freehand sketching skills and provides a new means of visual representation to the designer. The two-point perspective curriculum is adapted from industrial design. Students begin with the building blocks of cubes that serve as the framework for visualizing the space. The cubes then guide the construction of primitives such as cylinders, cones and spheres. Students then combine those basic shapes to form other objects until they can represent complex forms in perspective. This framework gives students the tools to produce realistic depictions of 3D objects. More detailed information can be found on the differences between traditional and perspective sketching instruction in Hilton et al. (Reference Hilton, Linsey, Li and Hammond2018b) and Hilton (Reference Hilton2019). Previous work has shown that perspective sketching improves spatial skills (Hilton et al. Reference Hilton, Gamble, Li, Hammond and Linsey2018a) and freehand sketching abilities (Weaver et al. Reference Weaver, Ray, Hilton, Dorozhkin, Douglas, Hammond and Linsey2022), but it is unknown if those skills translate into practice during engineering design.
2.6. Measures
In the entry-level engineering design and graphics course, students were evaluated on sketching skills using the Sketching Foundations Test (Hilton et al. Reference Hilton, Williford, Li, mctigue, Hammond and Linsey2016b), and students were evaluated on spatial skills using the PSVT:R (Yoon Reference Yoon2011) and the MRT (Peters et al. Reference Peters, Laeng, Latham, Jackson, Zaiyouna and Richardson1995). In the two design courses, students’ self-efficacy was evaluated using the EDSE instrument (Jaison et al. Reference Jaison, Watson, Merzdorf, Williford, White, Douglas and Hammond2021), and students’ sketching behaviors were assessed through survey questions at the end of the semester. In all three courses, students were also surveyed about their involvement in makerspaces and other extracurricular activities, but that data is not evaluated in the current study. Results of the makerspace involvement survey questions can be found in (Hilton et al. Reference Hilton, Talley, Smith, Nagel and Linsey2020).
2.6.1. Sketching Foundations Test
The Sketching Foundations Test is a test of basic sketching skills (Hilton et al. Reference Hilton, Williford, Li, mctigue, Hammond and Linsey2016b). The test is focused on the basic elements of two-point perspective sketching, although no real content knowledge of two-point perspective is required. Sketching all components of the test assuming isometric views would achieve the same skill scores. The test begins with lines and progresses to a combination of primitives with a sketch of a simple camera. The final sheet of the test (the camera prompt) is shown in Figure 3. The sketch is completed on paper with either a pen or pencil and the use of straight edges was prohibited. Students were not given a time limit for completing the test.
Sketching Foundations Test – Ellipses & Camera Prompt.

Each sheet of the test was evaluated by two independent raters for each student included in this study. Raters were told to assess each sketch based on the overall quality of the sketches. The rating process leaned on the raters’ previous experience with sketching to inform their understanding of sketch quality. One rater was a graduate student in industrial design with extensive sketching skills and a strong knowledge of the perspective sketching technique. The second rater was a graduate student in mechanical engineering with training in perspective sketching techniques with considerable experience evaluating sketches. Inter-rater reliability (IRR) between the raters was evaluated using Krippendorff’s alpha (Krippendorff Reference Krippendorff2011). The average IRR for all ratings on all sheets was $ \alpha =0.69 $
, which shows substantial agreement.
$ \alpha =0.69 $
, which shows substantial agreement.
Sketches were excluded from evaluation if they were incomplete, if the participant did not properly follow instructions or if a straightedge was used as an aid. Participants’ sketch skill data were excluded if they were missing any component of the Sketching Foundations Test. Each sheet was evaluated on a scale from 1 to 5 with 5 being the highest sketch quality. Both raters evaluated all of the data in the study and an average of their ratings was taken. The final sketch quality score for participants was taken as the sum of the scores for each sheet. Therefore, the theoretical range for scores is from 8 to 40. The practical range of scores for this study was from 11.5 to 39.
2.6.2. Spatial visualization
Spatial visualization skills were measured using two instruments: the Revised Purdue Spatial Visualization Test (Revised PSVT:R) (Bodner & Guay Reference Bodner and Guay1997; Yoon Reference Yoon2011) and the MRT (Vandenberg & Kuse Reference Vandenberg and Kuse1978; Peters et al. Reference Peters, Laeng, Latham, Jackson, Zaiyouna and Richardson1995). The Revised PSVT:R consists of 30 questions and was not timed for this study. The MRT is split into two sections of 12 questions each, each with a six-minute time limit. Both spatial visualization tasks were administered through an online survey.
2.6.3. Engineering design self-efficacy (EDSE)
The EDSE instrument was developed by Carberry et al. (Reference Carberry, Lee and Ohland2010). The instrument consists of 36 questions broken down into four subsections. Participants are asked about their level of confidence, motivation, expectation of success and anxiety with regard to nine different activities associated with engineering design. Answer choices range from 0 to 100 incremented by units of 10. The four different elements are kept separate for analysis. Responses to the nine items for each aspect of self-efficacy are averaged for analysis. The validity of the EDSE instrument has been examined through several lenses. The items showed strong inter-item reliability within each of the four factors of the self-efficacy instrument. The scale effectively differentiated between groups with differing levels of engineering expertise, and the four factors showed strong correlations between themselves with anxiety correlating negatively with the other factors (Carberry et al. Reference Carberry, Lee and Ohland2010).
The EDSE data were checked for careless responses. Consistency indices can be an effective way to identify careless responses in data (Meade & Craig Reference Meade and Craig2012), another term for this is straight-lining (Vriesema & Gehlbach Reference Vriesema and Gehlbach2021). This refers to when participants simply reply with the same value for a large number of questions. The consistency index used in this data was a maximum count of equivalent responses. Upon examining the distribution of maximum equivalent responses, it was clear that it was a multimodal distribution. There was a clear mode at 36 meaning that a group of participants had selected the same answer choice for the entire instrument, which shows a clear level of carelessness. There was also a mode at 26/27 meaning that a group of participants had selected the same value for 75% of the survey. Upon examining those responses, most of the students had responded with a value of 100 for all items in the confidence, motivation and expectation of success aspects of the self-efficacy instrument. This showed a level of carelessness in this group of responses, and the mode demonstrated a significant break among those participants from the typical distribution of responses. Therefore, all participants who responded with a single value for more than 25 items on the survey were excluded from the EDSE data. This removed 109 out of the 805 EDSE responses, which is 13.5% of the sample. This level of careless responses is consistent with levels found in other undergraduate populations (Meade & Craig Reference Meade and Craig2012).
2.6.4. Sketching behavior
Sketching behavior was evaluated through three survey items asking about sketching behavior during the design project course shown below in Table 2.
Survey items evaluating sketching behavior
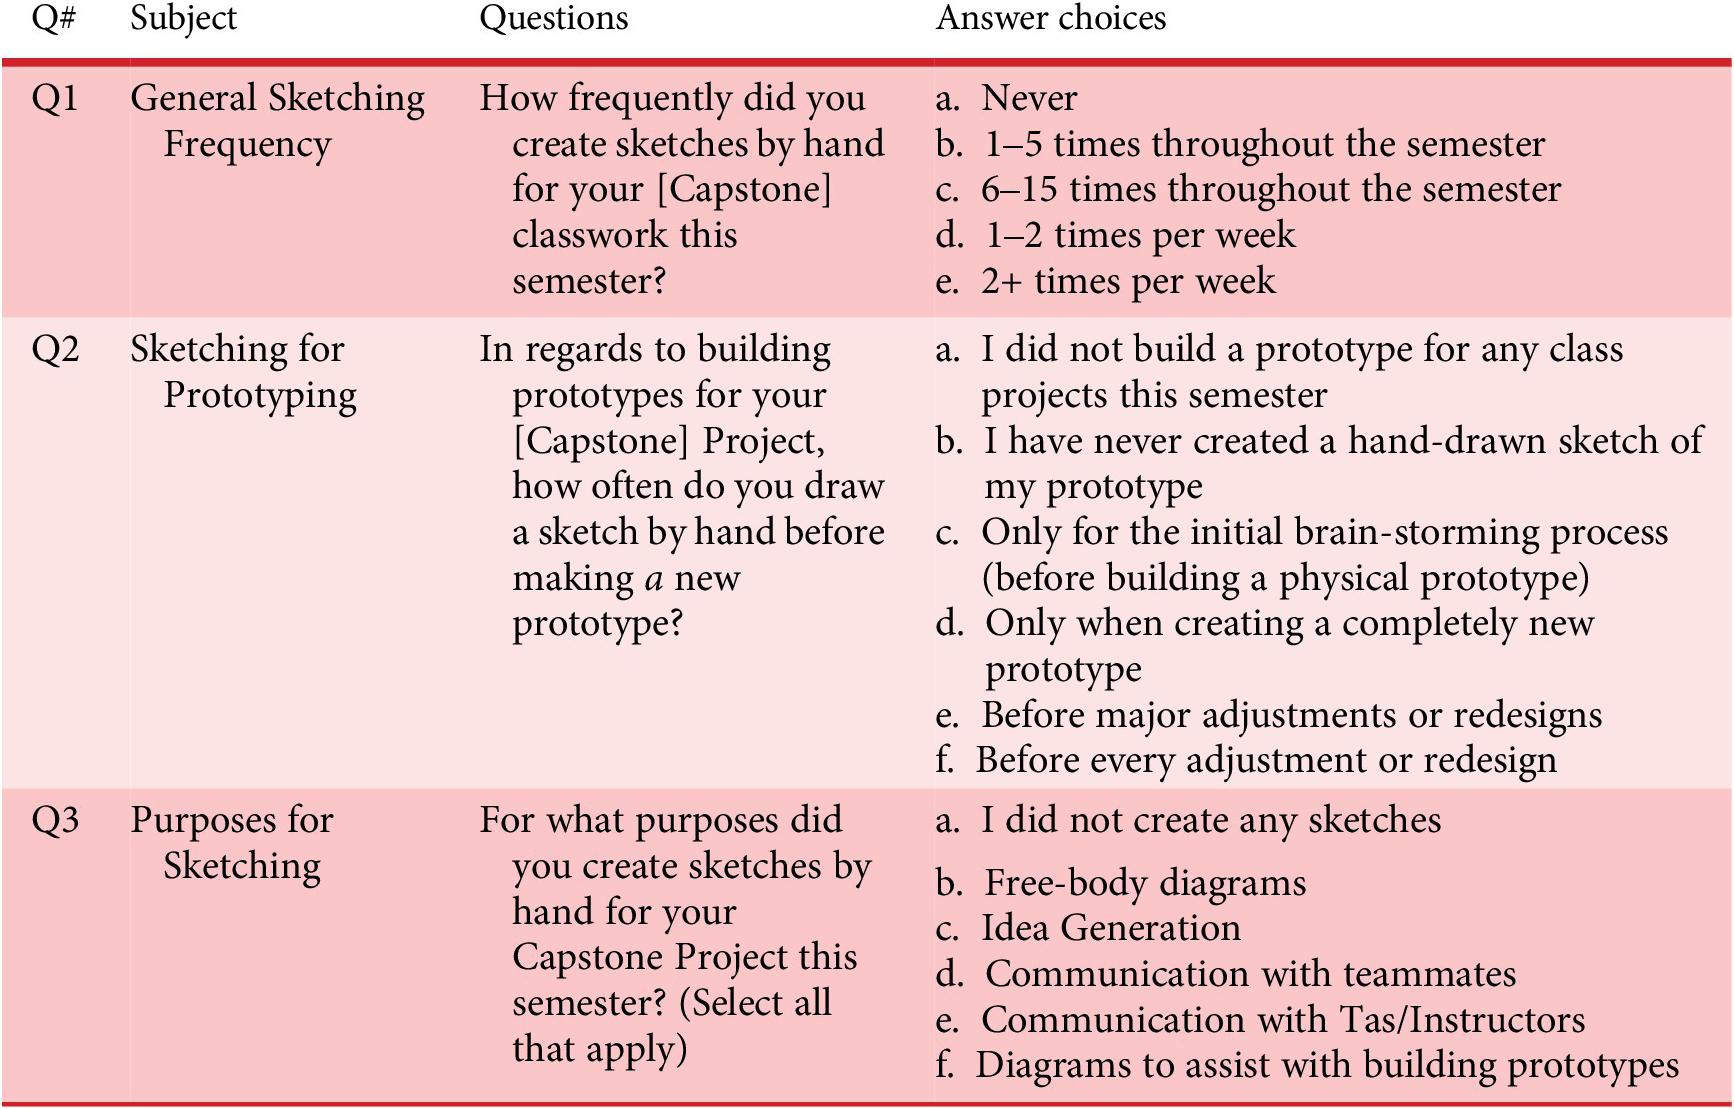
Q1 is a basic question of how frequently sketching was used throughout the design. Q2 specifically targets sketching for prototyping because of the findings from Yang (Reference Yang2009). They found that dimensioned sketching early on in the design process correlated with positive design outcomes, and they hypothesized that dimensioned sketching is likely to be connected to sketching for early prototyping. Therefore, sketching for prototyping was of particular interest because it could lead to an understanding of success in design projects. Q2 was added to the surveys for the design courses after data collection had begun. Therefore, the sample size for this question is somewhat smaller. Q3 surveys sketching for specific purposes in design. In understanding designers’ sketching behavior, it is important to understand more than just the frequency of sketching, but also what specific sketching behaviors individuals have the most motivation/inhibition towards. Q3 was examined in two ways for the analysis. First, a count was taken of how many purposes for sketching respondents were selected. This number ranged from 0 to 5 and speaks to the diversity of designers’ use of sketching. Second, we examined each of the purposes for sketching separately to understand patterns relating to specific sketching behaviors.
3. Results
RQ 1. To what extent does sketching behavior differ between a sophomore-level and a capstone design course? The analysis for this study examines self-reported sketching behavior in two distinct engineering design project courses. We first compared the sketching behavior and EDSE between the two courses before examining predictors to better understand differences. We first examined the responses to the sketching questions to understand the reported sketching behavior and any differences between the two design courses. The distributions of responses to the three sketching behavior questions are shown in Figures 4–6.
Distribution of responses to sketching behavior Q1 general sketching frequency.

The responses to Q1 (general sketching frequency) are shown in Figure 4. Very few students did not sketch at all during the semester. However, the mode for this question was the lowest response, “1–5 times throughout the semester,” and this was the same in both design courses. This suggests that a large portion of students are not using sketching regularly during design. A Mann–Whitney U-test showed that there was a significant difference in sketching frequency between the two courses ( $ U=\mathrm{30,385},z=-3.85,p<0.001 $
) with a small effect size of
$ U=\mathrm{30,385},z=-3.85,p<0.001 $
) with a small effect size of $ r=0.16 $
(Field Reference Field2013). The sophomore design course reported sketching more frequently than the capstone design course. This could likely be because sketching is mandated for some of the design reports in the sophomore-level design course.
$ r=0.16 $
(Field Reference Field2013). The sophomore design course reported sketching more frequently than the capstone design course. This could likely be because sketching is mandated for some of the design reports in the sophomore-level design course.
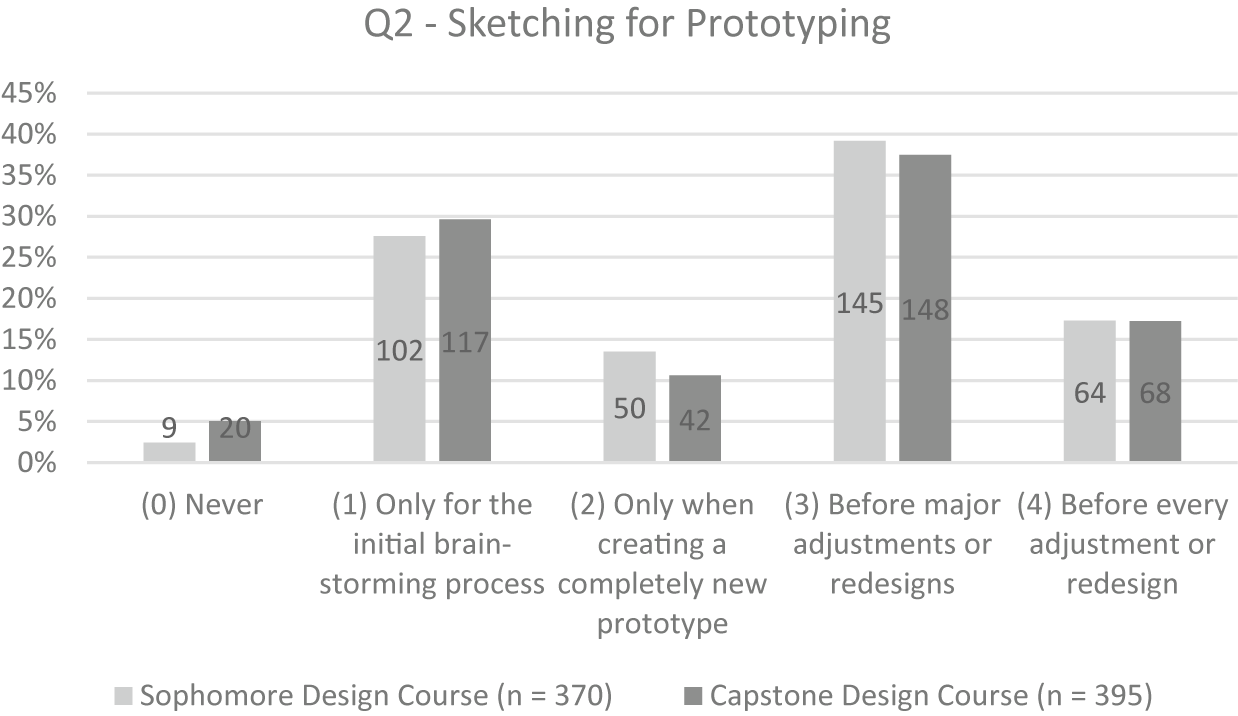
The responses to Q2 (sketching for prototyping) are shown in Figure 5. There were no significant differences between courses for the questions about sketching for prototyping ( $ U=\mathrm{70,364},z=-0.93,p=0.35 $
). This relationship also showed a very small effect size with
$ U=\mathrm{70,364},z=-0.93,p=0.35 $
). This relationship also showed a very small effect size with $ r=0.03 $
. Looking at the responses to the sketching for prototyping questions, we see that the sophomore design course and senior design course had very similar distributions. This suggests that students’ sketching behavior for prototyping may be very consistent regardless of what type of project they are working on. Both design courses involve prototyping final designs. For the capstone course, prototypes are demonstrated at the expo, and for the sophomore-level design course, prototypes are tested in a competition.
$ r=0.03 $
. Looking at the responses to the sketching for prototyping questions, we see that the sophomore design course and senior design course had very similar distributions. This suggests that students’ sketching behavior for prototyping may be very consistent regardless of what type of project they are working on. Both design courses involve prototyping final designs. For the capstone course, prototypes are demonstrated at the expo, and for the sophomore-level design course, prototypes are tested in a competition.
Distribution of responses to sketching behavior Q2 sketching for prototyping.
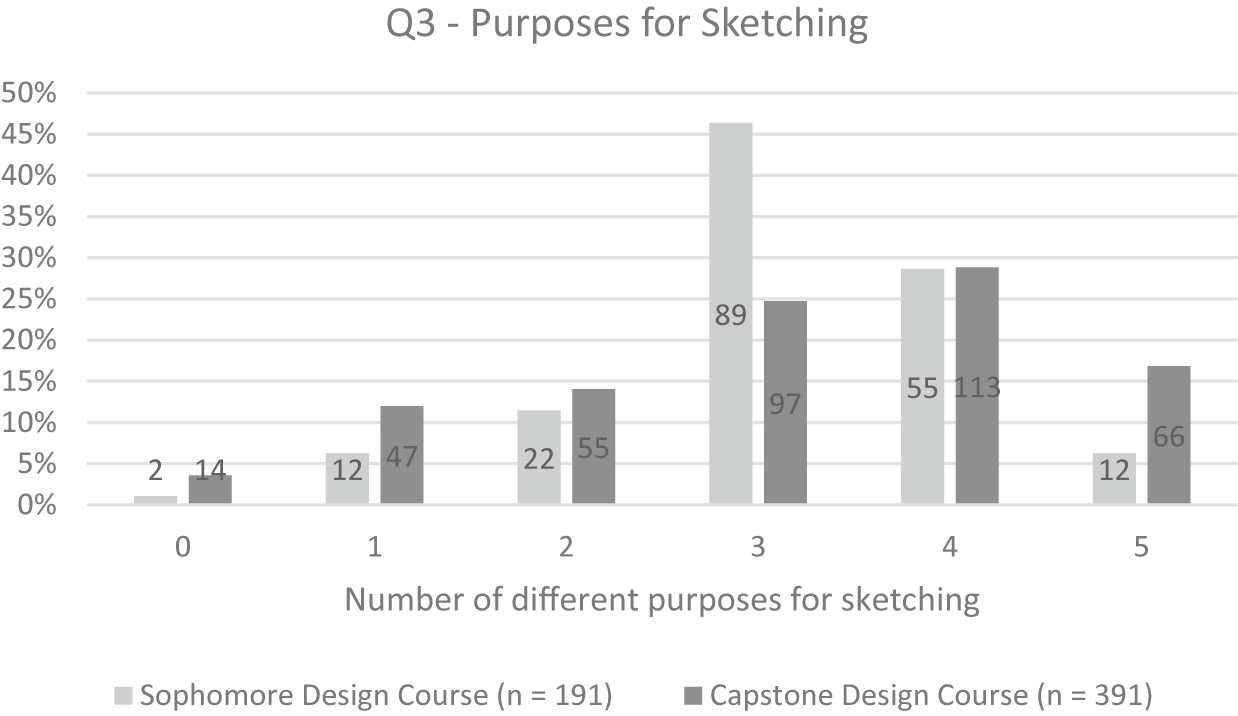
The responses to Q3 (purposes for sketching) are shown in Figure 6. There was not a significant difference for the number of purposes listed between the sophomore and capstone design course ( $ U=\mathrm{36,182},z=-0.78,p=0.43 $
). The effect size for Q3 was also small (
$ U=\mathrm{36,182},z=-0.78,p=0.43 $
). The effect size for Q3 was also small ( $ r=0.03 $
). The mode for count of purposes of sketching was 3 for the sophomore design course and 4 for capstone design. Students were reporting using freehand sketching for a variety of purposes.
$ r=0.03 $
). The mode for count of purposes of sketching was 3 for the sophomore design course and 4 for capstone design. Students were reporting using freehand sketching for a variety of purposes.
Distribution of responses to sketching behavior Q3 purposes for sketching.
We then looked more closely at Q3, the specific purposes students reported creating sketches for, shown in Figure 7. Fourteen seniors and two sophomores reported not creating any sketches and this is not shown in the chart. In both courses, a majority of students reported sketching for idea generation, communication with teammates and diagrams to assist with building prototypes. This reinforces the idea that most students use sketching for a variety of purposes in the design process, and this is consistent across these two design project courses. The shape of the distribution is similar across the two courses, but chi-square tests showed differences in sketching frequency for some of the purposes for sketching. Students in the sophomore design course were significantly more likely to sketch for communication with teammates $ \left({\chi}^2\left(1,N=584\right)=20.11,p<0.001,w=0.19\right) $
and to assist with building prototypes
$ \left({\chi}^2\left(1,N=584\right)=20.11,p<0.001,w=0.19\right) $
and to assist with building prototypes $ \left({\chi}^2\left(1,N=584\right)=26.43,p<0.001,w=0.21\right) $
. Capstone students were significantly more likely to sketch free-body diagrams
$ \left({\chi}^2\left(1,N=584\right)=26.43,p<0.001,w=0.21\right) $
. Capstone students were significantly more likely to sketch free-body diagrams $ \left({\chi}^2\left(1,N=584\right)=40.30,p<0.001,w=0.26\right) $
and for communication with TAs/Instructors
$ \left({\chi}^2\left(1,N=584\right)=40.30,p<0.001,w=0.26\right) $
and for communication with TAs/Instructors $ \left({\chi}^2\left(1,N=584\right)=7.83,p=0.005,w=0.12\right) $
. Both groups used sketching for idea generation at a similar rate
$ \left({\chi}^2\left(1,N=584\right)=7.83,p=0.005,w=0.12\right) $
. Both groups used sketching for idea generation at a similar rate $ \left({\chi}^2\left(1,N=584\right)=0.82,p=0.36,w=0.04\right) $
. The effect size index w suggests small effect sizes for most relationships (
$ \left({\chi}^2\left(1,N=584\right)=0.82,p=0.36,w=0.04\right) $
. The effect size index w suggests small effect sizes for most relationships ( $ w<0.3 $
) (Colman Reference Colman2015). The strongest effect size was the difference in the sketch frequency of free-body diagrams.
$ w<0.3 $
) (Colman Reference Colman2015). The strongest effect size was the difference in the sketch frequency of free-body diagrams.
Distribution of Q3 purposes for sketching in sophomore design course (top) and capstone design course (bottom).

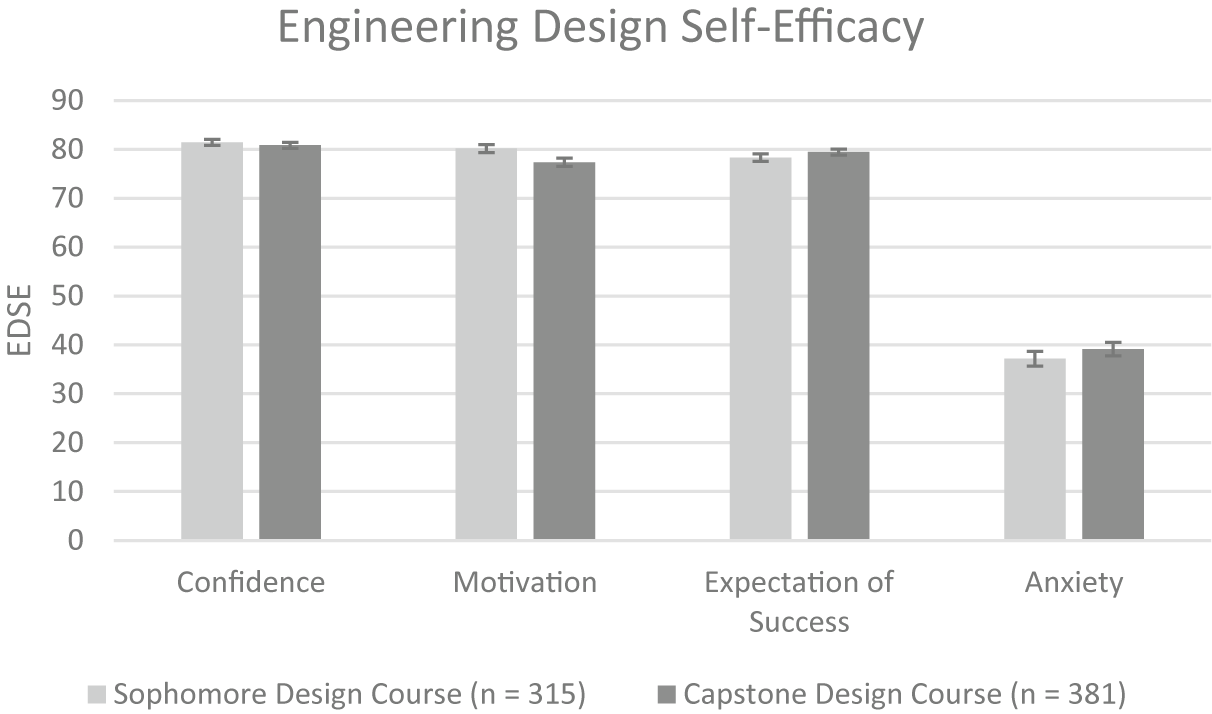
Lastly, the EDSE was compared between the two design courses to better understand differences in their design self-efficacy as this could change behavior. The EDSE averages for both courses are shown in Figure 8. There were no significant differences in EDSE for confidence $ \left(t(694)=0.676,p=0.499\right) $
, expectation of success
$ \left(t(694)=0.676,p=0.499\right) $
, expectation of success $ \left(t(694)=-1.126,p=0.261\right) $
or anxiety
$ \left(t(694)=-1.126,p=0.261\right) $
or anxiety $ \left(t(694)=-0.953,p=0.341\right) $
between the two courses. However, students in the sophomore design course reported higher levels of motivation
$ \left(t(694)=-0.953,p=0.341\right) $
between the two courses. However, students in the sophomore design course reported higher levels of motivation $ \left(M=80.2, SD=14.4\right) $
than students in the capstone course
$ \left(M=80.2, SD=14.4\right) $
than students in the capstone course $ \left(M=77.3, SD=16.7\right) $
,
$ \left(M=77.3, SD=16.7\right) $
, $ t(693)=2.402\;\left(p=0.02\right) $
. This is not unexpected given that senior design students likely experience burnout at a higher rate leading to lower motivation. Higher motivation in sophomore design students could also explain why they reported sketching more frequently during the design process.
$ t(693)=2.402\;\left(p=0.02\right) $
. This is not unexpected given that senior design students likely experience burnout at a higher rate leading to lower motivation. Higher motivation in sophomore design students could also explain why they reported sketching more frequently during the design process.
EDSE for sophomore and capstone design courses.
RQ 2. To what extent do the following constructs predict sketching behavior during a design project course? To examine the extent to which the independent variables (sketching skills, spatial skills, type of sketching instruction and EDSE) predict sketching behavior, we explore correlations and regressions between them. For these analyses, it is helpful to note that there are essentially three data sets involved in this study. The first dataset is longitudinal data between the entry-level course and the capstone course. This dataset represents students who participated in the sketching and spatial visualization exercises during their freshman year and then were surveyed again when they completed capstone six semesters later (on average). This data set allows us to analyze the extent to which sketching skills, spatial visualization and sketching instruction predict sketching behavior in a future design course. The remaining two data sets are comprised of the survey data in the sophomore-level and capstone design course. In these surveys, students were asked about EDSE, demographics and sketching behavior. These two data sets allow us to analyze the relationship between design self-efficacy and sketching behavior in both a sophomore-level and a capstone design course.
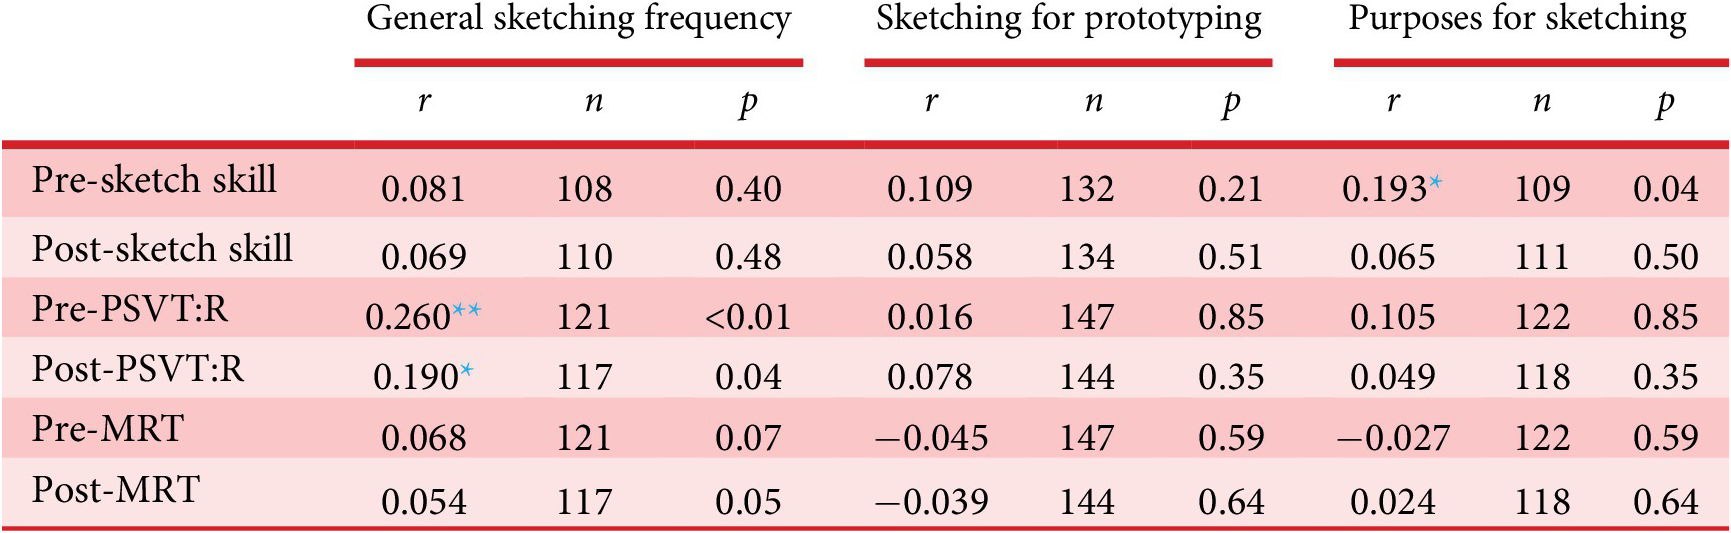
RQ 2.1–2.2: To what extent do Sketching Skills and Spatial Visualization Skills predict sketching behavior during a design project course? To address the first two research questions, data from the entry-level course is analyzed. These analyses examine how first-year sketching skills, spatial visualization and sketching instruction predict sketching behaviors in a capstone design course. The responses to the sketching behavior questions constitute ordinal-level data. Therefore, Spearman’s rho was used to analyze the relationships of sketching skills and spatial skills with sketching behavior. Students completed evaluations of sketching skills and spatial skills before and after receiving sketching instruction. Both evaluations were examined to understand relationships before and after students received sketching instruction; they are denoted as “Pre” and “Post” in the tables below. The results are displayed in Table 3.
Spearman’s rho correlations of sketching behavior questions versus sketching skills and spatial skills
* p < 0.05.
** p < 0.01.
There was a significant correlation between both pre- and post-PSVT:R scores and general sketching frequency (Q1). The stronger predictor was the pre-PSVT:R measure with $ {r}^2=0.068 $
. This shows a relationship, although weak, between students’ entry-level spatial visualization skills and how frequently they sketch in a capstone design course. There was also a significant relationship between pre-sketch quality and Q3, the number of purposes for sketching
$ {r}^2=0.068 $
. This shows a relationship, although weak, between students’ entry-level spatial visualization skills and how frequently they sketch in a capstone design course. There was also a significant relationship between pre-sketch quality and Q3, the number of purposes for sketching $ \left({r}^2=0.037\right) $
.
$ \left({r}^2=0.037\right) $
.
One possible reason for the lack of correlation between sketch behaviors and sketch skills is that the instruction may not be having a significant impact. Two separate within-subject t-tests were conducted for Traditional and Perspective instruction methods. Both methods produce statistically significant differences in Sketch Skill but these changes are rather small – Traditional (Pre-Sketch Quality-mean: 21.26, Post- Sketch Quality mean 22.87, t-value −2.748, p = 0.008) and Perspective (Pre-Sketch Quality-mean: 21.26, Post- Sketch Quality mean 22.87, t-value −2.748, p = 0.008). Due to the fact that only the pre/post scores were needed and not complete data for all the measures, the sample size is larger. There is also not a significant difference between the two sketch instruction methods in terms of the resulting Post-Sketch Skill (Traditional mean = 22.7, Perspective mean- 24.1, t = −1.848, p = 0.67).
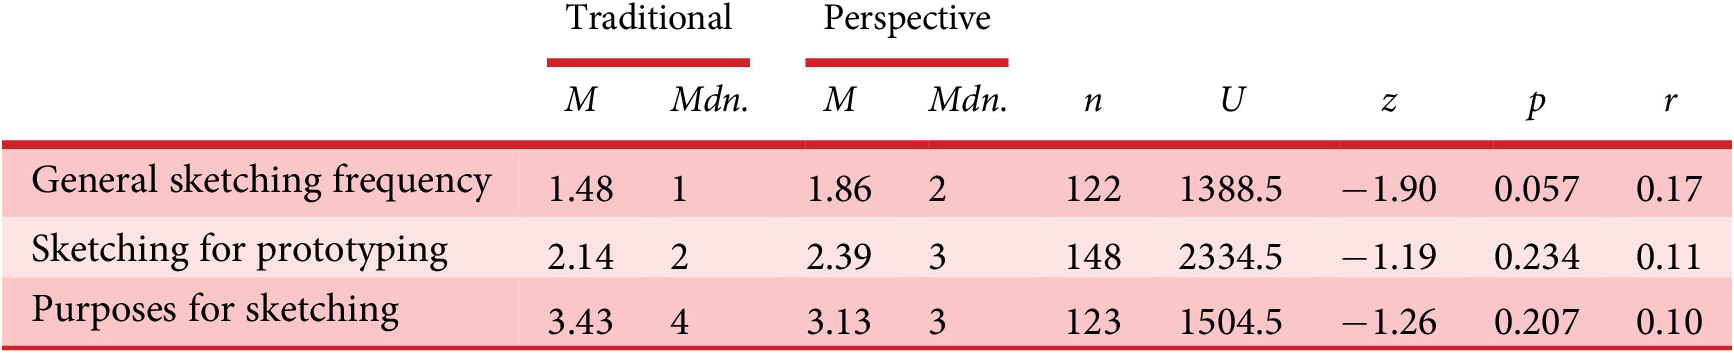
RQ 2.3: To what extent does the Type of Sketching Instruction predict sketching behavior during a design project course? Second, we looked at the impact of sketching instruction on sketching behavior. The two types of sketching instruction, traditional engineering and sketching in perspective, were compared across the three sketching frequency questions using Mann–Whitney U tests. The results are shown in Table 4. The impact of sketching instruction was not significant on any of the sketching behavior questions. However, the question for general sketching frequency (Q1) was only marginally not significant.
Mann–Whitney U tests of sketching frequency between types of sketching instruction
Lastly, we used binary logistic regression to examine how these three independent variables (RQ 2.1–3: sketching skills, spatial skills and sketching instruction) predicted each of the five purposes for sketching (shown in Figure 9). Binary logistic regression is used to predict categorical dependent variables from categorical and continuous independent variables (Field Reference Field2013). In this case, we are trying to predict the dependent variable that sketching was or was not used for that particular purpose (e.g., free body diagrams). Logistic regression leverages the independent variables to predict the likelihood of an individual using sketching or not using sketching. The three independent variables shown in Figure 9 were analyzed together because we anticipated there may be interactions between the three. For example, a student’s initial sketching skills could impact how the sketching instruction impacted their use of sketching on future design projects. For the independent variables, both the pre-sketching instruction and post-sketching instruction measures were included as alternatives, and for spatial skills, both the PSVT:R and the MRT were included in the analysis.
Hypothesized binary logistic regression relationships for RQ 2.1–3.

A separate binary logistic regression model was analyzed for each of the five individual purposes for sketching. Because we were not sure if all of the independent variables would be a significant predictor, a stepwise forward likelihood ratio method was used to select which independent variables were included in the model for each sketching purpose. Forward stepwise regression considers individual independent variables in a successive set of analyses. In each step, the most impactful independent variable is included in the model until no more independent variables are significant. Stepwise regression is a simplistic way to down-select significant variables to be included in the final model.
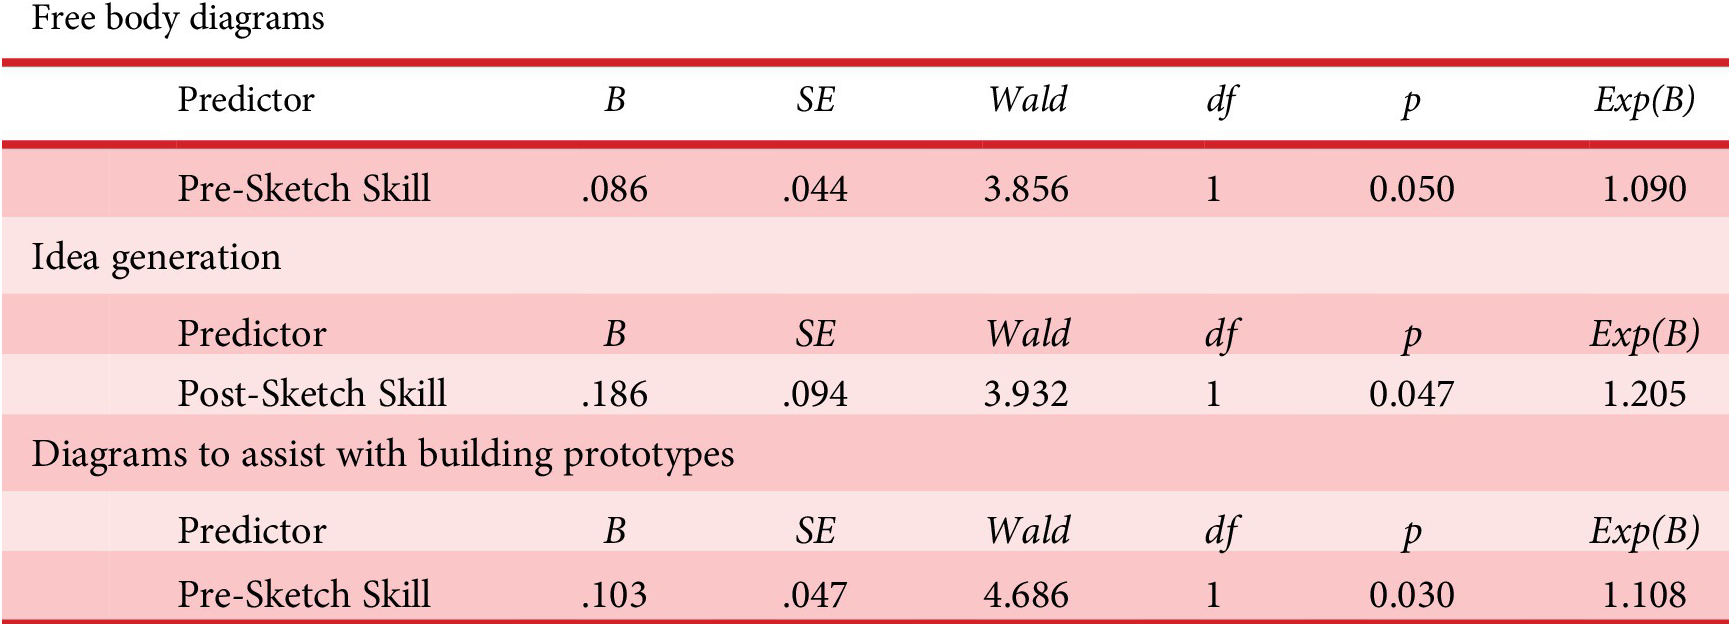
For the present analyses, two of the models were wholly insignificant. None of the independent variables significantly predicted whether or not students would sketch for two purposes: communication with teammates and communication with TAs/instructors. For the other three sketching purposes (free body diagrams, idea generation and diagrams to assist with building prototypes), sketching skills were the only construct included in the models. The stepwise progression for each of the three models ended with only one independent variable. The remaining variables for spatial skills and sketching instruction were not significant predictors of any behaviors. The logistic regression coefficients for the variables included in the models are shown in Table 5. The logistic regression model for free body diagrams was significant overall with $ {\chi}^2(1)=4.12,p=0.043;{R}^2=0.04\;\left( Cox\& Snell\right) $
,
$ {\chi}^2(1)=4.12,p=0.043;{R}^2=0.04\;\left( Cox\& Snell\right) $
, $ 0.05\;(Nagelkerke) $
. Pre-sketch skill had a positive relationship with sketching for free body diagrams. The logistic regression model for idea generation was significant overall with
$ 0.05\;(Nagelkerke) $
. Pre-sketch skill had a positive relationship with sketching for free body diagrams. The logistic regression model for idea generation was significant overall with $ {\chi}^2(1)=4.35,p=0.036;{R}^2=0.04\;\left( Cox\& Snell\right),0.09\;(Nagelkerke) $
. Post-sketch skill had a positive relationship with sketching for idea generation. And lastly, the model for diagrams to assist with building prototypes was significant overall with
$ {\chi}^2(1)=4.35,p=0.036;{R}^2=0.04\;\left( Cox\& Snell\right),0.09\;(Nagelkerke) $
. Post-sketch skill had a positive relationship with sketching for idea generation. And lastly, the model for diagrams to assist with building prototypes was significant overall with $ {\chi}^2(1)=5.18,p=0.023;{R}^2=0.05\;\left( Cox\& Snell\right) $
,
$ {\chi}^2(1)=5.18,p=0.023;{R}^2=0.05\;\left( Cox\& Snell\right) $
, $ 0.07\;(Nagelkerke) $
. Pre-sketch skill was a positive predictor of sketching for diagrams to assist with prototypes.
$ 0.07\;(Nagelkerke) $
. Pre-sketch skill was a positive predictor of sketching for diagrams to assist with prototypes.
Stepwise logistic regression of sketching skills, spatial skills and sketching instruction predicting Q3 specific purposes for sketching – regression coefficients for included variables
RQ 2.4–2.5: To what extent does Engineering Design Self-Efficacy predict sketching behavior during a design project course? Data on EDSE were collected in both the sophomore design course and the capstone design course. Relationships are examined separately for the two courses in all analyses. First, Spearman’s correlations were examined between the EDSE measures and the sketching behavior questions shown in Tables 6 and 7. For the sophomore design course, confidence, motivation and expectation of success were significantly correlated with all questions on sketching frequency. Anxiety had a significant negative correlation only with general sketching frequency (Q1). For the capstone design course, there was only one significant relationship: a positive correlation between motivation and sketching for prototyping (Q2).
Sophomore design course: Spearman’s rho correlations of sketching behavior questions versus EDSE

* p < 0.05,
** p < 0.01.
Capstone design course: Spearman’s rho correlations of sketching behavior versus EDSE
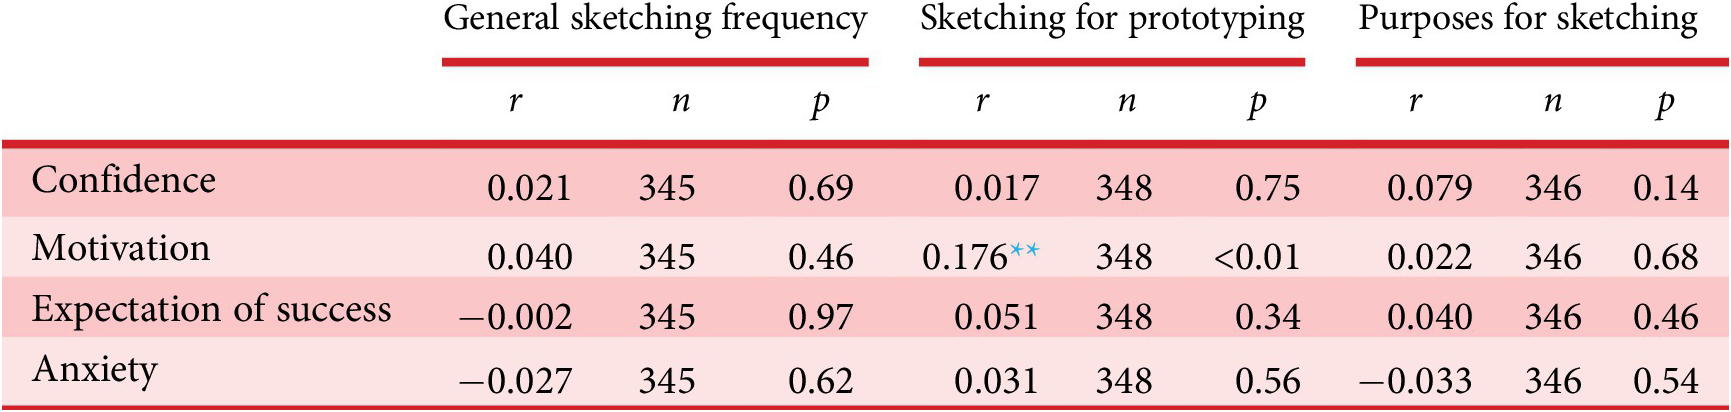
* p < 0.05,
** p < 0.01.
Lastly, we leveraged binary logistic regression to examine to what extent EDSE predicted sketching for different purposes (shown in Figure 10). The logistic analyses were again conducted using forward stepwise regression (likelihood ratio) discussed above. These analyses were conducted separately for the sophomore and the capstone design courses.
Hypothesized binary logistic regression relationships for RQ 2.4–5.

In the sophomore design course, two purposes for sketching had no significant predictors: free body diagrams and diagrams to assist with building prototypes. The logistic regression models for these two variables were not significant overall. The remaining three each only had one predictor included in the model. The stepwise procedure again ended after the first variable was included. The coefficients for the independent variables in the significant models are shown in Table 8 for the sophomore design course. The model for sketching for idea generation was significant overall with $ {\chi}^2(1)=16.06,p<0.001;{R}^2=0.09\;\left( Cox\& Snell\right),0.21(Nagelkerke) $
. Engineering design confidence was a positive significant predictor for sketching for idea generation. The model for sketching to communicate with teammates was significant overall with
$ {\chi}^2(1)=16.06,p<0.001;{R}^2=0.09\;\left( Cox\& Snell\right),0.21(Nagelkerke) $
. Engineering design confidence was a positive significant predictor for sketching for idea generation. The model for sketching to communicate with teammates was significant overall with $ {\chi}^2(1)=10.59,p=0.001;{R}^2=0.06\;\left( Cox\& Snell\right) $
,
$ {\chi}^2(1)=10.59,p=0.001;{R}^2=0.06\;\left( Cox\& Snell\right) $
, $ 0.15\;(Nagelkerke) $
. Anxiety about engineering design was a significant negative predictor of sketching to communicate with teammates (e.g., the more anxious students were, the less likely they were to sketch to communicate). Lastly, the model for communication with TAs/instructors was significant overall with
$ 0.15\;(Nagelkerke) $
. Anxiety about engineering design was a significant negative predictor of sketching to communicate with teammates (e.g., the more anxious students were, the less likely they were to sketch to communicate). Lastly, the model for communication with TAs/instructors was significant overall with $ {\chi}^2(1)=4.95,p=0.026;{R}^2=0.03\;\left( Cox\& Snell\right),0.04\;(Nagelkerke) $
. Engineering design motivation was a significant positive predictor of sketching to communicate with TAs/instructors.
$ {\chi}^2(1)=4.95,p=0.026;{R}^2=0.03\;\left( Cox\& Snell\right),0.04\;(Nagelkerke) $
. Engineering design motivation was a significant positive predictor of sketching to communicate with TAs/instructors.
Sophomore design course: logistic regression coefficients for purposes for sketching

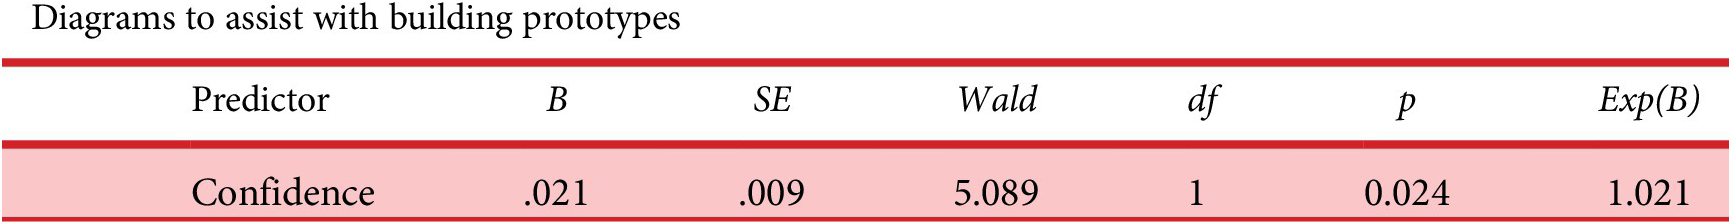
In the capstone design course, logistic models for four out of the five sketching purposes were not significant: free body diagrams, idea generation, communication with teammates and communication with TAs/instructors. The only model that was significant in the capstone course was that of sketching for diagrams to assist with building prototypes with $ {\chi}^2(1)=5.27,p=0.022;{R}^2=0.02\;\left( Cox\& Snell\right) $
,
$ {\chi}^2(1)=5.27,p=0.022;{R}^2=0.02\;\left( Cox\& Snell\right) $
, $ 0.02\;(Nagelkerke) $
. Engineering design confidence was a significant positive predictor of sketching for diagrams to assist with building prototypes. The coefficients and statistics for the variable in the capstone design course model are shown in Table 9.
$ 0.02\;(Nagelkerke) $
. Engineering design confidence was a significant positive predictor of sketching for diagrams to assist with building prototypes. The coefficients and statistics for the variable in the capstone design course model are shown in Table 9.
Capstone design course: logistic regression coefficients for purposes for sketching
4. Discussion
H2.1: Engineering students’ sketching skills have a positive effect on the frequency of sketching during a design project. The data partially support the first hypothesis. A positive correlation was observed between sketching skills and the number of purposes sketching was used for, and sketching skills were a predictor for three out of the five different sketching purposes surveyed. Previous work showed a correlation between sketching skills and overall sketching frequency (Yang & Cham Reference Yang and Cham2007). In the data presented herein, there was not a correlation with general sketching frequency (Table 3). Although our data were collected through self-report instead of observations of design notebooks, this relationship is likely more easily observed through design notebooks. However, sketching skills were actually associated with specific sketching activities during design (Table 5) – free body diagrams, idea generation and diagrams to assist with building prototypes.
It is interesting to note that sketching skills did not predict activities associated with sketching for communication. This lack of relationship suggests that designers sketch to communicate at the same level regardless of sketching skills. Recent literature has exploded the understandability of a design representation and how effective a representation is for the communication of design ideas as an independent metric from the quality (Das & Yang Reference Das and Yang2022; Krishkakumar et al. Reference Krishkakumar, Letting, Soria Zurita and Menold2023; Das, Huang, & Yang Reference Das, Huang and Yang2024). We do not observe any differences in either the impact of the different sketching instruction conditions or sketching skill in the report frequency of using sketches for communication. It is very possible that students’ initial sketching skills adequately convey the concepts and are easily understandable to others. Thus, we observed no statistical differences. It is also possible that the five weeks of instruction does not significantly improve the understandability of the sketches. It would be interesting to evaluate these aspects in future work.
Sketching skills did predict sketching for free body diagrams, idea generation and diagrams to assist with prototyping. These relationships suggest that sketching skills may not impact overall sketching frequency, but rather sketching skills might make designers more inclined for some specific sketching behaviors that might be less accessible without this skill. Another possibility is more instruction time is needed to increase sketching skills more and thus sketch behaviors would also increase. The increases in sketching skills due to instruction were modest. H2.2: Engineering students’ spatial visualization skills has a negative effect on the frequency of sketching during a design project. The data fail to support hypothesis two. Previous work suggested that students with better visualization skills would lean more on internal representations for design and, therefore, would sketch less frequently (Yang & Cham Reference Yang and Cham2007). The data presented here show the opposite may be true. A positive correlation was observed between students’ initial spatial visualization skills and their general sketching frequency during design. This suggests that designers may not lean more on higher skills of internal visualization, but rather students may leverage their stronger spatial skills for more fluent external representation. Further work should be done to better understand the interaction between spatial and sketching skills.
It is interesting in the case of both the sketching skills and spatial visualization skills that the initial measures of these qualities in an entry-level course significantly predicted behavior in a capstone design course an average of six semesters later. Designers’ initial skill levels are still impacting their design behavior on future design projects even after much educational intervention. It is critical for engineering educators to understand why. It may be that this is just the natural inclination of the designers, or it may be that the engineering designers are not receiving the training on these sorts of skills that are critical to design. There may need to be a greater emphasis on the visual thinking and representation aspects of design, the way designers reason with design problems in practice.
H2.3: Students who received two-point perspective sketching instruction sketch more frequently than students who received traditional engineering sketching instruction. The data reject hypothesis three in favor of the null hypothesis. There were no significant relationships between the type of sketching instruction and how frequently students sketched during a capstone design project. Previous work has shown significant increases in sketching skills over the course of perspective sketching instruction (Weaver et al. Reference Weaver, Ray, Hilton, Dorozhkin, Douglas, Hammond and Linsey2022). However, the relationship between behavior and skill was relatively weak, so this may not drive sketching behavior change. Previous research also showed that sketching instruction can reduce sketching inhibition and increase sketching frequency (Booth et al. Reference Booth, Taborda, Ramani and Reid2016). However, the reduced inhibition did not hold over time as participants were further from the period of sketching instruction (Booth et al. Reference Booth, Taborda, Ramani and Reid2016). The sketching instruction intervention was fairly small – five weeks of instruction in a three-credit hour course. It is likely that this intervention was too small to have lasting impacts on students’ sketching behavior. Perspective sketching techniques should encourage freehand sketching behaviors. Potentially a larger instructional intervention could increase students’ use of sketching during design.
H2.4: Engineering Students’ engineering design self-efficacy has a positive effect on the frequency of sketching during a design project. The data partially support hypothesis four. There were differences in the impact of EDSE on sketching behavior between the two courses. In the sophomore design course, design self-efficacy was a predictor for most behaviors. Students with higher design self-efficacy were more likely to sketch more frequently, to use sketching for prototyping and to use sketching in a larger variety of ways. In the sketching purposes, sophomore design students with higher design self-efficacy were more likely to use sketching for three out of the five sketching purposes. The only relationship found in the capstone design course was that students with higher motivation were more likely to sketch diagrams to assist with building prototypes. This finding is interesting in that capstone design students had significantly lower design motivation than sophomore design students. Motivation may be a critical thing to monitor in capstone students to understand their design behaviors. These results suggest that design self-efficacy may be much more critical in the early years of education. Early-stage students with higher confidence, higher motivation and lower anxiety are more likely to sketch to generate concepts and communicate with peers or instructors. Improving students’ self-efficacy early on could lead to developing positive design behaviors that could help students out in the long run.
5. Limitations
There are a number of limitations with this study largely associated with the difficult data collection methods spanning across multiple courses over multiple years. First, the instruction type was coupled with the instructors and there were multiple instructors. There were three different instructors for perspective sketching and one for traditional engineering. The two methods of drawing cannot be decoupled from the instructor. The professor teaching the traditional engineering method has taught this for more than 10 years with good student evaluations and all evidence indicates he is highly effective at teaching this course. If the results showed that the traditional engineering drawing method produced higher-quality sketches, this would be of more concern. The instructors in the perspective sketches had less experience in teaching and with this particular class. The coupling of the instructors and method could not be avoided, and this is a limitation of the study. The sketching behavior measure was also self-reported and not directly measured nor could it have been because students are not required to keep design notebooks for the courses. It is a major limitation that there was no significant overlap in data between the entry-level design and graphics course and the sophomore design course; it would have been meaningful to see how sketching skills, spatial skills and sketching instruction influenced design sketching in a more closely timed design course. It is likely that the relationships between these variables would have been stronger if their design behavior was followed in the semester or two after taking the entry-level course instead of the average of six semesters between the data points analyzed. However, this limitation was unavoidable given the timing of data collection. The time between the entry-level course measurements and the capstone design course measurements also limits the power of those relationships. Ideally, it would be beneficial to measure sketching skills, spatial visualization and sketching behavior all in the same semester in the same course, but that was outside the scope of this study. The time between the two measurements also speaks to the power of the relationships.
It should also be noted that both the sophomore course project and capstone course project are team-based design projects. Team dynamics were not surveyed, and these likely add noise to the study. Different students on the design team may be more or less likely to use sketching for specific purposes given their role on the design team. For instance, a design team lead may be more likely to use sketching for communication but may be less likely to use sketching to assist with building prototypes. These interactions could have been accounted for in the analyses used, which could have provided more clarity on how designer characteristics such as skill and self-efficacy influenced behavior.
6. Conclusions
Freehand sketching plays a critical role in engineering design. This paper has examined more closely the sketching behavior of designers across two engineering design courses. Sketching skills and spatial skills both had a positive correlation with sketching frequency in a capstone design course. Sketching skills were more associated with using sketching for a variety of purposes. EDSE had a positive correlation with sketching frequency in a sophomore design course. This speaks to the importance of boosting students’ confidence early on to help them develop good design habits. The type of sketching instruction did not have a significant impact on sketching behavior. It is likely that a larger period of sketching instruction could benefit students sketching behavior, but future work is needed to understand how much to prioritize freehand sketching in engineering education. These results provide insights into why designers sketch. Hopefully, these insights can guide future work in improving sketching for engineering sketching and encouraging engineers to sketch.
Acknowledgments
This material is based upon work supported by the National Science Foundation under Award Numbers 2013504, 2013554 and 1432107. Any opinions, findings, conclusions or recommendations expressed in this material are those of the author(s) and do not necessarily reflect the views of the National Science Foundation.


 Open access