


1. Introduction
The contribution of the fisheries sector to a national or regional economy is one of the important dimensions for sustainable fisheries policy. The contribution of a sector to total gross domestic product (GDP) is commonly considered by policy makers as an indicator of the sector's importance to the economy in a country or in a region, although such a metric is reported to severely underestimate the true contributions of the sector (Béné et al., Reference Béné, Macfadyen and Allison2007; World Bank, 2012). In particular, small-scale fisheries often fare poorly with regard to this metric relative to industrial fisheries, despite their often significant role in supporting regional livelihoods (Ayilu et al., Reference Ayilu, Fabinyi and Barclay2022).
An alternative to GDP as a measure of a fisheries' regional importance is the additional contribution it makes beyond GDP. The commercial fishing industry requires inputs from other industries, such as nets, traps, ice, and wood for boat making. The purchase of these inputs generates additional economic activity in these interconnected industries (‘business-induced effects’). Similarly, fishers boost the local economy through their personal and household expenditure of the incomes they receive from fishing, as well as through expenditure arising from the increased incomes of those workers in businesses supplying the fishery (‘consumption-induced effects’). These cascading economic impacts (also known as ‘flow-on’) are together referred to as the multiplier effect (Watson and Beleiciks, Reference Watson and Beleiciks2009; Jacobsen et al., Reference Jacobsen, Lester and Halpern2014). An understanding of multipliers is particularly useful in policy decision making as it allows policy makers to assess the degree of fisheries' dependence in regions and evaluate the broader implications of any changes in supply or demand resulting from management changes.
Previous studies have attempted to estimate fisheries' contribution beyond GDP by considering the wider social and economic aspects of the sector, primarily using input-output analysis (Leontief, Reference Leontief1936, Reference Leontief1941) to estimate the fisheries multipliers. Leung and Pooley (Reference Leung and Pooley2001) and Cai et al. (Reference Cai, Leung, Pan and Pooley2005) both estimated the output multipliers for the Hawaiian tuna longline fishery to be 2.4. This means that for every dollar of output produced by the tuna longline fishery, an additional $1.4 was generated in the Hawaiian economy. Cai et al. (Reference Cai, Leung, Pan and Pooley2005) explored inter-sectoral linkages of the Hawaiian tuna fisheries sector and found that Hawaii's longline targeting tuna and swordfish had strong economic linkages to the rest of the economy, particularly to the upstream industries. Even though not quantified, the study found that the economic impacts of longline regulations would go beyond the fishing sectors that were being restricted. Norman-López et al. (Reference Norman-López, Pascoe and Hobday2011) estimated the output multiplier for the Australian Eastern Tuna and Billfish Fishery to be 3.6, the highest multiplier estimated for a fisheries sector in their study within Australia. Jacobsen et al. (Reference Jacobsen, Lester and Halpern2014) provided a global synthesis of the economic multiplier effects of marine sectors (including commercial fishing, coastal tourism, aquaculture, seafood processing, recreational harvesting, etc.) for more than 180 countries and found the global average output multiplier (i.e., measured in terms of revenue) to be around 1.82, with substantial variation between industries and countries. Dyck and Sumaila (Reference Dyck and Sumaila2010) estimated the contribution of fisheries to the global economy at US$380 billion, nearly three times larger than the direct value of fish landings.
Input-output (I-O) analysis is an established technique in quantitative economic research, which has been extensively applied to policy impact analysis worldwide (Miernyk, Reference Miernyk1965; van Leeuwen et al., Reference van Leeuwen, Nijkamp, Rietveld and Kempf-Leonard2005). The usual sources of data for I-O analysis are national or regional accounts, requiring substantial information on all input and output flows in a national or regional economy. It is a data intensive approach, such that the data requirements for building a comprehensive I-O model are formidable (van Leeuwen et al., Reference van Leeuwen, Nijkamp, Rietveld and Kempf-Leonard2005; Dyck and Sumaila, Reference Dyck and Sumaila2010). Hence, the application of I-O analysis is not always feasible for small regional analyses or data-limited industries such as fisheries. Moreover, traditional I-O analysis works only at an aggregate level, that is, the flow-on effect for the whole fishery would be assessed on the basis of one ‘average’ multiplier value and the total output from the sector.
Stoeckl (Reference Stoeckl2007) developed an alternative approach to draw inferences about the size of regional multipliers to assess the flow-on economic impacts of the tourism sector in Northern Australia, building on the original concept of the multiplier effect developed by Keynes (Reference Keynes1936). The approach uses data derived from a survey of the sector of interest, collecting information on inputs used and from where they were purchased, and does not require a full I-O transaction table. With this approach, the flow-on effects can be derived at the individual vessel level, taking into account heterogeneity in both production and expenditure patterns, producing a distribution of multiplier impacts (Pascoe et al., Reference Pascoe, Innes, Tobin, Stoeckl, Paredes and Dauth2018). This in turn allows researchers to undertake statistical analysis to investigate what factors may affect the individual business-level multiplier values. Stoeckl (Reference Stoeckl2012) found that the multipliers for fifteen industries derived from the survey-based approach and those from the I-O table of Western Australia were very similar on average, but they did not include the fisheries sector. Pascoe et al. (Reference Pascoe, Innes, Tobin, Stoeckl, Paredes and Dauth2018) applied this approach to estimate multiplier effects of the Queensland inshore fisheries in Australia and showed that this approach resulted in estimates of multipliers similar to those derived in previous I-O based multipliers, suggesting that such a short-cut approach can provide reliable estimates. However, they noted that the transferability of the approach to other fisheries will not be known until they are tested elsewhere.
This study applies surveys on business and household expenditure to gain insights into the scale of regional multipliers, enabling an assessment of the flow-on economic effects of the Indonesian tropical tuna fishery – a data-limited fishery. Although Indonesia has a national I-O table, it does not have regional tables. The national table is also highly aggregated in terms of fisheries-related industries, with all marine, brackish, and freshwater fish species (both captured and farmed) added together. Hence the case study presents an ideal opportunity to apply the alternative survey-based approach to generate regional multipliers for a specific fishery (i.e., tuna) under data limited conditions.
This paper is organised as follows: it first provides a background to the case study fishery and the motivation behind the development of economic indicators to assist sustainable management of tuna resources. It then presents methods for estimating multipliers and the survey instruments used to obtain the appropriate data for these. The results of the survey-based approach are compared with national-level multipliers derived from traditional I-O analyses as a form of validation. Key findings and their policy implications are discussed, highlighting the importance of considering flow-on economic impacts of a fishery on the regional economy in evaluating policy interventions. The limitations of the present study and future research needs are also discussed, followed by conclusions.
2. Case study
Indonesia is one of the world's largest producers of tuna (FAO, Reference FAO2023). The tropical tuna stocks and associated fisheries are central to food security, employment, regional economic development, and the national terms of trade. Tropical tuna species represent approximately 11 per cent of Indonesian fisheries' production by weight (Anonymous, 2022; MMAF, 2022), with an export value of around US$565 million in 2022 (Selina Wamucii, 2023). The number of tuna fishing vessels/boats in Indonesia is extremely large (estimated to be at least 300,000), consisting of both motorised and non-motorised vessels and ranging in size from less than 1 gross tonnage (GT) to as large as 198 GT (MMAF and OFP-SPC, 2021). Although the number of people engaged in tuna fisheries is not well understood, a previous study at the Bitung Oceanic Port (North Sulawesi), one of the largest tuna fishing ports in Indonesia, estimated that the fishery in that area employs approximately 6,700 people (USAID Oceans, 2018).
A large proportion of the fishing vessels targeting tuna are smaller than 30 GT, placing them under provincial and regency jurisdictions for licensing purposes. Vessels larger than 30 GT are licensed under national jurisdiction by the central government. As in many countries, jurisdictions are also defined into fishing zones; up to12 nautical miles (nm) is under provincial jurisdiction,Footnote 1 and 12–200 nm is under national jurisdiction.Footnote 2 These vessel- and zone-based jurisdictions add to the complexities of designing, monitoring, and implementing effective fisheries management for highly migratory tuna resources.
Catches by Indonesia's tuna fishing vessels include skipjack tuna (Katsuwonus pelamis), yellowfin tuna (Thunnus albacares), bigeye tuna (T. obesus), albacore tuna (T. alalunga), and neritic tunas, with bycatch such as marlins, swordfish, and dolphin fish (Proctor et al., Reference Proctor, Natsir, Mahiswara, Widodo, Utama, Wudianto, Satria, Hargiyatno, Sedana, Cooper, Sadiyah, Nurdin, Anggawangsa and Susanto2019). The fishery involves a wide variety of gear types including gillnet, hook and line, surface handline (HLS) and deep handline (HLD), longline (LL), purse seine (PS), ring net, pole and line (PL), and other small-scale gears. Coastal small-scale pole and line (called funai) and handline/hook and line tuna fisheries (collectively termed ‘one-by-one’ as they catch one tuna at a time) are traditional, low-impact methods that have been generally regarded as environmentally and socially responsible ways to target tuna, as they are highly selective with little to no bycatch, with little impact on benthic habitats, and employ a large number of people (MMAF, 2021). Due to such attributes, there is an increasing demand for products from one-by-one fisheries globally, with many retailers and supermarket brands making a commitment to supply one-by-one caught tuna and third-party sustainably certified tuna (MMAF, 2021).
Indonesia's archipelagic waters, which encompass Fisheries Management Areas (FMAs) 713, 714 and 715, supply a substantial proportion of the annual catches of two major tropical tuna species (skipjack and yellowfin tuna). Historical estimates of catches are not available for most small-scale fisheries, however, an expert workshop estimated that approximately 70–82 per cent (79 per cent or ~411,000 tonnes on average) of Indonesia's catch in the Western Central Pacific Ocean between 2016 and 2021 came from the archipelagic water, of which approximately 51 per cent was taken by small-scale gearFootnote 3 (Satria et al., Reference Satria, Sadiyah, Suadela, Hernuryadin, Christijanto, Budiarto, Pratiwi, Hoshino, Davies, Hillary and Dell2023b). Similarly, in Indonesia's exclusive economic zone (FMAs 716, 717), catches from small-scale gear during the same period account for, on average, approximately 44 per cent, followed by purse seine (42 per cent) (Satria et al., Reference Satria, Sadiyah, Suadela, Hernuryadin, Christijanto, Budiarto, Pratiwi, Hoshino, Davies, Hillary and Dell2023b). In the Indian Ocean, the fleet is dominated by purse seine and handline in the area of western Sumatra, while on the southern part of Java, Bali and Nusa Tenggara, it is dominated by the handline/troll line (TL) fleet (BRIN and MMAF, 2023). The number of small handline vessels and their catches have expanded rapidly across Indonesia in recent years (Satria et al., Reference Satria, Sadiyah, Hoshino, Sedana and Dell2023a). For instance, the proportion of the yellowfin tuna catches from small-scale handline/hook and line in the Western Pacific Ocean increased from approximately 11.1 per cent in 2014 to 54.1 per cent in 2022, while the share of the catches from large-scale longline and pole-and-line decreased from 20.9 per cent to 3.9 per cent, and from 14.9 per cent to 6.4 per cent, respectively, during the same period (WCPFC, 2022).
As a member of three tuna Regional Fisheries Management Organizations (RFMOs),Footnote 4 Indonesia has a responsibility to participate in utilizing tuna resources sustainably and support conservation and management measures adopted by the adjacent RFMOs. Recognizing the importance of effective management of tuna resources, Indonesia's Ministry of Marine Affairs and Fisheries (MMAF) initiated discussions in 2014 on the potential for developing formal harvest strategies for the management of tuna resources (Hoshino et al., Reference Hoshino, Hillary, Davies, Satria, Sadiyah, Ernawati and Proctor2020). In June 2023, Indonesia adopted a comprehensive harvest strategy framework for tropical tuna, outlining the necessary management actions for the fishery to achieve predetermined biological, ecological, and socio-economic objectives (Satria et al., Reference Satria, Sadiyah, Suadela, Hernuryadin, Christijanto, Budiarto, Pratiwi, Hoshino, Davies, Hillary and Dell2023b). The aim of a harvest strategy is to achieve the stock conservation objectives for the fishery, while providing an appropriate balance across social and economic objectives.
While the social and economic importance of the tropical tuna fishery has been recognised, Indonesia currently has limited relevant information that allows decision makers to assess the relative importance of, or dependency on, the tuna fisheries at a regional or national scale. Quantitative metrics that can be used to evaluate potential implications of a harvest strategy in meeting social and economic objectives are not currently available and therefore not considered explicitly in the harvest strategies development process. There is an increasing need to establish quantitative indicators that can be used to assess the degree of dependence on tuna fisheries in different regions of Indonesia. Only by gathering regionally relevant information can the implications of any changes in supply and demand be evaluated.
3. Methods
3.1 Input-output analysis
I-O analysis is used to estimate the net effect of a change in final demand in different sectors of the economy. The technical details of I-O multiplier estimation are given in online appendix A.
Indonesia's Central Bureau of Statistics (Badan Pusat Statistic, BPS) has released national I-O tables since 1971 and the most recent table, ‘Tabel Input-Output Indonesia 2016’ (hereafter called ‘I-O table 2016’) was released in 2021 (BPS, Reference BPS2021). It was developed in accordance with the United Nations (UN) System of National Accounts (SNA) 2008. Indonesia's I-O table describes the reciprocal relationship and interconnectedness between economic units as well as analysis of the impact of changes in consumption by households, investment by governments, and exports by companies on the economy in Indonesia (BPS, Reference BPS2021).
The Indonesian I-O table 2016 consists of 185 industries categorised under 17 industry groups. Under the Agriculture, Forestry, and Fisheries industry group, fisheries are categorised as Fish (33), Shrimp and crustacean (34), Other aquatic biota (35), Seaweed (36). Fish (33) contains production of fish species (excluding shrimp, crustaceans, and seaweed) captured or farmed in freshwater, blackish water, and marine water. Under the Processing industry group, the Dried, salted fish (55) and Fish processing and preservation (56) industries are categorised.
Two types of multipliers are estimated: Type I multipliers are the sum of the direct effect and production-induced effect; and Type II multipliers are the sum of the direct effect, production- induced effect, and consumption-induced effect. These I-O-based multipliers are generally presented separately as there is greater uncertainty around the consumption-induced effects due to heterogeneity in households' marginal propensity to consume different products as income changes (Emonts-Holley et al., Reference Emonts-Holley, Ross and Swales2021). For example, as income increases, consumption of staple products (e.g., food) is unlikely to increase proportionally. Hence, they are considered less reliable than Type I multipliers, although the omission of consumption-induced impacts would underestimate the total impact of an output change.
3.2 Survey-based approach
The survey-based approach estimates business-level production multipliers rather than national (average) multipliers. The approach is based on the Keynesian multiplier concept (Keynes, Reference Keynes2018), where the total income generated in an economy from an additional increase in income is largely determined by the marginal propensity to consume, which in turn is estimated based on the level of leakages in the economy (i.e., savings, taxes, and imports). Unlike the I-O model, which estimates a multiplier for the sector as a whole, the survey-based multiplier is estimated for the individual business, from which the distribution of multipliers for the sector as a whole can be derived.
The approach involved the collection of survey data regarding the commercial fishery cost and revenue. Each business i was asked to provide information on (i) the proportional total costs of different inputs, $j:{R_{j = 1 \ldots .n}}$ ; and (ii) the proportion of the expenditure on these purchased inputs that was made in the local region, ${\theta _{j = 1 \ldots .n}}$
 , with proportions of both bounded by 0 and 1. The proportional total cost of individual commercial fisheries' expenditure in the local region $({\rho _i})$
 is then estimated as

The revenue data collected during the surveys was used to estimate the proportion of saved revenue of each fishery $(P{S_i})$ (or ‘leakages’ due to saving and tax) and were combined with estimates of ${\rho _i}$
 to calculate the ‘multiplier’ $({M_i})$
 of an individual commercial fishery:

This measure will be equivalent to the I-O analysis multiplier estimate only if the expenditure patterns of all industries and households within the region are identical to those of the surveyed business (the assumption which would also ensure that the multiplier derived from equation (2) equals the traditional Keynesian multiplier). However, it is unlikely this assumption holds. Therefore, this business-level production multiplier does not provide general equilibrium regional multiplier information (Stoeckl, Reference Stoeckl2007). However, it has the advantage that it does not need to assume homogeneity, and hence different impacts may be realised based on which, and how, individual businesses change their production (Pascoe et al., Reference Pascoe, Innes, Tobin, Stoeckl, Paredes and Dauth2018).
These equations can also be used to estimate household-level consumption multipliers using surveys of household expenditures and their locations. That is, the proportion of household consumption of different items can be derived from the household expenditure survey, while individuals surveyed are asked where these items were purchased (i.e., locally or from other regions). While these estimates are not analytically equivalent to those generated using I-O analysis because the individual-based multiplier only considers the expenditure patterns of one business or household at a time (rather than an entire regional system of expenditure patterns) (Stoeckl, Reference Stoeckl2007), it is nonetheless interesting to compare these estimates.
The average value of business-level production multipliers generated from the survey-based approach may be similar to the Type I multiplier generated from I-O analysis because both capture the direct effect and production-induced effect of upstream industry. Similarly, the mean value of individual household-level consumption multipliers based on the surveys of household expenditures and their location could be used to estimate the total multiplier effects involving direct, production-induced, and consumption-induced effects, similar to the Type II multipliers generated from I-O analysis.
3.3 Survey questionnaire
A survey questionnaire was developed to determine expenditure patterns for the Indonesian tropical tuna fisheries. The survey consisted of six major sections including: (1) basic questions about the respondent's fishing business (e.g., types of fishers, types of gear, size of the boat, number of crew on board, etc); (2) annual- or trip-level revenue and costs (depending on whether fishers keep accounting books or not); (3) sales locations (markets); (4) business expenditure locations; (5) personal and household expenditure and the proportion of household income coming from tropical tuna fishery; (6) personal and household expenditure location. In this survey, ‘local area’ was defined as the province. In section 2, respondents were asked about either their annual- or trip-level catches of eight species groups consisting of four tropical tuna species (albacore, bigeye, skipjack, and yellowfin tuna), bluefin tuna, bait fish,Footnote 5 neritic tuna and mackerels, and others; as well as their composition in total annual catches. A copy of the questionnaire (English version) is available in online appendix B.
Ethics approval was obtained through the CSIRO's Social Science Human Research Ethics Committee in accordance with the National Statement on Ethical Conduct in Human Research (2007) (Approval number 021/21). Enumerators and the regional coordinators who oversee the enumerators were recruited from industry and NGO partners who have been participating various tuna port-based monitoring/sampling programs in Indonesia. Enumerator training workshops were carried out in November 2021 and January 2022 to ensure enumerators and regional coordinators understood the ethics requirements and the purpose of the survey, and were familiar with the questions in the survey.
The survey was first piloted with a small number of tuna fishers. The survey was fully implemented via face-to-face interview between December 2021 and March 2022 at tuna fishing ports that varied in size and loading capacity throughout Java, Nusa Tenggara, Sulawesi, Maluku and Papua islands (the first full survey). Based on their size and loading capacity, the ports are categorized into Oceanic Fishing Port (Pelabuhan Perikanan Samudera, PPS) with Category A being the largest, followed by Archipelagic Fishing Port (Pelabuhan Perikanan Nusantara, PPN), or Category B, Coastal Fishing Port (Pelabuhan Perikanan Pantai, PPP) or Category C, and Fish Landing Centre (Pangkalan Pendaratan Ikan, PPI) or Category D and Fishing port (Pangkalan Pendaratan, or PP) (hereafter called ‘larger fishing ports’). The second survey targeting tuna fishers at small (remote) landing places at the Buru Island and Maluku Tengah Island of Maluku province (hereafter called ‘small landing places in Maluku’) was carried out between March 2022 and May 2022. The locations of the survey responses collected are given in figure 1.
Sampling locations for the study.
Notes: Pink dots = 1st survey (Dec 2021–Mar 2022) covering PPS (Category A) ports of Bitung, Cilacap, Kendari; PPN (Category B) ports of Ambon, Palabuhanratu; PPS (Category C) port of Sorong; PPI (Category D) ports of Sangsit, Benoa (Kedonganan); PP (unclassified ports) of Alok, Lappa, and Sendang Biru. Blue dots = 2nd survey (Mar–May 2022) covering Buru and Maluku Tengah. The size of the circle indicates the number of responses. Three-digit numbers indicate FMAs.

A total of 379 responses was collected from the larger ports in the first survey. A high proportion (76 per cent) of respondents at larger ports were employees who did not own a boat (i.e., were either hired captains or crew). The second round of survey interviews targeting small-scale fishers collected 250 responses. In contrast to the respondents at larger ports, the majority (90 per cent) of them were the captains of their own boats, hereafter called ‘owner fishers’ (see online appendix A for more detailed characteristics of the respondents). The total number of completed responses was 629. Those respondents who did not provide information on expenditure were excluded in the multiplier estimates, although other information such as the prices of the tuna species and who financed the business costs (e.g., fuel) from all participants were used in a general analysis. A summary of respondents' characteristics can be found in online appendix A. The majority of the respondents (100 per cent at larger ports and 98 per cent at small landing places) are dedicated fishers catching tuna and tuna-like species as their main source of income.
For respondents who did not keep accounting records, annual fishing revenue and profit for individual operators was calculated using the reported average catch (kg) per trip, the average price per kilo, total number of trips, and reported business expenditure. In designing the survey, the trip level catch category was capped at 1,000 kg/trip to make it easier for enumerators to record responses and to minimise interview time, assuming that larger vessel owners would keep accounting books, and hence would report annual revenue. However, this was not the case because the majority of the respondents at larger ports were employees rather than owners. In cases when fishers reported ‘over 1,000 kg/trip’, an extrapolation was carried out (see details in online appendix A for the extrapolation method). In some instances, however, the catches of all species were reported to be over 1,000 kg/trip (23 respondents or 6.1 per cent), making the extrapolation impossible, hence they were excluded in the multiplier estimates. Around 20 per cent of operators at larger ports were estimated to make negative profits, possibly due to underestimation of catch or overestimation of operating costs. Those operators with negative profits were assumed to have made zero accounting profits in estimating business-level production multipliers. Approximately 49 per cent and 47 per cent of operators with negative profits were fishers in the 10–29 GT class and Over 30 GT class, respectively.
3.4 Regression analysis
A statistical analysis was undertaken to understand what factors may affect the flow-on impacts of individual tuna fishing operators. Regression analysis was performed with a linear specification first, followed by non-linear specification, using generalized additive models (GAMs) with the log of individual business-level production multipliers as the response variable.Footnote 6 The mgcv package in R (R Development Core Team; Wood, Reference Wood2017) was used for the analysis.
One major advantage of using an additive model, such as a GAM over a linear model, is that the fitting method automatically determines the optimal shape of the curve fit (or the degree of smoothness) for non-linear responses. The appropriate degree of smoothness was estimated using restricted marginal likelihood (REML) as the default since it is a computationally stable approach (Wood, Reference Wood2011).
The analogue of multicollinearity in the GAM setting is concurvity, which describes nonlinear dependencies among the predictor variables. Like multicollinearity in linear models, concurvity causes unstable parameter estimates in GAMs and makes the marginal effect of features harder to interpret (Ramsay et al., Reference Ramsay, Burnett and Krewski2003; Kovács, Reference Kovács2024). While collinearity does not lead to biased estimates (Walmsley and Morrissey, Reference Walmsley and Morrissey2022), several techniques have been developed to address concurvity (He, Reference He2004; Wood, Reference Wood2008; Gu et al., Reference Gu, Kenney and Zhu2010; Kovács, Reference Kovács2024). We used the direct GAM fitting approach of Wood (Reference Wood2008) which estimates coefficient variances directly, thereby sidestepping the well-publicized problem of concurvity-driven variance underestimation (Wood, Reference Wood2008). Wood (Reference Wood2017) proposes indices of concurvity in GAMs in the ‘concurvity’ function in mgcv package. The concurvity values are bounded between 0 and 1, with 0 indicating no concurvity and 1 indicating total lack of identifiability. Marín-Enríquez et al. (Reference Marín-Enríquez, Ramírez-Pérez, Ruiz-Domínguez, Izquierdo-Peña, Sánchez-Cárdenas, Cruz-Escalona and Enciso-Enciso2023) used a tolerance threshold of 0.7 for concurvity, while Kovács (Reference Kovács2024) used 0.5 as a cut-off to remove a variable from a GAM. Gillnet and ‘other gears’ were excluded from the regression analysis due to their small sample sizes. We first considered profit and revenue (both log-transformed), gross tonnage, gear types, and port class as explanatory variables.
The tests for concurvity in the initial exploratory GAM, involving smooth terms for log profit and log revenue, suggest that they are highly correlated, i.e., concurvity values of 0.66, hence it may be difficult to interpret the marginal effect of profit and revenue because the response variable (business-level production multiplier values) could be responding to either one of them. For this reason, we also considered a reduced model where the smooth term for log revenue was removed from the initial model.
We also considered more complex models with interaction terms to increase the model's predictive power. In selecting which model describes the observed multiplier values the best, we consider two measures of fit: the Akaike Information Criterion (AIC) for model fit; and the percentage deviance explained. When we have reasons to favour simpler models over more complicated ones, an additional chi-square-based hypothesis testing approach was used to test the significance of improvement from a simpler model to a more complex model (Wood, Reference Wood2011). The summary of the models considered in describing the observed business-level production multipliers is given in table A2 in the online appendix.
Among the six models considered, model 5 had the lowest AIC and the highest percentage of deviance explained (86.3 per cent), suggesting that the model can explain 86.3 per cent of variation in observed business-level production multiplier values (table A3). Therefore, we chose model 5 as the best model in describing the observed business-level production multipliers. The diagnostic plots (figure A6) suggest that while residuals have slight fat tails, the residuals are centred around zero and largely symmetric, thus it was considered that the basis dimension choices are adequate.
4. Results
4.1 Multipliers generated from the Indonesian I-O table, 2016
The output multipliers generated from the Indonesian I-O table 2016 are presented in table 1. The Type I multiplier for the aggregated Fish (33) industry was 1.33, comprising the direct effect plus the production-induced rounds of extra output. This means that for every additional $1 output of Fish produced, an additional $0.33 is generated in the Indonesian economy through input use. An additional $0.53 is generated by consumption-induced effects. Hence, the Type II multiplier for the Fish industry is 1.86.
Estimated output multipliers from the Indonesian I-O table, 2016

The multiplier for the Fish (33) industry is slightly higher than for the Shrimp and crustacean (34) industry but smaller than the Fish processing industry (2.54) (table 1). This is consistent with the results of a global study by Jacobsen et al. (Reference Jacobsen, Lester and Halpern2014), who reported that the seafood processing industry generally had higher multiplier values than the aquaculture and commercial capture fishing industries. The multiplier value for the Fish industry in Indonesia is similar to the global average multiplier of 1.82 in marine industries (Jacobsen et al., Reference Jacobsen, Lester and Halpern2014), but smaller than the average multiplier of 2.67 for capture fishery in Asia (Dyck and Sumaila, Reference Dyck and Sumaila2010).
4.2 Multipliers generated from the survey-based approach
The mean value of the individual business-level production multiplier for all respondents who provided expenditure information was estimated at 1.30 (× table 2). The mean value is very similar to the value of the Type I multiplier of 1.33 for the Fish industry generated from the Indonesian I-O table, which falls within the 95 per cent confidence interval (CI) (1.27–1.34) of the estimated mean value of the survey-based approach.
Individual business-level production multiplier by provinces

Notes: CI, confidence interval. Survey locations are in parentheses. Gorontalo and North Maluku are not shown due to small sample sizes.
At the provincial level, the highest mean business-level production multiplier was observed at Cilacap in Central Java (1.84, with 95 per cent CI 1.65–2.02) – an Indian Ocean port (see figure 1) – while those at Bitung in North Sulawesi adjacent to the Indonesian archipelagic water was approximately 15 per cent lower than the overall average (table 2), despite both being in the largest port A category. However, there was considerable variability in multiplier values among operators (as indicated by the height of the boxplot in figure 2), which may be attributed to the characteristics of vessels or operators. The regression analysis in the following section may provide further insights to explain these regional differences. Due to small sample sizes at some locations, however, provincial-level multiplier values need to be interpreted with caution.
Distribution of individual business-level multipliers for respondents.
Notes: Results for Gorontalo, North Maluku, Southeast Sulawesi, and West Papua are not reported in the figure due to small sample size. Red dot points represent the mean, the lines in the box represent the median, and the height of the box represents the interquartile range.

The mean individual household-level consumption multipliers across all respondents were estimated to be approximately 3.39 (3.18–3.60, 95 per cent CI) (table 3). This indicates that for every $1 of income generated by the fishery (i.e., crew payments, owner share), an additional $2.39 was generated locally on average.
Individual household expenditure multiplier by province where business was located

Notes: CI, confidence interval. Survey locations are in parentheses. Gorontalo, North Maluku and West Papua are not shown due to small sample sizes.
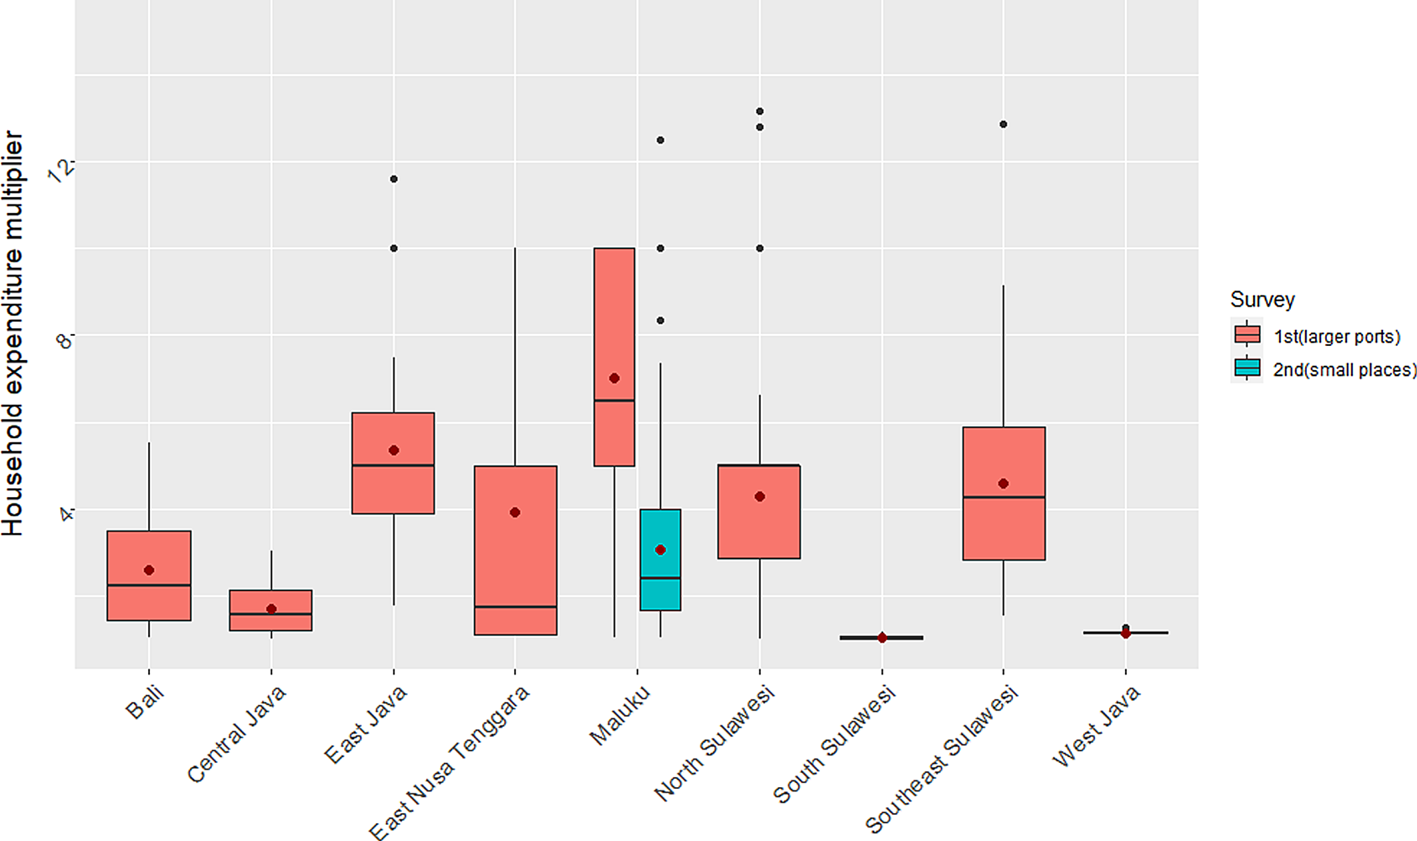
The mean value of household-level consumption multipliers was much lower at Palabuhanratu in West Java and Cilacap in Central Java – category B and A ports in the Indian Ocean – and also at the unclassified smaller port of Lappa in South Sulawesi, ranging between one third to one half of the overall average across all sampled regions (table 3 and figure 3). In Southeast Sulawesi (Kendari) and North Sulawesi (Bitung) – both category A ports – the multipliers were higher (approximately 36 to 59 per cent higher), although there was considerable variation among participants (as indicated by the height of the boxplots in figure 3).
Distribution of individual household expenditure multipliers by province where the business was located.
Notes: A small number of extreme outliers were removed to increase legibility of the graph. Red dot points represent the mean, the lines in the box represent the median, and the height of the box represents the interquartile range.
The mean values of the household-level consumption multiplier reported above are income-based (i.e., the multiplicative effect relative to income), but can be converted to an output-based multiplier if the proportion of income generated per dollar of output (boat revenue) is known. While we do not know such information across the whole Indonesian tuna fishery sector, we estimate the proportion of income generated per dollar of output of the respondents in our surveyFootnote 7 at the small landing places in Maluku islands to be 0.79 on average (with a standard deviation of 0.094). Multiplying this value by the mean value of income-based consumption effect (2.39) gives the mean consumption-induced effect relative to output of 1.89, with the lower and upper 95 per cent CI of 1.72 and 2.06, respectively, based on the product of variance formula (Goodman, Reference Goodman1960). Given this, the average total multiplier effect (involving direct, production-induced, and consumption-induced effects) is estimated at 3.19 (95 per cent CI 3.02–3.36). This suggests that the total economic impact from the tropical tuna industry is roughly three times higher than the value of production when cascading impacts are accounted for.
4.3 Factors affecting business-level production multipliers
Since the non-linear models were better at explaining the variation in observed multiplier values than the linear models, we only present the summary results for the selected non-linear model.
The detailed regression results for the selected model and figures showing marginal effects are presented in table 4, and figure A7 in the online appendix, respectively. It was found that operators for some gear types (PS, HLD and TL) have higher multiplier values with higher profit (figure A7), all other things being equal (ceteris paribus), but the interaction between gear and profit was not always significant (table 4). The 2D plot of revenue and profit illustrates a non-linear interaction between them, where the predicted multiplier values are the lowest at high values of profit and lower values of revenue (figure A7). Such an apparent opposite effect on predicted outcomes and a potential issue associated with high concurvity makes it difficult to interpret their marginal effects.
Regression results of business-level production multipliers based on the selected model

Notes: HLD, deep handline; HLS, surface handline; LL, longline; PL, pole and line; PS, purse seine; TL, troll line; EDF, effective degree of freedom; Ref.df, Reference degree of freedom used in computing test statistics and p-value. The estimated coefficients are compared against boats less than 1 GT, deep-set handline (HLD), and port class A operators.
In terms of the impact of boat size, the operators of small boats (<1 GT) (base case) had significantly lower multiplier values, ceteris paribus, as indicated by the positive coefficients of the other size classes against the base case operators, although the difference between 1–4.9 GT and less than 1 GT boat operators is not statistically significant (table 4). A wide 95 per cent CI for boats over 30 GT (dotted lines in Gear in figure A7) indicates a large uncertainty in the estimated coefficient (e.g., an overlap of CI with other estimated coefficients indicates that the difference in estimates between the groups was not statistically significant).
Gear also had a significant impact, with HLD operators (base case) having significantly higher average business-level production multiplier values than that of LL, TL, and PS, ceteris paribus (table 4, and figure A7 in the online appendix). Similarly, PL operators had significantly higher average multiplier values than LL and TL (table 4 and figure A7). Pole and line operations typically require live bait from local sources, compared to longline operations that tend to use frozen bait (e.g., imported squid) suitable for a longer journey. The operators with businesses located at port class A (base case) – the largest class port category – had significantly lower multiplier values than other port categories, ceteris paribus (table 4 and figure A7). This may reflect the economic conditions where the port is located, since large ports are typically located in more urban areas and may have better road access, which makes it easier for operators to access inputs outside of the local area (e.g., cheaper fuel, imported baits).
5. Discussion
This study extends the application of the survey-based approach of Stoeckl (Reference Stoeckl2007) to estimate multiplier impacts of the Indonesian tropical tuna fisheries. Our study is the second application of this approach in fisheries after Pascoe et al. (Reference Pascoe, Innes, Tobin, Stoeckl, Paredes and Dauth2018) and is the first in a data-limited fishery in a developing economy.
The mean business-level production multiplier generated from the survey-based approach was very similar to the Type I multiplier based on the conventional IO-based approach, although the I-O analysis is based on an aggregated fish industry and not just tuna. The differences in value for the production and consumption multipliers generally relate to differences in the cost structure of the sector (Norman-López et al., Reference Norman-López, Pascoe and Hobday2011), so we expect different values of production multipliers for different fisheries if their business cost structures are considerably different. In contrast, there was a large discrepancy between the consumption-induced effects from the survey-based approach and the Type II multiplier generated from I-O analysis. The survey-based consumption-induced effects were approximately 70 per cent higher than the I-O analysis estimates. This difference reflects not only the different cost structure of tuna fishing compared with fishing in general, but also the savings habits of tuna fishers, as well as the relative availability of consumption goods in the tuna fishing ports and other landing areas. In our survey, the small-scale surface handline tuna fishers in Maluku were mostly owner fishers with a one-man operation, with little to no labour cost (see online appendix A). In addition, small-scale tuna fishers in Indonesia have high reliance on middlemen/suppliers who provide key inputs such as fuel, ice, and other running costs in exchange for guaranteed supply or lower prices (Duggan and Kochen, Reference Duggan and Kochen2016), hence a higher proportion of boat revenue is captured as income. Their remote location means that the fishers spend their business and household expenditure almost exclusively within the local area (online appendix A), which positively affects the regional multiplier estimates. The higher estimated average annual income of our sampled small-scale tuna fishers, relative to the minimum wage in the region,Footnote 8 is also likely to affect the expenditure patterns of tuna fishing households.
Making a direct comparison between multipliers derived from I-O analysis and those obtained from surveys is challenging due to methodological differences, including the variation in aggregation methods, scope and temporal/spatial variation in sampling locations, assumptions on homogeneity in production technologies and households' consumption propensity, among others. One notable caveat for any survey-based approach is a potential sampling bias. Our sampled fishers at small landing places in Maluku (where we derived the proportion of income generated per dollar of output) may not be representative of the whole tuna fishing households within the country. Therefore, the total multiplier effect including consumption-induced effect estimated here needs to be considered as indicative only.
Notwithstanding these challenges, Stoeckl (Reference Stoeckl2012) found that the multipliers derived from the two approaches for the Western Australian industries were very similar, and where disparities did exist, they were largely attributed to differences in the underlying production technologies. I-O tables generally reflect the economy with a time lag (e.g., 5-year lag for benchmark US I-O table) (Miller and Blair, Reference Miller and Blair2009), even though production technologies can structurally change during that time. A number of ‘extended’ I-O models that account for some heterogeneity in businesses and households have been developed (e.g., Kim et al., Reference Kim, Kratena and Hewings2015; Emonts-Holley et al., Reference Emonts-Holley, Ross and Swales2021; Oosterhaven, Reference Oosterhaven2022). Also, more sophisticated computable general equilibrium (CGE) models that allow for other industries, prices and costs to adjust in response to the change in the industry of concern have been developed. The latter have gained popularity as an alternative to the I-O approach in regional policy analysis (Ghaith et al., Reference Ghaith, Kulshreshtha, Natcher and Cameron2021). However, the complexity of creating the consistent data tables and the high demand for data to construct these models continue to be the major constraint for their wider adoption by practitioners in developing economies (Ghaith et al., Reference Ghaith, Kulshreshtha, Natcher and Cameron2021; Akbari et al., Reference Akbari, Failler, Pan, Drakeford and Forse2023). These complexities also generally result in higher levels of aggregation.
The survey-based approach applied here provides quantitative indicators that can be used to assess the degree of dependence on fisheries in different regions of Indonesia, allowing regional comparisons of multipliers in the absence of regional I-O tables. Unlike the I-O-based approach that provides a single ‘average’ multiplier value, the alternative approach provides a range of multiplier values recognising heterogeneity among fishing operators, which can be then used to assess the factors that may affect such flow-on impacts. Understanding the differences in multiplier effects across sectors can help policymakers tailor interventions more effectively, allocate resources strategically to areas of greatest need, and foresee any unintended consequences stemming from policy decisions. This is particularly important if management decisions affect some components of the fleet differently (e.g., either vessel size, type or location), in which case an ‘average’ industry-wide multiplier will distort the estimate of the regional impact.
The Indonesian tropical tuna fishery is going through changes in fleet structure driven by a series of ministerial regulations since around 2016 to combat illegal fishing activities by large foreign-owned vessels (Hoshino et al., Reference Hoshino, Satria, Sadiyah, Yunanda, Suadela, Proctor, Dell and Davies2024). This has resulted in a reduction in the number of active large vessels over 30 GT. Increasing market demand for one-by-one fisheries, together with the protection for small-scale fishers (nelayan kecil)Footnote 9 under the national lawFootnote 10 has also resulted in a rapidly increasing number of and catches from small-scale tuna vessels, particularly handlines. The number of pole and line operators has declined in recent years due to difficulty in sourcing sufficient supplies of live bait, and increased competition with other fleets, such as small pelagic purse seiners and Danish seiners (Satria et al., Reference Satria, Sadiyah, Hoshino, Sedana and Dell2023a). Our results indicate that such changes in fleet structure could result in unexpected changes in flow-on economic impacts on the regional economy.
For example, we found that Cilacap (Central Java) had the highest level of production-induced multiplier on average, which may be explained by the relatively high concentration of mid-size vessels (10–30 GT) in our samples. Similarly, in Maluku province, where tuna vessels are predominantly surface handlines less than 5 GT, the average business-induced multiplier was relatively lower. The policies that favour a segment of the tuna fleet (e.g., certain size or type of gear) and provide disincentives for those fisheries with a higher production-induced multiplier may inadvertently result in negative impacts on the local economy.
Other considerations are also required when assessing regional impacts of management changes that are not captured by either the I-O or the survey approach. Non-monetary expenses such as unpaid labour (e.g., family member), and non-cash payment (e.g., fish for own or crew consumption) are not captured in either economic multiplier estimation, and separate metrics (e.g., food security) are necessary to evaluate these well-recognized contributions of small-scale fisheries to rural livelihoods (e.g., Béné, Reference Béné2006; Béné et al., Reference Béné, Macfadyen and Allison2007). We suggest that future studies consider monitoring and evaluating the implications of changing fleet dynamics on the regional and national economy, along with their impacts on resource sustainability. A potential next step is to extend the study to assess the trade-offs among candidate harvest strategies with specific management measures applied to a subset of the Indonesian tuna fleet (e.g., introducing a catch limit for large industrial-scale boats only or specific gear type) in achieving management objectives in a simulation evaluation framework (i.e., Management Strategy Evaluation), with an explicit inclusion of the flow-on economic contribution. Using such information, management policies can be structured to minimise unintended consequences and avoid disproportionally impacting any particular region or community.
Due to the limited household income information from the survey and the absence of disaggregated national/regional household income data that separates tuna fishing households from other fisheries households, a statistical analysis was not undertaken to unpack what factors may contribute to consumption-induced multipliers of tuna fishers. Such an analysis would provide further insights and potentially explain the regional differences in total multiplier effects. It is worth noting that the ability of survey respondents to recollect the exact amount of tax and saving may have been inaccurate, with low levels of tax and saving leading to higher consumption-induced multiplier values since it assumes that there is little income that ‘leaks out’ (e.g., almost all income is spent in the local economy). Further data validation using the average levels of tax and savings based on national or regional statistics would be useful to reduce uncertainty and bias in the estimates of the total multiplier effects using the survey-based approach.
Another issue encountered was the potential underestimation of catches and negative estimated profits for those operators working on larger boats and who did not keep accounting books and those who reported the catch over 1,000 kg/trip. Our results are likely to be less accurate for those regions that host larger boat operators over 30 GT boats. This could be avoided through better survey designs and more rigorous pilot surveysFootnote 11 in the future. There is, however, a limitation to the port-based survey data collection method resulting from the fact that owners of larger companies may not fish themselves and may not be available for interviews. A different data collection mechanism to collect financial information from larger fishing companies is recommended for future study. The approaches we applied here could be extended to measure production-induced impact from ‘downstream’ industries (such as processing). Consideration of additional flow-on impacts that may arise from downstream industries not captured in this study (including employment multipliers) is required to estimate more comprehensive economic flow-on contributions from the tropical tuna fishing industry.
6. Conclusions
In many low-income and developing coastal economies, the availability of economic data that can be used to support fisheries management is often limited. We show that a survey-based approach can provide useful indicators that can be used to assess the economic multiplier effects for a particular fishery, even when information to undertake more formal economic analysis is unavailable. For our case study of the tuna fishery, the average business-level production multipliers generated from the survey-based approach was very similar to the Type I multiplier generated from more conventional I-O analysis, further supporting the findings from previous studies. These business-level multipliers provide managers with quantitative information to assess the degree of dependence of regional economies on tuna fisheries, allowing them to formulate tailored policy interventions that avoid/minimise unintended consequences from policy changes in particular regions or communities. However, the estimates for large operators and consumption-induced effects (and resulting total multiplier effects) are less reliable due to the survey design issues and lack of national/regional level financial information (i.e., household income for tuna fishers) that are likely to affect expenditure patterns of households. We suggest that future research consider collecting additional financial information from large tuna fishing operations through survey and attempts to create disaggregated economic accounts that include different fishing households in Indonesia.
Supplementary material
The supplementary material for this article can be found at https://doi.org/10.1017/S1355770X2400024X.
Acknowledgements
This study was funded by the Walton Family Foundation (Grant number 00101981) and CSIRO. We thank all the stakeholders and MMAF staff who contributed and participated in the study, particularly Mr. Muhammad Anas (Division of Fisheries Statistics, DGCF-MMAF), enumerators and regional coordinators of the Masyarakat dan Perikanan Indonesia (MDPI), Yayasan IPNLF Indonesia (YII), and Yayasan Konservasi Alam Nusantara (YKAN). We also thank the staff of the Research Institute for Marine Fisheries (RIMF), PPS ports of Bitung, Cilacap, Kendari; PPN ports of Ambon, Palabuhanratu; PPS port of Sorong; PPI ports of Sangsit, Benoa (Kedonganan); PP of Alok, Lappa, and Sendang Biru; landing sites of Buru and Maluku Tengah.
Competing interest
The authors declare none.


 Open access