

Introduction
In the world's forest lands, lichens provide a variety of ecosystem services, including contributing to forest nutrient recycling and soil formation (Jackson Reference Jackson2015; Asplund & Wardle Reference Asplund and Wardle2017). The presence of lichen epiphytes also increases the complexity of available forest micro-niches, on which many forest organisms depend for habitat and resources (Asplund et al. Reference Asplund, Larsson, Vatne and Gauslaa2010; Nybakken et al. Reference Nybakken, Helmersen, Gauslaa and Selås2010; Bokhorst et al. Reference Bokhorst, Asplund, Kardol and Wardle2015). However, the habitat requirement for epiphytic lichens per se often differs from that of many other forest organisms due to their preference for very specific microhabitats (Klein et al. Reference Klein, Thor, Low, Sjögren, Lindberg and Eggers2020).
In forest environments, lichen communities are largely determined by four environmental variables: humidity, light, bark chemistry and bark structure (Ellis Reference Ellis2012). These variables are directly influenced both by the individual tree that a lichen inhabits, as well as by the surrounding vegetation composition and resultant environmental conditions. As a result, the species richness of lichens is often higher in forests that provide a larger variety of tree species and associated structures (Kuusinen & Siitonen Reference Kuusinen and Siitonen1998). Forests which successfully provide such conditions, including a variety of tree species, covering a range of different ages resulting in complex gradients of light and humidity, are more often associated with old natural forest conditions (Kuusinen & Siitonen Reference Kuusinen and Siitonen1998). A long continuity of old-growth forest conditions is also needed by those lichen species requiring a long time to establish (Hilmo et al. Reference Hilmo, Holien, Hytteborn and Ely-Aalstrup2009). Likewise, old slow-growing individual trees (e.g. suppressed trees) tend to have a higher richness of lichen species (Lie et al. Reference Lie, Arup, Grytnes and Ohlson2009; Marmor et al. Reference Marmor, Torra, Saag and Randlane2011), including rare and red-listed species (Johansson & Gustafsson Reference Johansson and Gustafsson2001). In near-natural conifer forests, where there is a high proportion of old-growth trees, dead wood and snags, the richness of epiphytic lichens can be especially high (Johansson Reference Johansson1997).
In Sweden, few areas with natural forest conditions remain. Instead, most forest land outside of protected areas is managed using intensive forms of forestry. Sixty percent of productive forest land consists of planted forest, managed primarily for the purpose of producing wood, pulp and energy (FAO 2020; Felton et al. Reference Felton, Löfroth, Angelstam, Gustafsson, Hjältén, Felton, Simonsson, Dahlberg, Lindbladh and Svensson2020b). To increase productivity and profitability, stands are often harvested by clear-cutting, usually before the age of 100 years in northern Sweden and 60–80 years in southern Sweden. Scots pine (Pinus sylvestris) and Norway spruce (Picea abies) are the two most commonly used production tree species, together comprising c. 80% of standing volume. Norway spruce is usually planted on mesic and moist sites with intermediate and high fertility soils, whereas Scots pine is favoured on mesic and dry sites of intermediate or low fertility. However, extensive browsing from ungulates on Scots pine seedlings has led to a shift towards more Norway spruce in southern Sweden (Felton et al. Reference Felton, Petersson, Nilsson, Witzell, Cleary, Felton, Björkman, Sang, Jonsell and Holmström2020a). Sweden's planted conifer forests are most commonly managed as monocultures, with manual tending before canopy closure. The stands are usually commercially thinned one or two times, reducing stem density over the rotation from c. 2000 planted seedlings hectare−1 to c. 800 trees hectare−1 at the time of the final harvest.
Commercially managed stands resulting in even-aged conifer forests with short rotation periods are unlikely to provide suitable forest conditions for the development of a rich, or rare, community of epiphytic lichens (including specialist species dependent on old-growth trees, heterogeneous structure in tree species and age, and slow-growing trees). Likewise, if the intensity of forestry practices increases further this century, resulting in even denser stands with faster growing trees (Felton et al. Reference Felton, Löfroth, Angelstam, Gustafsson, Hjältén, Felton, Simonsson, Dahlberg, Lindbladh and Svensson2020b), then this may further limit the contribution of production forest lands to epiphytic lichen diversity. Nevertheless, since the vast majority of forested area in Sweden is conifer forest dedicated to production, these environments represent the majority of available forest habitat for epiphytic lichens. For this reason, understanding the specific circumstances under which lichen diversity may be enhanced or diminished in these lands is essential for providing evidence-based guidance to forest managers seeking to increase the biodiversity contribution of production forests.
Here we set out to fill such knowledge gaps by examining epiphytic lichen species richness and community composition in the conifer plantations of southern Sweden. To do so we surveyed a chronosequence of living trees in Scots pine and Norway spruce stands (30, 55 and 80 years of age) to investigate differences in 1) lichen species richness, 2) the prevalence of different lichen growth forms, 3) lichen community composition and 4) red-listed and other species of conservation importance. Differences were evaluated at three distinct spatial levels: stand, individual tree level, and within different heights and aspects of the lower 2 m of the tree trunk.
Materials and Methods
Study area
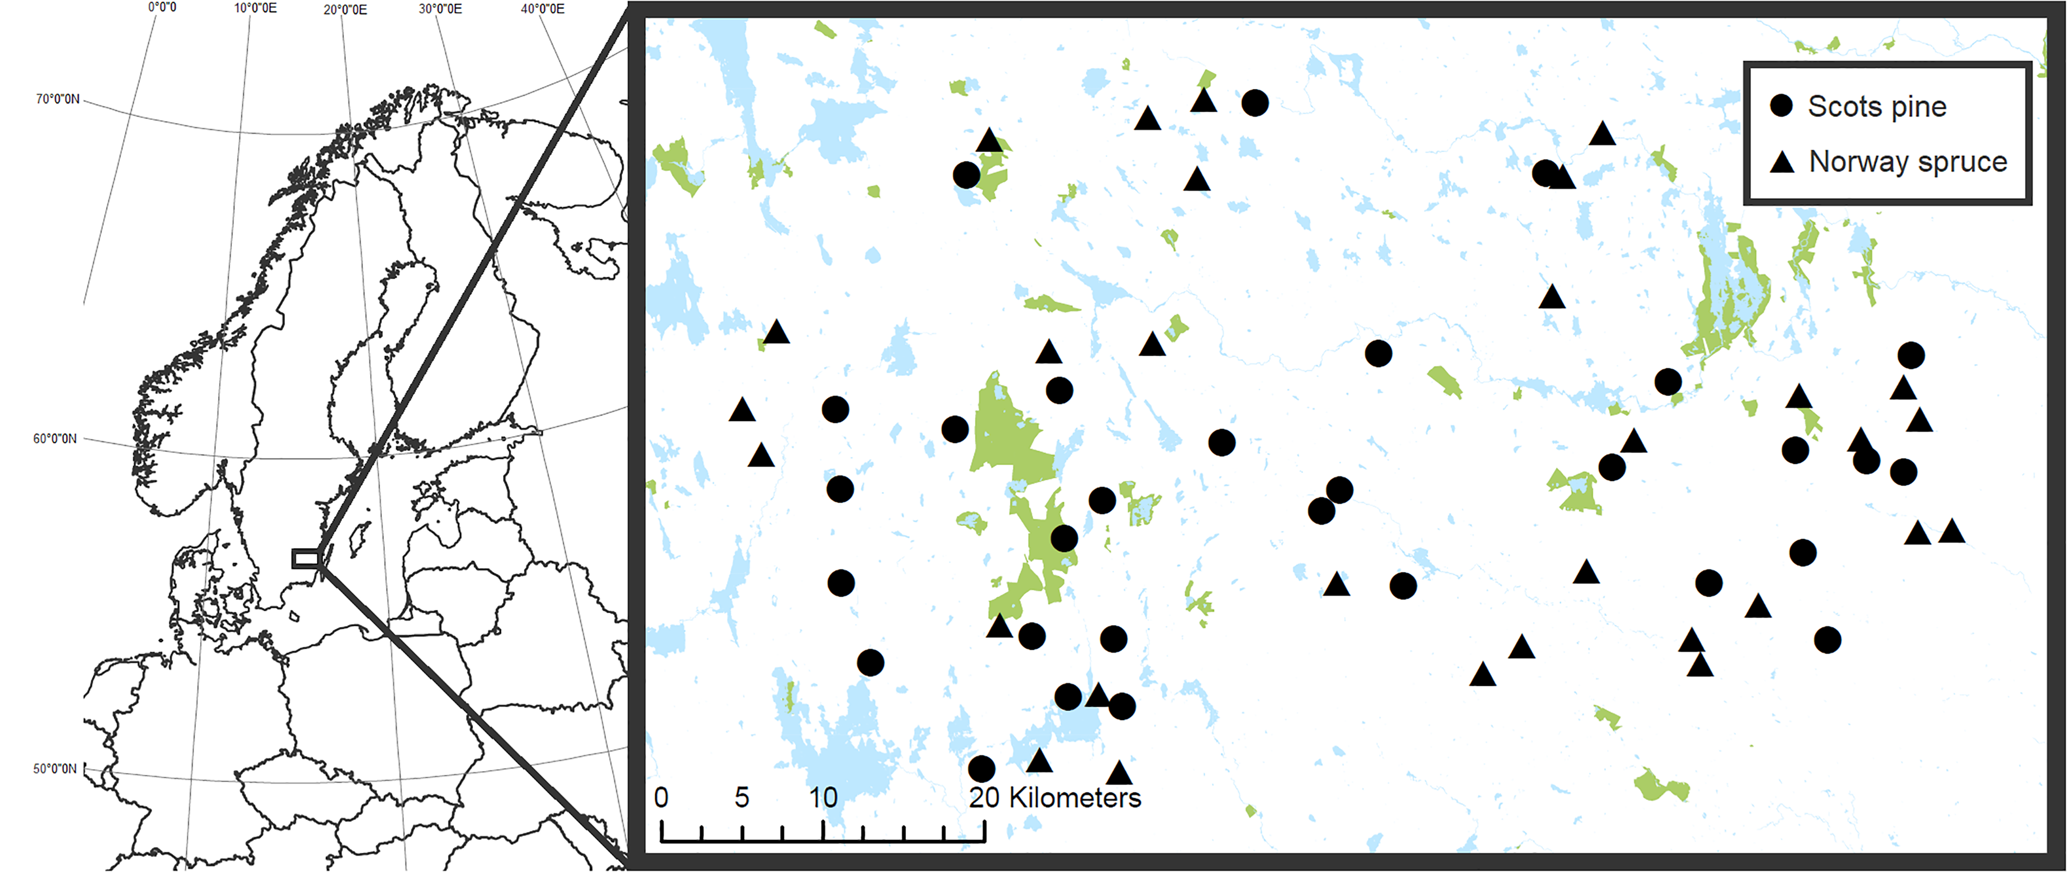
The study area is located in the hemiboreal zone (Ahti et al. Reference Ahti, Hämet-Ahti and Jalas1968) of southern Sweden (Fig. 1). In this area, annual precipitation ranges from 800 mm in the west to 600 mm in the east. During summer (June–August), the mean monthly temperature ranges from 6–15 °C, with the lowest mean monthly temperature during winter of −1 °C (SMHI 2019). Historically, forests in this region have mainly been used for livestock grazing, dimensional cutting for timber, and firewood. The higher demand for forest products, in combination with agricultural decline starting from the mid-20th century, has increased the area of production forest land (Kardell & Henckel Reference Kardell and Henckel1994; Kardell & Wennerberg Reference Kardell and Wennerberg2004). Today, production forestry is the dominant land use of this region and only 2% of the area of productive forest land (i.e. potential tree growth > 1 m3 ha−1 year−1) is formally protected (Nilsson & Cory Reference Nilsson and Cory2016).
Location of the 30 Scots pine (circles) and 30 Norway spruce (triangles) stands included in the study in southern Sweden. The blue (paler) areas in the map represent water and the green (darker) areas show formally protected land. Protected areas in this map include both fully and partially forested land which are located on both productive (potential tree growth > 1 m3 ha−1 year−1) and unproductive land. © Lantmäteriet. In colour online.
Stand selection
Production stands of Scots pine (30 stands) and Norway spruce (30 stands) were selected (i.e. 60 stands in total). Only stands with a basal area (BA) > 80% of either Scots pine or Norway spruce were kept for the final selection. More information about forest stand tree species composition and understorey properties can be found in Petersson et al. (Reference Petersson, Holmström, Lindbladh and Felton2019). The stands belong to three different stand age classes, 30 (± 5) years, 55 (± 5) years and 80 (± 5) years (i.e. 10 replicates of each tree species and age category), and were selected to capture variation between early, mid and late rotation stands. Stand area ranged between 2.8–31.7 ha.
In order to locate stands on intermediate fertile soils, on which both Norway spruce and Scots pine can be found (and likewise reduce between stand-category differences in soil fertility), we used the site index (SI) of the stand, as provided by forest management plans. The SI equates to a stand's projected dominant height in metres at the age of 100 years, and is a commonly used tool for evaluating and comparing forest site productivity for a given tree species. To represent stands located on intermediate fertile soils, site index (SI) was restricted to 24–29 for Norway spruce. The SI for Scots pine stands was transformed into the corresponding SI for Norway spruce according to Hägglund & Lundmark (Reference Hägglund and Lundmark2003). In addition, to minimize edaphic variation between stands, we also restricted our selection to stands on till soils, with either rhyolite or granite bedrock (SGU, bedrock map, soil type map 1:25 000–1:100 000). Historical land use of forest stands can vary in this part of Sweden and many of today's forest stands occur on lands previously managed as pastures, meadows and crop fields. To minimize differences in previous land use, we discarded stands identified as being first generation forest land, based on historical maps (Swedish land survey: Ekonomiska kartan 1941–1949). However, this could not be done for the oldest stands because of the absence of suitable maps from that time period.
Individual tree selection
The lichen inventory was conducted during June–October 2017. In each stand, circular sample areas (used to measure stand structural variables; see below) were randomly distributed no closer than 25 m from each other, and at a minimum of 30 m from the forest edge. From the centre of the sample area, the closest tree (one tree per sample area = ten trees per stand) of the same tree species was selected as sample tree for the epiphytic lichen survey. Because the aim of the study was to examine living trees of specific species and age categories, only living trees were selected. This excluded dead trees and also trees from the stand edges, since they might be influenced by other types of environments. In every stand ten trees were selected in this way, resulting in a total of 600 sample trees (300 Scots pine, 300 Norway spruce). DBH (diameter at breast height, 1.3 m above ground) was measured on each of the trees.
Lichen species survey on lower tree trunks and branches
Epiphytic lichens (presence/absence) were surveyed up to 2 m on the tree trunk. Additional species which occurred only on branches (up to the same height) were added separately to the protocol. The lichen survey was conducted by LP. Unidentified specimens were collected for subsequent identification. Lichen species nomenclature follows Westberg et al. (Reference Westberg, Moberg, Myrdal, Nordin and Ekman2021). Some of the more frequently encountered species that were hard to separate in the field were assessed at the genus level (as ‘genera complexes’) in the analyses: Bryoria capillaris and B. fuscescens as Bryoria spp., Usnea dasopoga and U. hirta as Usnea spp. and all species of Lepraria as Lepraria spp.
Lichen abundance survey in tree trunk plots
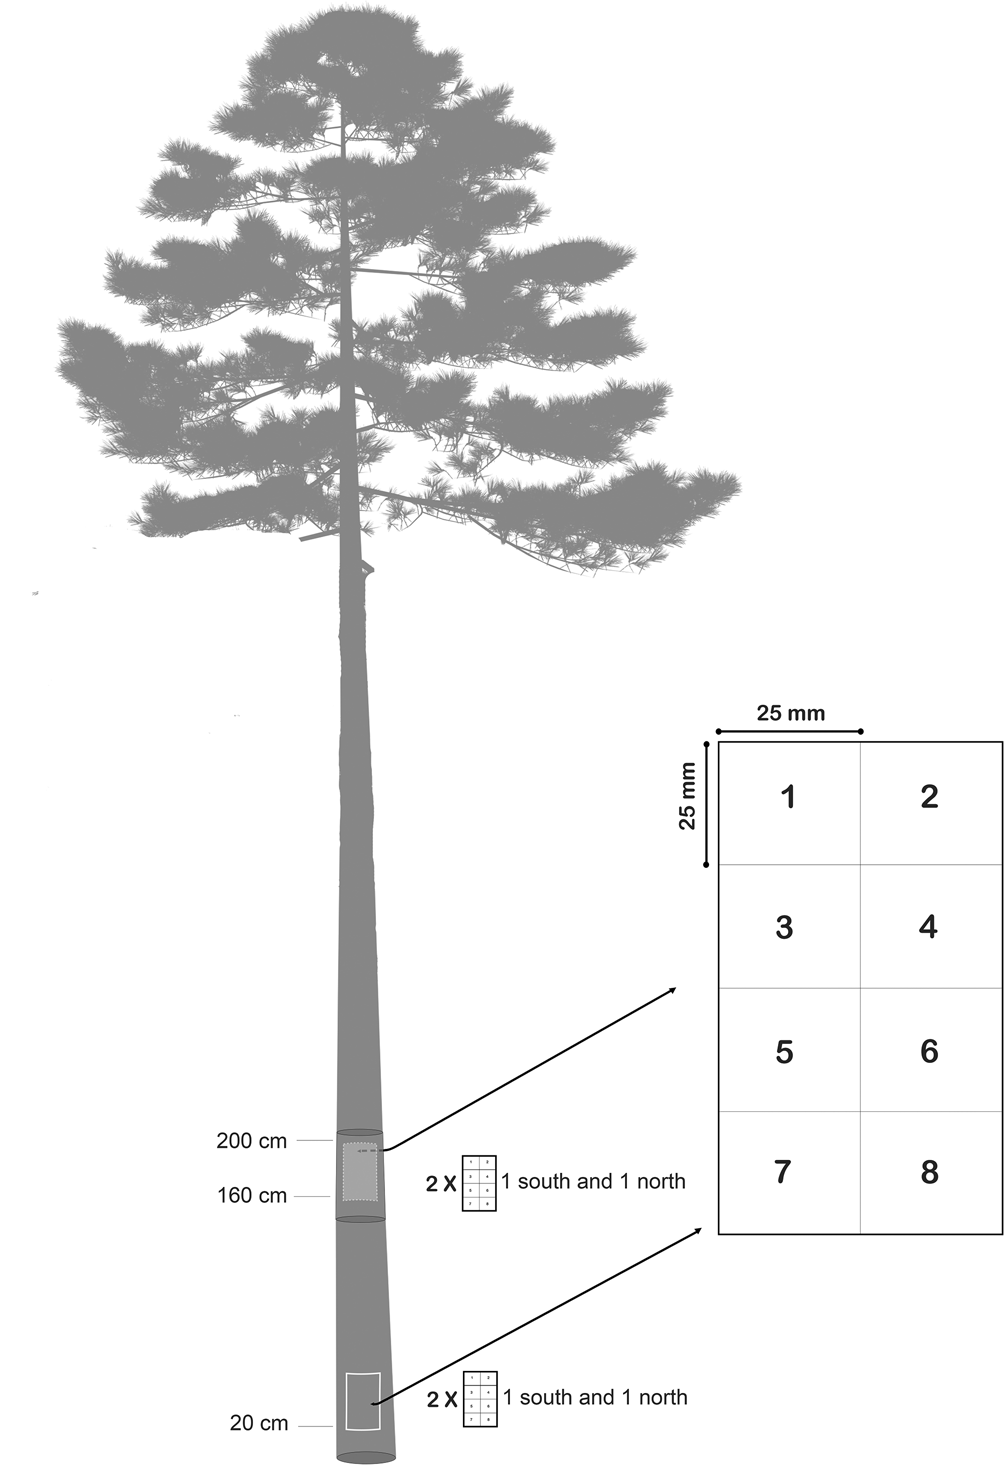
To estimate the abundance of the different lichen species, the occurrence of each species was quantified as the number of occurrences of lichen thalli in a plot consisting of eight subplots, each 25 × 25 mm (Fig. 2). This method for estimating species frequency is a modified version of Bäcklund (Reference Bäcklund2016). To enable examination of the lichen communities’ dependency on trunk aspect and trunk height, the plots were placed on four different locations on each tree: southern side base of trunk, southern side upper part of trunk, northern side base of trunk and northern side upper part of trunk. The very lowest part of the trunk is often overgrown with bryophytes, terricolous lichens and sometimes understorey vascular plants. To avoid competition from these species groups affecting the survey, the lowest plots were placed 20 cm above ground level. For convenience when surveying the plots, upper trunk plots were placed at eye level (i.e. c. 160 cm above ground).
Epiphytic lichens were sampled in four plots per tree to measure abundance. Plots were placed on the southern side base of the trunk, northern side base of the trunk (20 cm above ground level), eye-level northern side and eye-level southern side (c. 160 cm above ground level). Presence of lichen thalli was registered as the number of occurrences in the subplots 1–8 for every species. The method of estimating lichen abundance is modified from Bäcklund (Reference Bäcklund2016).
Stand structure measurements
The forest density, basal area (m2 tree cover ha−1), was calculated based on the measured DBH of the trees within the sample areas. The size of the 600 sample areas was adjusted to stand tree age and height, using a 7.5 m radius in the 30-year-old stands and a 10 m radius in the 55- and 80-year-old stands. When there were less than five trees (which sometimes occurred in the 80-year-old stands), the measured area was expanded to 15 m. In each centre of the sample areas, a hemispherical photograph was taken at 1 m above ground level. Canopy cover was calculated using these photographs in Gap Light Analyzer (Frazer et al. Reference Frazer, Canham and Lertzman2000), excluding the two outer rings of the circular grid to avoid the inclusion of ground vegetation in the analysis.
Statistical methods
Statistical analyses and figures were performed in R (R Core Team 2020). We analyzed lichen diversity, both as a univariate response variable (species richness) and as a multivariate response variable (species community composition). More detailed information about the different models can be found in the Supplementary Material File S1a & b (available online).
Species richness and community composition
Species richness was calculated both as the total number of lichen species found on each of the sample trees and at stand level. Tree-level species richness (total number of lichens per tree) was analyzed with a generalized linear mixed model (GLMM) in the R package glmmTMB (Magnusson et al. Reference Magnusson, Skaug, Nielsen, Berg, Kristensen, Mächler, van Benthem, Bolker and Brooks2017). Stand-level species richness was calculated by aggregating the 10 trees per stand and tested using generalized linear regression (GLM). Initially, the interaction between tree species and stand age was used as an explanatory variable, and forest stand was set as a random factor. If the interaction was not significant, it was removed from the final model. Poisson with log-link functions was used in both species richness models. Tukey adjusted pairwise comparisons between stand age categories of different tree species were calculated with emmeans package using ‘lsmeans’ (Lenth Reference Lenth2016, Reference Lenth2021).
Lichen growth forms
Lichen growth forms may be associated with microclimates determined by forest structures, namely humidity, temperature and light transmittance (Giordani et al. Reference Giordani, Brunialti, Bacaro and Nascimbene2012; Aragón et al. Reference Aragón, Martínez, Hurtado, Benítez, Rodríguez and Prieto2019). Therefore, the presence of different lichen growth forms can be a useful indicator of diversity in available microhabitats. All epiphytic lichen species were classified into six different groups, based on growth form (Nimis Reference Nimis2016), and then used in an analysis of epiphytic lichen responses to the different stand types. The six categories of species were: 1) crustose, 2) foliose, 3) fruticose, 4) fruticose filamentous, 5) leprose and 6) squamulose.
Multivariate methods
To examine differences in epiphytic lichen community composition between Scots pine and Norway spruce stands and the associated stand age classes, we used nonmetric multidimensional scaling (NMDS). NMDS is an unconstrained method, and we applied the ‘metaMDS’ function of the R package vegan (Oksanen et al. Reference Oksanen, Guillaume Blanchet, Friendly, Kindt, Legendre, McGlinn, Minchin, O'Hara, Simpson and Solymos2020) with Bray-Curtis dissimilarity index for our calculations. The number of trees (including trunk and branches up to 2 m) on which the lichen species were present in every stand (0–10) was used as a measurement of frequency in the analysis. The analysis was conducted on the full lichen species data set, including all lichen species and genera complexes encountered on the trunk and branches, resulting in a two-dimensional solution with a stress level of 18.7. The model and the resulting ordination axes were tested using ANOVA with 999 permutations.
Zonation analysis
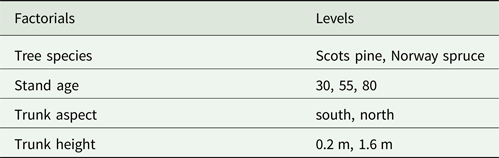
To examine the differences in lichen communities based on trunk aspect and trunk height (Table 1), the data from the frequency plots was analyzed with variation partitioning. For this, the lichen species data for the four different plot locations was aggregated at stand level, so that the lichen species data represented the mean frequency from the four plots (in total 40 plots/stand).
Different factorials included in the variation partitioning test used to analyze stand level differences in lichen communities based on trunk aspect and trunk height in Scots pine and Norway spruce.
Before the analysis, the species matrix was analyzed with DCA (detrended correspondence analysis) using the vegan function ‘Decorana’ to determine the data gradient length. The analysis revealed that the length of the first four axes was below 4 (2.26, 2.50, 2.29, 1.96). For that reason, the linear ordination method RDA (redundancy analysis) was selected. RDA is a constrained ordination method which combines regression and PCA and is used to model multivariate response data (Rao Reference Rao1964).
The different terms included in the model, the full model (including plot height, aspect and age), and the first four ordination axes, were tested in ANOVA with 999 permutations. The contribution (R2-adjusted) of each of the terms for explaining the community composition was then calculated with variation partitioning in the vegan package function ‘varparts’. Because the interaction of tree species and stand age was significant, it was kept in the final model. There was no other significant interaction between terms. We used NMDS ordinations to visually represent the differences in contribution between the factorials tested, and the species location.
In addition to testing all plots together, separate tests for Scots pine and Norway spruce were also performed. Due to the short gradient length as determined by DCA (2.11, 2.55, 2.13 and 1.86 for Scots pine and 2.45, 1.68, 1.37 and 1.44 for Norway spruce), these tests were also performed in RDA before the variation partition analysis.
Results
Stand structures
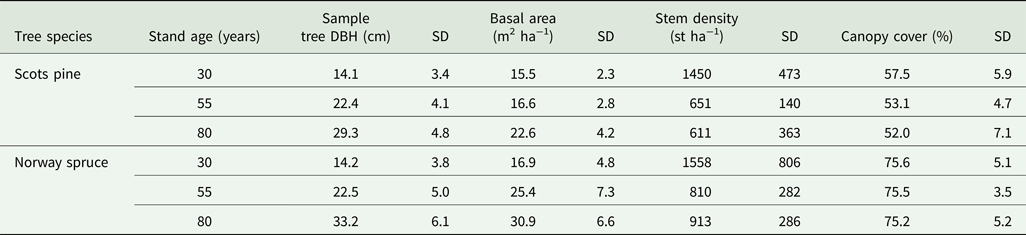
Several structural differences occurred between Scots pine and Norway spruce stands. Basal area, sample tree DBH, stem densities and canopy cover were all higher in the Norway spruce stands for the same age category (Table 2). Due to thinning (removal of competing stems), stem densities decreased in older stand age classes regardless of tree species.
Mean stand structure measurements from the 30 Scots pine and 30 Norway spruce stands. SD = standard deviation of the mean. n = 300 per tree species.
Species richness
In total, 65 different species of lichen were found on the 300 Scots pine and 300 Norway spruce sample trees; Scots pine trees hosted 60 different species and Norway spruce 44. On average, Scots pine trees had 10.5 (± 2.5 SD) species per tree and Norway spruce had 7.4 (± 2.5 SD).
The highest number of lichen species at the tree level was found on an 80-year-old Scots pine (22), and the highest number on Norway spruce (14) was also found in an 80-year-old stand. The lowest tree-level species richness of lichens occurred on a Norway spruce tree in an 80-year-old stand (no lichens found). Similarly, a 55-year-old Scots pine hosted only Leparia species.
The majority of lichen species encountered (51) have bark and lignin as their main growth substrata (Nimis Reference Nimis2016). However, four typically terricolous species of Cladonia were also registered in the survey. The remaining ten species have generalist preferences in terms of growth substratum and can be found growing as epiphytes on bark and wood, as well as growing on soil or rocks (Nimis Reference Nimis2016).
Species richness association with tree species and stand age
When testing the tree-level species richness in GLMM, we found no interaction between tree species and stand age (P = 0.811). Stand age alone could not explain the variation in species richness (P = 0.234). Instead, we found that tree species was the only factor explaining the higher species richness in Scots pine stands compared with Norway spruce (P < 0.0001) (Table 3). The different stands, which were set as conditional, explained 3.2% of the variation in the model.
Pairwise comparisons between Scots pine and Norway spruce trees of the same stand age for tree and stand level species richness of epiphytic lichen species. No significant interaction between tree species and stand age was found, and the interaction was not included in the model.

At the stand level, the number of lichen species found in Scots pine stands ranged between 15–35, and in Norway spruce stands from 8–22. Scots pine stands had on average 20.5 (± 4.1 SD) lichen species and Norway spruce stands averaged 14.1 (± 4 SD) species.
When testing the association between lichen species richness and stand age at the stand level, the interaction between tree species and stand age was not significant (P = 0.073), and therefore removed from the model. At the stand level, lichen species richness was significantly higher in Scots pine for all age classes assessed (Table 3). Stand age as an explanatory variable was not significant when tested separately from tree species (P = 0.210).
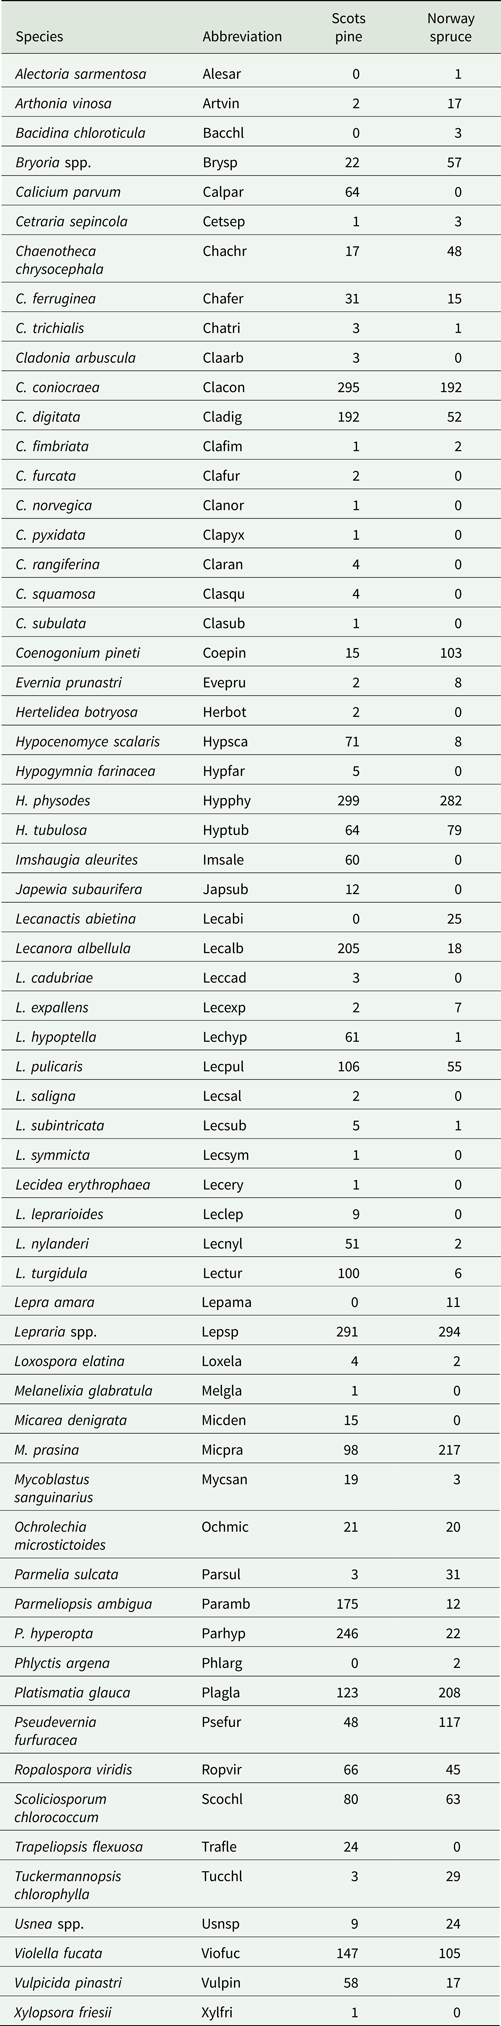
Even though many of the shared species of lichen occurred on both Scots pine and Norway spruce (Table 4), a total of 21 species were found solely on Scots pine, whereas Norway spruce hosted only five unique species. Many of the species exclusive to Scots pine belonged to the genera of Cladonia, Lecanora and Lecidea. Examples of some other fairly common species that were recorded only on Scots pine were Imshaugia aleurites, Trapeliopsis flexuosa and the calicioid species Calicium parvum. Of the five species exclusive to Norway spruce, only Lecanactis abietina was relatively common, being recorded on 25 trees.
Number of trees on which the different species of epiphytic lichens were found on Scots pine (n = 300) and Norway spruce (n = 300).
Occurrence of different growth forms
The most frequently encountered lichen growth form was crustose (33 species), most often represented by the species Micarea prasina, Scoliciosporum chlorococcum, Lecanora albellula and Lecidea turgidula. The abundance of crustose lichens was highest in 30-year-old Scots pine stands, followed by 80-year-old Norway spruce stands (Fig. 3). The lowest frequency of crustose lichens was found in the 80-year-old Scots pine stands, followed by 55-year-old Norway spruce stands.
Frequency (%) of the different growth forms of epiphytic lichens found in plots sampled at the four locations on the trunks of Scots pine (blue dots) and Norway spruce (orange triangles), in different aged stands. Error bars show 90% confidence interval. Stands are 30, 55 and 80 years old. Note that the scale on the y-axis varies between panels. In colour online.
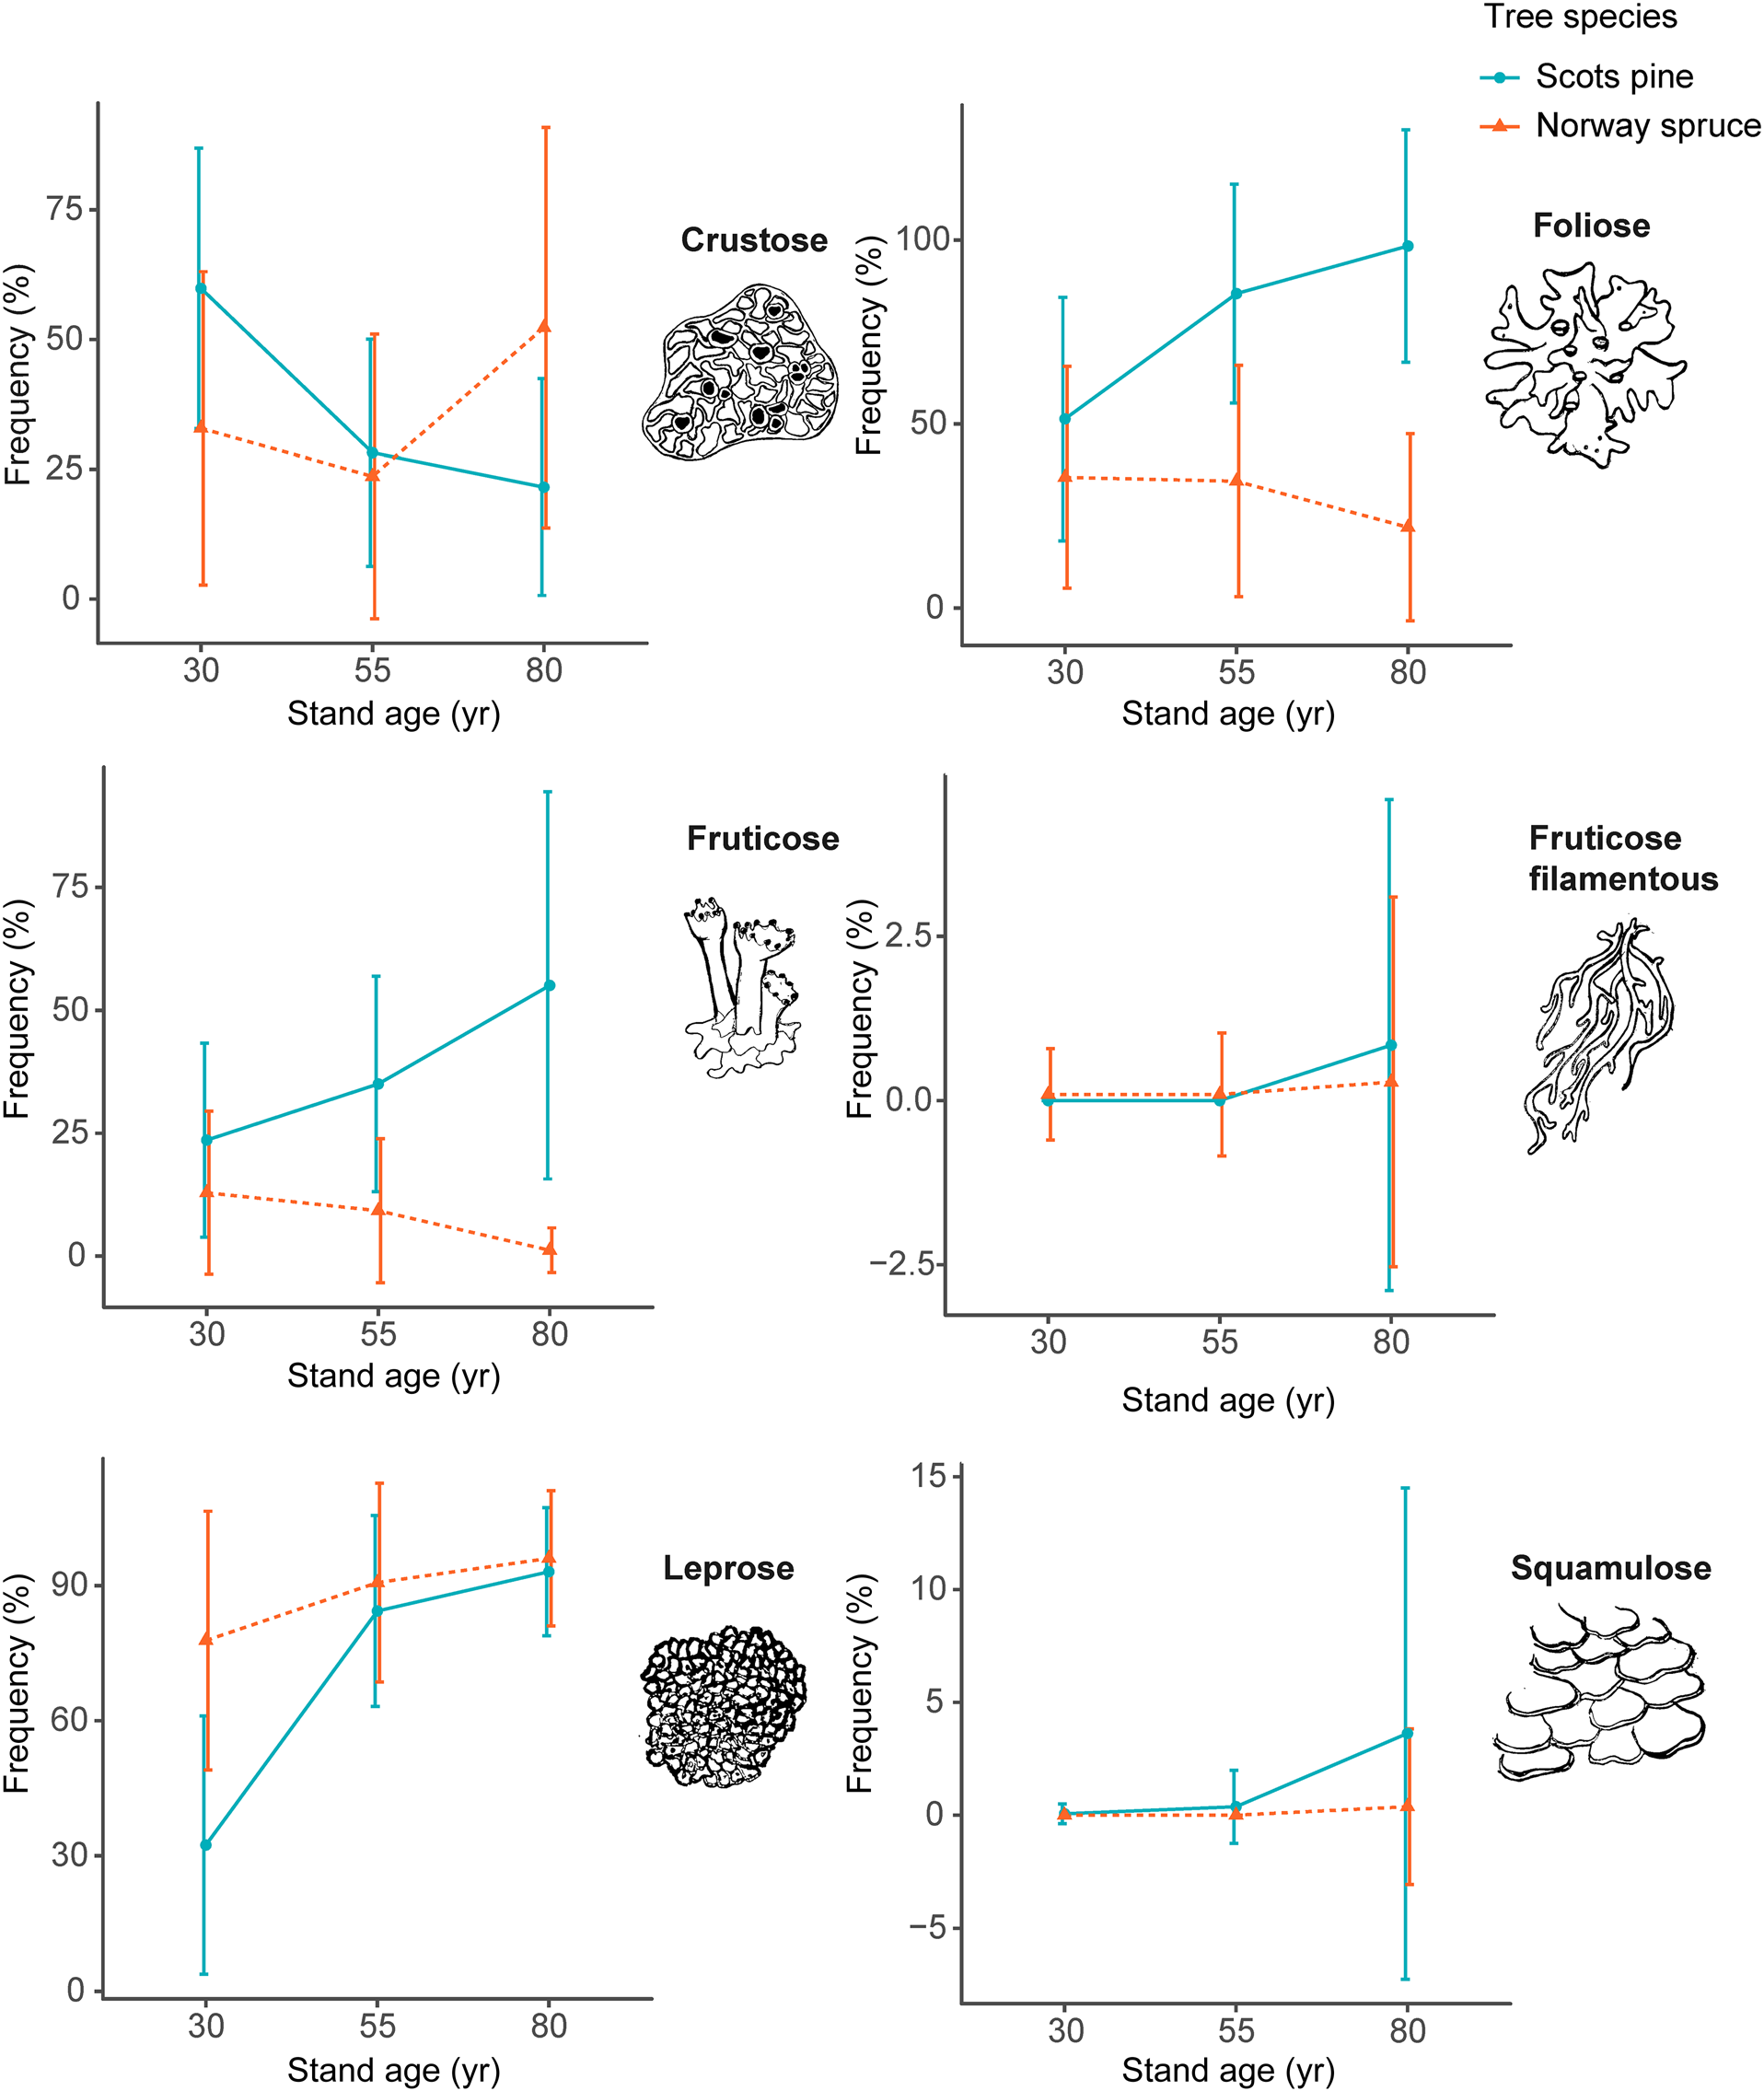
The second most frequently encountered growth form was the foliose lichens (12 species); the most abundant was Hypogymnia physodes, which was found in 46.8% of the subplots and on 97% of the trees. For Scots pine, the frequency of foliose species increased in the 55-year-old and 80-year-old stands compared to 30-year-old stands. In the Norway spruce stands, the cover of foliose species was highest in the 30-year-old stands and decreased with the age of the stand. The foliose species Parmelia sulcata, Platismatia glauca and Pseudevernia furfuracea were all fairly common but, because they typically occurred growing on branches (and only occasionally were found attached to trunks), they did not represent as high a proportion of the plot survey.
A similar pattern to that found for foliose lichens was also found for the fruticose lichens (12 species). Whereas the frequency of fruticose lichens increased in older stands of Scots pine, Norway spruce had the highest frequency of fruticose species in the 30-year-old stands, which subsequently declined in the older stands. By far the most frequently occurring fruticose species were Cladonia coniocraea and C. digitata, the squamulose thallus often occurring at the base of trunks, especially on Scots pine.
Fruticose filamentous lichens (7 species), mainly Bryoria spp., were found only in 0.002% of the subplots. This makes them the rarest group of growth form encountered. Instead, fruticose filamentous species such as Bryoria spp. and Usnea spp. were more frequently encountered on living and dead branches.
Leprose lichens (Lepraria spp.) were the most frequently occurring of all growth forms assessed and were found in 79.1% of the subplots. The occurrence of leprose lichens was lowest in the youngest Scots pine stands (32%) and increased in the intermediate aged and oldest stands. In the Norway spruce stands, the frequency of leprose species increased with stand age.
The frequency of squamulose lichens (2 species), primarily Hypocenomyce scalaris, was highest in the 80-year-old Scots pine stands, where it was found on nearly half (46%) of the trees. Only a small number of occurrences were found on younger Scots pines and on Norway spruce.
Only two species, Alectoria sarmentosa and Phlyctis argena, were exclusively found on branches, occurring occasionally on Norway spruce. Other species were more commonly found on Scots pine, such as Cladonia fimbrata, Lecanora hypoptella and L. subintricata, and occurred sporadically on Norway spruce branches but were never found on the trunks.
Community composition
The NMDS biplot shows that there was a clear separation between the lichen communities of Scots pine and Norway spruce stands on the x-axis (Fig. 4A). For Scots pine, there was a clear gradient of lichen communities belonging to different stand age classes on the y-axis. The gradient for Norway spruce was less distinct but still discernable.
Biplot of the NMDS analysis of epiphytic lichen communities at stand level, including 60 stands of Norway spruce and Scots pine, comprising different stand age classes (30, 55 and 80 years old). A, the positions of the different stand classes. B, the positions of the different species. Species abbreviations consist of the first three letters of the genus and the first three letters of the specific name (Table 4). In colour online.
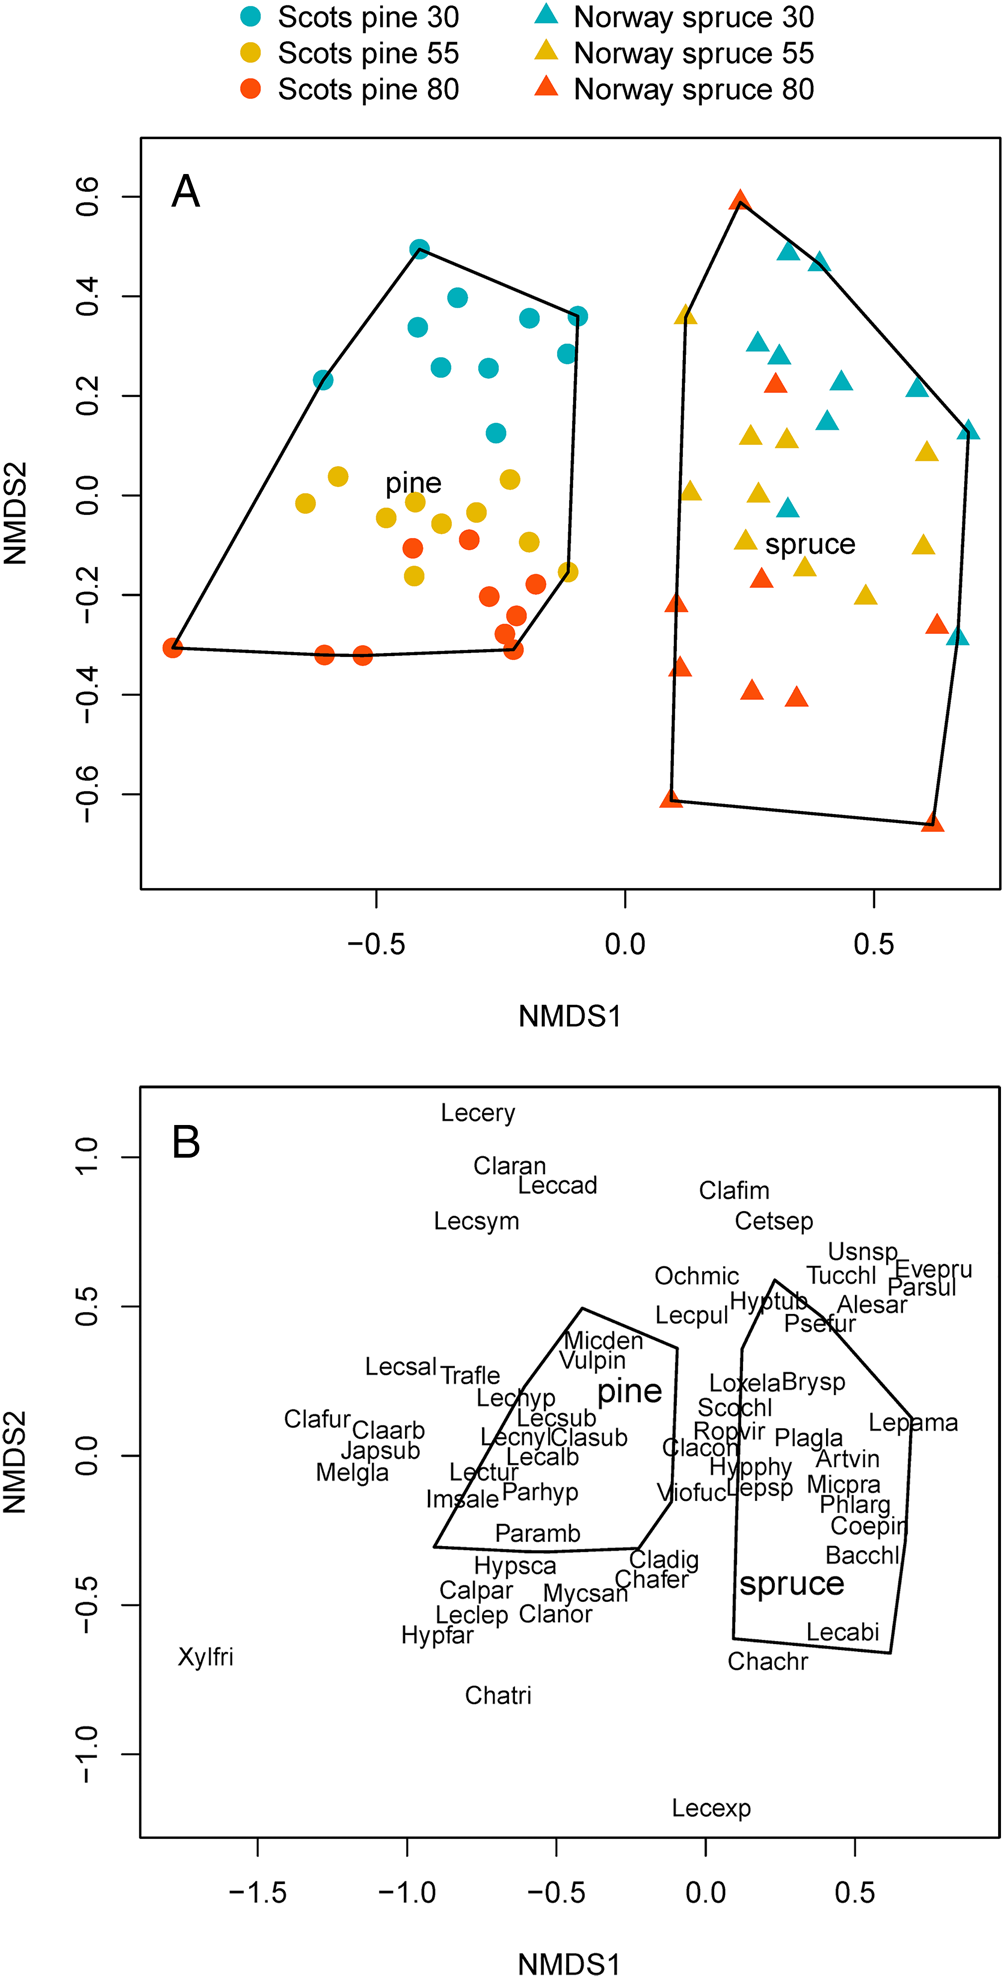
The second NMDS biplot (Fig. 4B), shows the positions of the different lichen species, the majority of which are associated with one of the two tree species. However, some lichen species, located in the centre of the plot, did not clearly distinguish between Scots pine and Norway spruce. These species included Cladonia coniocarea, Hypogymnia physodes, Lepraria spp., Ropalospora viridis, Scoliciosporum chlorococcum and Violella fucata. These lichen species were recorded at high or relatively high frequency throughout the survey (Table 4).
The three variables included in the partial variation test together explained 47% of the total variation (inertia) in the data (see Supplementary Material File S2, available online). The majority of variation (41%) was explained by the combination of tree species and stand age. Another 6% of the variation in species communities was explained by height on the trunk (trunk base or eye-level). North versus south aspect explained only 1% of variation. The remaining residuals explained 53% of the variation in species communities.
When analyzing Scots pine and Norway spruce separately, stand age was the most important explanatory variable for lichen community composition. For Scots pine, stand age explained 36% of the variation in communities, followed by 14% for trunk height and 1% for trunk aspect. For Norway spruce, stand age explained 14%, height 9% and aspect 2%. The total variation explained by the variables included in the partial variation test was higher for Scots pine (50%) than for Norway spruce (25%). None of the three variables included in the three different tests shared any of the variation explained (< 1).
Nature conservation
Only two species encountered in the study are currently nationally red listed (SLU Artdatabanken 2020). The crustose lichen Hertelidea botryosa (NT) was found on trunks of two different trees in the same 80-year-old Scots pine stand. The fruticose filamentous species Alectoria sarmentosa (NT) was recorded only once, on a branch of an 80-year-old category Norway spruce. The crustose species Arthonia vinosa, which is considered an indicator for nature conservation (SFA 2020), was found in six of the 80-year-old Norway spruce stands, and in one each of the 80- and 55-year-old Scots pine stands.
Discussion
In this study, we examined the epiphytic lichen communities on living trees of the interior of Scots pine and Norway spruce production stands in southern Sweden. We found that Scots pine stands had higher species richness than Norway spruce stands. We also found clear differences between the epiphytic lichen species richness and community composition of Scots pine and Norway spruce, with distinctive shifts in community composition with stand age and partly in relation to tree zonation. We discuss potential explanations and drivers below. In addition, this study revealed the composition of the lichen communities of conifer production forests, seldom scrutinized in this way, and has thereby increased our knowledge of the biodiversity in these habitats.
Canopy and light conditions
Because of their dependence on photosynthesis, it is difficult for many lichen species to persist in dark understorey conditions. Our study showed that canopy cover was considerably higher in Norway spruce stands compared to Scots pine (Table 2), which may be a reason why fewer lichen species were found in these stands. Norway spruce canopy is not only denser than Scots pine canopy (Goude et al. Reference Goude, Nilsson and Holmström2019), but the branches of Norway spruce descend lower down the trunk which may also provide an additional physical barrier, limiting lichen diaspore establishment and growth (Kuusinen Reference Kuusinen1996b; Lie et al. Reference Lie, Arup, Grytnes and Ohlson2009). Furthermore, the stands of Norway spruce located in southern Sweden are often more densely planted than for instance in northern Sweden (Ara et al. Reference Ara, Barbeito, Kalén and Nilsson2021). This is known to limit the development of understorey vascular plants, bryophytes and terricolous lichens (Hedwall et al. Reference Hedwall, Nordin, Brunet and Bergh2010; Petersson et al. Reference Petersson, Holmström, Lindbladh and Felton2019, Reference Petersson, Nilsson, Holmström, Lindbladh and Felton2021). Even after stands have been thinned, high growth rates in Norway spruce stands can result in canopy cover being regained within a couple of years (Wallentin Reference Wallentin2007; Lariviere et al. Reference Lariviere, Holmström, Brunet and Weslien2021). In contrast, studies conducted in northern Sweden (Bäcklund et al. Reference Bäcklund, Jonsson, Strengbom, Frisch and Thor2016) found a higher species richness of lichens on Norway spruce compared to Scots pine within 15-, 30- and 85-year-old stands. At the same time, the canopy cover of their 30-year-old Norway spruce stands was considerably lower (58%) than in the stands assessed in this study (75.6%). If light is a limiting factor in the Norway spruce stands surveyed in this study, then differences in stand densities between northern and southern Sweden might be a potentially causal explanation for the comparably fewer lichen species encountered.
Despite their effect of shading the trunk, Norway spruce branches are also known to support many specialized species of foliose and fruticose filamentous lichens (Jaakkola et al. Reference Jaakkola, Helle, Soppela, Kuitunen and Yrjönen2006; Androsova et al. Reference Androsova, Tarasova and Gorshkov2018). One reason for this is that the lower parts of Norway spruce canopies in particular can often contain a relatively large proportion of fine deadwood. These structures benefit the establishment of deadwood specialist species, often requiring a slightly higher pH than is found on the living parts of the tree (Du Rietz Reference Du Rietz1945). Despite the fact that Norway spruce canopy is often described as a very special habitat for epiphytic lichens (Holien Reference Holien1997), the number of specialized species (i.e. species found only on Norway spruce branches) was low (two species) in this study. Instead, Norway spruce branches were often supporting common species of Bryoria and Usnea, and additional species that are well known to rapidly colonize branches of Norway spruce in managed forests, such as Hypogymnia physodes, H. tubulosa and Platismatia glauca (Esseen et al. Reference Esseen, Renhorn and Petersson1996).
The reason why the number of branch specialists was so low in this study might be because high stand densities prevent the development of light-exposed lower branches (Esseen et al. Reference Esseen, Renhorn and Petersson1996). Another reason could be that our survey was restricted to branches up to 2 metres, and thereby excluded species preferring middle (Marmor et al. Reference Marmor, Torra, Saag, Leppik and Randlane2013) and upper (Hilmo et al. Reference Hilmo, Gauslaa, Rocha, Lindmo and Holien2013) parts of the crown. More specialized lichens, such as the pendant species A. sarmentosa which was found only once, also require stable forest interior climates with high humidity, and protection from excessive air movements, intense light and extreme temperatures (Edwards et al. Reference Edwards, Soos and Ritcey1960). These requirements are unlikely to be fulfilled over the time periods necessary in these managed stands, where thinning takes place several times during a rotation and thereby disrupts the continuity of forest cover.
In contrast to the structure of the Norway spruce crown, where the longest branches are located close to the ground (Edwards et al. Reference Edwards, Soos and Ritcey1960), the crown of Scots pine trees is characterized by the higher position of branches. This is due to the lower branches of Scots pine dying and falling off as the tree grows older, possibly as an adaptation to fire outbreaks in the understorey vegetation (Notov & Zhukova Reference Notov and Zhukova2015). For this reason, there were no Scots pine branches included in our survey of the lower 2 metres of this tree species. However, we noticed that the often sun-exposed remaining knots of Scots pine branches, together with the pieces of dead rhytidome that surround these areas (branch collar), appear to serve as distinct microhabitats for lichens. For example, we often found crustose species thriving on deceased branch collars. The reason for this might be that such areas were influenced by the higher pH associated with the dead branch remains. The role of these former attachment points as a habitat for epiphytic lichens has previously been highlighted (Halonen et al. Reference Halonen, Hyvärinen and Kauppi1991; Notov & Zhukova Reference Notov and Zhukova2015).
Tree zonation
We found an effect of zonation in relation to both trunk height and aspect. When analyzing Scots pine and Norway spruce separately, there was a higher proportion of community variation explained by trunk height for Scots pine (14%) than for Norway spruce (9%). With closer proximity to the ground, shading and humidity from the understorey vascular plant layer and bryophytes are likely to have a larger effect, compared to higher up on the trunk. This may result in distinctively different lichen communities at the base of the trunk compared with higher up on the tree (Oksanen Reference Oksanen1988; Straupe & Donis Reference Straupe, Donis, Gaile, Špogacutẽis, Ciproviča, Kaķitis, Dumbrauskas, Alsins and Bernhard2006). In this study, the bases of Scots pine trunks were often richly covered with different fruticose species. In these environments, the phylloclade thalli of Cladonia coniocraea and C. digitata often thrived. These lichen species have intermediate requirements for light and humidity (Nimis Reference Nimis2016), which means that they may find the semi-light conditions under the canopy of Scots pine favourable, together with the increased humidity found closer to the ground. In contrast, the lichen species commonly found at the base of Norway spruce were Coenogonium pineti and Micarea prasina. These two species are sensitive to drought and can tolerate very low light conditions (Nimis Reference Nimis2016). The difference between lichen communities found at the base of the Scots pine and Norway spruce trunks might therefore also result from the environmental impacts of differences in crown architecture between the two species (Hyvärinen et al. Reference Hyvärinen, Halonen and Kauppi1992; Goude et al. Reference Goude, Nilsson and Holmström2019).
Plots located on the upper trunk (160 cm) of 30-year-old Scots pine had a distinct lichen community composition compared to other parts of the tree, also in comparison to older Scots pine individuals (Fig. 5A & C). Many different lichen species were recorded on this section of 30-year-old Scots pine trunks. Most species were crustose lichens, such as Lecanora pulicaris and L. albellula. The total frequency of crustose lichens was highest in the 30-year-old Scots pine stands and decreased markedly in the older stands (Fig. 3). This result might also be related to the presence of knots and branch collars on Scots pine. On 30-year-old trunks, the loss of branches at this height took place more recently than in older trees, and thus remnant pieces of rhytidome surrounding the branches were more likely to remain as potential habitat. In addition, the smaller trunk size in younger trees may have increased the likelihood that the plot covered at least one of these knots and associated branch collars. The presence of shedding pieces of bark and bark collars on 30-year-old Scots pine also indicates that a shift in lichen community composition due to extensive bark shedding may occur as Scots pine exceed 30 years of age. From this study, we cannot tell whether the loss of crustose lichens with tree age was a result of bark shedding, or if the bark of younger Scots pine has other properties beneficial to this group.
NMDS biplots of lichen community zonation on trunks of Scots pine and Norway spruce. A, the positions of different stand classes (Scots pine and Norway spruce, 30, 55 and 80 years old). B, the positions of the different lichen species in the ordination (species abbreviations consist of the first three letters of the genus and the first three letters of the specific name (Table 4)). C, the positions of plots showing sample heights on the trunk (high = 160 cm, low = 20 cm from the ground). D, the positions of plots showing different trunk aspects (north/south). Data consists of the average stand frequency of the different species found in the plots. In colour online.
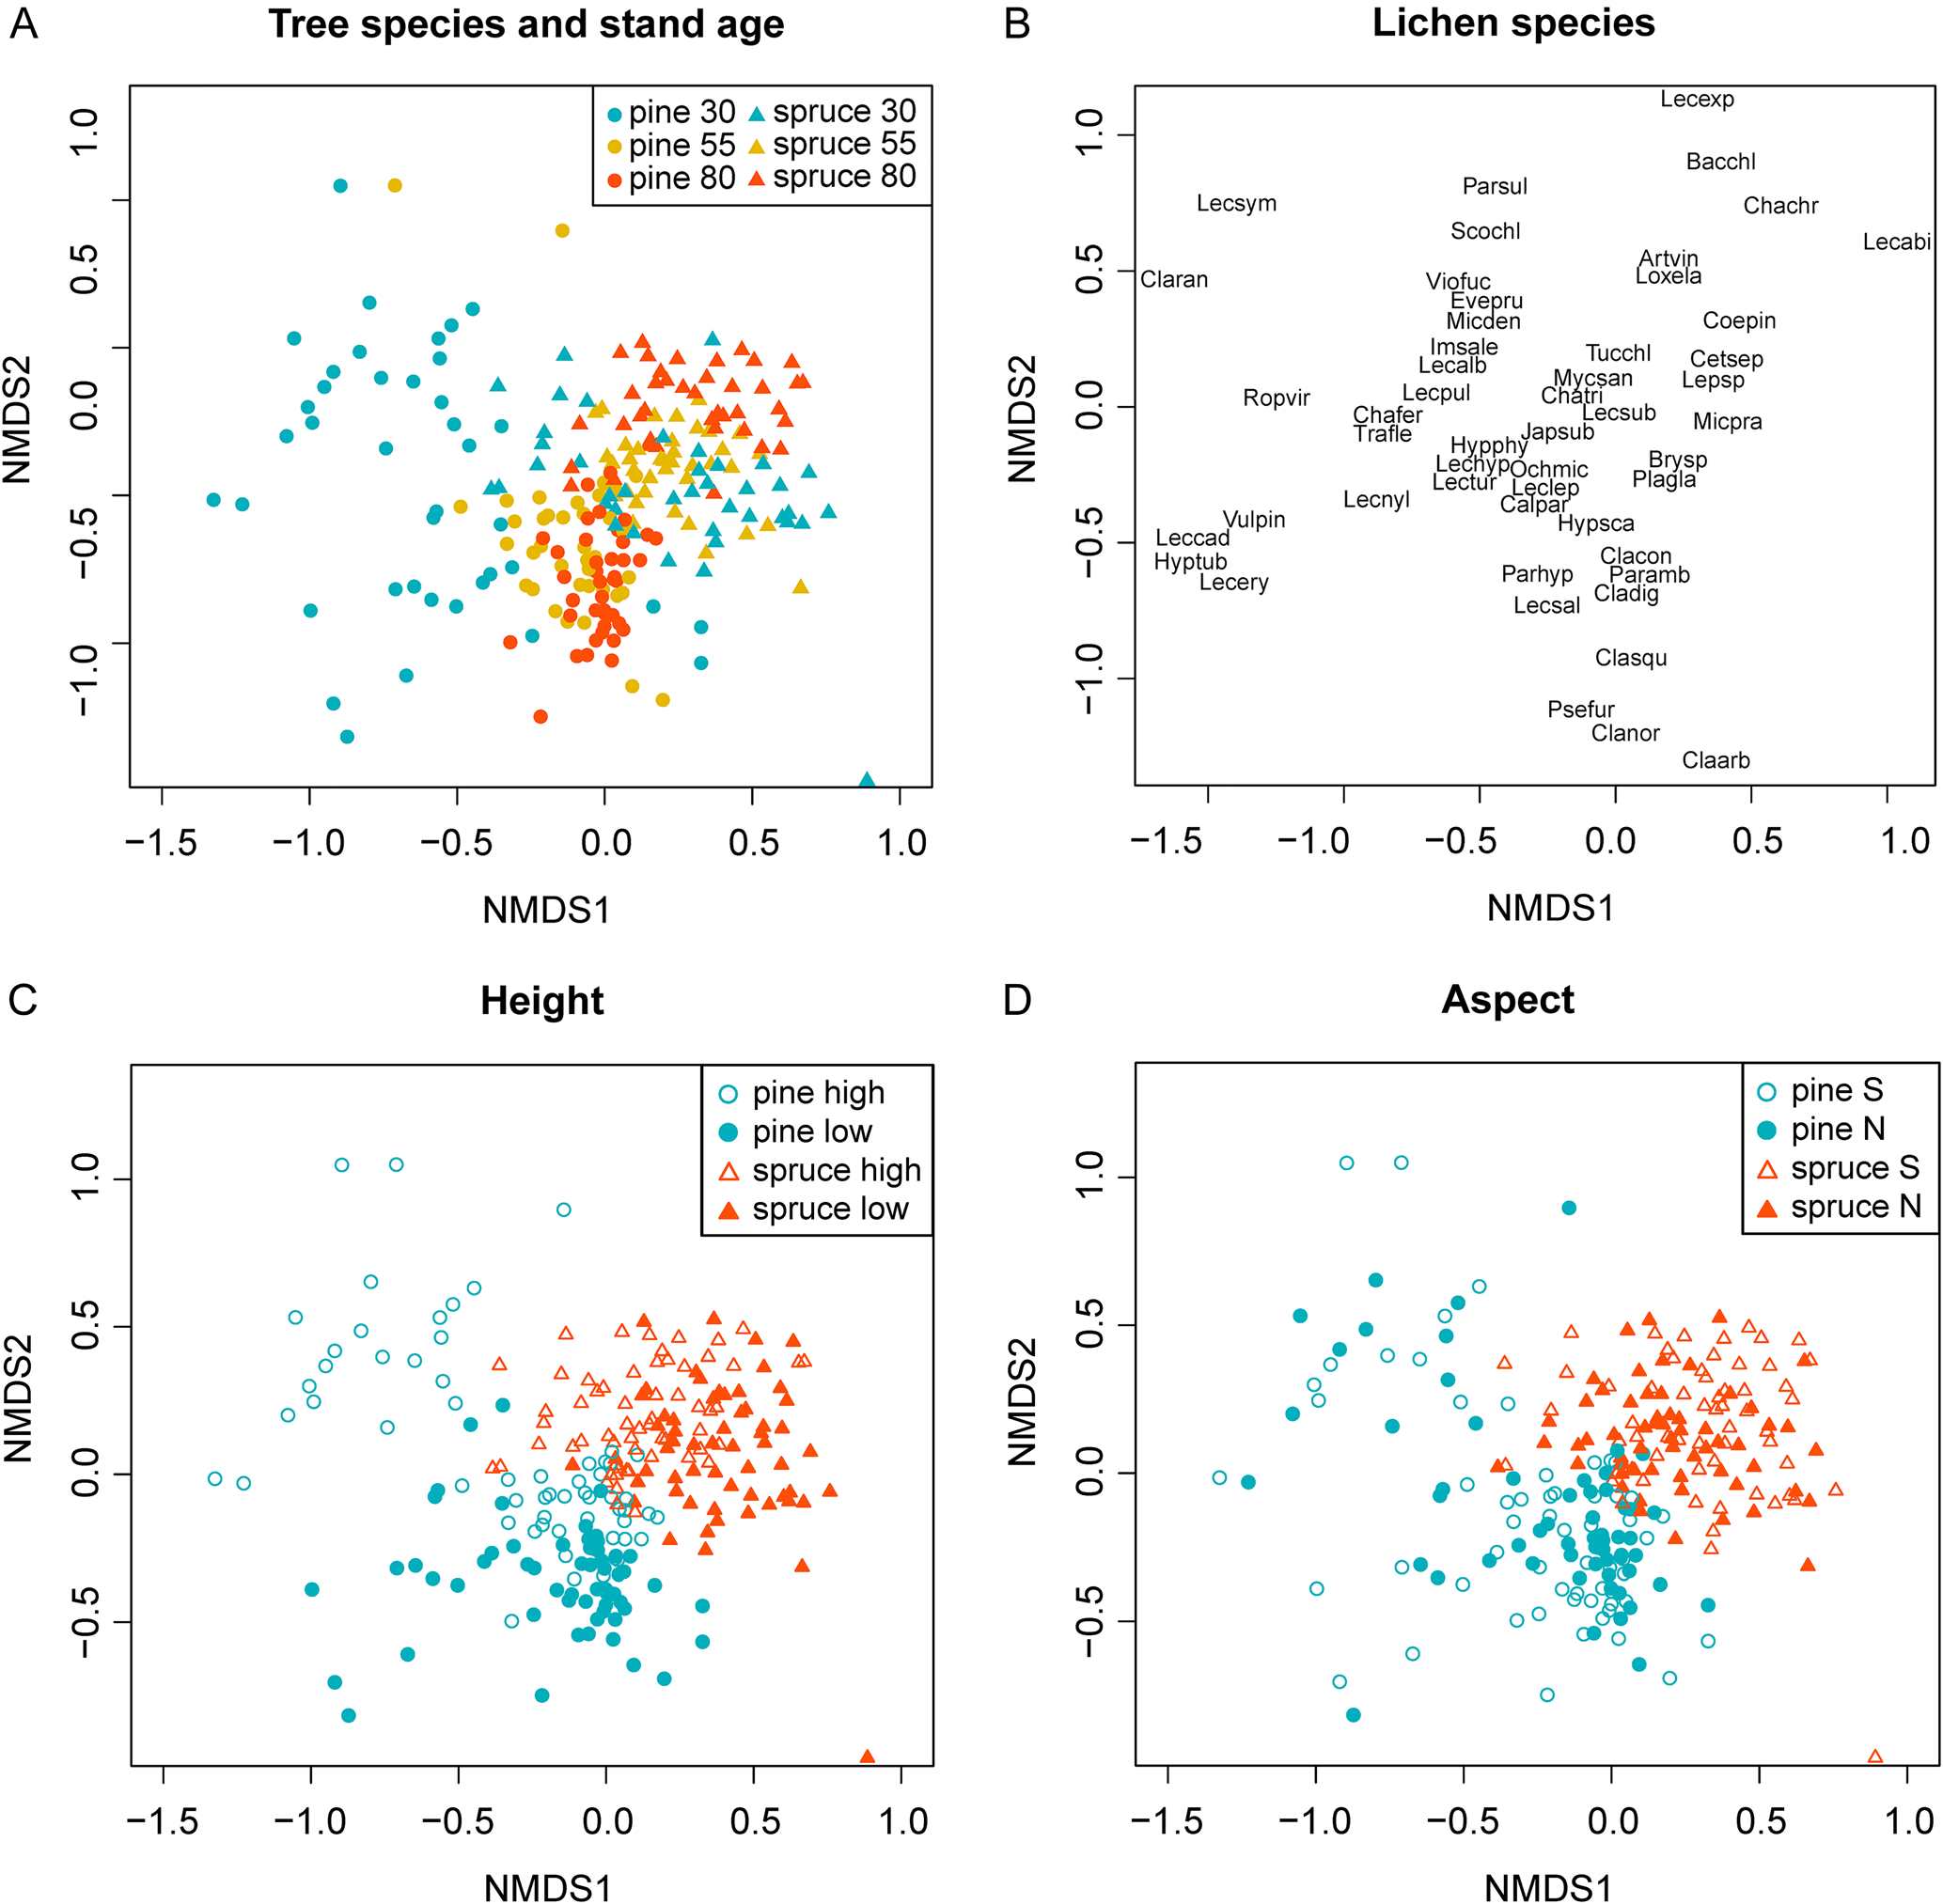
Two species, L. pulicaris and Vulpicida pinastri, were strongly associated with the upper trunks of 30-year-old Scots pines. However, they were also occasionally found on Norway spruce branches. Since branches were excluded from the trunk zonation analysis, these two species might appear more Scots pine-associated than they were in reality.
Conditions at the bark's surface, as determined for example by light, humidity and wind exposure, can vary on different sides of the same tree. Depending on their tolerance to light and dehydration, epiphytic lichens may therefore have preferences for one cardinal direction. In extensive work on epiphytic lichens in Estonian forests, Sõmermaa (Reference Sõmermaa1972) found several examples of lichen species that were either exclusive to, or more dominant on, either the southern or northern sides of Scots pine and Norway spruce. For example, on the northern side of the tree, photoneutral and photophobic species often dominated (Sõmermaa Reference Sõmermaa1972). In the current study, however, the amount of community variation explained by aspect was limited. One reason might be that the trees we sampled were all in the interior of the forest stands. For Norway spruce in this setting, potential differences in environmental conditions due to aspect were probably limited by the consistent shading from the neighbouring trees. In contrast, shading from neighbouring trees is less pronounced in the more open stands of Scots pine. However, because wind can also pass more freely through these stands, resultant differences in humidity associated with aspect are presumably fleeting, as stems probably dry out relatively quickly after rain.
Bark properties
Sometimes it is argued that the acidic bark properties (pH < 4; Kuusinen Reference Kuusinen1996a) of Scots pine, Norway spruce and also birch (Betula pendula, B. pubescens) provide very similar habitats for epiphytic communities, as characterized by the dominance of acidophilic lichen species (Du Rietz Reference Du Rietz1945; Coppins Reference Coppins1984; Kuusinen Reference Kuusinen1996b; Arup Reference Arup1997). Consistent with this argument, previous studies have often stressed overall similarities in the lichen communities of Scots pine and Norway spruce (see e.g. Esseen Reference Esseen1981; Kuusinen Reference Kuusinen1996b; Ranlund et al. Reference Ranlund, Hylander, Johansson, Jonsson, Nordin and Gustafsson2018). This overlap is especially pronounced if comparisons are made with the lichen communities found on other hemiboreal tree species, such as European aspen (Populus tremula), European ash (Fraxinus excelsior) and wych elm (Ulmus glabra). These broadleaf tree species have higher bark pH, which is beneficial to the establishment and growth of many lichen species (Du Rietz Reference Du Rietz1945; Kuusinen Reference Kuusinen1996b). However, despite some similarities between the substrata that Scots pine and Norway spruce provide for lichens, the epiphytic lichen communities in this study were nevertheless distinct (Fig. 4). Moreover, species richness was consistently higher on Scots pine than Norway spruce in all stand age classes. One reason for this might be the deeper bark crevices of Scots pine bark (Hyvärinen et al. Reference Hyvärinen, Halonen and Kauppi1992; Bäcklund et al. Reference Bäcklund, Jonsson, Strengbom and Thor2018), which provide a more variable substratum than the comparatively smooth bark of Norway spruce.
Implications for nature conservation
As many lichen species need specialized microhabitats, which in forest ecosystems often take time to develop, we would have expected species richness to be higher in the older stands. However, in this study we did not find any significant difference in species richness between 30-, 55- and 80-year-old stands. This is probably because the 80-year-old stands in this study were not old enough to have acquired a rich variety of microhabitats. As an example of how species richness may increase as stands get older than this, Marmor et al. (Reference Marmor, Torra, Saag and Randlane2011) found that Scots pine and Norway spruce of old natural forests had a higher species richness than stands younger than 100 years of age. On the other hand, while species richness remained similar in this study, community composition differed between stands of different age (Fig. 4). This illustrates the importance of maintaining tree species of varying ages in the landscape in order to provide different types of substrata for epiphytic lichen communities.
It is well known that slow-growing, old and dead trees are important for many rare and threatened species (Kuusinen Reference Kuusinen1996a; Thor Reference Thor1998; Svensson et al. Reference Svensson, Johansson, Dahlberg, Frisch, Thor and Ranius2016). In this study, however, we included only living crop trees from the forest interior. This should have excluded lichen species specialized on other types of substrata and conditions, such as deadwood specialists, species growing in more exposed conditions (e.g. the edge of the stand), and species associated with the humid air conditions of swamp forests and mires (Kuusinen Reference Kuusinen1996a; Hilmo & Holien Reference Hilmo and Holien2002; Bunnell et al. Reference Bunnell, Spribille, Houde, Goward and Björk2008). Moreover, the upper age of the production forest stands was restricted to 80 years. For both tree species, this is only a fraction of their potential lifespan under natural conditions (Kuuluvainen et al. Reference Kuuluvainen, Mäki, Karjalainen and Lehtonen2002). In production forests this is often the time when stands are harvested in southern Sweden and, on fertile soils, Norway spruce is often harvested even earlier. The strong indication from our results that an ongoing community succession is occurring in these stands, and that red-listed species were primarily limited to the oldest age category, implies that 80 years is not enough time for old forest associated epiphytic lichens to fully establish. After studying a longer chronosequence of stands, Kuusinen & Siitonen (Reference Kuusinen and Siitonen1998) suggested that increasing stand rotation length to > 120 years would increase the diversity of habitats for lichens. Our discovery of Arthonia vinosa in seven of the 80-year-old stands, and the prevalence of Calicium parvum and Lecanactis abietina in Scots pine and Norway spruce stands respectively, might indicate that these stands are starting to acquire valuable habitat structures just prior to final harvest.
Management enhancing epiphyte diversity
In their current state, the conifer stands studied did not constitute forests of higher biological value. However, there are a variety of options for landowners and authorities aiming to increase the biodiversity values of these stands. In addition to increasing the number of tree species (Klein et al. Reference Klein, Low, Thor, Sjögren, Lindberg and Eggers2021), promoting a variety of different aged trees, conserving dead wood and establishing set-asides; choosing Scots pine over Norway spruce and prolonging the rotation period could readily enhance the epiphyte diversity of these production forests. Due to the limited and fragmented occurrence of old and natural conifer forests in this region (Angelstam & Andersson Reference Angelstam and Andersson2001; Naturvårdsverket 2021), some older production stands may even provide an important source pool for set-aside establishment in the future. In particular, placing such production stands adjacent to existing nature reserves, or in landscapes lacking suitable habitat for epiphytic lichens associated with natural forests, could optimize their potential contribution to forest biodiversity.
Acknowledgements
This study was funded by Stiftelsen för Oscar och Lili Lamms minne, Södras Stiftelse för Forskning, Utveckling och Utbildning, The Crafoord Foundation, and Önnesjöstiftelsen. AF was funded by the Swedish Research Council Formas Grant 2019–02007. We would like to thank Sveaskog and the forest owners of Södra for allowing us to conduct the study on their land. We also wish to thank Alessandra Salvalaggio and Daniel Jensen for helping with fieldwork, Adam Flöhr for statistical support and Emil Persson and Göran Thor for helping with the determination of some of the collected species.
Author ORCID
Lisa Petersson, 0000-0002-4612-3079.
Competing Interests
The authors declare none.
Supplementary Material
To view Supplementary Material for this article, please visit https://doi.org/10.1017/S0024282922000172.


 Open access

