


One of the most profound outcomes of collaborative archaeology is a fuller understanding of the significance of the connection between deeper Indigenous pasts and Indigenous futures (Atalay Reference Atalay2012; Colwell-Chanthaphonh and Ferguson Reference Colwell-Chanthaphonh and Ferguson2008; Gould et al. Reference Gould, Herbster, Pezzarossi and Mrozowski2020). The idea that New England Indigenous history ended with the arrival of Europeans denies the presence of thousands of Indigenous peoples living throughout the region today, including both federally and state-recognized tribal groups (Den Ouden and O'Brien Reference Den Ouden and O'Brien2013; Gould Reference Gould2013a). Extensive radiocarbon dating of deposits that span the arrival of European colonists is one way to recognize the long-term persistence of Indigenous communities through this period.
The Wampanoag of Mashpee and Gay Head Aquinnah recognize Cape Cod, Massachusetts, as their ancestral homelands. European explorers and later colonists recorded the widespread presence of Indigenous people on Cape Cod starting in the sixteenth century. Paradoxically, very few sites from the sixteenth and seventeenth centuries have been identified on Cape Cod. The sites from this period that are recorded are mostly based on collectors’ files and historical accounts. Before the present work on Great Island in Wellfleet, Massachusetts, no sites were assigned to the sixteenth and seventeenth centuries on the Lower Cape based on radiocarbon dates.
The lack of well-dated sites can be tied to several factors: (1) the reliance on the presence of European material culture—what Panich and Schneider (Reference Panich and Schneider2019:660) call “index artifacts”—to assign sites to the fifteenth through seventeenth centuries; (2) the tendency to focus archaeological investigation (and radiocarbon dating) on more intensively used sites, leaving gaps in the spatial and temporal landscape of Indigenous persistence; and (3) the use of single AMS dates to place sites into periods (Watson Reference Watson2020). Without an intensive program of AMS dating, the Great Island site, which was used repeatedly over nearly 2,000 years, may have been listed without a time period because of the lack of diagnostic artifacts; a single date may have assigned it to a single century, obscuring its long and continuous use.
These factors remove sites from the archaeological understanding of the sixteenth- and early seventeenth-century landscape, leaving an artificial gap or an appearance of discontinuity in the archaeological account of Indigenous history on the Cape. Other recent studies have also called attention to the way that uncritical periodization has led to the underrepresentation of Indigenous sites in archaeological accounts in the protohistoric period (Panich and Schnieder Reference Panich and Schneider2019) and the nineteenth century (Beaudoin Reference Beaudoin2016). Drawing on a program of AMS dating of extensive and mostly low-density deposits from Great Island (Figure 1; Table 1) that highlights the span AD 1480–1630—a plateau in the radiocarbon calibration curve—we found evidence of continuous Indigenous activity from this period, absent European material culture. Our results also show that a colonial tavern or whaling station on Great Island (Ekholm and Deetz Reference Ekholm and Deetz1970a, Reference Ekholm and Deetz1970b) was the last in a long-term occupation in which “European contact” was not the defining event. Instead, it seems that the later Euro-American activities were mapped onto a long-standing Indigenous task-scape linked to the collecting, capturing, and processing of marine resources as part of a larger economy that sustained year-round occupation of Indigenous homelands.
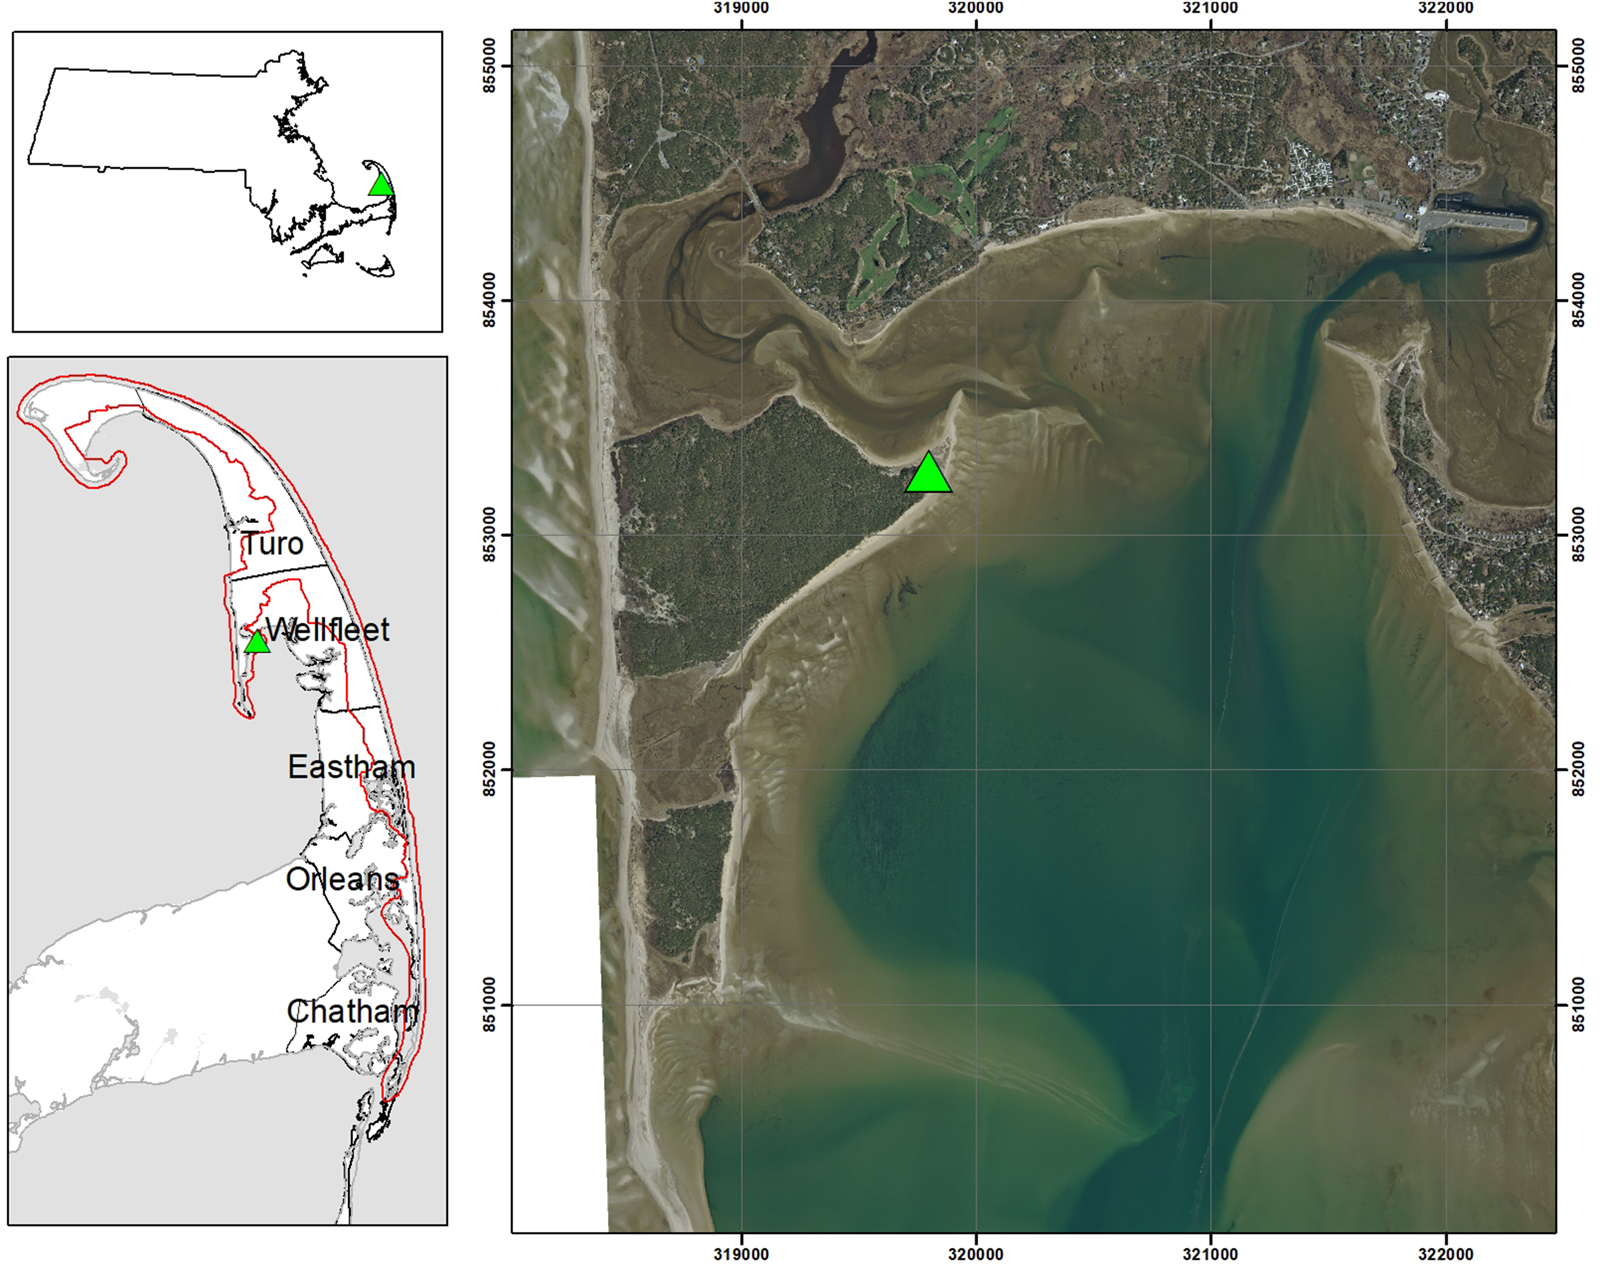
(Top left) Outline of Massachusetts with a triangle indicating the location of Great Island; (bottom left) map of the part of Cape Cod with the four towns of the Outer Cape labeled: Great Island Site 2 is indicated by the triangle, and the CACO park boundaries are outlined in red; (right) aerial color photo (MassGIS) of Wellfleet Harbor with a triangle showing the location of Great Island Site 2. (Color online)
Radiocarbon Dates from Great Island Site 2 with Dates That Fall in the AD 1480–1630 Plateau or “Contact Period” in Gray.
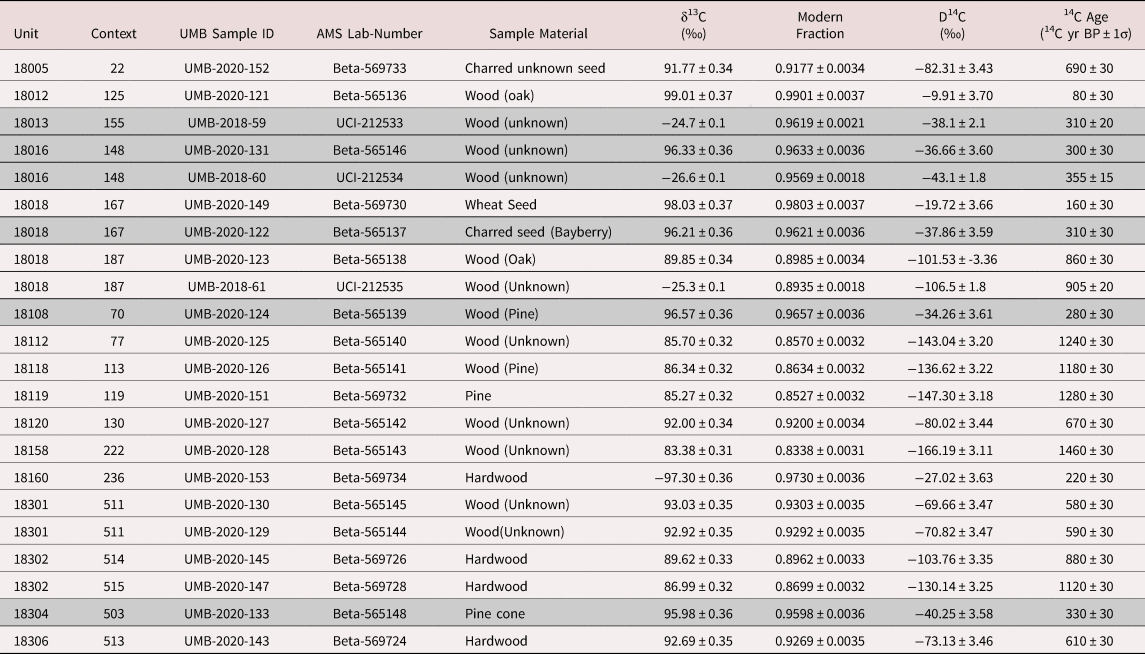
Notes: Radiocarbon concentrations are given as fractions of the modern standard, D14C, and conventional radiocarbon age, following the conventions of Stuiver and Polach (Reference Stuiver and Polach1977). All results have been corrected for isotopic fractionation, with δ13C values measured on prepared graphite using the AMS spectrometer. The δ13C values that are shown were from Gas Bench (charcoal and shell) aliquots measured to a precision of <0.1‰ relative to standards traceable to PDB, using a Thermo Finnigan Delta Plus stable isotope mass spectrometer (IRMS).
If the results at Great Island are at all representative of coastal New England sites, broad periodization of sites may only play a minor role in their assessment and characterization in the future. Furthermore, those periods might be better defined by the nature of the radiocarbon calibration curve. AMS dating can be used to document a continuum of activity that spans the period before and after European arrival in the New World, rather than imposing a break at a site with a much deeper past.
Cape Cod Archaeology
The archaeology of Cape Cod is best viewed against a backdrop of more than a century of research focusing on coastal New England and New York. A review of the literature reveals immensely varied archaeological deposits ranging from large, artifact-rich, stratigraphically complex, persistent places to short-term, much less dense occupation layers (Bernstein Reference Bernstein1993, Reference Bernstein and Kerber2002, Reference Bernstein2006; Bradley Reference Bradley2005; Byers and Johnson Reference Byers and Johnson1940; Ceci Reference Ceci1984, Reference Ceci1990; Chilton Reference Chilton and Pauketat2012; Chilton and Doucette Reference Chilton, Doucette and Kerber2002; Dunford and O'Brien Reference Dunford and O'Brien1997; Harrington Reference Harrington1909, Reference Harrington1924; Johnson Reference Johnson1942; Kerber Reference Kerber and Kerber2002; Lightfoot Reference Lightfoot1985; Lightfoot and Cerrato Reference Lightfoot and Cerrato1989; Moffett Reference Moffett1946, Reference Moffett1957; Ritchie Reference Ritchie1969, Reference Ritchie1980; Skinner Reference Skinner1909, Reference Skinner1919). Our work on Great Island relied heavily on the analysis and interpretation of sites located in and around the National Seashore that received continuous archaeological attention starting in the 1980s and 1990s (Bradley Reference Bradley2005; Bradley et al. Reference Bradley, McManamon, Mahlstedt and Magennis1982; McManamon Reference McManamon and McManamon1984a, Reference McManamon and McManoman1984b, Reference McManamon2011, Reference McManamon2015; McManamon and Bradley Reference McManamon and Bradley1988). One of the noteworthy outcomes of the sampling strategies used by McManamon and his colleagues was a detailed picture of the variability in the density and artifact richness of Indigenous deposits across lower Cape Cod (McManamon Reference McManamon and McManamon1984a, Reference McManamon and McManoman1984b, Reference McManamon2011, Reference McManamon2015). These deposits suggest a general movement toward year-round habitation starting with shorter-term, more frequent occupations “among a set of locations” between 6,000 and 3,000 years ago, followed by the year-round occupation of the area as evidenced by a greater number of longer-term, more dense occupations starting some 2,000 to 1,000 years ago (McManamon Reference McManamon2015:97).
In making this argument, McManamon and his colleagues relied on the analysis of lithic, ceramic, and faunal material from a series of archaeological sites that surround Great Island. Among the most important is the Indian Neck Ossuary that sits directly east across the harbor. McManamon and Bradley (Reference McManamon, Bradley, McManamon, Bradley and Magennis1986:25) link “communal ossuary burials and relatively settled village life” on Cape Cod for at least the last thousand years. Five radiocarbon dates were run on three unburned bone samples from the Ossuary, leading McManamon and Bradley (Reference McManamon, Bradley, McManamon, Bradley and Magennis1986:18–19) to argue that the ossuary was used during the tenth and eleventh centuries AD. Updated modeling of these dates (with large ranges) suggests that it was in use for at least 275 years (and perhaps much longer) during the period in which Great Island Site 2 was used (Supplemental Text 1). This long span is reinforced by the recovery of a Levanna point and a piece of copper sheet metal in the shell midden that covered the older ossuary deposits.
Periodizing Coastal New England Sites
The basic periodization of these southern coastal New England sites has been in place for some time (Borstel Reference Borstel and McManamon1984; Braun Reference Braun1974; Ritchie Reference Ritchie1969). Archaeologists have argued that Indigenous use of Cape Cod largely began in the Early Archaic period (around 8000–5500 BC). The beginning of the Woodland period (Early Woodland: around 1050 BC–AD 350) is defined by the appearance of substantial shell midden deposits. The Middle Woodland, which started about AD 350, sees the appearance of several ceramic styles along with exotic lithic materials, often recovered from those shell midden deposits, with some evidence for year-round exploitation (e.g., Bernstein Reference Bernstein1990; McManamon Reference McManamon2015). The Late Woodland period (variously defined as AD 1000–1600 [Chilton Reference Chilton and Pauketat2012], AD 950–1500 [Gillis and Herbster Reference Gillis and Herbster2013], or AD 650–1500 [Bradley et al. Reference Bradley, Stott, Dempsey, Loparto, Steinitz and Mahlstedt1986]) is largely undifferentiated from the Middle Woodland. The major Late Woodland change seems to be the appearance of Levanna-style projectile points (Boudreau Reference Boudreau2008). Some researchers reference the Middle and Later Woodland periods without explicit temporal definitions (e.g., McManamon Reference McManamon2015), whereas others suggest abandoning the periods altogether (e.g., Duranleau Reference Duranleau2009) because the sequence could be characterized by long-term continuity seen at many New England sites (Bernstein Reference Bernstein2006; Watson Reference Watson2020).
Against this long-term continuity, the arrival of Europeans in southern coastal New England is broadly considered a rupture between the “prehistoric” past and the “history” that started with European contact (Pauketat and Sassaman Reference Pauketat and Sassaman2020:460). This characterization reflects how the notion of prehistory reinforces the idea that European exploration and colonization resulted in the effective end of Indigenous history (Gould et al. Reference Gould, Herbster, Pezzarossi and Mrozowski2020; Mrozowski et al. Reference Mrozowski, Gould, Law Pezzarossi, Cipolla and Hayes2015; Schmidt and Mrozowski Reference Schmidt and Mrozowski2013; Silliman Reference Silliman2005). Concepts such as “contact” and “prehistory” present epistemological and ontological challenges (Den Ouden and O'Brien Reference Den Ouden and O'Brien2013; Gould Reference Gould2013a, Reference Gould, Schmidt and Mrozowski2013b; Mrozowski Reference Mrozowski, Schmidt and Mrozowski2013). Instead, as advocated by Panich and Schneider (Reference Panich and Schneider2019:663) and Birch and colleagues (Reference Birch, Hunt, Lesage, Richard, Sioui and Thompson2022), calendar-year dates derived from AMS samples have been used to identify fifteenth-century and later occupations of Great Island. These dates highlight the continuous use of this site spanning the periods before and after European arrival in the New World.
These fifteenth-century and later dates fall into what the Massachusetts Historical Commission (MHC) defines as the Contact period, running from 1500 to 1620 (Bradley et al. Reference Bradley, Stott, Dempsey, Loparto, Steinitz and Mahlstedt1986). Because the term “Contact period” is so deeply embedded in the classification of Massachusetts sites, we cannot do away with it completely, despite its limitations; in addition, many of the sites assigned to this period are poorly defined and cannot be assigned specific calendar-year dates. For this work, we refer to the period after the European settlement of Eastham in the 1640s until AD 1775 as “colonial.”
For the Lower Cape (Figure 1), 30 sites have been identified either in the MHC's site files or by Holmes and colleagues (Reference Holmes, Hertz and Mulholland1998) as having Contact period components. Many of these sites are known only from the work of early avocational archaeologists or collectors; hence, the collections from these sites lack good provenience and associated data and cannot always be used for the fine-grained dating needed to confidently identify sites to this short period. Other sites are the traditional or memorialized locations where early colonial encounters are supposed to have taken place, but there is no associated archaeology. Still other Cape Cod sites rely on the presence of European artifacts to identify Indigenous sites to the Contact period. Before this project, no sites in the lower Cape had been attributed to the sixteenth or seventeenth centuries solely based on radiocarbon dates.
Wellfleet and Great Island
The data presented in this article come from a project carried out in 2018 by the Andrew Fiske Memorial Center for Archaeological Research on Great Island in Wellfleet, Massachusetts, for the US National Park Service at the Cape Cod National Seashore (CACO; Steinberg et al. Reference Steinberg, Beranek, Mrozowski and Piechota2022). The Fiske Center's project had multiple goals, including developing methods for efficiently assessing the sites, some of which are deeply buried by aeolian sand, and tracking coastal erosion that is actively destroying shell midden sites on Great Island. Wampanoag Tribal monitors worked as field crew on the project.
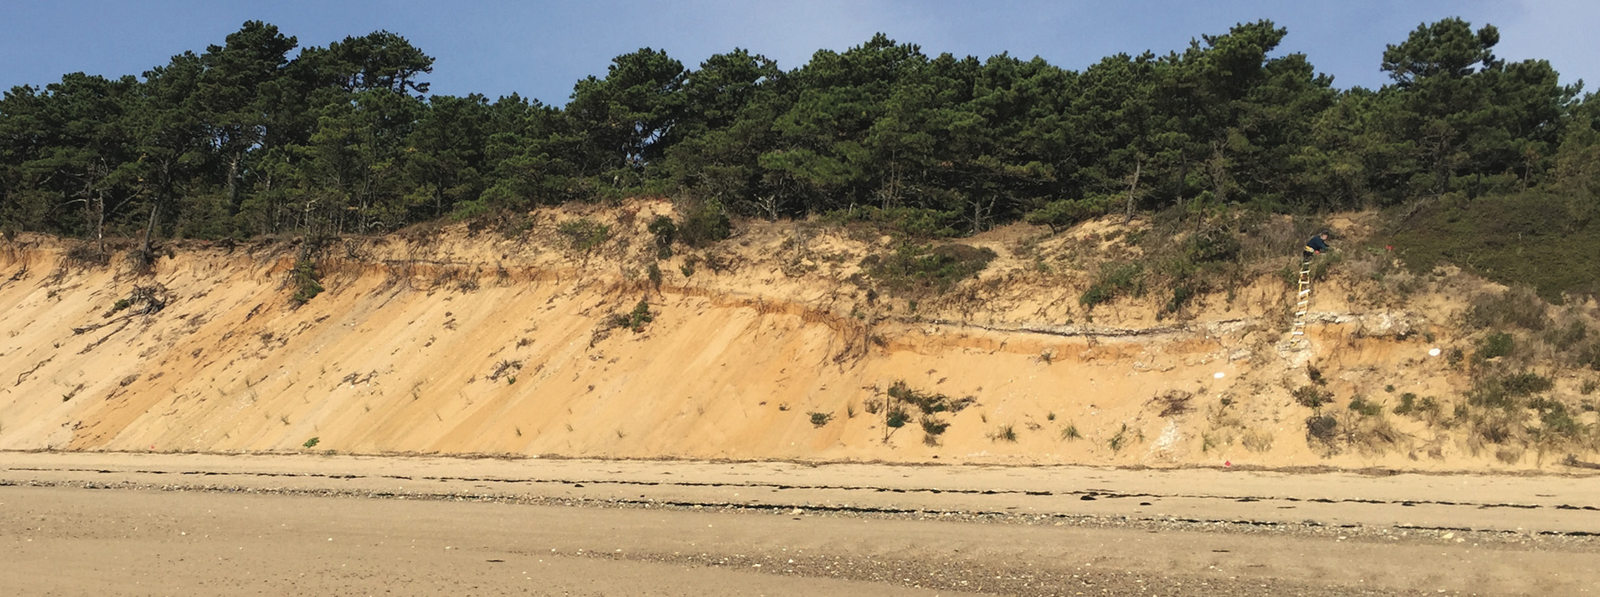
Great Island is part of a series of barrier islands that create Wellfleet Bay. These islands consist of glacial outwash, described as the Older Wellfleet Plain (Oldale Reference Oldale1968), covered by variably thick deposits of aeolian sand. The barrier islands are part of CACO (Figure 1, lower left). As late as the nineteenth century, Great Island was still an island (Borden Reference Borden and Smith1844), but it is now connected to the rest of Wellfleet by a sand deposit called “the Gut.” Clear-cutting of the forests of the Truro Highlands, just north of Great Island, freed the sand there to form dunes. Marine currents also captured and carried sediment south within Cape Cod Bay, where it was washed ashore to form the Gut (Berman Reference Berman2011). The increased aeolian deposition that began in the late seventeenth century is also responsible for the deeply buried nature (they are under up to 5 m of wind-blown sand) of many of the archaeological sites on Great Island (Figure 2). These deeply buried deposits are exposed along Great Island's coastal bluffs and are being lost to coastal erosion.
Photo, looking north, of the cliff face of Great Island Site 2. The tavern site is in the trees on the west (left) side. The dark line, slightly descending to the east (right), is the original ground surface from which the Middle Woodland to Contact and colonial period deposits were recovered. White shell midden deposits can be seen eroding from the cliffside. Photograph by John M. Steinberg. (Color online)
Great Island today is located in the town of Wellfleet, historically part of the town of Eastham. The area was acquired by a group from the Plymouth Colony through a 1644 purchase from Mattaquason of the Monomoyetts and the sachem of the Nausets (Echeverria Reference Echeverria1993:12–13; Holmes et al. Reference Holmes, Hertz and Mulholland1998:48). This “Nauset Purchase” was settled by families from Plymouth Colony and became the town of Eastham in AD 1651. Great Island was part of the common, undivided land of the town of Eastham until 1715. The common land, in general, was used for salt marsh hay for animal fodder, as a source of timber, and as grazing space for animals (Echeverria Reference Echeverria1993:17–19). Great Island had a more specialized common use: English and Indigenous people would use the beaches as sites for building fires for trying (rendering) whale blubber from blackfish (pilot whales) caught near the shore and from larger whales hunted in the bay (Deetz Reference Deetz1996; Echeverria Reference Echeverria1993:94).
Previous archaeological work on Great Island included excavations in 1969 and 1970 by James Deetz and Eric Eckholm (Bragdon Reference Bragdon1981; Ekholm and Deetz Reference Ekholm and Deetz1970a, Reference Ekholm and Deetz1970b, Reference Ekholm and Deetz1971; Synenki and Charles Reference Synenki and Charles1984). They identified a large structure with stone foundations that dated to about 1690–1740 (Figure 3). Because of the amount of whalebone in the tavern deposits, Eckholm and Deetz linked the tavern to the shore-based whaling industry in which small whales would be driven into shallow water, killed, and processed on shore. Although previous scholarship had characterized the site as a tavern, it may have served multiple functions.
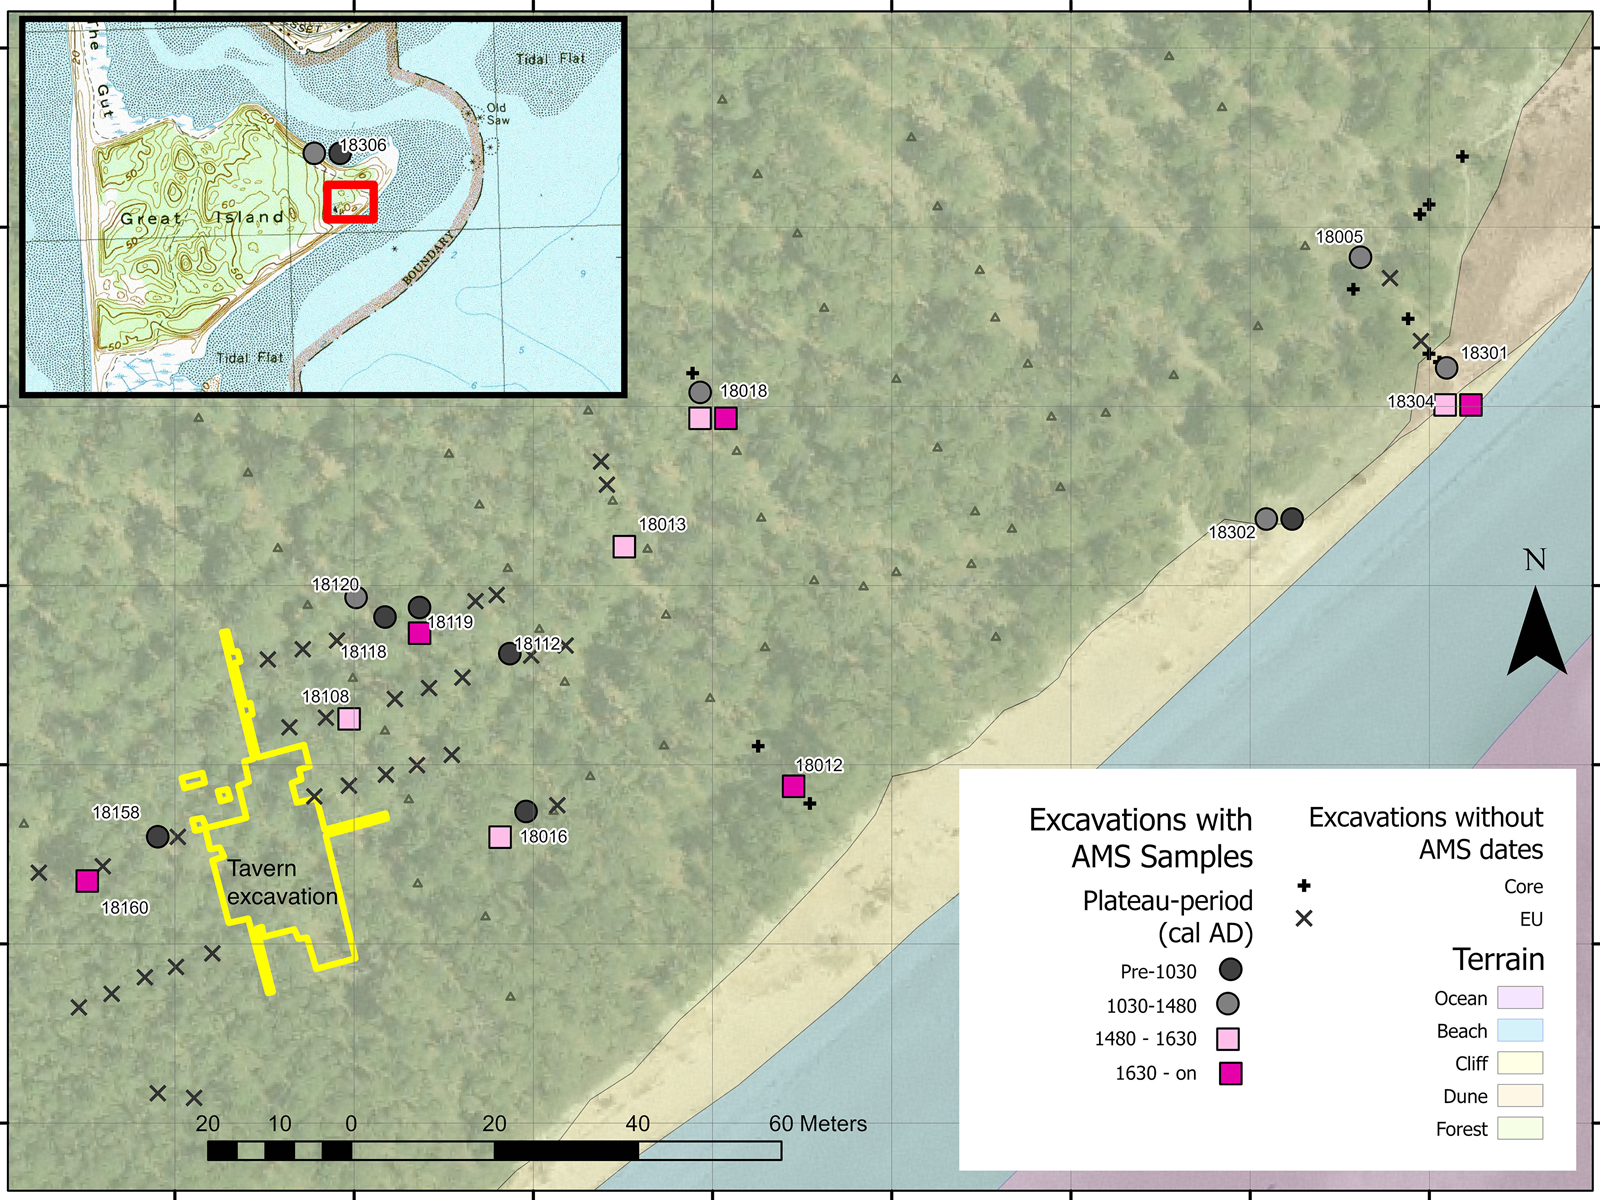
Map of interventions and resulting radiocarbon dates at Great Island Site 2. The excavation unit numbers with AMS dates are indicated. Excavation units can have dates from multiple plateau periods. The boundaries of the 1969–1970 Ekholm and Deetz (Reference Ekholm and Deetz1970a, Reference Ekholm and Deetz1970b) tavern excavation are outlined in yellow. The approximate location of the Gillis and Herbster (Reference Gillis and Herbster2013) shovel test pits is indicated by triangles. Inset shows the USGS topographic map of Great Island, with the location and dates from unit 18306 and the dimensions of the main map outlined in red.
Initially, the tavern was characterized as lying between multiple Indigenous sites. These surrounding sites were surveyed in 2012 by a team from the Public Archaeology Laboratory (Pawtucket, Rhode Island) using wide-interval shovel test-pit transects (Gillis and Herbster Reference Gillis and Herbster2013). On this section of Great Island, the team identified multiple sites (Great Island sites 2, 3, 4, 6, and 7), but the boundaries were difficult to determine. Gillis and Herbster (Reference Gillis and Herbster2013:60) suggested that the occupation area might be continuous, even though the deep sand deposits and limited excavation depths made the site appear discontinuous. Some sites were identified as Late Woodland period, although few diagnostic artifacts were excavated; shells from Great Island Sites 2 and 4 were radiocarbon dated to the Late Woodland and the Middle Woodland / Late Woodland boundary, respectively (Gillis and Herbster Reference Gillis and Herbster2013:55).
The Fiske Center work in 2018 included a closer interval survey of the area surrounding Great Island Site 2 and the tavern to determine the site boundaries and to recover samples for AMS dating. The work focused on a large area (more than 250 × 75 m) extending along the coastal bluff with visible, eroding shell middens and included ground-penetrating radar transects and 58 excavation or coring locations. Additional samples for dating were taken from exposed cliff-face middens as hand samples. Throughout the site, there is a spatially continuous occupation layer, with shell middens located at multiple points across this buried surface. Artifact densities are not statistically different between the shell middens and occupation layers (Steinberg et al. Reference Steinberg, Beranek, Mrozowski and Piechota2022). Based on the low density of the lithics and ceramics in the artifact collection, Indigenous activity seemed to have been focused on gathering and cooking shellfish or marine mammals. This surface is relatively shallow at the western end of the site (40 cm bs) but is much deeper to the east, under deposits of wind-blown sand that were between 1 and 5 m thick.
The project revealed that the historic tavern was only the final stage of an extensive, long-term, repeated occupation of a substantial area. Modeling the dates (AMS results, artifacts, and events) and specific stratigraphic sequences reveals that the Great Island Site 2 is a long-term continuous occupation without obvious breaks. Most notably, the sixteenth century—a significant lacuna in Cape Cod sequences—makes up a substantial component of the Great Island Site 2 deposits and sequences, indicating direct, long-term continuity with the colonial period.
Fifteenth- through Seventeenth-Century Deposit Sequences at Great Island Site 2
AMS dates were obtained on 22 samples from 18 different contexts across 16 excavation units (Table 1). Only dates on wood and carbonized seeds are presented here. The dates were calibrated and modeled using the OxCal 4.4 program (Bronk Ramsey Reference Bronk Ramsey2009) with the IntCal20 atmospheric calibration curve (Reimer et al. Reference Reimer, Austin, Bard, Bayliss, Blackwell, Ramsey and Butzin2020). The specific models can be found in the Supplemental Texts 2–3. Contexts in individual units were assigned to different periods based on their AMS dates, stratigraphic position, and artifact content.
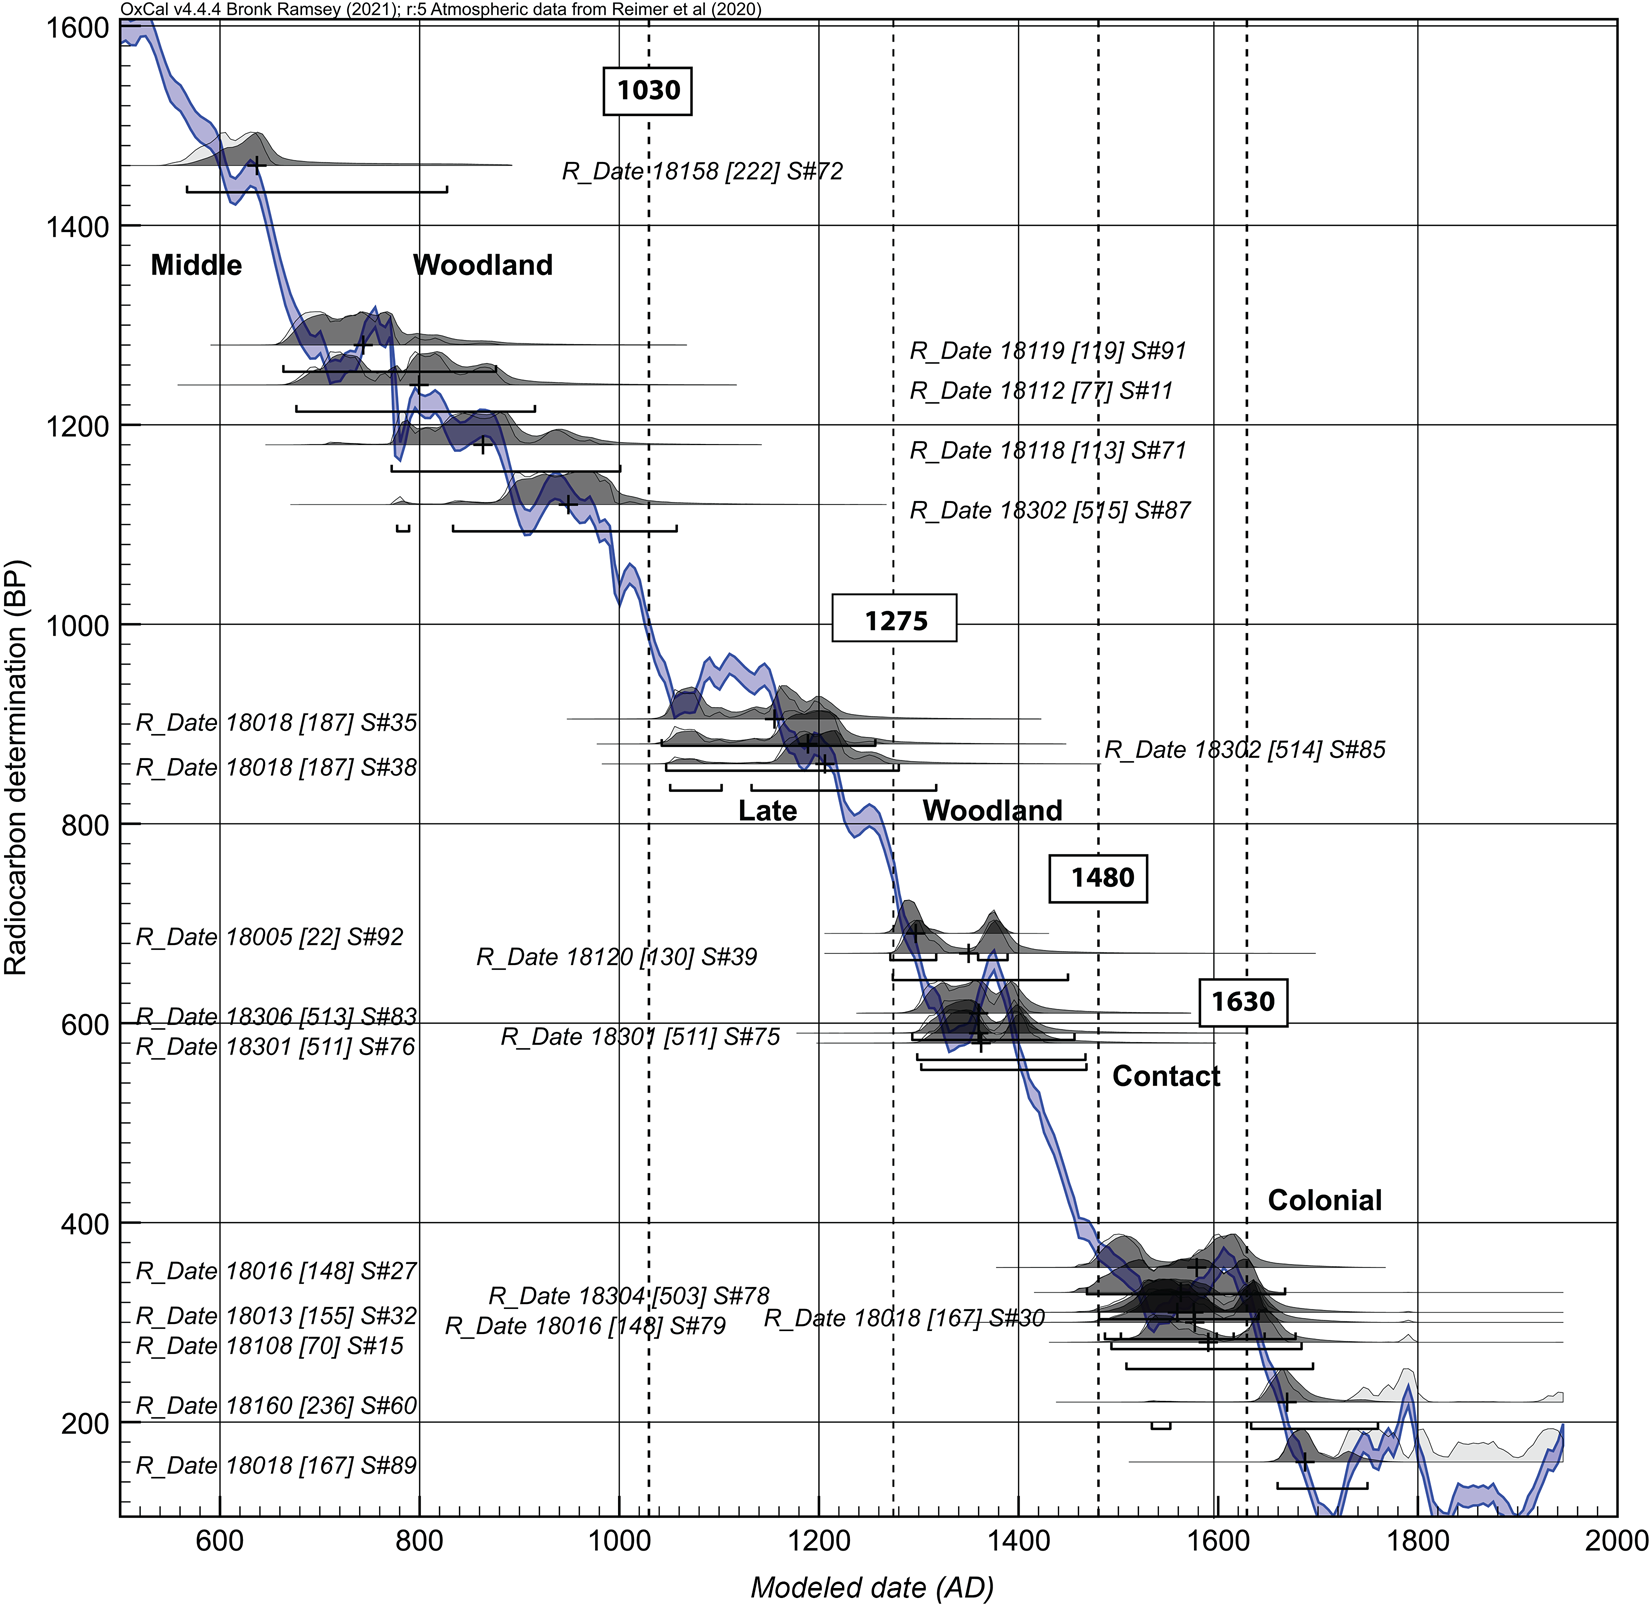
Six of the radiocarbon dates from five units fall in the plateau between 1480 and 1630 (Figure 4; Table 1), which broadly corresponds to the span that the MHC defines as the Contact period. This plateau is a section of the radiocarbon calibration curve that is relatively flat, meaning that any radiocarbon date will yield a wide range of calendar dates (Thompson et al. Reference Thompson, Jefferies and Moore2018:182). The AD 1480–1630 plateau was critical in the original identification of the natural fluctuations in atmospheric 14C (Grootes and van der Plicht Reference Grootes and van der Plicht2022) that led to the calibration of radiocarbon dates. Without very exact stratigraphic control and constraints, any date that falls in this (or any) plateau cannot be refined. The AD 1480–1630 14C calibration curve plateau spans much of the period of European expansion and colonization.
Calibrated and modeled dates superimposed on the IntCal20 Calibration curve (Reimer et al. Reference Reimer, Austin, Bard, Bayliss, Blackwell, Ramsey and Butzin2020). Dark-gray density curves are the modeled range, and light-gray curves show the full unmodeled range (see Supplemental Text 3 for the code).
The combination of the AMS date, the artifact content of the deposits, and the stratigraphic sequence in each excavation unit allowed their assignment to this 1480–1630 plateau on Great Island Site 2. None of the 1480–1630 plateau deposits contain European material, nor for the most part do they contain temporally diagnostic Indigenous material. Three sequences include AMS dates on wood charcoal or burned seed samples (from EUs 18016, 18018, and 18108), with AD 1480–1630 plateau components overlain by later deposits that suggest good integrity.
EU 18013
The multicomponent EU 18013 sequence is similar to EU 18016, with an AD 1480–1630 deposit directly underlying a colonial deposit. The AD 1480–1630 period date is on a piece of unidentified wood charcoal from a thin shell midden (150–156 cm bs) that contained a single piece of quartz shatter and a single piece of Native ceramic. It was capped by a 10 cm thick aeolian sand layer (140–150 cm bs) overlain by a 10 cm thick colonial occupation layer (130–140 cm bs) that was also very low density, containing only two fragments of brick at the upper interface.
EU 18016
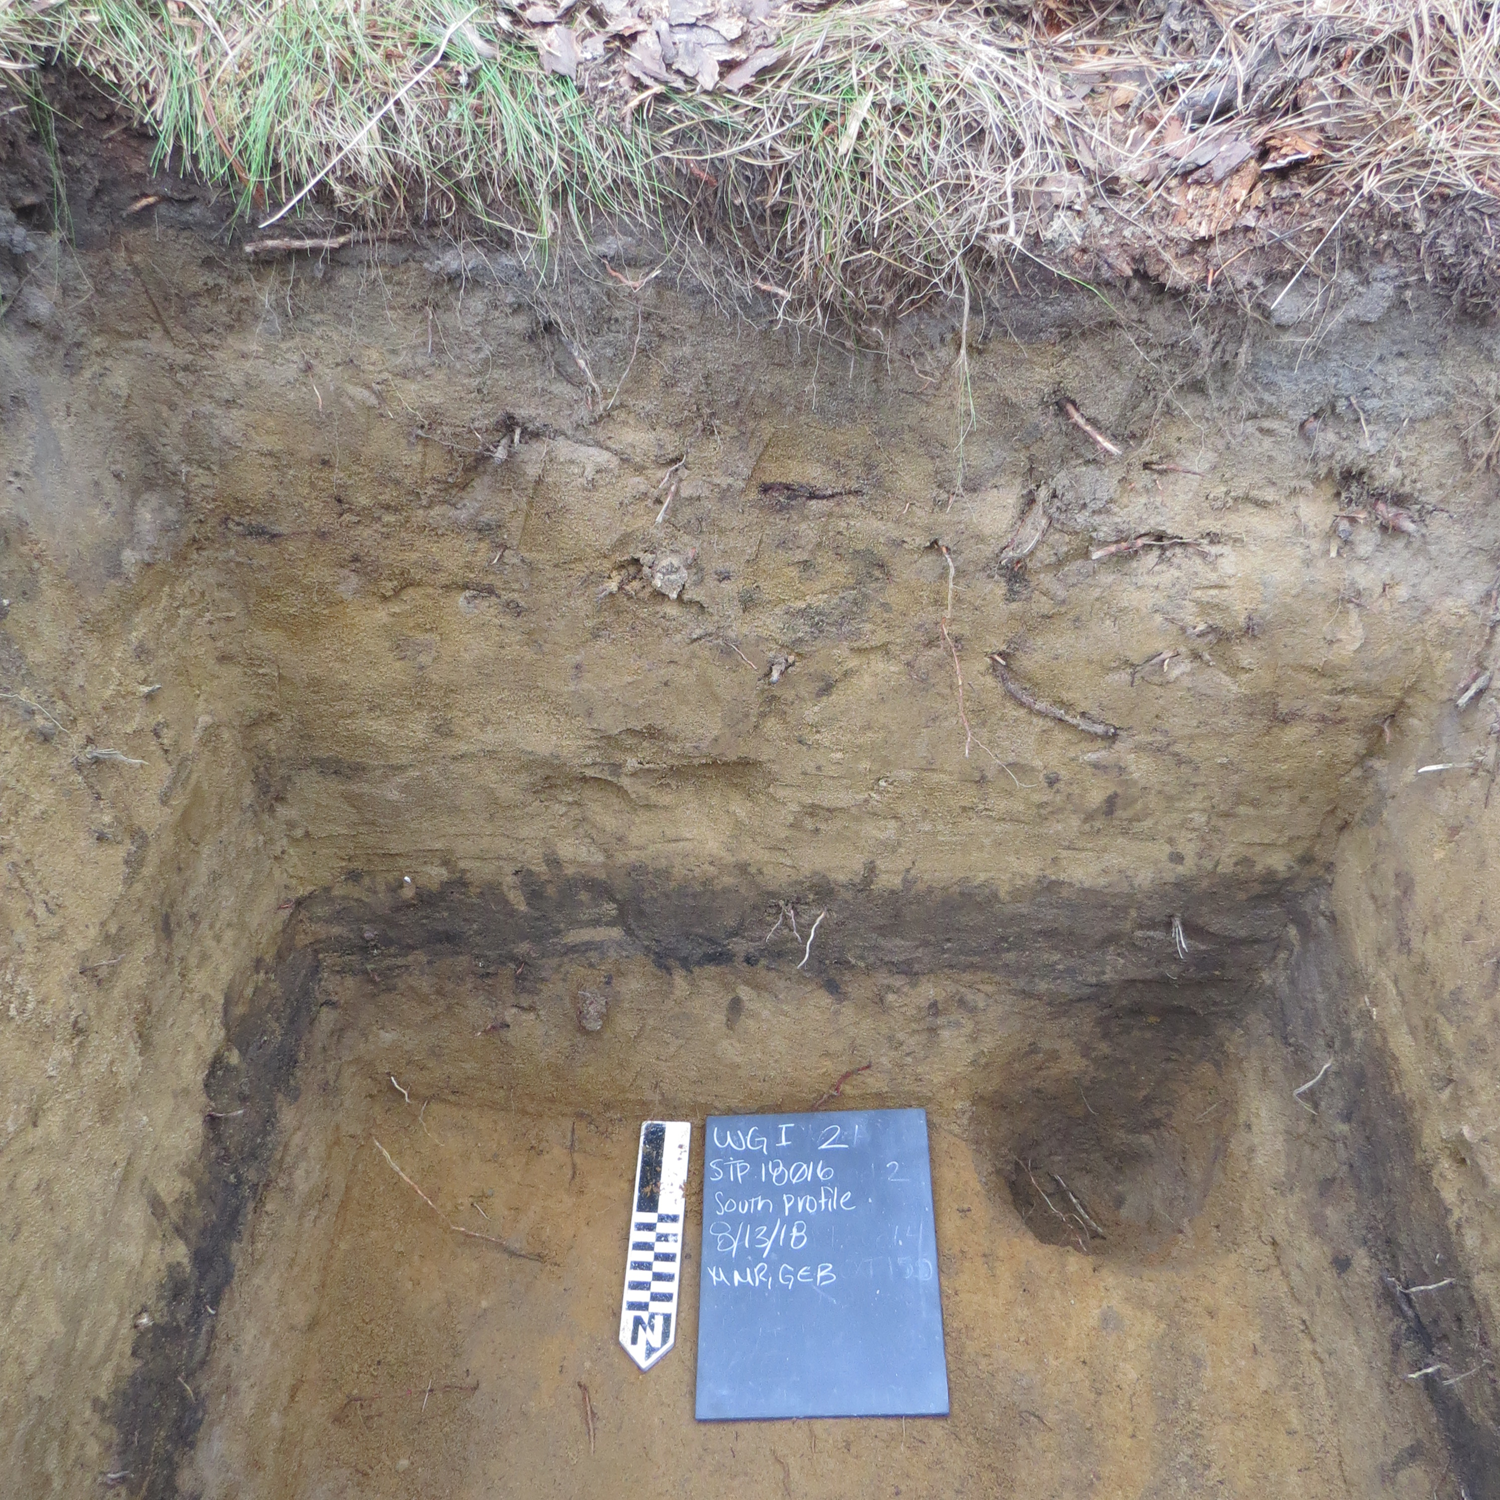
Two charcoal samples from Unit 18016, from the same occupation layer (95–105 cm bs) that contained cross-mending pieces of a decorated Native pottery vessel and two pieces of lithic chipping debris, were dated to the AD 1480–1630 period. Both charcoal samples are from unidentified wood. The two charcoal samples from the lowest occupation layer (148) in unit 18016 are not stratigraphically separated, but the dates are on different samples. Context 148 was the lower of two stratified occupation layers, and the upper layers (75–95 cm bs) contained one of the only significant concentrations of colonial period artifacts situated away from the tavern (contexts 140 and 141). There is a posthole (context 142) on the south side of the unit (Figure 5) that is undated because neither flotation sample yielded any charcoal. The combination of the AMS date, the Native ceramic vessel, and the stratigraphic position beneath a colonial surface, which itself was buried by about 0.75 m of aeolian sand, indicate an AD 1480–1630 occupation.
South wall of Unit 18016, showing stratified occupation layer and posthole. Photograph by Fiske Center for Archaeological Research. (Color online)
EU 18018
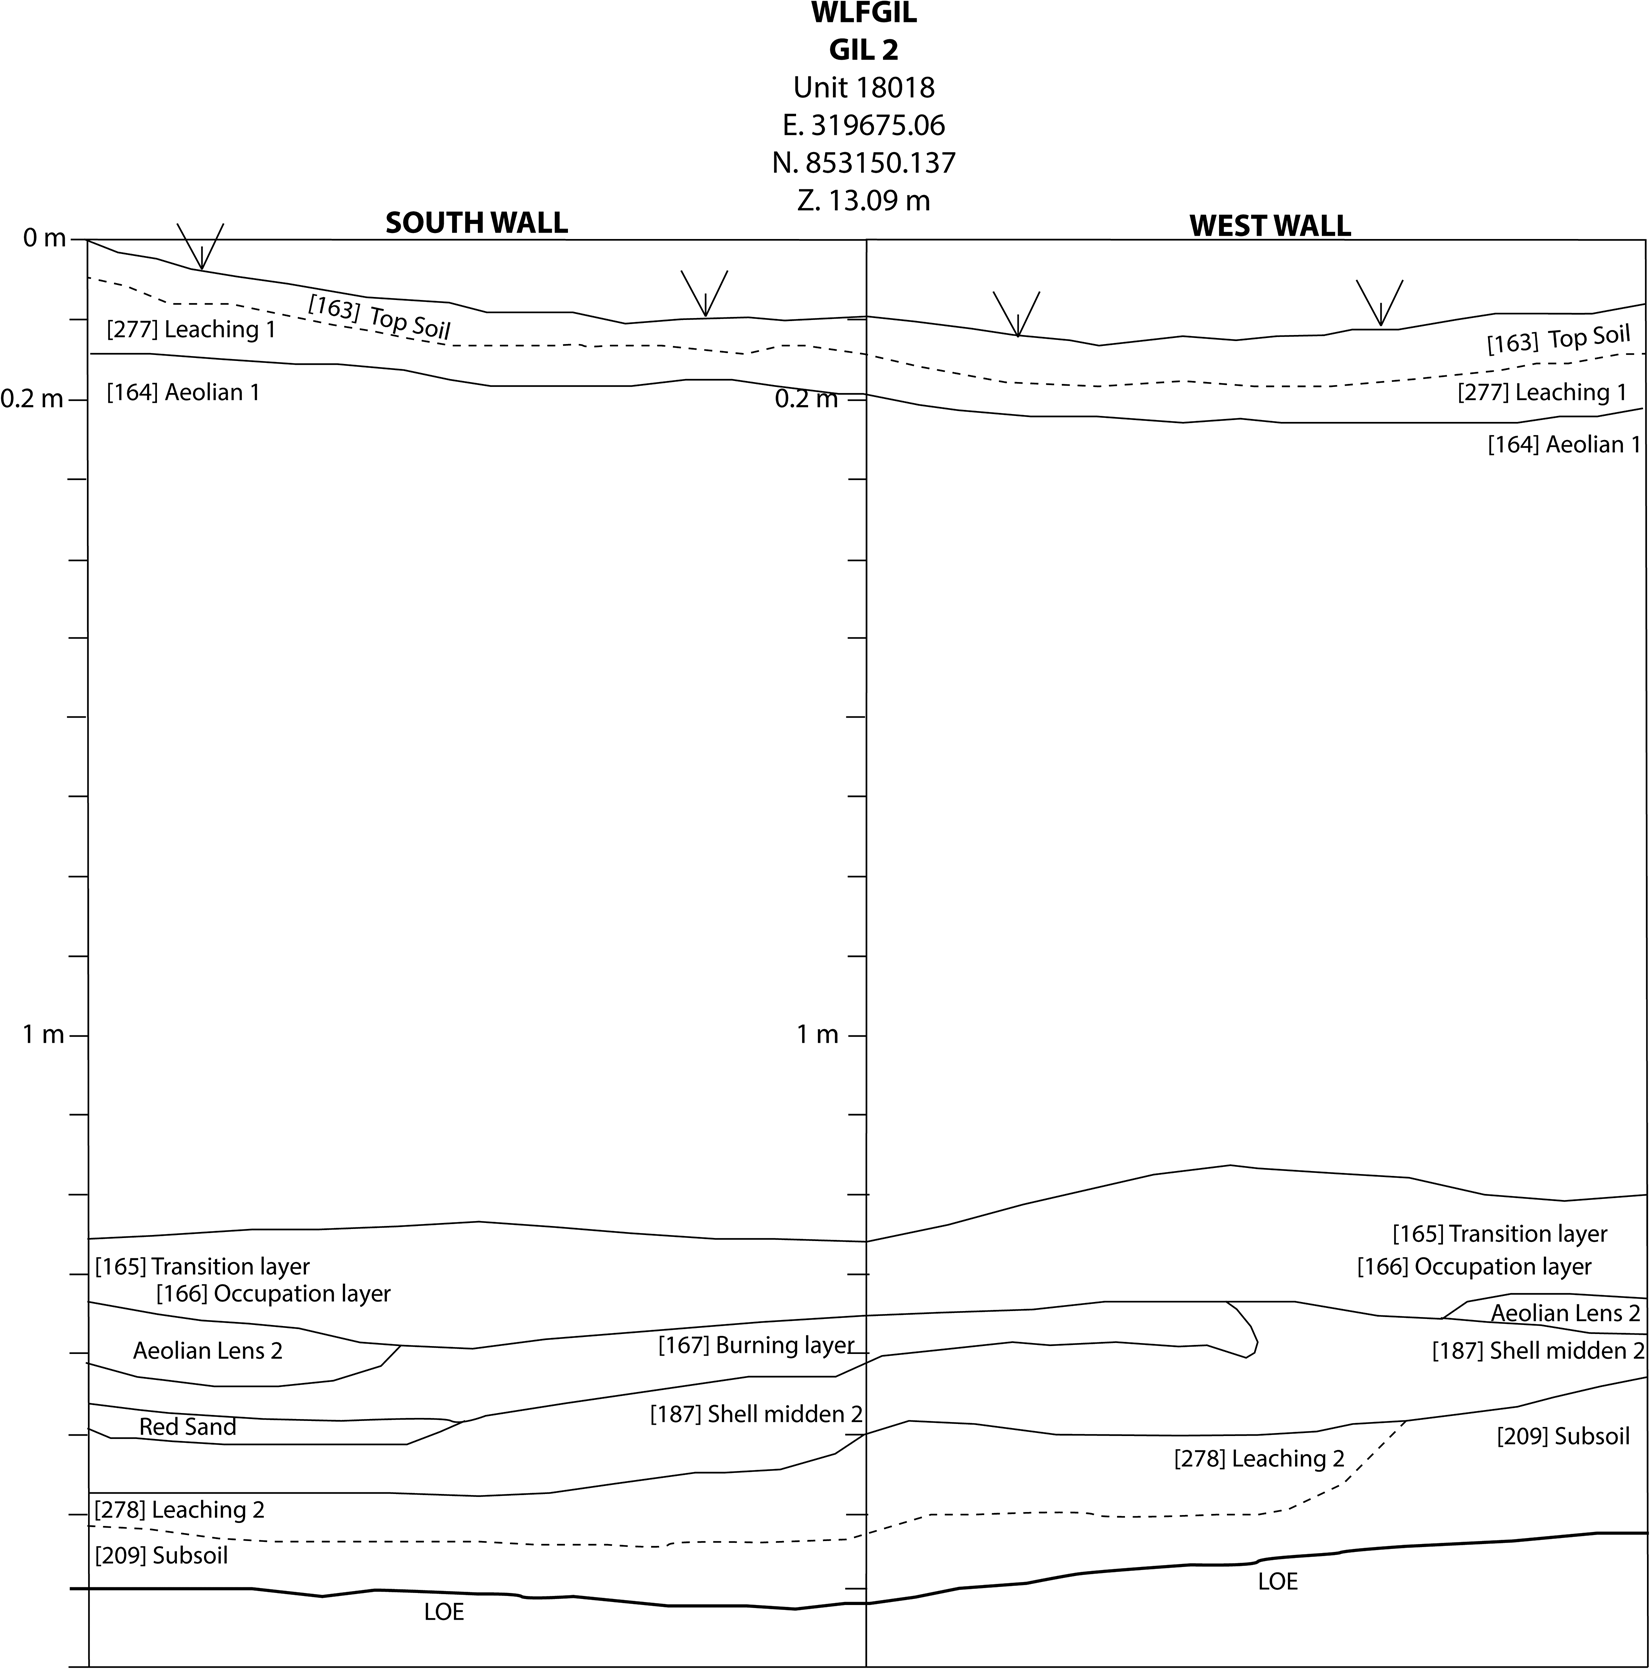
Four samples were dated from unit 18018 (Figure 6; Supplemental Text 2). Two samples were from flotation sample #30, which was taken from a feature (136–140 cm bs; 167) formed during the high-temperature burning of shell, probably to make mortar or plaster for the initial construction of the colonial tavern 50 m to the southwest. The sample from this context yielded two AMS dates: one from a charred bayberry seed that has an earlier date and one from a charred wheat seed with a more recent date. These two dates are separated by 150 uncalibrated radiocarbon years, and their 2σ calibrated date ranges do not overlap. This suggests that the feature may have been fired during the colonial period but may have incorporated earlier (AD 1480–1630) material. The deposit was assigned to the colonial period based on the combination of these two dates and the presence of two nails and a spike. The two early dates from the shell midden (187) layer immediately underneath the burning feature suggest that the shell midden was occupied during the earlier part of the Late Woodland. The modeled sequence (Figure 7; Supplemental Text 2) suggests a continuous occupation or even contemporaneity between the Contact and colonial contexts (e.g., a median difference of 11 years). Conversely, the model suggests a substantial break of more than 200 years between the Late Woodland shell midden (187) and the Contact/colonial burning layer (167).
Profile of south and west wall from Unit 18018; context numbers are in brackets.
Modeled radiocarbon dates for unit 18018. Dark-gray density curves are the modeled ranges, and light-gray curves show the full unmodeled range. The + indicates the median modeled value. and the bracket underneath denotes the modeled 95.4 range (derived from Code 1 in Supplemental Text 2).

The date from context 70 in EU 18108 comes from a piece of pine charcoal found within a posthole (84–100 cm bs) that contained no artifacts. This posthole and one other at the same elevation cut through a pit feature containing only shell. The postholes and the pit feature were capped by a thin aeolian sand deposit, overlain by a colonial period shell midden containing bird shot, brick, and buff-bodied earthenware. The colonial period shell midden was overlain by about 65 cm of aeolian deposit.
EU 18304
This AD 1480–1630 date comes from a charred pinecone in a sample taken from an eroding shell midden visible along the cliff face. Because it does not come from an excavated context, there is no artifact data.
Location and Distribution of AMS Dates
The distribution of radiocarbon dates across Great Island Site 2 suggests that the entire site had been visited continuously for the past 1,500 years. Dates from the four plateau periods are distributed across the site (Figure 3). The oldest charcoal date, from unit 18119, is firmly in the Middle Woodland. This shell midden is just 6 m away from another shell midden deposit in unit 18120 (130) that dates to the Late Woodland. These two units are less than 15 m from unit 18108 where a posthole (70) yielded an AD 1480–1630 date that was overlain by a colonial deposit (67). All these units are less than 25 m away from the Great Island tavern deposits with a date range of about AD 1690 to 1740 (Synenki and Charles Reference Synenki and Charles1984). Thus, the tavern area saw a deep temporal occupation across the immediate area.
This same broad range of dates is also apparent 200 m northeast where there is an exposed shell midden on the cliff face. The earliest date in that area is from the bottom of cliff-face sample 18302 (515), which yielded a Middle Woodland date. In the same sample but higher up in the sequence (514), another piece of hardwood yielded a Late Woodland date. About 20 m to the northeast, two Late Woodland dates were obtained from a cliff-face sample 18301 (511). Just a few meters away, an AD 1480–1630 date was obtained on a piece of pinecone (18304; 503) removed from the cliff-face midden. Less than 20 m inland from the eroding cliff face, unit 18005 yielded a Late Woodland occupation layer (22) overlain by a colonial (21) layer (dated by a recovered pipe stem).
Dates on archaeological deposits in the AD 1480–1630 plateau are spatially and stratigraphically adjacent to deposits from a variety of time periods from the Middle Woodland to the colonial period, rather than restricted to a defined area. All these stratigraphically consistent and spatially variable dates suggest that, like the tavern area, the rest of the site hosted a long-term occupation.
Dating and Modeling
All the more recent Great Island Site 2 dates fall on plateaus in the radiocarbon calibration curve (Figure 4). Although a majority of the occupation span dates are found on various plateaus (e.g., Guilderson et al. Reference Guilderson, Reimer and Brown2005), this does not necessarily mean that occupation was periodic and that it did not occur during the steep parts of the radiocarbon calibration curve. What it does mean is that the calibrated dates fall into groups that are potential plateau periods. For Great Island Site 2, the four substantial plateau groups broadly correspond to the periods archaeologists have constructed based on the association of stylistically diagnostic artifacts and radiocarbon dates (Chilton Reference Chilton and Pauketat2012; Ritchie Reference Ritchie1969; Watson Reference Watson2020).
The most recent plateau group runs from AD 1630 forward, and it roughly corresponds to the colonial period. The next group is usually delimited as running from AD 1480 to 1630 (Manning et al. Reference Manning, Birch, Conger and Sanft2020) and broadly corresponds to the Contact period. There are two proceeding plateaus, that, when combined, correspond to the Late Woodland period. The more recent Late Woodland plateau runs from about AD 1275 to 1480, and the earlier one runs from AD 1030 to 1275. Although not strictly a plateau or reversal, the tightly spaced wiggles during the AD 500–1030 range, representing the Middle Woodland component at Great Island Site 2, make for substantial overlap of calibrated dates on widely spaced radiocarbon dates.
The AD 1480–1630 radiocarbon plateau spans much of the period of European expansion and colonization. Using a combination of Bayesian modeling of a robust set of radiocarbon dates with stratigraphic and material culture analysis, Birch, Manning, and their colleagues have been able to sequence a series of discrete, short-term, intense occupations from numerous sites in upstate New York and southern Ontario (Birch et al. Reference Birch, Manning, Conger and Sanft2020; Manning Reference Manning2020; Manning et al. Reference Manning, Birch, Conger, Dee, Griggs and Hadden2019, Reference Manning, Birch, Conger and Sanft2020). They have also been able to establish that some occupation deposits precede the construction of Fort Orange in New York in 1624. Their analysis links Dutch/Indigenous interaction to a location on the Hudson River long used by Indigenous populations (Manning et al. Reference Manning, Huey, Lucas and Hart2021:208–209).
These successful models depend on the reasonable assumptions and conditions (for New York and Ontario) of short-term, intense, permanent occupations that can be bracketed with dendrochronology. The bracketed short-term occupations have allowed the distinct sites to be placed, using Bayesian statistics, in reasonable chronological order (Abel et al. Reference Abel, Vavrasek and Hart2019; Birch and Hart Reference Birch and Hart2021; Birch et al. Reference Birch, Manning, Sanft and Conger2021; Hart and Lovis Reference Hart and Lovis2012; Manning et al. Reference Manning, Birch, Conger, Dee, Griggs, Hadden and Hogg2018).
For the area at the eastern tip of Great Island, there is almost an inverse set of circumstances from that in New York and Ontario. The Great Island deposits suggest long-term, repeated, low-intensity, extensive occupation. The commonality is that a program of radiocarbon dating and the concomitant Bayesian modeling suggest an important and substantial occupation span where European contact does not immediately and dramatically alter Indigenous land use.
Bayesian chronological modeling of radiocarbon dates is a statistical method that takes into account the uncertainties associated with radiocarbon dating and other sources of chronological information, such as artifact date, stratigraphy, and historical records, to constrain or expand the date of a radiocarbon sample or a group of samples in an unordered phase or ordered sequence (Bayliss Reference Bayliss2015; Bronk Ramsey Reference Bronk Ramsey2009). The Great Island Site 2 sequence was modeled in two ways: as a whole sequence (Supplemental Text 3) and by breaking the dates into sequential plateau phases that generally correspond to the MHC chronology and the radiocarbon plateaus—Middle Woodland, Late Woodland, Contact, and colonial periods (Figure 8; Supplemental Text 4).
Modeled radiocarbon dates for all carbon Great Island Site 2. Dates of boundaries of phase plateaus are indicated. Dark-gray density curves are the modeled ranges (Table 2 in Supplemental Text 4), and light gray curves show the full unmodeled range (derived from Code 2 in Supplemental Text 4).
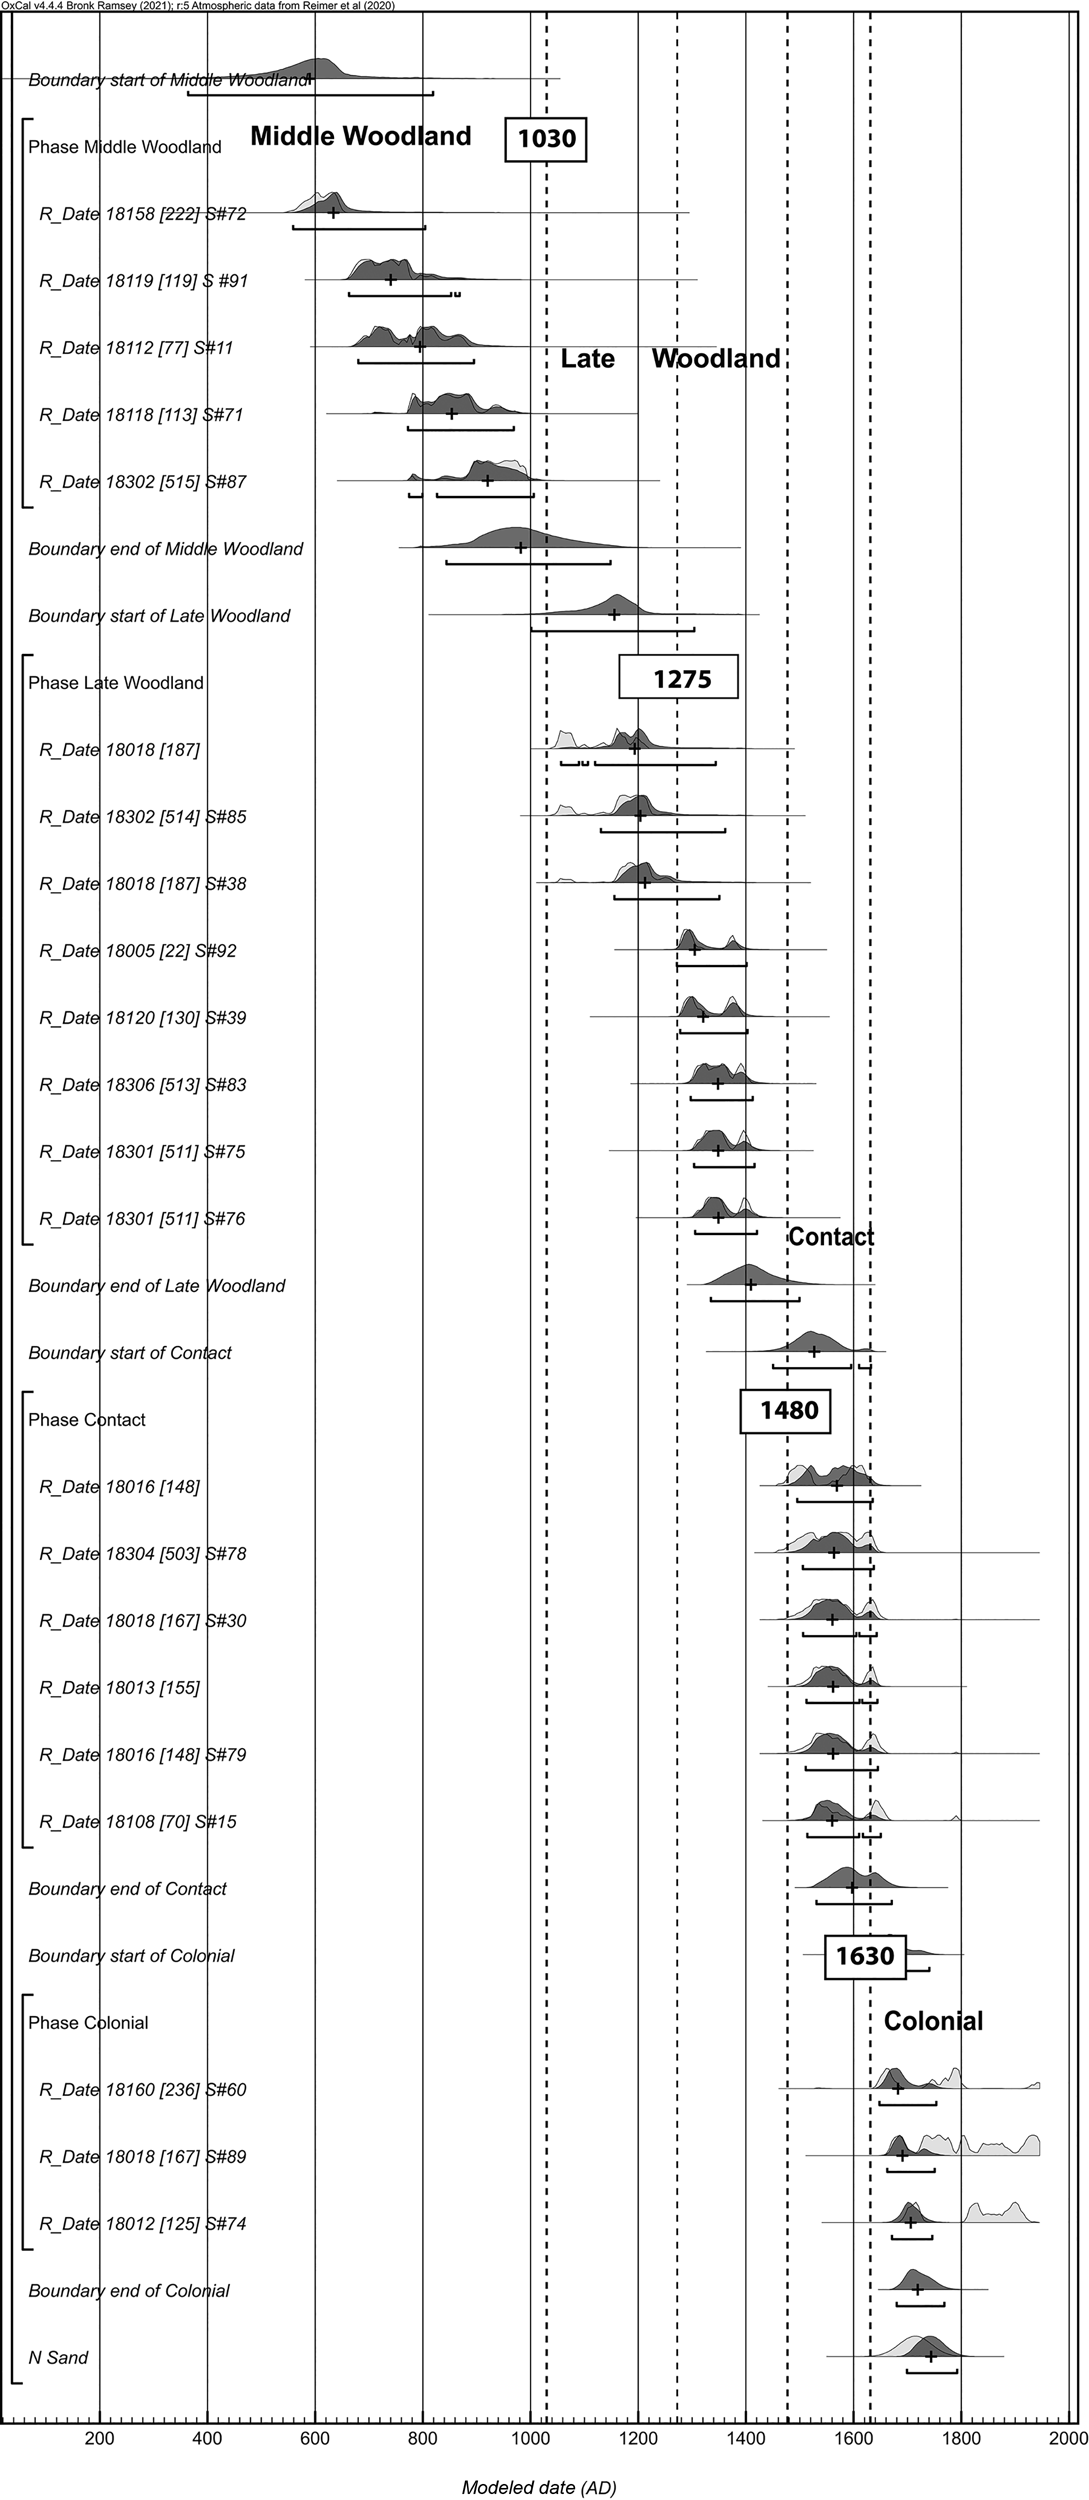
For the sequential plateau phases, the dates are placed into phases based on their dates (Supplemental Text 4). The plateau-phase model is circular, assuring good agreement (Bronk Ramsey Reference Bronk Ramsey1995) and violating basic assumptions of Bayesian statistics. This model uses the information from the AMS data itself in constructing the models (Buck and Meson Reference Buck and Meson2015). In fact, the model splits two samples from the same context into the Contact and colonial phases; this situation is correctly modeled in Supplemental Text 2 and Figure 7. Using this plateau-period model to construct a new chronology or determine a new division would be disingenuous (see the Hamilton and Krus [Reference Hamilton and Krus2018] comment on Cook et al. [Reference Cook, Comstock, Martin, Burks, Church and French2015]). Instead, this model forces divisions between the plateaus that roughly correspond to the periods currently in use. In this unusual approach, this model is an attempt to make Bayesian phases, which are usually defined by archaeological relationships (Hamilton and Krus Reference Hamilton and Krus2018), mimic traditional archaeological periods by creating breaks based only on the date. The boundaries between the phases assume that the dates are uniformly distributed through each plateau phase. Even in this situation, the distribution of dates, the lack of evidence for short-term occupations (as in the earlier New York example), and the smearing of the calibrations along the plateaus make any gap between the Contact and colonial periods negligible. That is, even when forcing the model to create a division, there does not seem to be a substantial break in activity at Great Island Site 2 between the Contact and colonial periods.
The plateau-phase models are written based on two assumptions: (1) that the dates directly reflect human activity and that (2) the dates on wood may be earlier than the targeted human activity (Supplemental Text 4). Most of the dates used to analyze the sequence at Great Island Site 2 are on wood (n = 18), whereas four are on seeds. Furthermore, only one of the Woodland period dates comes from a seed (Table 1). Old wood can make reconstructing occupational history difficult (Nolan Reference Nolan2012). The radiocarbon dates on seeds (μ = 372.5 radiocarbon years BP, s = 224.9) tend to be more recent than the AMS dates on wood (μ = 666.39 radiocarbon years BP, s = 369.2, t = 2.07, df = 7.21, p = 0.08). It is unlikely that the colonial period wood charcoal is intrusive because it is under at least 30 cm of aeolian sand and often much deeper sand deposits. Assuming the dated wood is old (which gives slightly greater plateau-phase gaps), the 95.4% hpd range of the forced boundary at the break between the first two plateaus is only 0–142 years, with a median of 65 years (Table 2 in Supplemental Text 4). The median modeled intervals for a potential Late Woodland–Contact break is 115 years, and the Middle–Late Woodland potential break is 159 years.
The distribution of dates at Great Island Site 2, the lack of any temporally diagnostic material, and rigging the model to force the AMS dates into periods that are roughly consistent with the current periodization do not produce defined gaps. This all suggests that there is a continuous long-term occupation and particularly no appreciable Woodland–colonial gap. The lack of a gap is all the more important because without the program of radiocarbon dating the substantial Contact plateau-phase occupation would not have been identified and a gap between the Woodland and colonial periods (without a Contact component) would have been assumed.
Discussion
Watson (Reference Watson2020) finds that when the number of radiocarbon dates associated with a single black earth and shell midden site in southern coastal New England (Martha's Vineyard) is increased, the calibrated dating sequence does not become more concentrated on a few decades of similar overlapping dates. Instead, it becomes spread out over hundreds, if not thousands, of years. Furthermore, calibrated dates from the same strata and even the same feature can differ by hundreds of years. The Great Island Site 2 dates follow a similar pattern where stratigraphically consistent layers from the Middle Woodland to the colonial period were deposited on a continuous surface that is today deeply buried and well preserved.
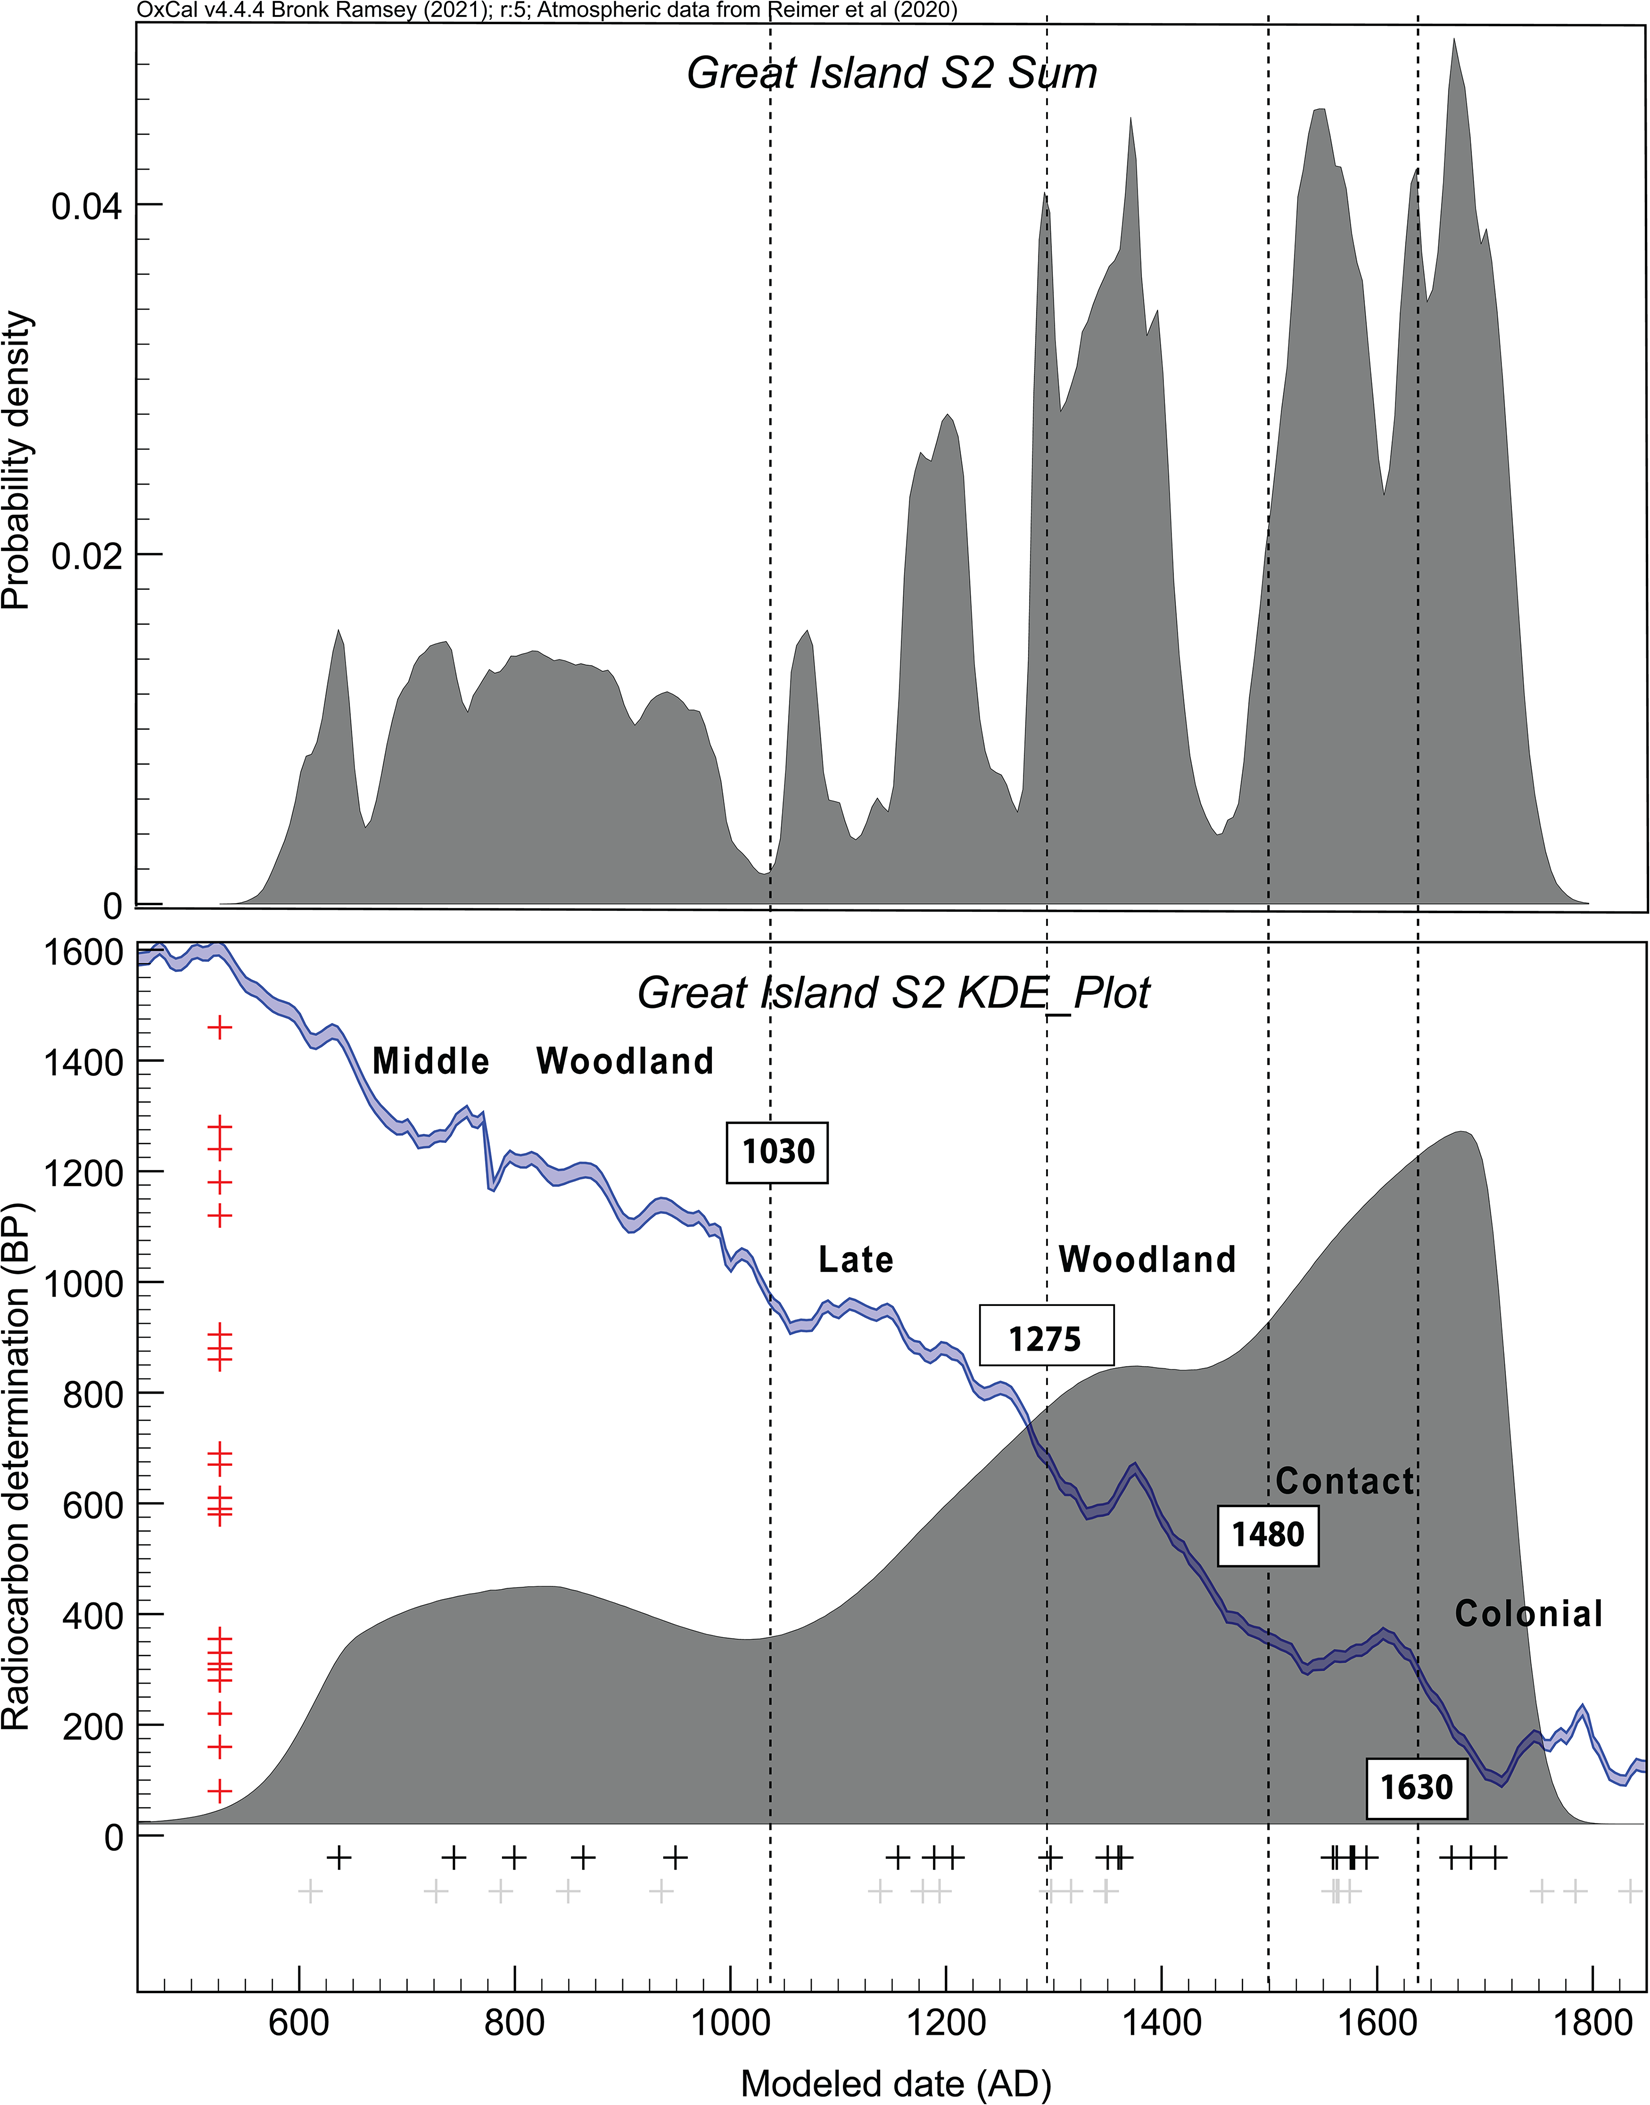
Sum and kernel density (KDE) plots are methods for formalizing the distribution of calibrated dates (Bronk Ramsey Reference Bronk Ramsey2017). Although there are too few samples from Great Island Site 2 for a reliable assessment of the distribution of dates (Williams Reference Williams2012), the two plots do go some way toward summarizing the distribution of dates (Figure 9; Supplemental Text 3). The limited number of dates from Great Island Site 2 follows the basic trend for there being more dates from more recent periods (Surovell and Brantingham Reference Surovell and Brantingham2007). Although the sum distribution suggests a few breaks, the KDE—which does smear the distribution (Bronk Ramsey Reference Bronk Ramsey2017:1816)—hints at a broad continuity of occupation and increasing activity through time.
Kernel density and sum of dates from Great Island Site 2. Dates of boundaries of phase plateaus are indicated. (Bottom) Plot showing the output of the KDE model method (Bronk Ramsey Reference Bronk Ramsey2017). The red crosses indicate the radiocarbon determination, the black crosses show the medians of the marginal posterior distributions for the unmodeled dates, and the light-gray crosses show the medians of the likelihood distributions from modeled dates; (top): sum distribution for reference (derived from Code 1 in Supplemental Text 3). (Color online)
The present suite of radiocarbon dates, as well as work by Watson (Reference Watson2020), suggests that one or two dates on features or stratigraphic layers of a southern coastal New England site only represent that immediate feature or localized strata sample but might not characterize a broader area, let alone the site as a whole. At Great Island Site 2, the spatial and temporal radiocarbon date distribution resulted in a patchwork dispersal of dates, where the date on a shell midden in one pit was not at all consistent with the date from a shell midden in a neighboring excavation. This patchy nature was reinforced by the wide variety of dates that resulted from closely spaced strata in the same excavation unit, even though the dates are entirely consistent with stratigraphic integrity. If other southern coastal New England sites contain a wide range of occupation times from adjacent deposits, then much of the basic chronology of the Woodland period through seventeenth-century Indigenous sites should be reexamined.
Conclusion
Overall, the results of this work demonstrate the value of using radiocarbon dates, and not the presence of diagnostic or European artifacts, to identify Indigenous occupations between the fifteenth and seventeenth centuries in coastal Massachusetts. Furthermore, assessing the complete temporal span requires multiple dates from a variety of locations because of the extensive and repeated but sometimes low-intensity use. The methods that archaeologists have been using to assign dates to sites have not always been compatible with documenting continuity and thus affect the visibility of Indigenous sites in the centuries before and after European colonization in ways that can have contemporary implications (Beaudoin Reference Beaudoin2016; Panich and Schneider Reference Panich and Schneider2019). Failure to recognize the number and extent of fifteenth-, sixteenth-, and seventeenth-century sites in New England reduces the territorial scope and the sense of continuous occupation for Indigenous people on the landscape immediately before and well into the period of colonial settlement.
Extending this practice will do more than put sites on the map: it will also allow a better understanding of the full range of land uses by Indigenous people on the Cape. As Lightfoot and colleagues (Reference Lightfoot, Panich, Schneider, Gonzalez, Russell, Modzelewski, Molino and Blair2013) have argued, variations in Indigenous landscape management practices shaped how Native people interacted with colonizing groups. The radiocarbon dates show that Great Island was used for gathering shellfish until at least the early seventeenth century, and the documentary record suggests that, even after colonial settlement of the town of Eastham in 1651, Indigenous use of the areas around Great Island continued well into the eighteenth century. Continuing long-standing land management practices—resource gathering over an extensive area—may be one way in which the Indigenous occupants of the Cape responded to English colonial encroachment while maintaining their residence in their homelands.
The continuous occupation, as identified archaeologically, puts early documents concerning Great Island, which the colonists designated as “common land,” into better context. Early eighteenth-century town records show that Indigenous and English colonial residents of Eastham used Great Island and the surrounding islands for whaling. The 1710 Eastham town records mention paying Native people for whaling expeditions conducted from Great Island (Echeverria Reference Echeverria1993:96). Petitions to the governor of Massachusetts and the General Court (Massachusetts State Archives, 1622–1788, Colonial Period Collection, Vol. 113, pp. 606–608) written in 1711, opposing the division and privatization of Great Island, illustrate that the “Indians of Billingsgate” (the area surrounding and including Great Island) still relied on resources harvested from Great Island, specifically timber and access to swamps used for peeling bark, presumably to cover their houses. The petitions argued that the loss of access to this resource-gathering area would force them to leave this part of Cape Cod. Despite the petitions, the land was divided in 1715. This history, combined with recent archaeology, makes it clear that established, continuous, and economically important Indigenous activities coexisted with the English classification of Great Island as “common land.”
Both the archaeological record and documents suggest that when the Great Island Tavern was established in the late seventeenth century, Great Island was a multicultural space. Ekholm and Deetz's interpretation of the tavern (Deetz Reference Deetz1996; Ekholm and Deetz Reference Ekholm and Deetz1971) began with the question of why it was established in such an isolated location. They did not consider the deeper history of the task-scape but instead attributed the tavern's construction to the introduction of an English shore-based whaling industry in the 1690s. With the aid of AMS dating and well-controlled stratigraphic and spatial controls, it becomes clear that the location was part of an active and extensive Indigenous landscape starting more than 3,000 years ago that continued through the sixteenth and into the seventeenth centuries. The current site is extensive (11,870 m2 in area) but may have been much larger in the past, given the high rate of coastal erosion since 1715 (see Steinberg et al. Reference Steinberg, Beranek, Mrozowski and Piechota2022).
The stratigraphic sequences identified at Great Island Site 2, as well as the broad spatial and temporal spread of radiocarbon dates, yield no appreciable break in activity and resource extraction at the eastern tip of Great Island corresponding with European exploration, contact, or initial settlement of the surrounding area. In fact, activity may have increased during the time of European exploration and colonization. This sequence is an example of how colonial processes are long-term entanglements, not short-term contacts or encounters (Silliman Reference Silliman2005). In three of the locations where there are AD 1480–1630 dates, there is both a Woodland layer below and an overlying colonial period layer above. This suggests that English colonists followed the same pattern of use, extracting marine resources and layering their activity onto the spaces used by Indigenous groups. The sequence at Great Island indicates that, even though colonialism did eventually change the Indigenous use of Great Island, that change was part of a long-term process that is much better understood with detailed radiocarbon dating. European contact did not result in an immediate break in Indigenous lifeways, particularly in the use of these extensive, low-intensity sites.
Acknowledgments
James M. Harmon of the US National Park Service (NPS) spearheaded the development of this cooperative project, and we thank him, along with James Nyman, William A. Griswold, Brian Carlstrom, and Leslie Reynolds, for their help. William “Bill” Burke, the CACO cultural resources program manager, was incredibly helpful as a liaison with the NPS, and we are grateful for his logistical and intellectual contributions. The crew included Grace Bello, Melissa Ritchey, Lauryn Poe Sharp, Ana Opishinski, Gary Ellis, Dr. Elizabeth DeMarrais, Nicholas Zeitlin, and Hartman Deetz, who also served as Native Monitor. Holly Herbster of the Public Archaeology Laboratory was incredibly helpful and provided detailed information on its earlier archaeological work. Brian Damiata was instrumental in identifying and dating the deposits. We also thank Andrea E. Chavez for writing the Spanish abstract.
Funding Statement
This work was made possible by a Cooperative Agreement between the US Department of the Interior and the University of Massachusetts Boston under the North Atlantic Coast Cooperative Ecosystems Studies Unit program (NAC-CESU). The project was titled “Inventory and Monitor Endangered Archeological Sites at Great Island and Great Beach Hill, Cape Cod National Seashore, Wellfleet, Massachusetts” and was conducted in cooperation with the CACO unit of the NPS.
Data Availability Statement
The AMS data supporting these findings are available in the article and Supplemental Texts 1–4. Additional data about the site are contained in the technical report on this work (Steinberg et al. Reference Steinberg, Beranek, Mrozowski and Piechota2022), which is available by request from the corresponding author.
Competing Interests
The authors declare none.
Supplemental Material
For supplemental material accompanying this article, visit https://doi.org/10.1017/aaq.2024.80.
Supplemental Text 1. Ossuary Radiocarbon Models, Including OxCal Runfiles, Resulting Multiplot Model, and a Table of Resulting Unmodeled and Modeled Dates.
Supplemental Text 2. Unit 18018, Including Chronological Model Code (OxCal runfiles) and Resulting Tables.
Supplemental Text 3. KDE, Sum, and Curve Model (OxCal Runfile) from Table 1 Modeled as a Continuous Phase Capped by Sand.
Supplemental Text 4. Plateau-Period Models: Radiocarbon Dates from Table 1, Divided into Sequential Phases That Roughly Correspond to the Current New England Periodization and to Plateaus and Wiggles of the Radiocarbon Calibration Curve.


 Open access