

Sources of food/drink can differ substantially between communities. In lower-income communities (especially those with higher proportions of racial/ethnic minorities), fast-food outlets and convenience stores appear more often than in wealthier communities (especially those with higher proportions of white residents)(Reference Hilmers, Hilmers and Dave1–Reference Fleischhacker, Evenson and Rodriguez5). Additionally, in wealthier and predominantly white communities, there tend to be greater number of supermarkets, produce markets and natural food stores(Reference Maguire, Burgoine and Penney4–Reference Moore and Diez Roux8).
Whether various food stores and restaurants are present can certainly differ by community, but such differences may not adequately describe broader community food/drink disparities(Reference Lucan9). As one potential reason, even if present, the same type of store may sell different items in different communities. For example, ‘convenience stores’ in lower-income, minority communities may sell fewer healthful items (e.g. fruits, vegetables and low-fat milk) than ‘convenience stores’ in wealthier, predominantly white communities(Reference Gordon, Purciel-Hill and Ghai10). As another potential reason, sources of food/drink can include not just what are typically thought of as ‘food stores’ and restaurants but also other storefront businesses (OSBs). OSBs that commonly offer food/drink include gas stations, pharmacies and dollar stores(Reference Caspi, Pelletier and Harnack11–Reference Coughenour, Bungum and Regalado16). Additional food/drink-offering OSBs can include all of the following: laundromats, hardware stores, barber shops, beauty salons, and professional offices among various other kinds of retail businesses(Reference Farley, Baker and Futrell17–Reference Lucan, Maroko and Patel22). Limited prior research has shown that OSBs offer less-healthful items (e.g. cookies, candies, salty snacks) more often in higher-poverty, minority communities than in wealthier, whiter communities(Reference Lucan, Maroko and Seitchik18).
Beyond OSBs, and storefront businesses more generally, businesses offering food/drink in communities can also include non-storefronts. If storefronts are fixed operations from commercial buildings, non-storefronts are flexible operations from mobile or impromptu set-ups. Typical non-storefronts selling food/drink are street vendors(Reference Odoms-Young, Zenk and Mason23–Reference Lucan, Maroko and Shanker27). Prior research has shown that street vendors sell less-healthful items more often in higher-poverty, minority communities(Reference Lucan, Maroko and Bumol25). Also, street vendors specifically selling healthier fare might not distribute themselves in locations to meet the needs of such communities(Reference Lucan, Maroko and Shanker27).
To our knowledge, no prior studies have assessed healthful and less-healthful food/drink offerings from both storefronts (e.g. food stores, restaurants, OSBs) and non-storefronts (e.g. street vendors). As such, existing research on community food environments may provide an incomplete view of food/drink availability(Reference Lucan9,Reference Caspi, Sorensen and Subramanian28) . For example, studies may miss or mischaracterise the existence of so-called ‘food deserts’ (areas lacking access to healthful food) and so-called ‘food swamps’ (areas where less-healthful offerings overwhelm healthier options). Findings may therefore misrepresent implications for community nutrition, diet-related health, and health disparities; also, findings may be too limited to appropriately guide interventions or policy changes(Reference Larson and Story29).
The current study assessed both healthful and less-healthful food/drink availability from a full range of community businesses – all storefronts and non-storefronts on sampled streets. In particular, the study sought to quantify the contributions of OSBs and street vendors to total counts of community food/drink sources. Comparisons were made between two demographically dissimilar urban areas, representing marked differences in poverty and racial/ethnic composition. The study aimed to describe the extent of community food/drink offerings, particularly food/drink sellers that would be missed by an exclusive focus on so-called ‘food stores’ and restaurants. The study also aimed to describe disparities between areas, with implications for both future research and community health.
Methods
Sample
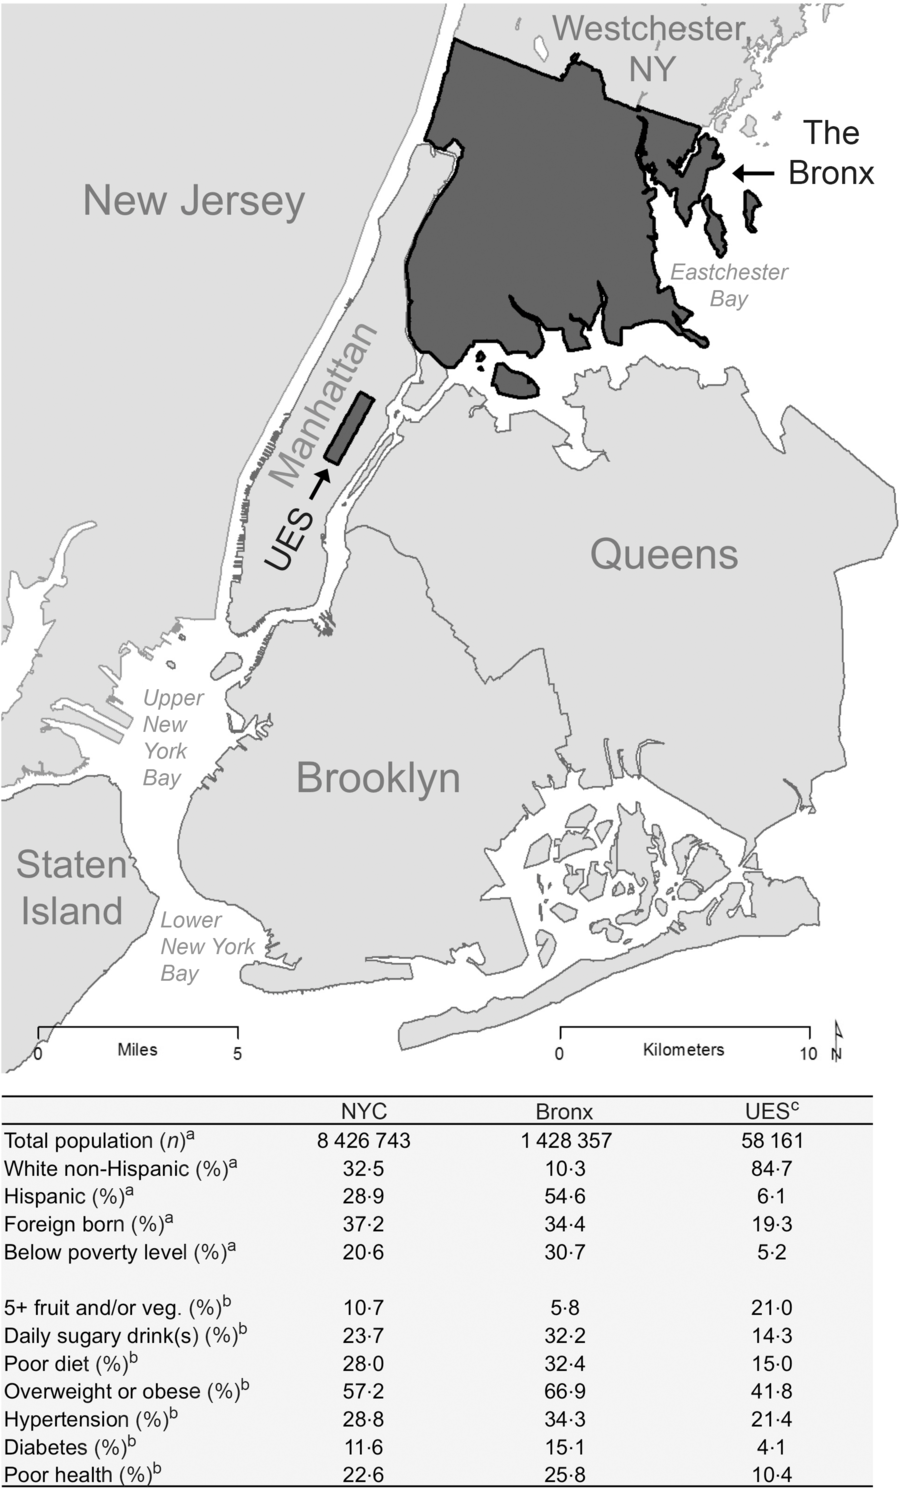
The current study compared two demographically divergent areas of New York City (NYC): the Bronx and the Upper East Side (UES) of Manhattan. As shown in Fig. 1, the Bronx is an area with all of the following: relatively high racial/ethnic-minority composition; relatively high levels of poverty; and relatively high levels of both less-healthful dietary intake and diet-related diseases The UES is a wealthier, predominantly white area with comparatively healthful dietary intake and comparatively favourable indicators of health(Reference Manson, Schroeder and Riper30,31) .
Map of study areas and demographic characteristics, 2015. NYC, New York City, UES, Upper East Side UES, a neighbourhood of Manhattan (Manhattan being one of the five boroughs of NYC along with Queens, Brooklyn, Staten Island and the Bronx.
In the two study areas, the sample included all storefront and non-storefront businesses on specified street segments (sections of streets between two intersections), derived from earlier studies(Reference Lucan, Maroko and Patel22,Reference Lucan, Maroko and Bumol32,Reference Lucan, Maroko and Abrams33) . Earlier studies included samples of street segments in residential, commercial, and mixed-use areas. The current study focused only on the commercial and mixed-use areas (i.e. the streets segments having retail lots). The Bronx sample had sixty-three street segments, and the UES sample had forty-six street segments – each randomly selected samples of streets having retail lots.
Measures
On a given retail segment, there might be both storefront and non-storefront businesses. To assess for both, a team of two researchers walked the length of each side of each street segment, weekdays (generally 10.00 hours–16.00 hours), June–August 2015.
For each identified businesses, researchers recorded the business name (business description for unnamed street vendors), the business type (e.g. ‘convenience store’, ‘laundromat’, ‘hot-dog cart’), the street address (closest address for street vendors), and whether the business was closed or open. If open, researchers also recorded whether any food/drink was available based on product displays, signage, and menus.
For food/drink categories, the study used schema developed in earlier research(Reference Lucan, Maroko and Seitchik18,Reference Lucan, Maroko and Seitchik20,Reference Lucan, Maroko and Bumol25) . Healthful food categories included fruits and vegetables, whole grains, and nuts; less-healthful food categories included refined sweets (e.g. cakes, candies) and salty/fatty fare (e.g. fried food, preserved meats). Healthful drink categories were water and unflavored milk; less-healthful drink categories were sugar-sweetened beverages and alcohol. Additional drink categories of 100 % juice and diet drinks were considered neither healthful nor less healthful given scientific debate about these drinks(Reference Nicklas, Kleinman and O’Neil34–Reference Ludwig36). Food items considered neither healthful nor less-healthful (e.g. eggs, cheese, and poultry) were not specifically assessed; the existence of such items precluded the compound categorisation of ‘any healthful’ from being the exact opposite of another compound categorisation: ‘only less-healthful’ (please see footnotes b and c of each of Tables 1–3 for additional details). Data collection for food/drink categories, as well as all other study data collection, occurred via smartphone using REDCap (Research Electronic Data Capture) version 6·1·0 (Vanderbilt University)(Reference Harris, Taylor and Thielke37).
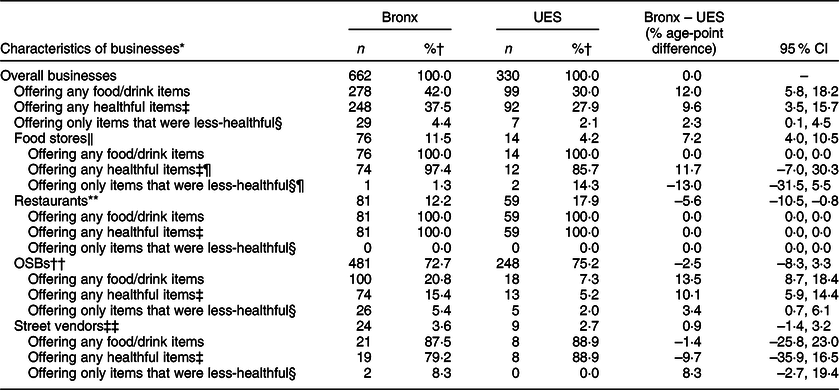
Businesses offering any food/drink items, any healthful food/drink items, or only food/drink items that were less-healthful, the Bronx v. the UES, 2015
OSBs, other storefront businesses; UES, Upper East Side (neighbourhood of Manhattan).
* Exact determination of food/drink offerings could only be made for businesses that were open at the time of assessments; for imputation of food/drink offering from businesses closed at the time of assessment, please see online supplementary material (Supplemental Table 2).
† Column percentage; denominators for column percentages are the n values in the preceding table row having the lesser degree of indentation.
‡ ‘any healthful items’ = any healthful foods or drinks, regardless of other food/drink availability.
§ ‘only items that were less-healthful’ = only less-healthful foods or drinks, with no healthful food/drink options and no foods/drinks considered neither healthful nor less-healthful.
‖ ‘Food stores’ included general grocers (e.g. supermarkets, grocery stores, convenience marts, delis and bodegas) and specialty food stores (bakeries, butcher shops/meat markets, candy stores, fish markets, produce markets); the percentages of food stores of different types – e.g. that were grocery stores or convenience stores – were similar between study areas.
¶ There were a few ‘food stores’ offering only items that were less-healthful: in the Bronx, a shop selling processed meats; in the UES, a bakery of confectionary goods and a market specialising in red and processed meats. An additional market in the Bronx sold only fresh seafood (not categorised as healthful or less-healthful).
** Restaurants included bars and grills, cafés, ice cream parlors, juice bars, pizzerias and various other fast-food, take-out and table-service eateries. Whereas 53·6 % of UES restaurants offered wait service, only 18·0 % of Bronx restaurants did (the rest being fast-food outlets).
†† OSBs, other storefront businesses, were storefronts not primarily focused on food/drink selling but that may have offered food/drink items nonetheless; those that did in the Bronx included one of more of the folowing: accounting/tax office, antique stores, auto sale, auto shop, bank, barber shop/beauty salon, check-cashing outlet, clothing store, department store, doctors’ office, dollar store, electronics shop, furniture store, gas station, gift shop, gym, hardware store, insurance seller, laundromat, liquor store, mobile phone store, music store, party-supply store, pharmacy, real estate office, and vitamin store. In the UES, food-selling OSBs included one of more of the following: bank, bookstore, clothing store, doctors’ office, cookware store, liquor store, newsstand, pharmacy, sporting goods store, tea shop, veterinarian, and vitamin store.
‡‡ Street vendors included a mobile vendors (e.g. carts, trucks, vans, stands); the category could have also included farmers’ markets and flea markets, however none were identified on sampled streets; not all street vendors offered food/drink (for instance one in the UES only sold posters, and three in the Bronx sold only miscellaneous merchandise including hats and other clothing items).
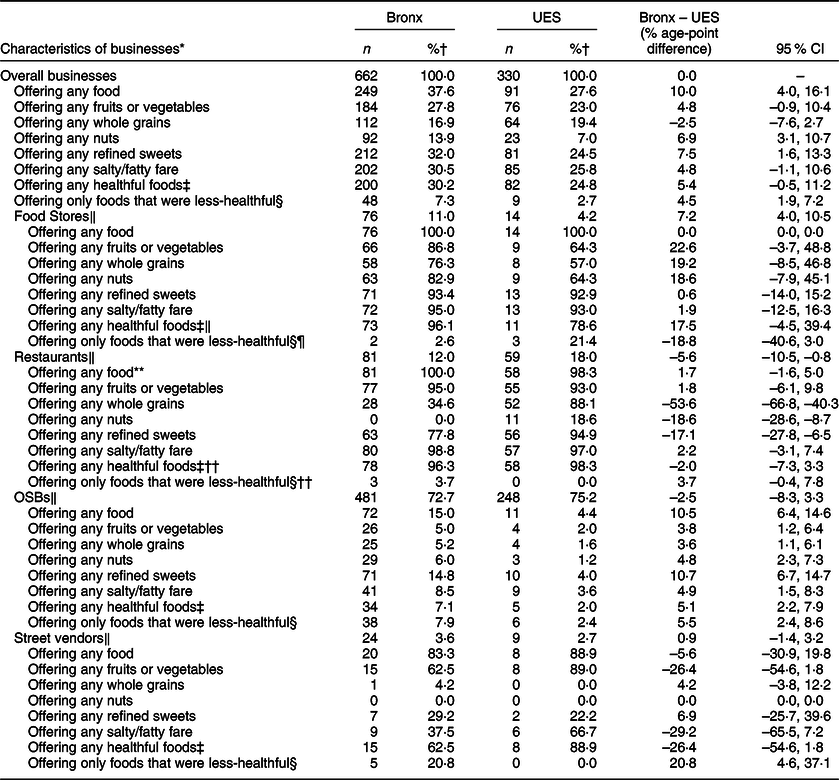
Foods available from businesses, the Bronx v. the UES, 2015
OSBs, other storefront businesses; UES, Upper East Side (neighbourhood of Manhattan).
* Exact determination of food/drink offerings could only be made for businesses that were open at the time of assessments; for imputation of food/drink offering from businesses closed at the time of assessment, please see online supplementary material (Supplemental Table 2).
† Column percentage; denominators for column percentages are the n values in the preceding table row having the lesser degree of indentation.
‡ ‘any healthful foods’ = any fruits, vegetables, whole grains, or nuts, regardless of other food/drink availability.
§ ‘only foods that were less-healthful’ = only ‘refined sweets’ or ‘salty/fatty fare’ for food options; no healthful foods nor foods considered neither healthful nor less-healthful such as eggs, cheese and poultry.
‖ Please see footnotes to Table 1 for definition. Note: other than a fish market in the Bronx selling only fresh seafood, all other businesses that offered any food in a given food category offered at least one read-to-consume option in that category. Additionally, some businesses offered free items: In the Bronx, free candy was available from two real estate offices, a tax office and a beauty salon; complimentary donuts were available from a real estate office. In the UES, free candy was available from a bank; samples of croutons were available from a cookware store; samples of chocolate were available from a chocolatier.
¶ There were a few ‘food stores’ offering only foods that were less-healthful: in the Bronx, a convenience mart and a shop selling processed meats; in the UES, a candy shop, a bakery of confectionary goods and a market specialising in red and processed meats. An additional market in the Bronx sold only fresh seafood (not categorised as healthful or less-healthful).
** Not all restaurants sold food; a bar in the UES only offered drinks.
†† Three restaurants in the Bronx offered only foods that were less-healthful: an ice-cream shop and two national-chain pizza outlets.
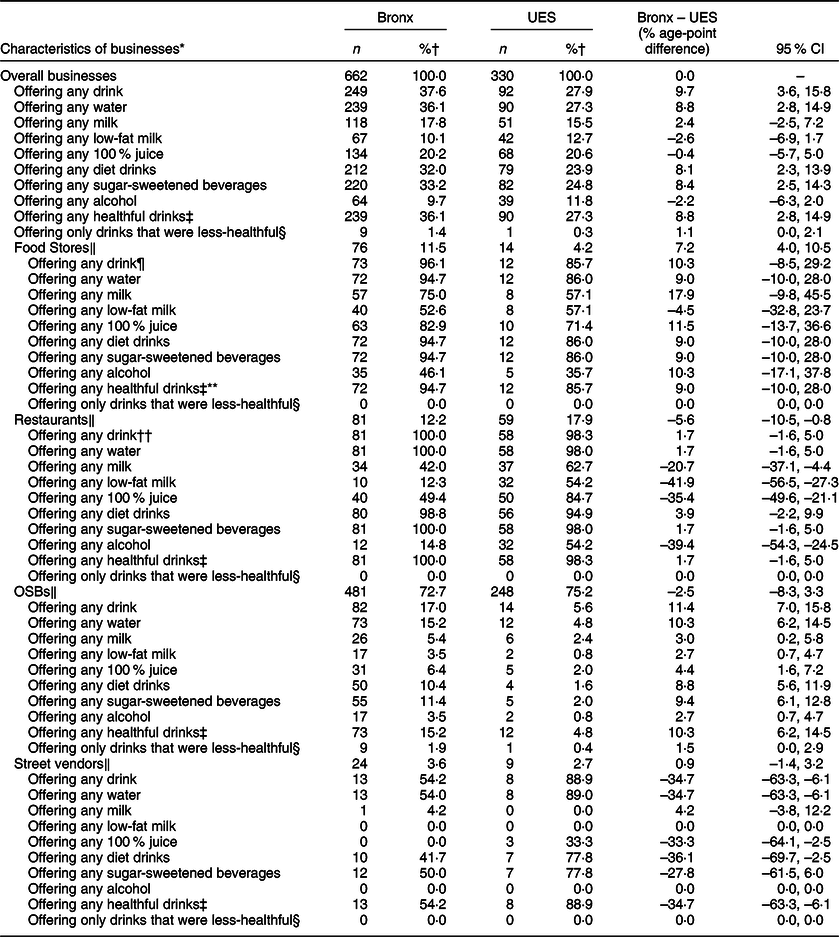
Drinks available from businesses, the Bronx v. the UES, 2015
OSBs, other storefront businesses; UES, Upper East Side (neighbourhood of Manhattan).
* Exact determination of food/drink offerings could only be made for businesses that were open at the time of assessments; for imputation of food/drink offering from businesses closed at the time of assessment, please see online supplementary material (Supplemental Table 2).
† Column percentage; denominators for column percentages are the n values in the preceding table row having the lesser degree of indentation.
‡ ‘any healthful drinks’ = any water or milk, regardless of other food/drink availability.
§ ‘only drinks that were less-healthful’ = only ‘sugar-sweetened beverages’ or alcohol for drink options; no healthful drinks nor drinks considered neither healthful nor less-healthful such as 100 % juice and ‘diet drinks’.
‖ Please see footnotes to Table 1 for definition.
¶ Not all food stores offered drink; some only sold food items: a fish market, a meat market and a nutrition center in the Bronx; a meat market and a bakery in the UES.
** One discount store in the Bronx sold only a limited assortment of juices and diet drinks (no healthful drinks like milk or water, no less-healthful drinks like sugar-sweetened beverages or alcohol).
†† Not all restaurants offered drink; a shop in the UES only offered frozen yogurt (with no containers for water, for example).
Data reliability
To ensure high-quality data collection, the two researchers conducting assessments underwent training with the principal investigator. Training occurred prior to the start of the study and included several days of practice on NYC streets. Training culminated with a reliability check, involving each researcher separately assessing a sample of the same thirty street segments. Agreement between researchers was exceptionally high; small difference in recorded data related to notation of business name (e.g. ‘Whispers’ v. ‘Whisper’s lounge and sports bar’) and examples recorded for food/drink items offered (e.g. ‘Doritos and Cheetos’ v. ‘Potato chips’ as the examples of salty/fatty fare from one laundromat). Overall, discrepancies occurred in <0·5 % of recorded values (eight of 1740 paired data cells). Reasons for recorded discrepancies in the pre-study reliability check were addressed before the start of the study.
Data analyses
Analyses of study data compared findings from the Bronx to those from the UES using two different and complementary units: (i) individual businesses (describing food/drink availability from a given seller) and (ii) street segments (describing food/drink availability from all businesses on a given block). All identified businesses in both study areas were included in analyses if they were in operation (i.e. not boarded up, under construction, or ‘for rent’, as was the case for 3·5 % of identified storefronts in the Bronx and 3·9 % in the UES). Businesses were organised into the following categories: ‘food stores’ (supermarkets, grocery stores, ethnic and specialty food markets), restaurants (assorted table-service and take-out establishments), OSBs (not primarily focused on selling food/drink), and street vendors (non-storefront vendors). Further details on business categories appear in footnotes of Table 2 and in previously published work(Reference Lucan, Maroko and Seitchik18,Reference Lucan, Maroko and Seitchik20,Reference Lucan, Maroko and Patel22,Reference Lucan, Maroko and Bumol32,Reference Lucan, Maroko and Abrams33) .
Primary analyses considered differences in healthful and less-healthful food/drink offerings specifically for open businesses and for street segments having open businesses. Additional analyses (see online supplementary material) considered imputed food/drink offerings from businesses that were closed at the time of assessment. Among calculated statistics were frequencies, percentages, differences in percentages and 95 % CI, all computed using Stata/MP2 version 15·1 (2017 StataCorp LP). CIs were determined using the standard methods presented by Rothman(Reference Rothman38).
Results
Combined food/drink availability from businesses
Table 1 shows disparities in combined food/drink availability between the Bronx and UES samples at the level of businesses. There were 662 open businesses in the Bronx sample v. 330 in the UES sample (additional businesses closed at the time of assessment appear in online supplementary material, Supplemental Table 2). Food stores represented a greater percentage of businesses overall in the Bronx sample than in the UES sample (11·5 v. 4·2 %). Conversely, restaurants made up a smaller share of Bronx businesses compared with UES businesses (12·2 v. 17·9 %). The percentages of business that were OSBs were similar in the two study samples (72·7 % in the Bronx, 75·2 % in the UES) as were the percentages of business that were street vendors (3·6 % in the Bronx, 2·7 % in the UES). Whereas the types of street vendors and types of food stores were similar in each study sample, the types of restaurants and types of OSBs differed considerably between the Bronx and the UES (please see footnotes of Table 1).
Overall, as shown in Table 1, businesses in the Bronx sample offered food/drink more often than businesses in the UES sample (42·0 v. 30·0 %). Bronx businesses offered any healthful items more often by 9·6 percentage points and only less-healthful items by 2·3 percentage points. Disparities for businesses overall were driven mostly by OSBs. OSBs offering food/drink were more numerous than either food stores or restaurants in the Bronx sample, and more numerous than food stores in the UES sample. In the Bronx sample, OSBs accounted for 38·9 % of storefront food/drink sources and 36·0 % of all food/drink sources (calculated from values in Table 1). By comparison, in the UES sample, OSBs accounted for 19·8 % of storefront food/drink sources and 18·2 % of all food/drink sources. OSBs in the Bronx offered food/drink proportionately more often than those in the UES by 13·5 percentage points; OSBs offered any healthful items more often by 10·2 percentage points and only less-healthful items by 3·4 percentage points. Estimates for disparities in food/drink offering by food stores, restaurants, and street vendors could be made with less confidence (there was less precision due to small numbers of businesses and/or small differences between them).
Food items available from businesses
Table 2 shows breakdowns of disparities between the Bronx and UES samples for food items. Food items were offered more often by businesses in the Bronx sample than by businesses in the UES sample overall. Notably, driven mostly by provision of refined sweets, Bronx businesses more often offered only less-healthful options (7·3 % of businesses v. 2·7 % of businesses in the UES). Disparities between the Bronx and UES samples related mostly to restaurants, OSBs and street vendors. For example, restaurants in the UES sample offered healthful whole grains and nuts much more frequently (88·1 and 18·6 % of establishments, respectively) than restaurants in the Bronx sample (34·6 and 0·0 % of establishments, respectively). For OSBs, a greater percentage offered all categories of food items in the Bronx sample than in the UES sample, with disparity in OSBs-offered refined sweets being particularly notable (14·8 v. 4·0 %). The percentages of OSBs offering only less-healthful food exceeded the percentages offering any healthful food in both study samples (7·9 v. 7·1 % in the Bronx, 2·4 v. 2·0 % in the UES). For street vendors (given small numbers) only one difference was large enough to estimate with high precision: the disparity in exclusively less-healthful food offering. Whereas five street vendors offered only less-healthful foods in the Bronx sample, none did in the UES sample; the CI for difference was 4·6–37·1 percentage points. Estimates for other differences had CIs spanning zero, precluding determination of disparities with much precision.
Drink items available from businesses
Table 3 focuses on drinks available from businesses in both study areas. More businesses offered drinks in the Bronx sample than in the UES sample by 9·7 percentage points. Overall disparities between study areas were driven mostly by OSBs. OSBs in the Bronx sample offered drinks of every category more often than OSBs in the UES sample. Conversely, street vendors offered some drink categories more often in the UES than in the Bronx: water, diet drinks and 100 % juice. Restaurants offered milk, low-fat milk, juice and alcohol more often in the UES. For other business categories, estimates for possible disparities in drink offering could not be made with high precision.
Food/drink availability on sampled streets
Table 4 shows disparities in food/drink availability between the Bronx and the UES samples at the level of the street segment. A greater percentage of street segments having businesses offered food/drink in the Bronx sample than in the UES sample (87·3 v. 72·7 %). Still, the CI for the difference was wide and could not exclude the possibility of a greater percentage in the UES. Disparities between study areas at the street-segment level were larger and less ambiguous (directionally consistent throughout 95 % CI) for three categories of food/drink: nuts (34·8 percentage-point difference), refined sweets (18·9 percentage-point difference) and milk (22·3 percentage-point difference). Other differences were lower in magnitude and less precise but all pointed to food/drink being more frequently available on Bronx streets than on streets in the UES. In particular, two street segments in the Bronx sample, but none in the UES sample offered only less-healthful foods.
Street segments on which healthful and less-healthful food/drink items were available, the Bronx v the UES, 2015
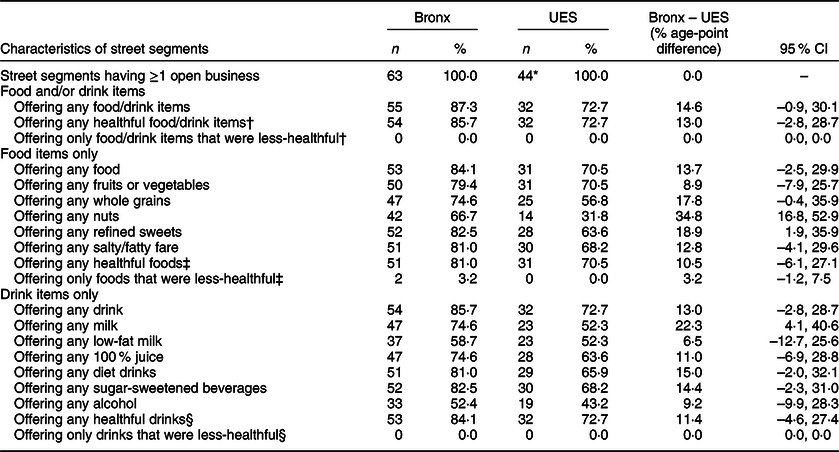
UES, Upper East Side (neighbourhood of Manhattan).
* In the UES, two of forty-six sampled street segments had only businesses were closed at the time of assessments (in both cases, dental offices); in the Bronx, there were zero street segment having only closed businesses.
† Please see footnotes to Table 1 for definition.
‡ Please see footnotes to Table 2 for definition.
§ Please see footnotes to Table 3 for definition.
Contributions to healthful and less-healthful availability on streets
The contribution of food stores, restaurants, OSBs and street vendors to food/drink availability by street segment appears in online supplementary material (Supplemental Table 1). Food stores were found on 67·3 % of street segments offering food/drink in the Bronx sample, but only 31·3 % of street segments offering food/drink in UES sample. Restaurants, OSBs and street vendors were found on 65·5, 74·5 and 29·1 % of street segments offering food/drink in the Bronx sample, respectively, and 68·8, 43·8 and 18·8 % of street segments offering food/drink in UES sample, respectively. Similar disparities were seen by business category in terms of contributions to street segments offering any healthful food/drink and street segment offering any less-healthful food/drink. Of street segments offering any less-healthful food/drink, 74·5 % did so at least partly due to OSBs and/or street vendors in the Bronx, 46·7 % did so at least partly due to OSBs and/or street vendors in the UES. If OSBs and street vendors were not counted, the percentages of streets segments offering any food/drink, any healthful food/drink and any less-healthful food/drink that would be missed would be 14·5, 13·0 and 14·5 %, respectively, in the Bronx, and 21·9, 21·9 and 16·7 %, respectively, in the UES.
Consideration of businesses closed at the time of assessment
All analyses above were based on businesses open at assessment times. Businesses that were closed at the times of assessment included the following in the Bronx: four food stores (a bakery and three grocery stores), twenty-three restaurants and fifty-four OSBs. Businesses that were closed in the UES included one food store (a chocolatier), nine restaurants, sixteen OSBs and one street vendor (a food truck). For such businesses, conservative imputation presumed food/drink provision as follows: food/drink selling from all closed food stores, restaurants and the street vendor (food truck), but no food/drink selling from any OSBs, except for liquor stores (there were two closed liquor stores in the Bronx). By such conservative imputation, Supplemental Table 2 shows the increases in food/drink offering that could be expected at the level of individual businesses, and Supplemental Table 3 shows the increases in food/drink offering that could be expected at the level of street segments; neither table reveals meaningful differences from results of the primary analyses.
Discussion
The current study is the first to examine both healthful and less-healthful food and drink offerings available from both storefront and non-storefront businesses. Storefront businesses included businesses not traditionally thought of as food/drink sellers but which nonetheless often offered food and/or drink. With data from two demographically dissimilar urban areas, findings demonstrated several disparities. Food, drink and the combination of food and drink were disproportionately available from more business on more streets in the higher-poverty, mostly minority communities of the Bronx than in the wealthier, predominantly white neighbourhood of the UES. Moreover, businesses and street segments in the higher-poverty, minority communities offered only less-healthful items more often. Disparities in food offering, drink offering and the combination of food and drink offering between study areas related in large part to the role of OSBs; street vendors were also important.
OSBs accounted for about three-quarters of all businesses in both study samples, but offered food/drink to different degrees between areas. In the wealthier, predominantly white neighbourhood of the UES, food/drink-offering OSBs accounted for nearly one in five food/drink sources, outnumbering so-called ‘food stores’; in the higher-poverty, mostly minority communities of the Bronx, food/drink-offering OSBs accounted for more than a third of all food/drink sources, outnumbering both ‘food stores’ and restaurants. While so-called ‘food stores’ and restaurants have been the focus of most prior research on food environments(Reference Lucan9,Reference McKinnon, Reedy and Morrissette39,Reference Lytle and Sokol40) , findings from the current study highlight that such research may have missed a major contributor to food/drink availability in communities. Indeed in the current study, on more than two-fifths of the streets on which food/drink was available, OSBs were a source in the UES; in the Bronx, OSBs were a food/drink source on nearly three-quarters of streets offering food/drink.
Disparities in food/drink offering by OSBs extended to differences by healthfulness. OSBs in the Bronx more often offered only less-healthful items (only less-healthful options with regard to food and only less-healthful options with regard to drinks); there were more street segments on which food/drink offerings came without any healthful options. More frequent provision of exclusively less-healthful choices by OSBs in lower-income, minority communities has been reported previously(Reference Lucan, Maroko and Seitchik18). Other research has shown that a specific type of OSBs providing less-healthful items – liquor stores – are found more commonly in poorer than in wealthier communities(Reference Moore and Diez Roux8).
Sizeable disparities between areas were also seen with regard to street vendors. Street vendors in the wealthier, predominantly white area more frequently offered healthful drink options; specifically, they more often had water as a beverage choice. Additionally, all street vendors in the UES offered at least one healthful food option; in the Bronx, by comparison, street vendors offering only less-healthful food options represented only a quarter of all food/drink-offering street vendors.
Although street vendors in both the Bronx and the UES represented relatively small percentages of total food/drink sellers, their presence in each study area was nonetheless meaningful. Street vendors were present on almost one-third of all street segments offering any food/drink in the Bronx sample, and on almost one-fifth of all street segments offering food/drink in the UES sample.
Street vendors, along with OSBs, are often neglected in food environment research. Yet, taken together, OSBs and street vendors in the current study represented more than a quarter of all food/drink sources (26·3 %) in the wealthier, predominantly white area, and nearly half of all food/drink sources (43·5 %) in the higher poverty, mostly minority area. OSBs together with street vendors offered food/drink on more than half of street segments on which food/drink was available in the UES, and on more than three-quarters of such street segments in the Bronx.
Ignoring OSBs and street vendors could result in missed community food/drink offering to a considerable degree: more than one in eight street segments offering healthful items (and more than one in seven offering less-healthful items) in the Bronx; more than one in five offering healthful items (and more than one in six offering less-healthful items) in the UES. Such deficiencies may lead to inaccurate determination of so-called ‘food deserts’ and so-called ‘food swamps’.
In fact, a ‘swamp-like situation’ (less-healthful items overwhelming healthful fare) would look like more of problem in the wealthier, predominantly white area if only food stores and restaurants were considered – for example, refined sweets (desserts on the menu) being offered more often from restaurants in the UES. Only after adding OSBs and street vendors to consideration does the offering of only less-healthful items become more of a problem in the higher-poverty, mostly minority area. Similarly, a ‘desert-like situation’ (absence of healthful food) would be misrepresented if only food stores and restaurants were considered; when OSBs and street vendors are considered too, healthful options are actually more available in the higher poverty, mostly minority area.
The current study had several strengths. First, data collection included a full range of businesses, including those typically ignored in food environment research: OSBs and street vendors. Second, the study considered not just where businesses were, but what items businesses actually offered, a combined approach recommended by experts(Reference Lucan9,Reference Caspi, Sorensen and Subramanian28,Reference Rose, Bodor and Hutchinson41) . Third, analyses considered both food items and drink items (both together and separately); there were multiple categories for foods and multiple categories for drinks, including healthful and less-healthful varieties of each. Fourth, analyses considered food/drink availability both from the perspective of businesses (what items might be available from a given seller) and from the perspective of street segments (what items might available on a given block). Fifth, while focusing on businesses that were open at the times of assessment, sensitivity analyses included imputation for businesses closed during assessment times. Sixth, the study sample included streets in two demographically dissimilar urban communities.
The current study also had limitations. For one, it is possible that additional businesses might have been missed on sampled streets (e.g. farmers markets operating only on specific days(Reference Lucan, Maroko and Sanon42) or street vendors that can move day to day or even within a given day(Reference Lucan, Maroko and Bumol25,Reference Lucan, Varona and Maroko43) ). Missed businesses would likely have contributed additional food/drink offering, making values in current findings about the extent of food/drink availability conservative underestimates. Relatedly, analyses focused only on availability, not on purchasing or consumption. To get at purchasing and consumption, the United States Department of Agriculture conducted a nationally representative survey, asking where US households get their food. The survey led to a report organising seventy ‘place types’ for food acquisition into nine categories(Reference Todd and Scharadin44). Unfortunately, the place types of ‘nonfood retailer’ and ‘food truck’ were lumped into the category of ‘restaurants and other eating places’ along with thirty-three other place types. Such categorisation precludes estimating food/drink acquisition from OSBs and street vendors. However, it stands to reason that OSBs and street vendors would not offer food/drink if people did not buy it; and people would not buy it if not to consume it. While we cannot make any definitive conclusions about food/drink acquisition or consumption from OSBs and street vendors, there are data that food/drink offerings from these businesses are increasing over time(Reference Lucan, Maroko and Patel22) (SC Lucan, AR Maroko, A Jin, A Chen, C Pan, B Sosa and CB Schechter, unpublished results).
Another limitation of the current study is that the sample derived only from street segments having retail lots and not street segments overall. Regardless, the greater number of businesses per street segment in the Bronx makes findings of proportionately more food/drink offering in this higher poverty, mostly minority area even more substantial in absolute terms. It should be noted though that the Bronx is a large area, especially compared with the relatively compact UES (Fig. 1). While the current study considered all parts of the Bronx as one, prior research showed disparities in food/drink offering within the borough(Reference Lucan, Maroko and Seitchik18). Nonetheless, intra-area disparities in food/drink offering were small (differing by only a few percentage points(Reference Lucan, Maroko and Seitchik18)) in comparison with the large inter-area differences between the Bronx and the UES reported in the current study.
While it is not possible to comment on generalisability of study findings to other regions, the Bronx and the UES (representing near extremes in demographic characteristics) could bound the possibilities. A prior study (from a convenience sample of nineteen US cities) did show a higher percentage of OSBs offering food/drink than in either area of the current study; candy, sweetened beverages, salty snacks and other items were available from 41 % of OSBs overall(Reference Farley, Baker and Futrell17). Nonetheless, the samples in each city were five to nine times smaller than samples in the current study. The samples were also more selective: investigators recorded a set number of observations walking away from intersections rather than assessing entire street segments. The implication could be detection bias if food/drink-offering businesses tend to cluster around intersections.
Conclusion
Foods and drinks can be available from a wide array of both storefront and non-storefront businesses. Both healthful and less-healthful items might be offered by businesses not generally captured in food environment research. Focusing only on ‘food stores’ and restaurants, and failing to capture OSBs and street vendors, might lead to missed or mischaracterised ‘food deserts’, ‘food swamps’ and food-source disparities between communities.
Future research should examine not just food/drink availability from different businesses but also purchasing and consumption of items on offer. The proportion of daily calories that come from various sellers will be important to clarify. In the interim, when food/drink is widely available, there could be options to support impulse purchases and unplanned consumption(Reference Cohen45,Reference Cohen, Collins and Hunter46) .
The current study showed greater availability – particularly availability of less-healthful items – in the study area already disproportionately affected by poor diet and diet-related diseases. To guide interventions and policy changes to address disparities, better understanding the totality of food/drink offerings will be important.
Acknowledgements
Acknowledgements: The authors would like to acknowledge the following individuals for their help in translating the data collection sheet used in interacting with street vendors: Nandini Deb and Mahbooba Akhter Kabita for assistance with translation into Bengali; Gustavo Hernandez and Monica Varona for assistance with translation into Spanish. S.C.L. would like to acknowledge A. Hal Strelnick for mentorship. Financial support: S.C.L. is supported by the Eunice Kennedy Shriver National Institute of Child Health and Human Development of the National Institutes of Health under award K23HD079606. The content of this manuscript is solely the responsibility of the authors and does not necessarily represent the official views of the National Institutes of Health. Student stipends from the Albert Einstein College of Medicine helped support data collection. The study used REDCap electronic data capture tools hosted through the Harold and Muriel Block Institute for Clinical and Translational Research at Einstein and Montefiore under grant UL1 TR001073. This work was also partially supported by the New York Regional Center for Diabetes Translation Research under grant P30 DK111022. Grant R01DK097347 through the NYU School of Medicine helped support data cleaning and analyses. Conflict of interest: S.C.L. serves on the Scientific and Nutritional Advisory Board of Epicure (a Canadian food product and cookware company). Authorship: S.C.L. co-conceived the study, conducted the literature review, designed the data-collection protocols, oversaw primary data collection, performed analyses and drafted the manuscript (including tables and figure). A.N.P. and I.G. performed primary data collection and assisted with data analysis and interpretation. A.R.M. guided the sampling strategy, performed geocoding, assisted with data analyses and data interpretation and created maps for the figure. B.E. co-conceived the study. C.B.S. oversaw and conducted data analysis and assisted with data interpretation. All authors helped revise the manuscript. Ethics of human subject participation: The current study did not involve human subjects. Primary data collection from 2015 was approved by the Albert Einstein College of Medicine IRB, as part of a broader study, under federal regulations 45 CFR 46.110 and 21 CFR 56.110.
Supplementary material
For supplementary material accompanying this paper visit https://doi.org/10.1017/S1368980019004427


