


Key messages
-
1. Exposure to economic hardship at any time period from conception to age 7 does not appear to accelerate epigenetic ageing in any of the common first or second-generation epigenetic clocks.
-
2. At an epigenome-wide level, exposure to economic hardship in-utero (from conception to birth had no effect.
-
3. There was a strong epigenomic effect of exposure to economic hardship from birth to age 7.
-
4. Subjective and objective measures of economic hardship affected methylation at different CpGs, however, these converged and affected identical biological pathways.
-
5. Targeting preventative measures in the postnatal period may have a stronger epigenetic effect than those put in place during pregnancy.
Introduction
From conception onwards, the external environment molds development and well-being through epigenetic modifications that are retained for many decades (Naumova et al., Reference Naumova, Lee, Koposov, Szyf, Dozier and Grigorenko2012; Naumova et al., Reference Naumova, Rychkov, Kornilov, Odintsova, Anikina, Solodunova, Arintcina, Zhukova, Ovchinnikova, Burenkova, Zhukova, Muhamedrahimov, Grigorenko and El-Maarri2019). Three decades of epidemiological studies have provided solid evidence for the importance of sensitive periods e.g. the first 1000 days of life for the lifelong health trajectory (Clark et al., Reference Clark, D’Ambrosio and Rohde2021; Lopez-Otin et al., Reference Lopez-Otin, Blasco, Partridge, Serrano and Kroemer2013; Marini et al., Reference Marini, Davis, Soare, Zhu, Suderman, Simpkin, Smith, Wolf, Relton and Dunn2020). An individual’s experience of stressors, environmental pressures and low socioeconomic status (SES) during this early-life period is now accepted to set them on a unique aging trajectory and determining their health/disease profile later in life (D. W. Belsky et al., Reference Belsky, Caspi, Houts, Cohen, Corcoran, Danese, Harrington, Israel, Levine, Schaefer, Sugden, Williams, Yashin, Poulton and Moffitt2015; Hayward & Gorman, Reference Hayward and Gorman2004; Raffington et al., Reference Raffington, Belsky, Kothari, Malanchini, Tucker-Drob and Harden2021). Previous research has demonstrated that early-life exposure to psychological stressors from low SES increases the risk of developing e.g. Type 2 diabetes, cardiovascular disease, and cancer later in life as well as shortening life-span (Batten et al., Reference Batten, Aslan, Maciejewski and Mazure2004; Hayward & Gorman, Reference Hayward and Gorman2004; Kaeberlein, Reference Kaeberlein2013; Kirkwood, Reference Kirkwood2005; Lopez-Otin et al., Reference Lopez-Otin, Blasco, Partridge, Serrano and Kroemer2013; McLaughlin et al., Reference McLaughlin, Breslau, Green, Lakoma, Sampson, Zaslavsky and Kessler2011; Rodriguez-Miguelez et al., Reference Rodriguez-Miguelez, Looney, Blackburn, Thomas, Pollock and Harris2022; van Lenthe et al., Reference van Lenthe, Kamphuis, Beenackers, Jansen, Looman, Nusselder and Mackenbach2014). More precisely, early-life exposure is linked to stress-related disorders such as psychopathologies, metabolic diseases and long-term immune-mediated diseases. Studies reported the strong association between early trauma exposure and stress genes regulation modification leading to psychiatric disorders (Turecki et al., Reference Turecki, Ota, Belangero, Jackowski and Kaufman2014).
As depicted in the literature, socioeconomic factors such as economic hardship are considered as determinants of health, as they play a major role in cardiovascular diseases due to their strong associations with adult risk factors (Alfano et al., Reference Alfano, Guida, Galobardes, Chadeau-Hyam, Delpierre, Ghantous, Henderson, Herceg, Jain, Nawrot, Relton, Vineis, Castagné and Plusquin2019; Galobardes et al., Reference Galobardes, Smith and Lynch2006; Lynch et al., Reference Lynch, Kaplan and Salonen1997) . Additionally, SES factors can influence offspring’s genomes, with worse maternal socioeconomic outcomes being associated to delayed developmental age and worse anthropometric outcomes at birth (Girchenko et al., Reference Girchenko, Lahti, Czamara, Knight, Jones, Suarez, Hämäläinen, Kajantie, Laivuori, Villa, Reynolds, Kobor, Smith, Binder and Räikkönen2017; Knight et al., Reference Knight, Craig, Theda, Bækvad-Hansen, Bybjerg-Grauholm, Hansen, Hollegaard, Hougaard, Mortensen, Weinsheimer, Werge, Brennan, Cubells, Newport, Stowe, Cheong, Dalach, Doyle, Loke, Baccarelli and Smith2016).
Economic hardship, such as material deprivation (MD) or major financial problems (MFP), during the prenatal period and the first years of development have the potential to affect DNAm levels, accelerating or decelerating epigenetic clocks (EC). Recently, Clark et al., estimated the physical effects of major prenatal economic shocks occurring within the first eighteen weeks of gestation on the offspring (Clark et al., Reference Clark, D’Ambrosio and Rohde2021): children who had experienced maternal MFP in-utero had a smaller head circumference (2–3 mm) and decreased birth weight (40–70g) (Clark et al., Reference Clark, D’Ambrosio and Rohde2021). Similarly, MFP during early childhood was associated with worse cognitive and non-cognitive outcomes during adolescence, even when controlling for household income and wealth (Clark et al., Reference Clark, D’Ambrosio and Barazzetta2021). Moreover, previous studies have demonstrated that poor birth outcomes are associated with poor developmental trajectories in infancy leading to long-term health issues in adulthood (Fiorito et al., Reference Fiorito, McCrory, Robinson, Carmeli, Rosales, Zhang, Colicino, Dugué, Artaud, McKay, Jeong, Mishra, Nøst, Krogh, Panico, Sacerdote, Tumino, Palli, Matullo and Guarrera2019). As low SES are directly experienced by the mother and only indirectly by their child, we investigated whether the maternal epigenome can play an indirect mediating role in determining the child’s epigenome. Here we considered the maternal epigenome as a proxy for her current and accumulated life experience as well as the developmental environment provided to her child both either in-utero or postnatally.
Early-life trauma is also strong implicated in the aging process, inducing a progressive decline in system integrity at the cellular level (i.e. telomere attrition or epigenetic modifications) (Girchenko et al., Reference Girchenko, Lahti, Czamara, Knight, Jones, Suarez, Hämäläinen, Kajantie, Laivuori, Villa, Reynolds, Kobor, Smith, Binder and Räikkönen2017). At the cellular level, telomere shortening is accelerated by early-life adversity. While the validity of telomere length as an index of cellular aging continues to be debated DNA methylation (DNAm) has been introduced as an alternative measure. DNAm is now considered a more powerful and precise biomarker of aging (Jylhava et al., Reference Jylhava, Pedersen and Hagg2017; Pearce et al., Reference Pearce, Alsaggaf, Katta, Dagnall, Aubert, Hicks, Spellman, Savage, Horvath and Gadalla2022). Using DNAm, a clear association between epigenetic age measured using the epigenetic clocks and the lifelong health/disease balance has been demonstrated (Fiorito et al., Reference Fiorito, McCrory, Robinson, Carmeli, Rosales, Zhang, Colicino, Dugué, Artaud, McKay, Jeong, Mishra, Nøst, Krogh, Panico, Sacerdote, Tumino, Palli, Matullo and Guarrera2019; Horvath & Raj, Reference Horvath and Raj2018).
Epigenetic clocks were introduced in 2013 by Horvath et al. (Reference Horvath2013) and Hannum et al. (Reference Hannum, Guinney, Zhao, Zhang, Hughes, Sadda, Klotzle, Bibikova, Fan, Gao, Deconde, Chen, Rajapakse, Friend, Ideker and Zhang2013). These first-generation EC were trained on chronological changes in DNAm. These clocks subsequently estimate the “epigenetic age” of the individual from their DNAm, and deviation from chronological age suggests accelerated or decelerated aging processes (reviewed in (Noroozi et al., Reference Noroozi, Ghafouri-Fard, Pisarek, Rudnicka, Spólnicka, Branicki, Taheri and Pośpiech2021)). Second-generation clocks, such as the Dunedin Pace of Ageing (PoAm), were trained on longitudinal change in age-related biomarkers rather than chronological age (Belsky et al., Reference Belsky, Caspi, Houts, Cohen, Corcoran, Danese, Harrington, Israel, Levine, Schaefer, Sugden, Williams, Yashin, Poulton and Moffitt2015). The inclusion of eighteen markers reflecting biological aging and organ system integrity (e.g., BMI and creatinine clearance) makes PoAm particularly powerful. Eight biomarkers are common to PoAm and the Levine second-generation clock (Belsky & Shalev, Reference Belsky and Shalev2016). PoAm and the other second-generation clocks are more sensitive to social determinants of health than the earlier clocks (Belsky et al., Reference Belsky, Caspi, Arseneault, Baccarelli, Corcoran, Gao, Hannon, Harrington, Rasmussen, Houts, Huffman, Kraus, Kwon, Mill, Pieper, Prinz, Poulton, Schwartz, Sugden, Vokonas, Williams and Moffitt2020; Lo & Lin, Reference Lo and Lin2022; Raffington et al., Reference Raffington, Belsky, Kothari, Malanchini, Tucker-Drob and Harden2021). Thus, PoAm reflects the underlying biological processes of aging. Additionally, experience suggests that PoAm can detect the epigenetic effect of social determinants of health in children, unlike first-generation clocks (Raffington et al., Reference Raffington, Belsky, Kothari, Malanchini, Tucker-Drob and Harden2021).
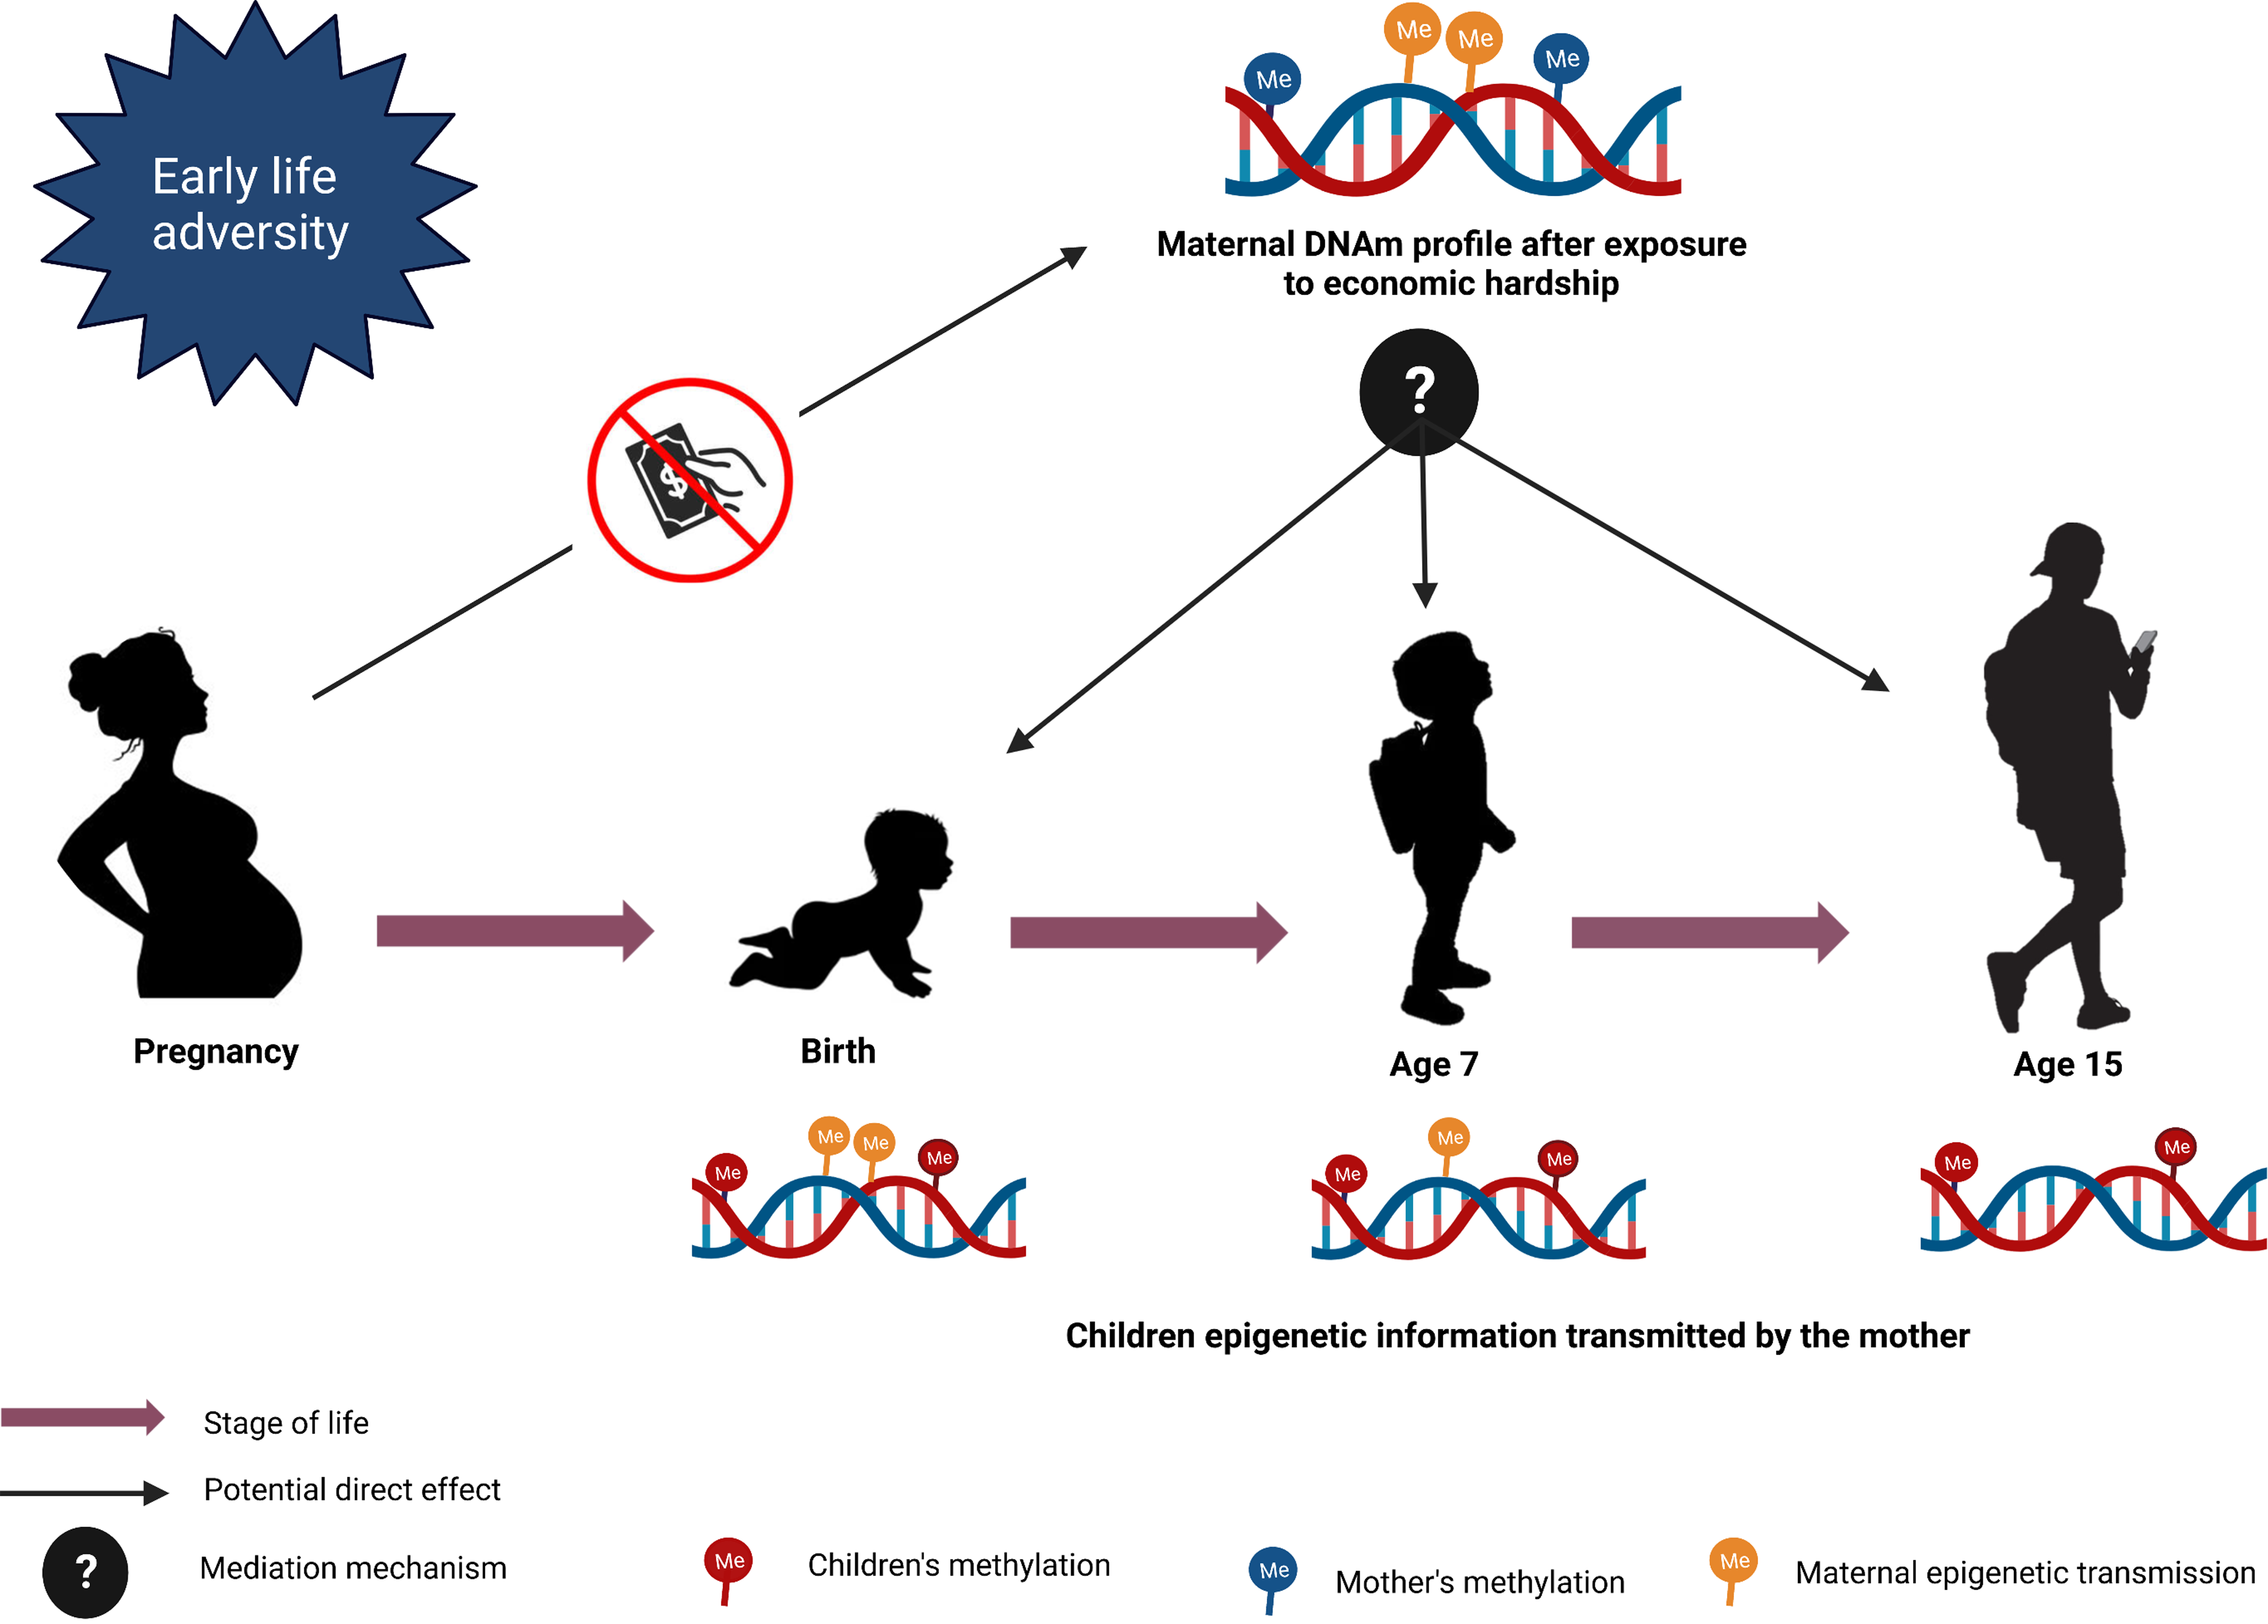
Here, we investigated the effects of exposure to MFP or MD before the age of 7y on the aging process using EC in participants from the Avon Longitudinal Study of Parents and Children (ALSPAC) cohort (Clark et al., Reference Clark, D’Ambrosio and Barazzetta2021; Clark et al., Reference Clark, D’Ambrosio and Rohde2021; Yan et al., Reference Yan, Paul, Lu, Kusters, Binder, Horvath and Ritz2020) (Fig. 1). The use of the first and second-generation clocks will provide information on age acceleration and SES associations. Additionally, an epigenome-wide association was conducted (EWAS) in order to investigate the impact of these socioeconomic parameters at the functional physiological level. We then extracted epigenetic information as differentially methylated chromosomal regions. Additionally, we examined their associated biological pathways to understand how MFP or MD may induce functional physiological differences.
Exposure timelines, epigenetic sampling points, and EWAS analyses performed. The images (baby/child/adolescent) represents the different ALSPAC epigenetic time point when blood sampling was performed. The first time point is referred to as birth / age 0; the second: age 7; and the third: age 15. Underneath, each horizontal triangle represents the exposure period for a specific EWAS model with the colour of the triangle representing the age at which the DNA methylation was measured. The exposure periods are: (1) conception to birth, (2) birth to age 7, (3) conception to age 7, (4) conception to age 15 and (5) birth to age 15. Light blue = EWAS methylation at birth; purple = EWAS methylation at age 7; dark blue = EWAS methylation at age 15.

Materials and methods
Cohort: ALSPAC
We used data from the ALSPAC cohort (Boyd et al., Reference Boyd, Golding, Macleod, Lawlor, Fraser, Henderson, Molloy, Ness, Ring and Davey Smith2013; Fraser et al., Reference Fraser, Macdonald-Wallis, Tilling, Boyd, Golding, Davey Smith, Henderson, Macleod, Molloy, Ness, Ring, Nelson and Lawlor2013). ALSPAC was established to examine how both environmental and genetic factors influence health and development throughout the life course. The ALSPAC team recruited 14,541 pregnant women in the South West of England between April 1991 and December 1992. Both mothers and children have now been followed for more than 30 years. During this period, mothers were interviewed almost yearly about their lifestyle, socioeconomic positions and health situation. ARIES is a subset of 1022 ALSPAC mother-child dyads from whom DNA was collected from the children at birth, age 7, and age 15–17 for DNAm analysis. After data quality control, the number of participants dropped to 927.
The ALSPAC cohort was approved by the ALSPAC Ethics and Law Committee and the Local Research Ethics Committees. ALSPAC participants provided (i) demographic data including age, and gender, (ii) medical history, (iii) socioeconomic status including financial problems, income, and material deprivation items, and (iv) tissue samples (Fraser et al., Reference Fraser, Macdonald-Wallis, Tilling, Boyd, Golding, Davey Smith, Henderson, Macleod, Molloy, Ness, Ring, Nelson and Lawlor2013). These parameters were extracted from the ALSPAC cohort for the 927 ARIES participants with complete epigenetic profiles at ages 0, 7, and 15.
DNA methylation
As described in (Relton et al., Reference Relton, Gaunt, McArdle, Ho, Duggirala, Shihab, Woodward, Lyttleton, Evans, Reik, Paul, Ficz, Ozanne, Wipat, Flanagan, Lister, Heijmans, Ring and Davey Smith2015), maternal peripheral blood samples (whole blood or buffy coat) were collected in the antenatal period (mean 25.7 gestation weeks). For children, blood samples were collected at birth (cord blood), age 7 and age 15–17 (peripheral blood). In all blood samples, DNA methylation was measured using the Illumina 450 K array. The detailed protocol of extraction, processing, and quality control of the DNA methylation data can be found in (Relton et al., Reference Relton, Gaunt, McArdle, Ho, Duggirala, Shihab, Woodward, Lyttleton, Evans, Reik, Paul, Ficz, Ozanne, Wipat, Flanagan, Lister, Heijmans, Ring and Davey Smith2015). Additional information are available in the Supplementary Methods.
Major financial problems
Mothers who experienced MFP during a specific period reported it as one independent event. Mothers’ reports of major financial problems were recorded first during a pregnancy assessment (18 weeks of gestation) and then ten additional times, when the study child was aged 8 weeks, 8 months, 21 months, 33 months, 47 months, 61 months, 73 months, 110 months, 134 months, and in May-September 2010 (around child age 18). From the beginning of the survey up to child age 20, they were asked eleven times whether they experienced a major financial problem. Due to the inconsistency in the way MFP were recorded over time (either focusing on the incidence or intensity of MFP), we coded MFP as a dummy variable taking the value “one” when the mother reported having experienced a major financial problem since the previous interview (regardless of the intensity reported) and “zero” otherwise. This was summed over all eleven incidences, providing a scale from 0 (never experienced) to 11 (reported at each interview). Different cutoff comprised between 0 and 8 or between 0 and 11, respectively at age 7 and 15, were assigned to MFP variable to investigate a potential dose response effect. A cutoff of 1 represents participants who experienced at least one financial problem while a cutoff of 2 represents at least 2 financial problem. In total 11 different cutoff were tested (from 0 to 11). Due to substantial attrition of mothers over time (26% of mothers who reported MFP consistently up to child age 7 stopped answering this question between child age 7 and 15), we do not consider MFP episodes after child age 7.
Material deprivation
Mothers were asked from the beginning of the survey questions about the quality of the house where the child lives. These questions are the following: whether the house has an indoor toilet, a bath or shower for the sole use of the household, or a working phone; whether the house has a problem of mold, dampness or condensation; whether the child’s bedroom or living room is adequately warm during the winter. We built MD as a count index, based on the presence (or absence) of the following items at home: indoor toilet, bath or shower, damp or mold, cold or very cold living room, working phone. These were measured during the pregnancy (at 8 weeks gestation) and when the study child was aged 8 months, 21 months, 33 months, 61 months, 85 months and 122 months .We considered as materially deprived the lack of at least two items out of the five listed above. As for MFP, mothers who experienced MD during a specific period reported it as one independent event. MD was coded in a similar manner as MFP. We defined three critical MD periods in a similar manner to MFP
Exposure period definition
Here, we defined three exposure periods for MFP and MD: (i) from conception to birth, (ii) from conception to age 7 and (iii) from birth to age 7 respectively. These were termed (i) MFP/MD(conception to birth), (ii) MFP/MD(conception to age 7) and (iii) MFP/MD(birth to age7).
Epigenome-wide association studies (EWAS)
To extract significantly associated CpGs and their epigenetic information, the DMRcate (version 2.6.0) package (Peters et al., Reference Peters, Buckley, Statham, Pidsley, Samaras, Lord, Clark and Molloy2015) was used. Probes or DMRs were considered significant when the Benjamini-Hochberg corrected p value < .050.
High-dimensional mediation analysis (HIMA)
The “HIMA” package was used to investigate high-dimensional mediation effects between mothers’ CpGs and child’s CpGs found to be significant in the MFP or MD EWAS models. Here we set up three mediation models: the first model (Model 1) and the second model (Model 2) represent the period of exposure between birth and age 7 (Fig. 6). Model 1 shows the 3316 CpGs identified in the MFP EWAS while Model 2 represents the 254 CpGs of the MD EWAS. Model 3 highlights the 3 common CpGs to MFP and MD EWAS (Model 1 and Model 2).
Data analysis
ALSPAC cohort data have been normalized by using the R “meffil” package to remove unwanted technical variation by regressing the variability due to the control probes on the array. We analyzed DNA methylation data from the ALSPAC/ARIES children at the three time points (at birth, n = 927; at age 7 years, n = 925; and at age 15 years, n = 861). A complete description of the cord and whole blood sample collection, data and transformations, and statistical analyses of the DNA methylation, high mediation model (HIMA) and data visualization protocols is included in the Supplementary Methods.
Results
Exposure to MFP is weakly linked to the child’s epigenetic age
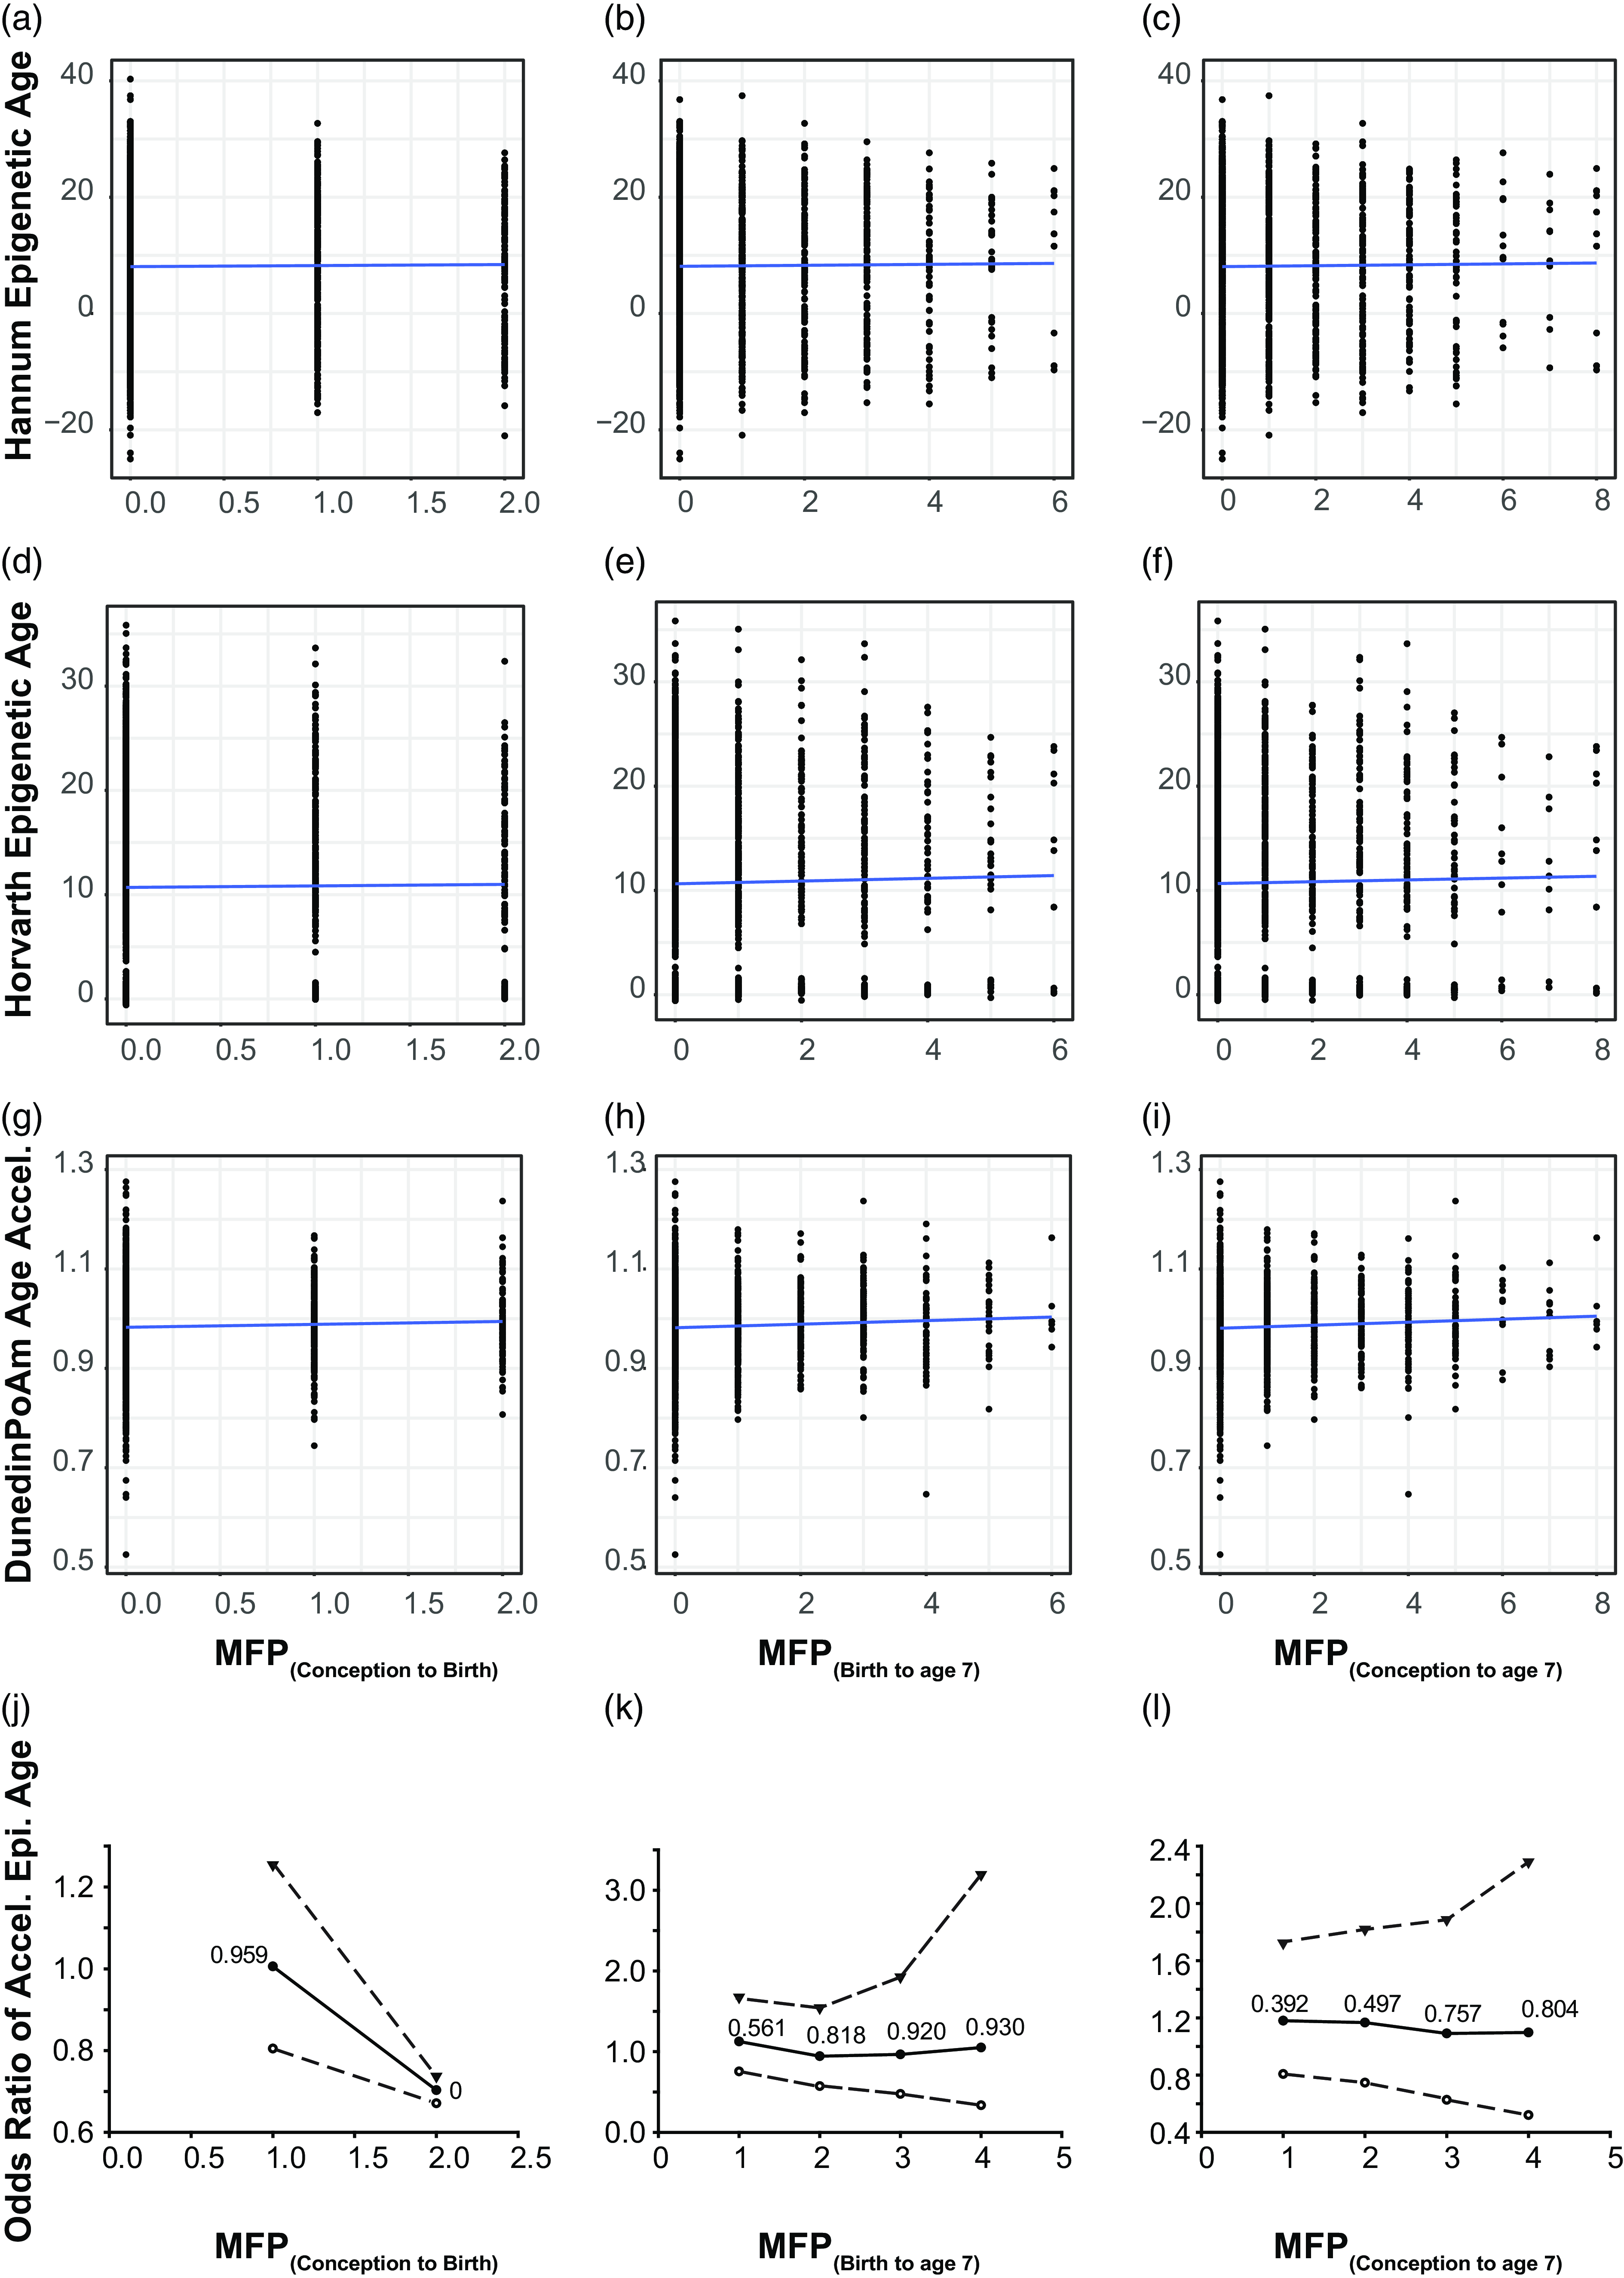
We calculated Horvath, Hannum and PoAm clocks at the second ALSPAC epigenetic time point (child age 7). Pearson correlations were used to examine the link MFP in the three time-periods: MFP(conception to birth), MFP(conception to age 7), and MFP(birth to age 7) and both first and second-generation EC (Fig. 2a–I). Recent literature suggests that the PoAm may be more suitable for younger populations (Caro et al., Reference Caro, Holuka, Menta, Turner, Vögele and D’Ambrosio2023; Raffington et al., Reference Raffington, Belsky, Kothari, Malanchini, Tucker-Drob and Harden2021). In our child cohort, the first-generation clocks had non-significant correlations with MFP for each exposure period (p > 0.1 and R 2 < 0.1). The second-generation PoAm clock, thought to be more relevant to children, showed weak correlations with MFP exposure that were borderline significant at all time periods (p = 0.04–0.07 or R 2 < 0.1). Furthermore, we calculated the Levine clock but it did not associate with MFP exposure (p > 0.1, R 2 < 0.1; Supplementary Figure 1). Finally, age acceleration was calculated for the first-generation Hannum and Horvath clocks by using the following equation: Age accel = DNAm age – chronological age (Supplementary Figure 3). Results are similar to those for epigenetic age presented in Figure 2 and calculated Age.accel for both Horvath and Hannum clock (Supplementary Figure 3).
Time of MFP exposure is weakly correlated with poAm aging. Scatter plot represents correlation between major financial problem (MFP) and epigenetic age. Panel a – c represents the correlation between the number of MFP events and the hannum epigenetic age, d – f represents the same, but for the Horvath epigenetic age and g – i the poAm speedometer. Blue line is the linear regression line. Data points represent individual participants. Panel j – l represents odds ratio of accelerated epigenetic age of the children over the same time periods. Central solid line = OR; upper and lower dashed lines = 97.5 and 2.5% CI; text : p-value.
MFP intensity is weakly associated with the rate of epigenetic aging
As we only observed a weak correlation between MFP and PoAm, we investigated whether MFP acted in a dose-dependent manner on the pace of epigenetic age. As MFP is a continuous variable (counting episodes of MFP over a given time interval) we dichotomized it with a series of cutoffs of increasing intensity from 1 to 4 episodes within the examined exposure period. The OR showed non-significant results for the three tested exposure periods (Fig. 2j–l). When the number of MFP events increased, the pace of epigenetic aging did not change significantly. We calculated BMI and sex-adjusted models, and neither covariate significantly altered the OR (data not shown).
MFP is associated with epigenetic modifications on the children’s genome at age 7
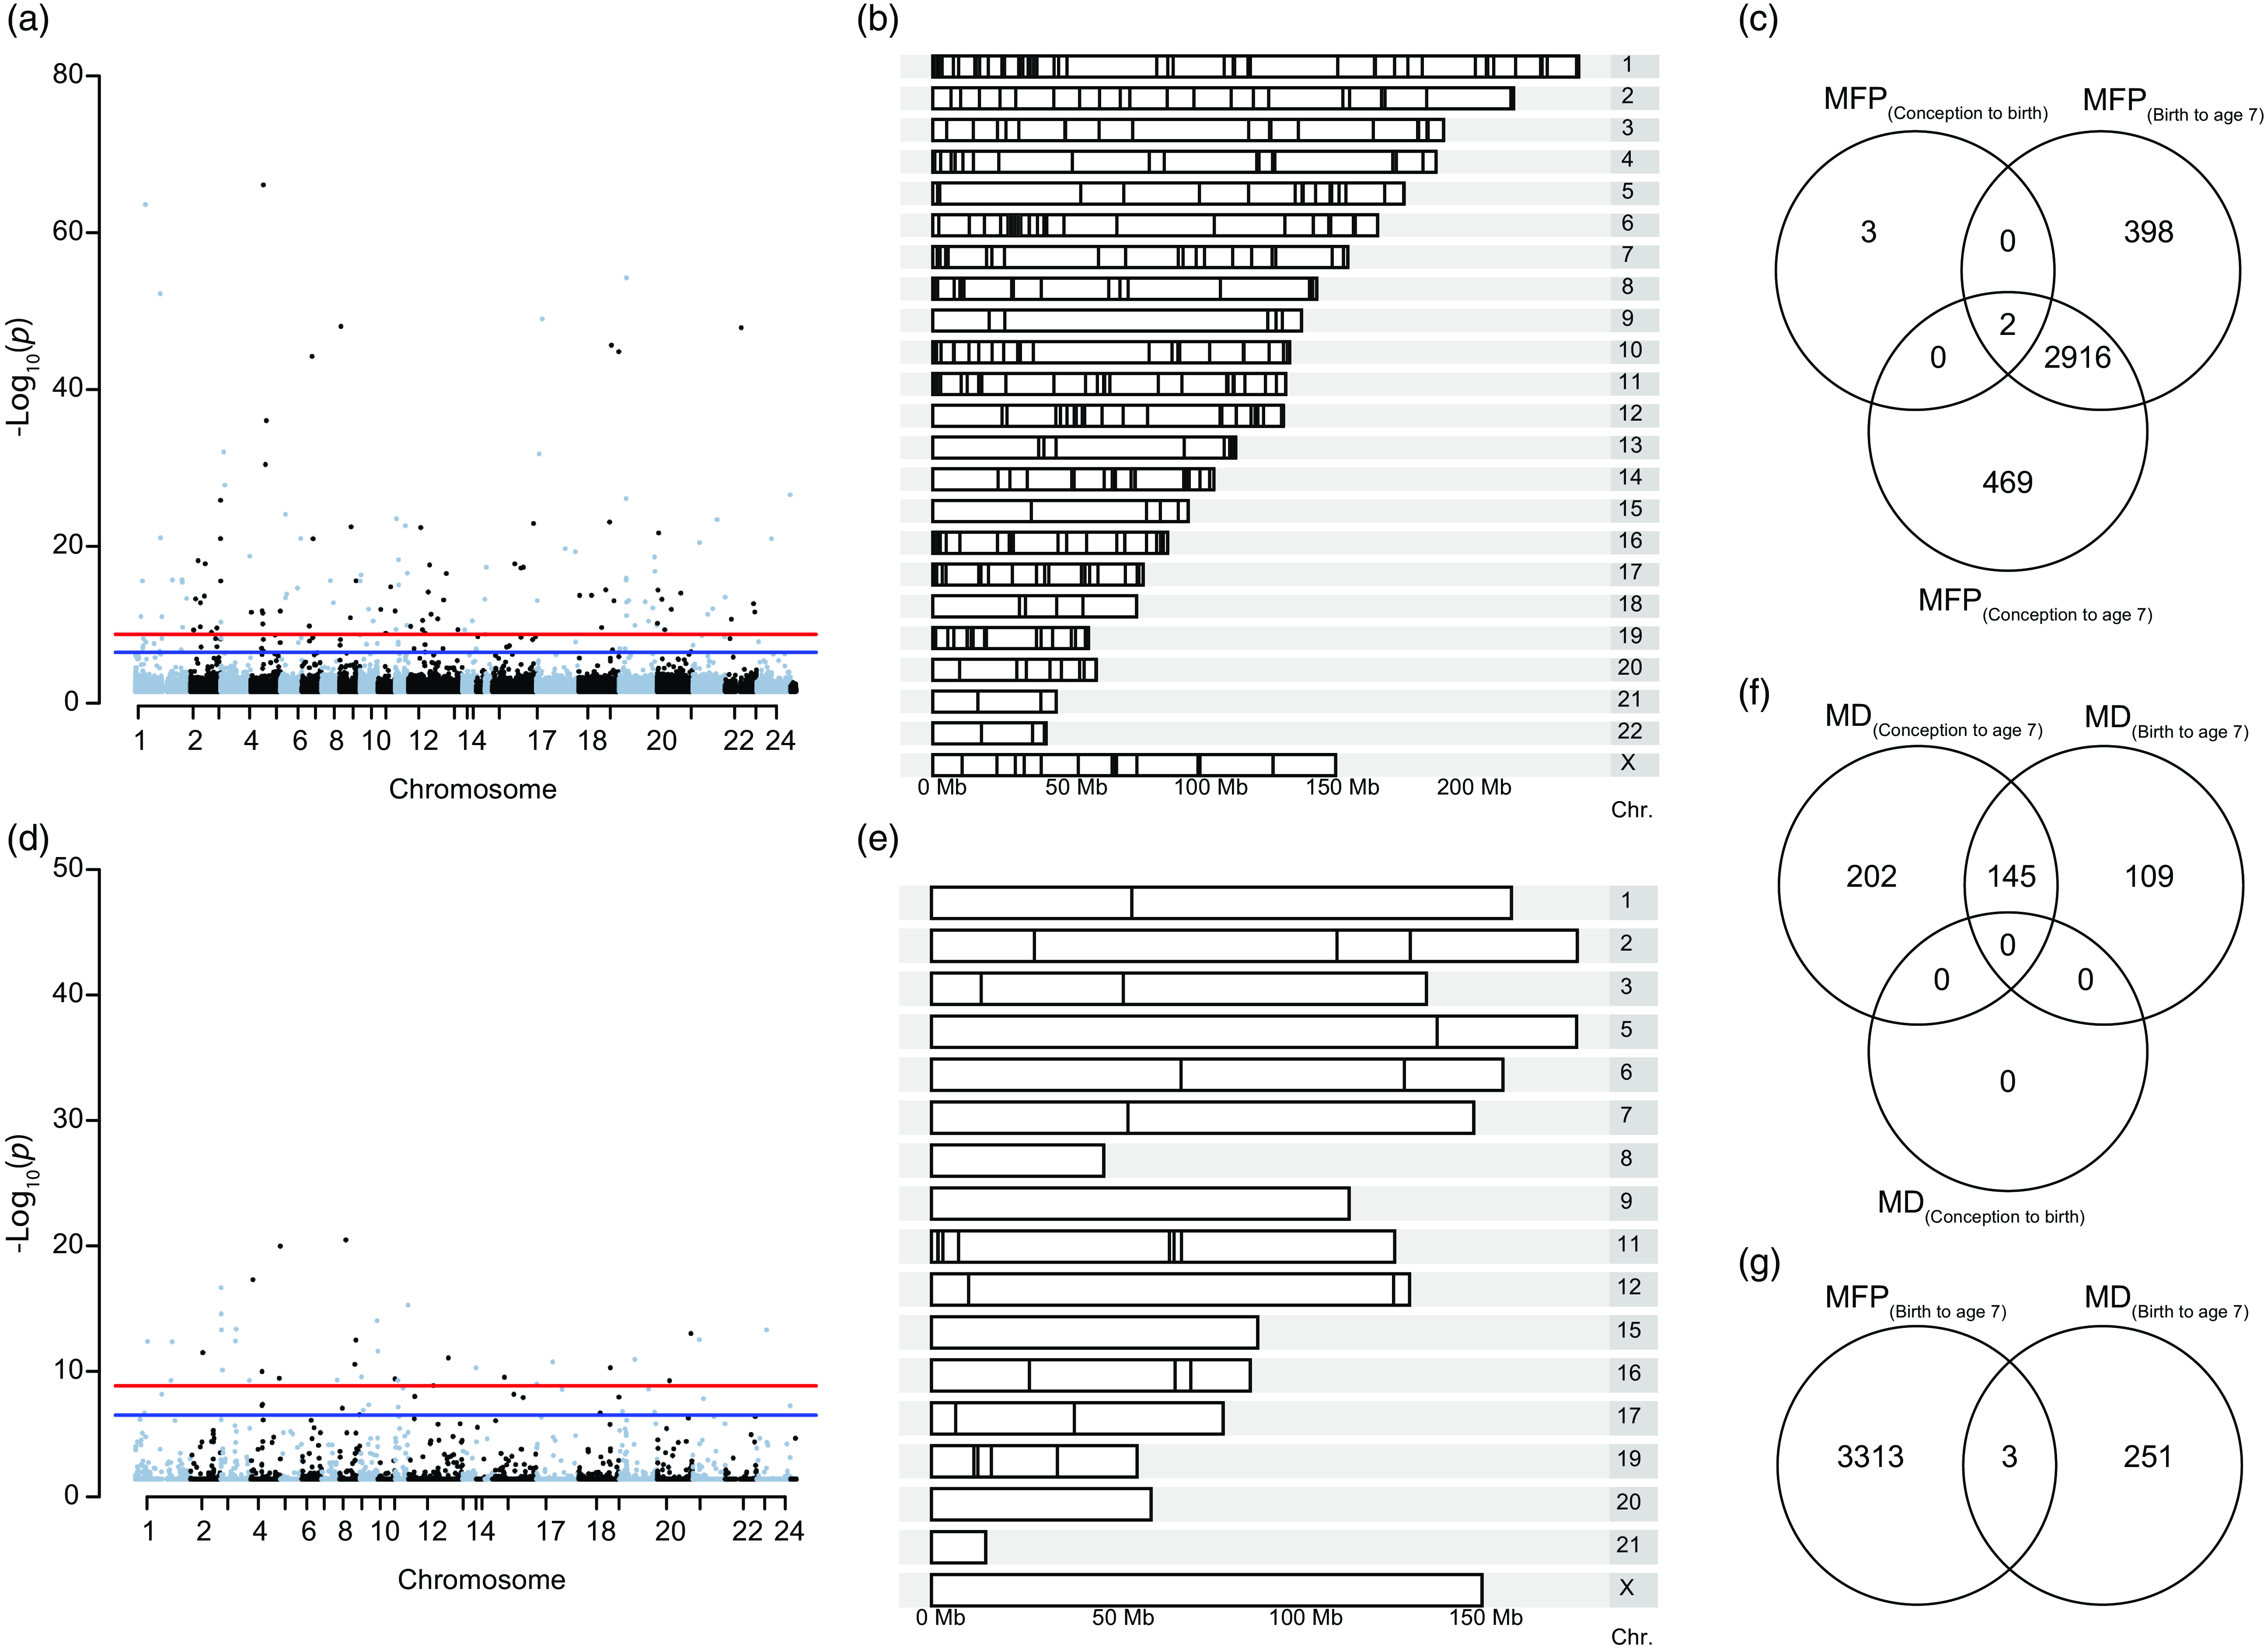
To determine the epigenetic implication of MFP beyond aging, we used a case-control (EWAS) approach to identify exposure-associated CpGs. Prenatal exposure, MFP(conception to birth), induced differential methylation at 5 CpGs (cg25857695, cg08462952, cg23840008, cg03737367, cg00414709) that do not overlap with the previously CpGs highlighted in (Laubach et al., Reference Laubach, Perng, Cardenas, Rifas-Shiman, Oken, DeMeo, Litonjua, Duca, Godderis, Baccarelli and Hivert2019) and (Alfano et al., Reference Alfano, Guida, Galobardes, Chadeau-Hyam, Delpierre, Ghantous, Henderson, Herceg, Jain, Nawrot, Relton, Vineis, Castagné and Plusquin2019). Exposure to MFP over a longer period, MFP(birth to age 7), induced differential methylation at 3316 CpGs from 445 differentially methylated regions, and MFP(conception to age 7) induced 3387 differentially methylated CpGs in 459 DMRs. Differentially methylated CpGs (p-value < 0.05) were distributed throughout the genome (Fig. 3ab). Differential methylation induced by MFP(conception to age 7) and MFP(birth to age 7), was largely identical, with 2916 common differentially methylated CpGs. Including the 5 differentially methylated CpGs in MFP(conception to birth), there were 2 CpGs (cg25857695 and cg03737367) common to all exposure periods considered (Fig. 3c).
Differential methylation induced by exposure to MFP and MD between birth and age 7. ( a ) Manhattan plot represents the repartition of the 3316 differentially methylated CpGs on each chromosome after exposure to MFP between birth and age 7. ( b ) Karyogram showing spatial distribution of the 445 DMRs. ( c ) Venn diagram summarizing the EWAS performed over the three exposure periods, highlighting the 2 common CpGs common to the three time-periods of exposure to MFP. ( d ) Manhattan plot represents the repartition of the 254 differentially methylated CpGs on each chromosome after exposure to MD between birth and age 7. ( e ) Karyogram showing the spatial distribution of the 45 DMRs. ( f ) Venn diagram summarizing the EWAS performed over the three exposure periods, highlighting the 145 common significant CpGs common to the three time-periods of exposure to MD. ( g ) Venn diagram shows the overlap (3 common CpGs) from the EWAS on DNA methylation at age 7 taking exposure to either MFP or MD from birth to age 7.
MFP is associated with epigenetic modifications on the children’s genome at age 15
EWAS studies on MFP are somewhat complicated due to the lack of suitable validation cohorts. However, ALSPAC took a third series of biological samples at age 15 from which Infinium 450k array data is available. To confirm the data at age 7, we used this third series of samples from ALSPAC. As in the previous section, we ran a similar analysis for MFP(conception to birth), MFP(birth to age 15), and MFP(conception to age 15). We identified 536 significant CpGs for exposure from birth to age 15 (Supplementary Figure 4). Again, significant CpGs were distributed throughout the genome of children (Supplementary Figure 4A-B). We found 1 common CpG (cg20147595) between the two periods of exposure, MFP(conception to age 15) and MFP(birth to age 15), to economic shocks (Supplementary Figure 4C). We found 72 conserved CpGs from age 7 vs age 15 (Supplementary Figure 4D and Supplementary Table 1). Consequently, we conclude that at least part of the imprint was maintained at age 15 despite the potential epigenetic remodeling during adolescence.
Exposure to MD is not linked to the child’s epigenetic age
Similar to the procedure for MFP, we calculated the first-generation (Horvath and Hannum) and the second-generation (Levine and PoAm) EC at the second time point of ALSPAC (child age 7). Pearson correlations were used to examine the link with MD in the three time-periods: MD(conception to birth), MD(conception to age 7), and MD(birth to age 7) and both first and second-generation EC (Supplementary Figure 2, a–l). Both generation clocks returned non-significant correlations with MD and each time exposure (p > 0.1 and R 2 < 0.1).
MD is associated with epigenetic modifications on the children’s genome at age 7
As for MFP, we investigate the association between MD and epigenetic modifications (Fig. 3d–f). There were 254 significant CpGs and 45 DMRs MD(birth to age 7). As above, these CpGs were distributed throughout the children’s’ genome (Fig. 3d–e). We found 145 common CpGs between the two periods of exposition (birth to age 7 and conception to age 7) to MD. However, we did not find significant CpGs for MD exposure in the period conception to age 0 (Fig. 3f). The top 10 CpGs associated respectively with MFP and material deprivation are regrouped in Table 1. Thus, as for MFP, MD would appear to influence the epigenome during the period from birth to age 7 y.o. rather than in-utero (conception to birth).
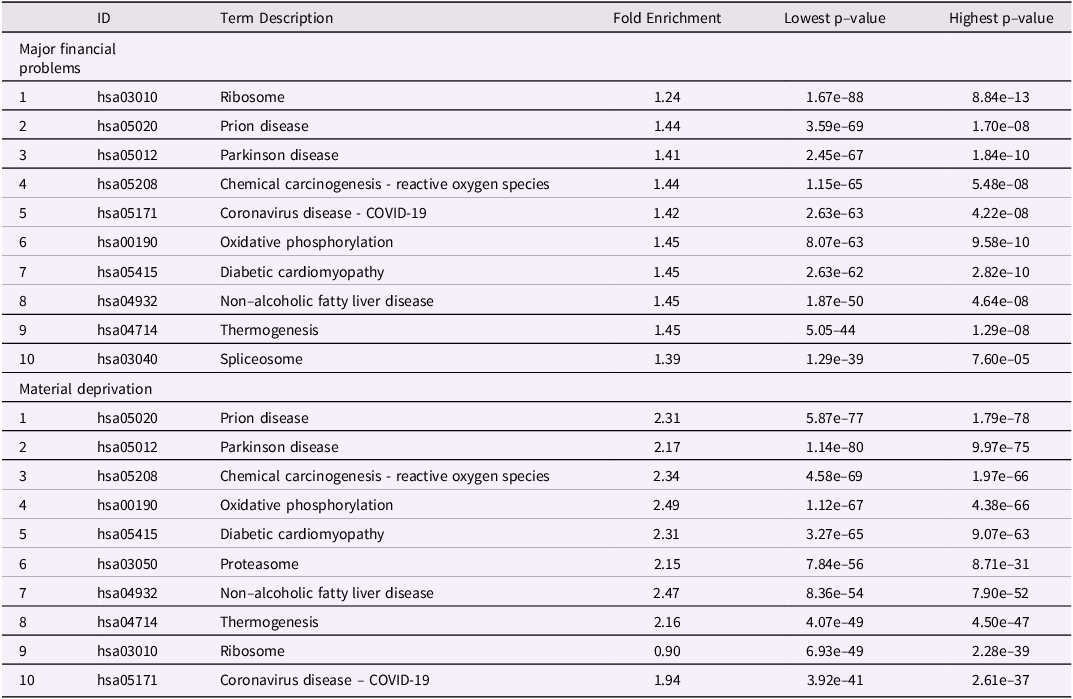
Top 10 biological pathways differentially methylated after maternal exposure to either MFP (birth to age7) or MD (birth to age7). Pathways were calculated with pathfinder based on DNA methylation differences at child age 7 and maternal exposure to either MFP or MD from birth to age 7
MFP and MD have few common CpGs
For the same period of exposure to socioeconomic parameters, birth to age 7, we investigate the number of common CpGs after experiencing major financial problems and material deprivation. We identified only 3 common CpGs (cg26217846, cg13819687 and cg25753631), suggesting that MFP and MD are independent stressors, affecting different genomic regions (Fig. 3g).
MFP and MD are involved in multiple, common, biological pathways
After extracting the genes annotated to the differentially methylated CpGs, affected biological pathways (BP) were identified (Fig. 4). BP were found to be associated with epigenetic changes induced by both MFP(birth to age 7) and MD(birth to age 7) (Fig. 4a,b respectively). For both panels, the fold enrichment is comprised between 1.5 and 2.5. On the contrary, p-values are highly significant for most BP (50 < -log10 (p) < 100). Regarding the two periods found a total of 237 and 268 statistically significant biological pathways for MFP(birth to age 7) and MD(birth to age 7) respectively, with 229 common between the two datasets (Fig. 4c). Table 2 and Supplementary Table 2 regroups respectively, the top 10 common pathways list and the full 229 common BP list.
Biological pathways associated with differential methylation induced by MFP and MD. ( a ) Pathway summary showing the fold enrichment and number of genes involved in each of the 10 most significantly affected pathways at age 7 after exposure to MFP from birth to age 7. ( b ) Pathway summary showing the fold enrichment and number of genes involved in each of the 10 most significantly affected pathways at age 7 after exposure to MD from birth to age 7. Color code : -log(10) p-value. Black circle diameter: number of genes. ( c ) Venn diagram showing common BP extracted from the EWAS at age 7 after exposure to either MFP or MD from birth to age 7. ( d – e ) Graphs show genes involved in two example pathways: Parkinson disease (PD) and oxidative phosphorylation (OP). Black circle diameter: number of genes.
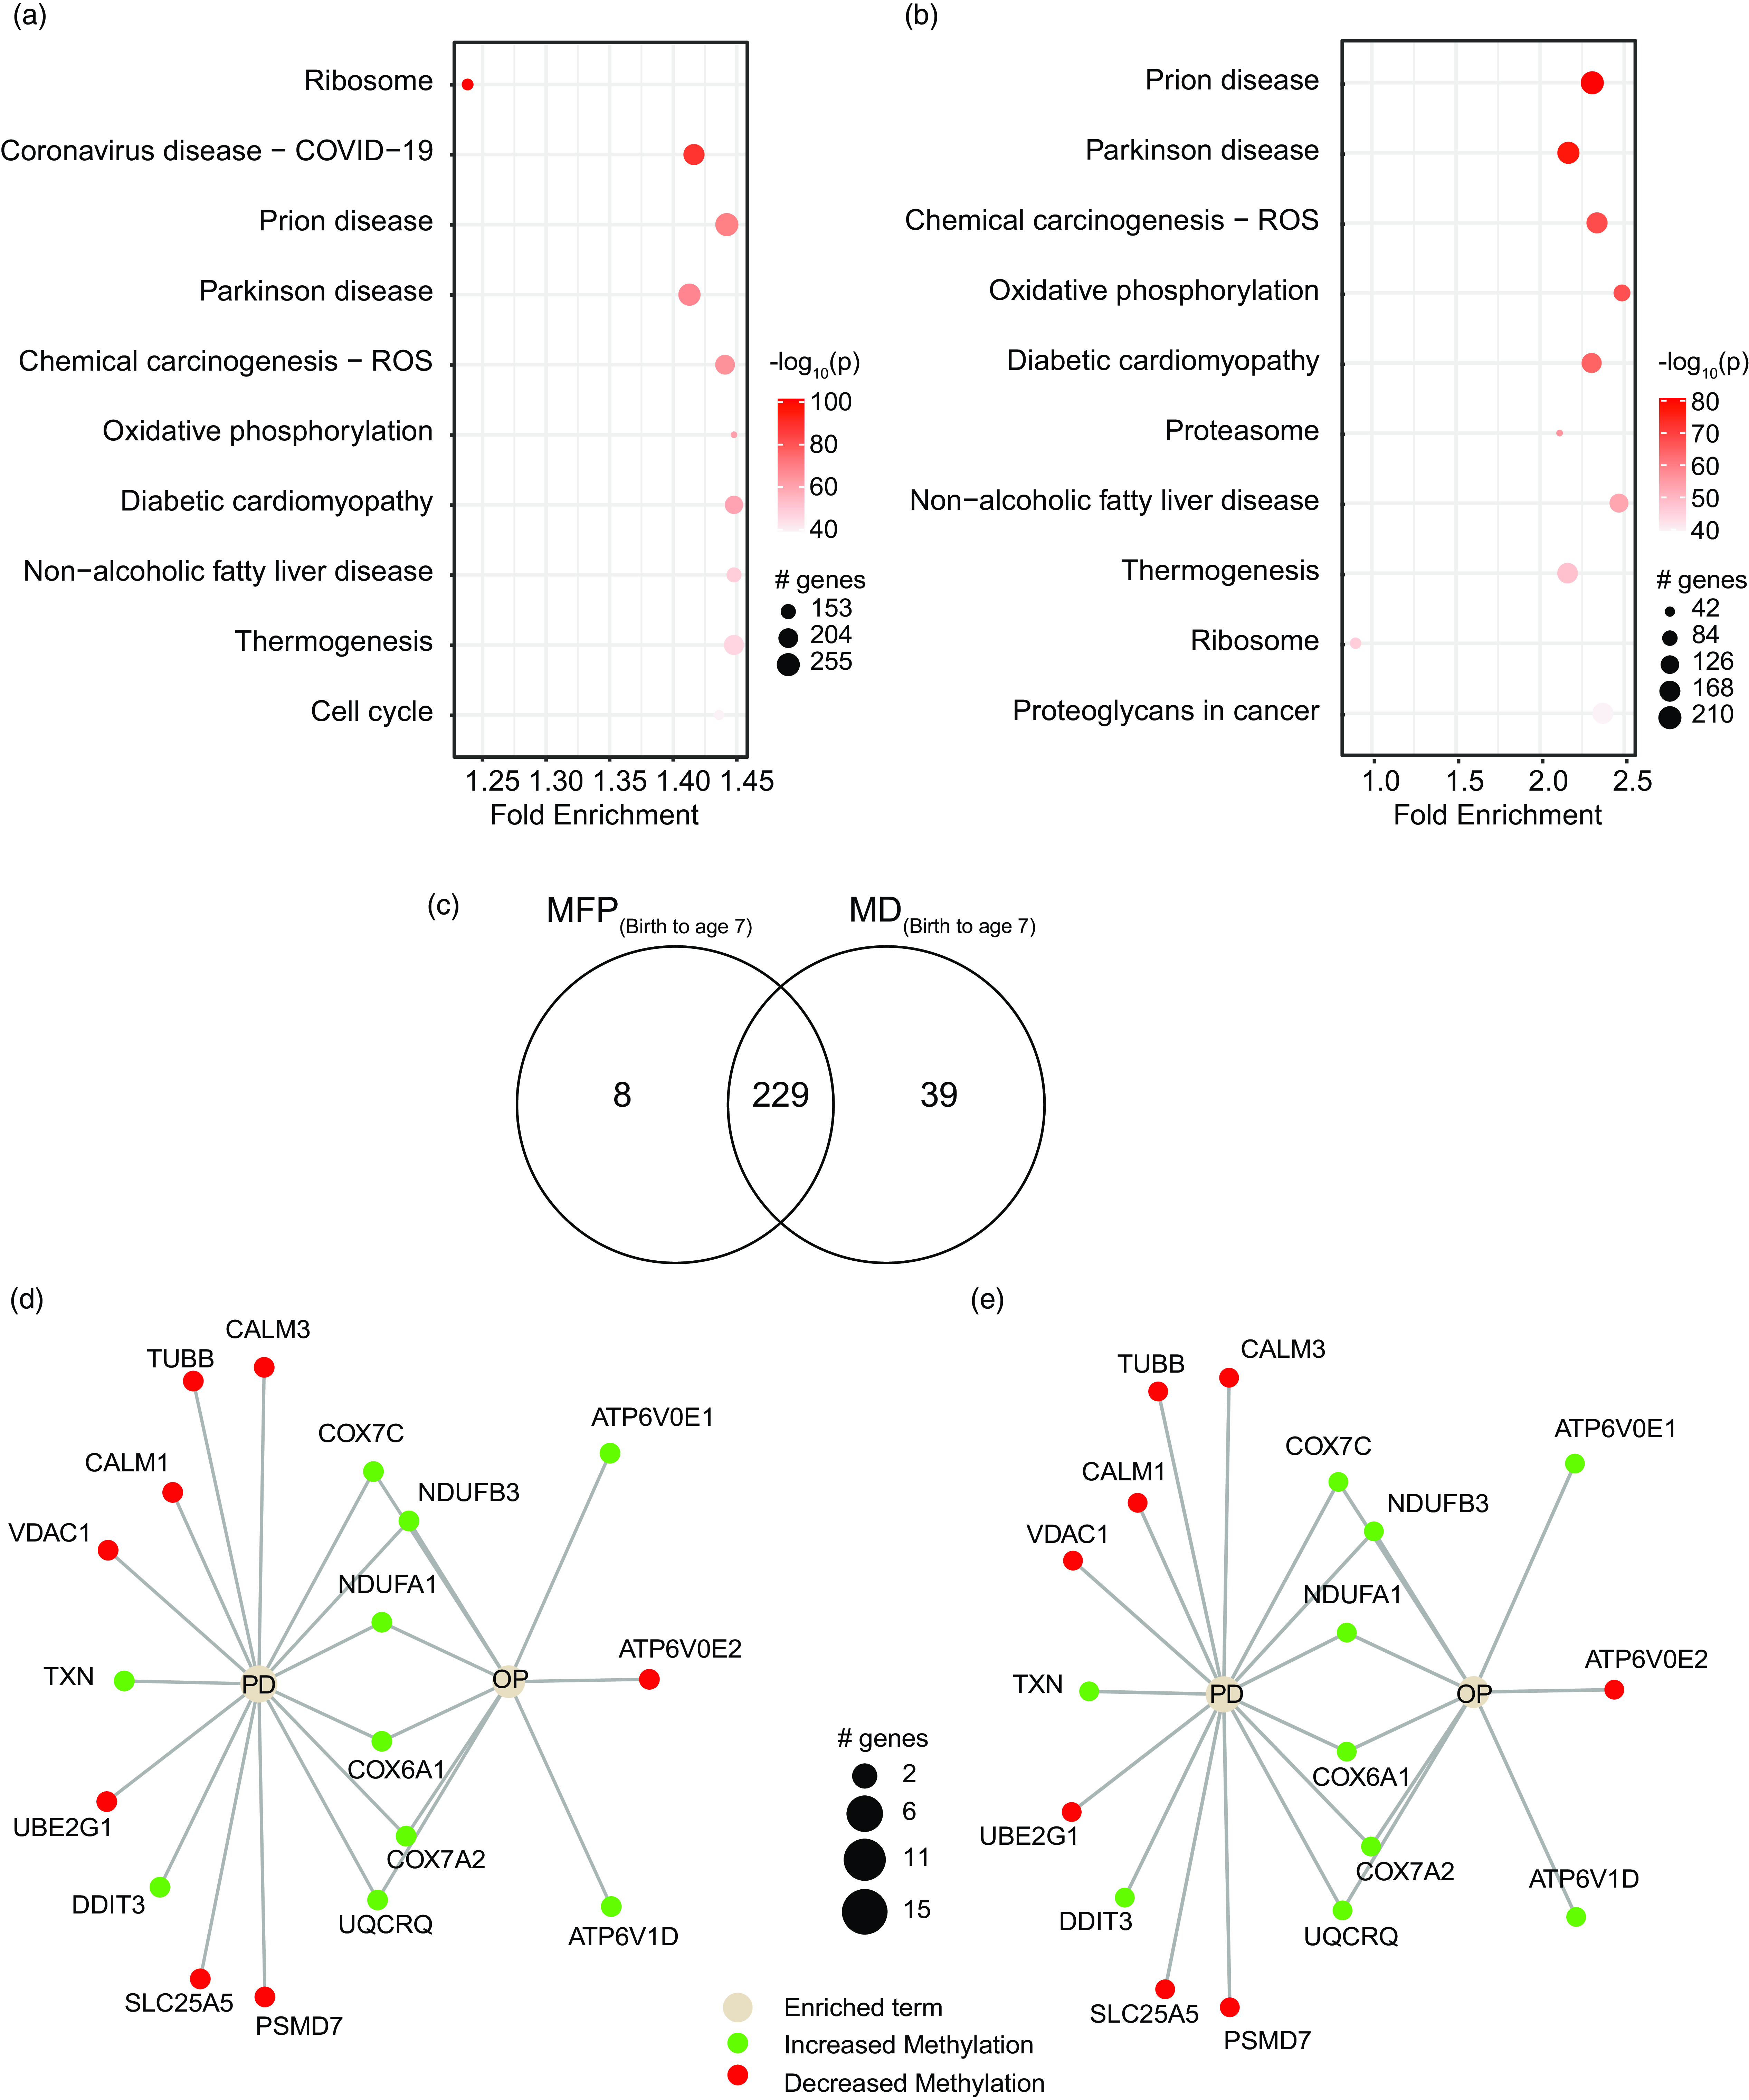
Top 10 biological pathways differentially methylated in common to both maternal exposure to MFP (birth to age7) as well as MD (birth to age7). Pathways were calculated with pathfinder based on DNA methylation differences at child age 7 and maternal exposure to either MFP or MD from birth to age 7

From the top 10 common pathways, we selected “oxidative phosphorylation” (OP) and “Parkinson’s disease” (PD), which are known to be associated with aging, for further investigation. We extracted information on the common up- and down- methylated genes in the OP and PD pathways. (Fig. 4d–e). We saw approximatively 200 hyper-methylated and 0 hypo-methylated genes, suggesting that the majority of the pathways will be down regulated as the predominant hyper-methylation observed will most probably reduce the expression of the associated genes (Table 2). The mitochondrial respiratory chain genes NADH ubiquinone oxidoreductase subunits 3 (NDUFB3) and cytochrome c oxidase subunits 7C (COX7C) were the most significantly differentially methylated extracted from the top 10 common pathways, and the probe locations and methylation are shown (Fig. 5a,b). For both genes, the DNAm modifications were situated in the promotor and coding region of the gene.
Two example differential methylated regions with genes of interest. ( a ) NDUFB3 is represented on chromosome 2. ( b ) COX7C gene is represented on chromosome 5. For both figures, top panel shows the position of the gene on the chromosome (red line). DNA methylation based on the number of financial problems are given for each participants. Relative exposure to MFP or MD (number of episodes) is shown by color.

Maternal prenatal DNAm is a determinant of the impact of economic hardship on child DNAm
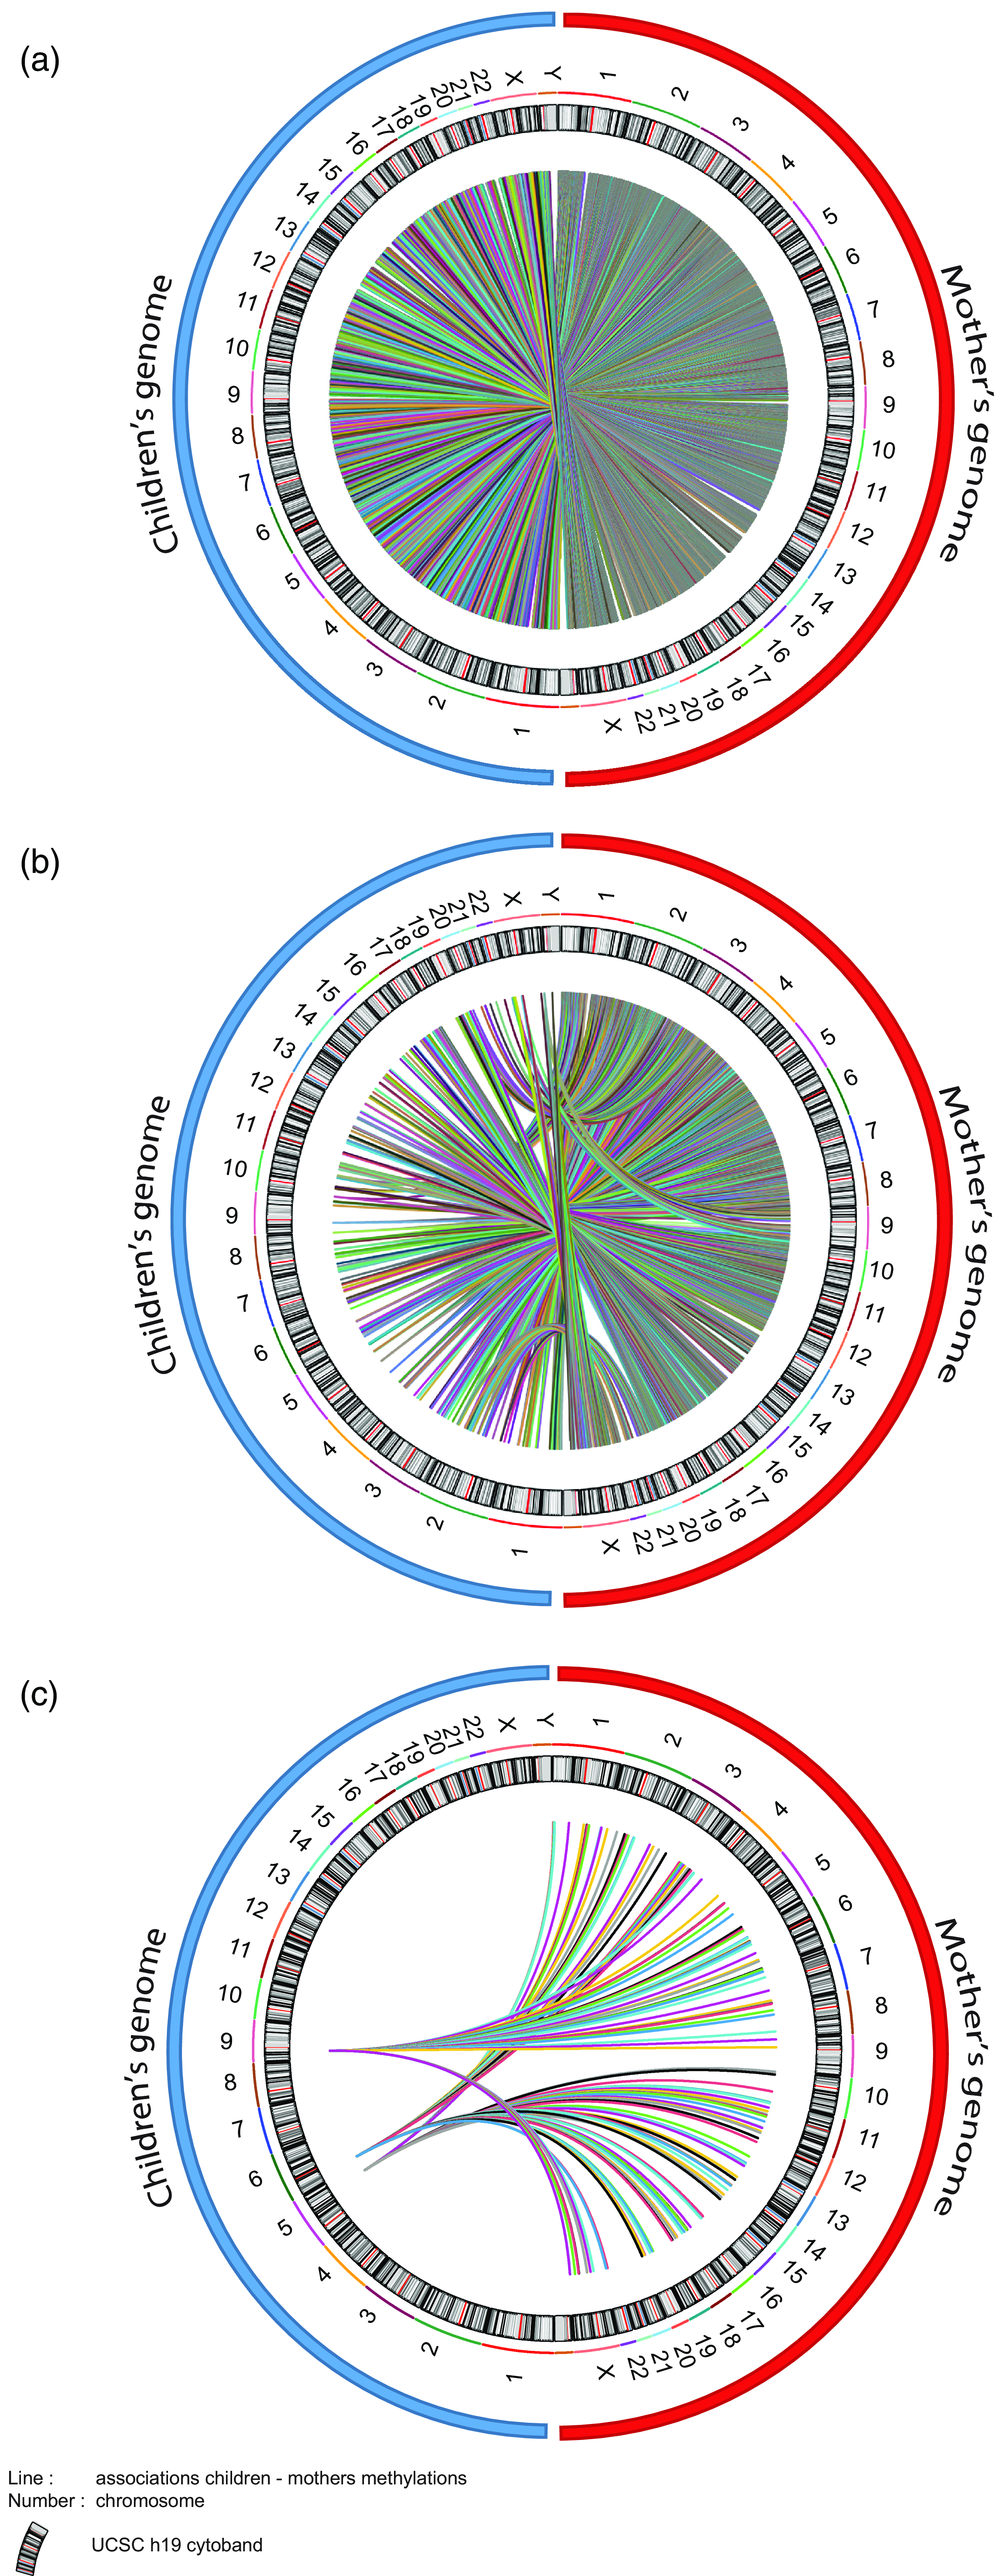
As we were considering the effect of maternal socioeconomic conditions we wanted to investigate whether the mother’s epigenome mediated changes in the child’s epigenome. Unfortunately, within ALSPAC the maternal epigenome was sampled during gestational week 18, somewhat undermining the strict temporal relationship necessary for a mediation analysis. However, experience with epigenetic clocks suggest that 98% of CpGs do not change methylation levels with age (Unnikrishnan et al., Reference Unnikrishnan, Freeman, Jackson, Wren, Porter and Richardson2019). As such, we used the maternal epigenetic data as the best approximation in our mediation model. To do this, we set up three mediation models (Fig. 6). Model 1 and Model 2 return 3316 and 254 CpGs respectively identified in the MFP and MD EWAS. Model 3 covers the differentially methylated CpGs commons between MFP and MD exposure. Figure 7 shows circos plot for these three mediation models. The 3316 tested CpGs in Model 1 returned 107628 links between maternal and child genome. Mediation Model 2 returns 8901 mediating CpGs mediation model p-value < 0.05 significantly associated with maternal CpGs. Finally, Model 3 provides 151 common mediating CpGs between MFP and MD exposure.
Mediation model design. The figure represents the mediation models to investigate the potential direct effect of maternal CpGs on children’s CpGs after exposure to maternal economic hardship.
Circos plot of the associations between maternal and child CpG methylation from the mediation models. ( a ) 107628 CpGs of children found at age 7 associated with maternal CpGs after MFP exposure. ( b ) 8901 children’s CpGs at 7 associated with maternal CpGs after MD exposure. ( c ) 151 children’s CpGs found at age 7 associated with maternal CpGs in common between MFP and MD exposure. Blue and red circles respectively represent children’s and mother’s genomes. Number represents the chromosome. Color lines represent link (associations) between children and maternal CpGs.
Discussion
Early-life adversity (ELA) and low SES are amongst the most powerful drivers of the aging process (Sun et al., Reference Sun, Fang, Wan, Su and Tao2020). Here, we initially demonstrated a weak association between early-life SES, proxied by the mother’s MFP and MD, and the PoAm pace of epigenetic aging. Children exposed to MFP in the period from birth to age seven had epigenetic modifications genome-wide that were visible at age 7, that were partially retained at age 15.
The epigenetic aging analysis suggested that a child’s PoAm pace of epigenetic aging was weakly associated with financial problems (coefficient of correlation R = 0.003–0.06) and explains a tiny percentage of their variance. This raises the hypothesis that the underlying mechanism linking exposure to the phenotype previously described could be a more specific biological process that is incompletely captured by PoAm rather than a simple change in the pace of epigenetic aging.
As MFP and MD only explained a tiny percentage of the variance in PoAm we performed a series of EWAS analyses. Both MFP and MD are independent epigenetic programing events. Extending this to the biological pathways, it became clear that despite the qualitative and quantitative differences in the nature of MFP and MD as maternal stressors the biological pathways affected were highly similar. Importantly, these biological pathways were centered on metabolism.
Overall, MFP data suggest that the child’s epigenome is particularly sensitive to MFP in the postnatal period from birth to 7 years old. Indeed, as MFP appears to be significantly involved in the methylation level of these CpGs, we suggest that they will be associated with the eventual expression levels of these genes and potentially affect disease development or biological pathway functioning.
MFP and MD capture two different aspects of an individual’s SES. Material deprivation is a multidimensional measure of poverty focusing exclusively on material living conditions. We followed the intermediate identification method of the poor (Bossert et al., Reference Bossert, Chakravarty and D’Ambrosio2013) and consider as poor someone experiencing at least two functioning failures out of the five material living conditions questioned. MFP is a measure of financial distress as perceived by the mother. This variable reflects both the economic resources available to the mother and the demand that is made on them. It captures financial insecurity over and above traditional income indicators: a major financial problem can be experienced by anyone, not only by those in poverty. In our differential methylation analyses at age 7 MFP and MD induced almost completely independent methylation signatures at the CpG level.
As the differential methylation patterns at age 7 were specific to either MFP or MD we focused on BP rather than on individual CpG dinucleotides, genes, or differentially methylated regions. Gene ontology show relationships based on similar gene product functions (Dalmer & Clugston, Reference Dalmer and Clugston2019), while gene set enrichment analysis provided information on the enrichment of epigenetically modified genes with common molecular functions or biological processes. While the signatures of MFP and MD were unique at the CpG level, their effects converged at the gene and BP level, with almost identical functional and metabolic effects. Our data showed a clear effect of both MFP and MD on genes associated with OP and Parkinson’s disease (PD). While superficially unrelated, there is a well-established link between ELA and OP-dependent processes such as immunosenescence, as well as between ELA, OP, and PD. The long-term immunosenescent phenotype after early-life adversity mainly involves T-cells (Elwenspoek et al., Reference Elwenspoek, Hengesch, Leenen, Schritz, Sias, Schaan, Mériaux, Schmitz, Bonnemberger, Schächinger, Vögele, Turner and Muller2017; Reid et al., Reference Reid, Coe, Doyle, Sheerar, Slukvina, Donzella and Gunnar2019) and was recently expanded to NK cells (Fernandes et al., Reference Fernandes, Patil, Meriaux, Theresine, Muller, Leenen, Elwenspoek, Zimmer and Turner2021). As these cells become senescent they remain metabolically active, although in a more “glycolytic state” (reviewed in (Sabbatinelli et al., Reference Sabbatinelli, Prattichizzo, Olivieri, Procopio, Rippo and Giuliani2019)). This reprogramed metabolic activity is intimately linked to their pro-inflammatory senescence-associated secretory phenotype (Sabbatinelli et al., Reference Sabbatinelli, Prattichizzo, Olivieri, Procopio, Rippo and Giuliani2019).
In the ALSPAC cohort socioeconomic or psychosocial adversity clearly leads to an observable epigenomic imprint later in life. Here, we identified the specific influence of MFP and MD on methylation at age 7 that converge to common pathways. As described in the literature, biological systems like the HPA axis are recalibrated during adolescent and puberty (Gunnar et al., Reference Gunnar, DePasquale, Reid, Donzella and Miller2019). Despite this, there is a residual early-life SES signature at age 15. Our data suggest that these postnatal years are the predominant period of sensitivity, confirming the importance of early-life trajectories and negative environmental influences occurring during this period. However, DNAm induced by early adversity exposure affects many biological processes in different ways. As the Infinium 450k methylation arrays used are biased towards promoter regions of proven genes (Pidsley et al., Reference Pidsley, Zotenko, Peters, Lawrence, Risbridger, Molloy, Van Djik, Muhlhausler, Stirzaker and Clark2016), we anticipate that the increased methylation levels seen would decrease the mRNA and protein levels from the associated genes.
As low SES was experienced by the mother directly, and only indirectly by their child we examined whether the maternal epigenome played an indirect mediating role in determining the child’s epigenome. We considered the maternal epigenome as a potential determinant for her current and accumulated life experience as well as the developmental environment she provided her child both in-utero and postnatally. The mediation model demonstrated that the maternal epigenome is associated with children’s CpGs which are sensitive to economic hardship such as MFP and MD. While epigenetic inheritance is currently debated, the mediation- model confirmed the existence of “maternal directing CpGs” that might explain an indirect epigenetic transmission mechanism. This will potentially explain the child’s susceptibility to epigenetic modifications from maternal SES later in life.
In general, early trauma are associated to stress pathway dysregulation leading to physical and mental outcomes (Smith & Pollak, Reference Smith and Pollak2020). For example, alterations in the HPA axis play a direct role in the development of mental disorders. It has been suggested that chronicity, timing development but also the type of exposure are key factors shaping the reaction to adversity (Smith & Pollak, Reference Smith and Pollak2020; Turecki et al., Reference Turecki, Ota, Belangero, Jackowski and Kaufman2014). As depicted in the literature, psychopathology seems to be associated with biomarkers such as genetic markers or cytokines, also present in biological systems. It is clear that mental health problems are linked to indicators of physical health (Goldsmith et al., Reference Goldsmith, Bekhbat, Mehta and Felger2023; Pollak, Reference Pollak2015).
To fully shed into light the underlying mechanisms it is essential to consider both biomarkers and their consequences and mental health outcomes. Indeed, studies demonstrated that genetic predisposition but also inflammatory actors such as cytokines are mainly responsible for the development of several psychopathologies later in life (Hassamal, Reference Hassamal2023; Shin & Kim, Reference Shin and Kim2023). Environmental and lifestyle factors can also directly contribute to chronic inflammation known to be a major risk factor for psychiatric disorders (Goldsmith et al., Reference Goldsmith, Bekhbat, Mehta and Felger2023). There is also evidence that when combined, there are metabolic alterations mainly influenced by a change in inflammatory signaling pathways and intracellular regulators (Alegría-Torres et al., Reference Alegría-Torres, Baccarelli and Bollati2011; Mposhi & Turner, Reference Mposhi and Turner2023). For example those modifications include oxidative damage, mitochondrial stress or gene expression markers of cytokines alteration leading to depression, anxiety depression, bipolar disorder, etc (Bachmann et al., Reference Bachmann, Bellalta, Basoalto, Gómez-Valenzuela, Jalil, Lépez, Matamoros and von Bernhardi2020; Butterfield & Halliwell, Reference Butterfield and Halliwell2019).
Here, we demonstrated how financial crisis perceived as trauma can interfere with many metabolic pathways such as oxidative phosphorylation. Similar pathways, including mitochondrial respiration underlay the association with Parkinson’s disease (Borsche et al., Reference Borsche, Pereira, Klein and Grünewald2021). Our data, taken together with the well-established link between the early-life environment and development of psychopathology clearly points towards the need for future cohorts with specific biosamples to investigate the role of these metabolic pathways in the subsequent development of psychopathology. We confirm the potential importance of intracellular metabolic effects, and the importance of collecting suitable data and samples in future cohorts that would allow us to address intracellular metabolism adequately. We suggest that intracellular metabolic mechanisms may link early-life exposure and the subsequent mental disorders development. There is a growing appreciation that there is a clear physical aspect to the development of psychopathologies (Spurrier et al., Reference Spurrier, Shulman, Dibich, Benoit, Duckworth and Martin2022), and we suggest that this may be due to the metabolic alterations leading to disease development or not when exposed to trauma.
There are several limitations to our study. Unfortunately we did not have enough power to test whether the MFP phenotype described by Clark et al., (Clark et al., Reference Clark, D’Ambrosio and Rohde2021) was mediated by DNA methylation. The ARIES subset of the ALSPAC cohort represents only 1022 of the > 14000 ALSPAC mother-child dyads in which the phenotype of reduced head circumference and birth weight was reported (Clark et al., Reference Clark, D’Ambrosio and Barazzetta2021; Clark et al., Reference Clark, D’Ambrosio and Rohde2021). Furthermore, this drops to less than 500 mother-child pairs at age 15-17 with complete MFP data (MD was only available up to child age 10). Additionally, the richness of the ALSPAC cohort and ARIES subset means that there is currently no suitable independent validation cohort in which the same socioeconomic parameters were collected over a similar time period, especially the repeated collection of socioeconomic data. Our mediation analysis was limited by the timing of the exposure measured and the measurement of the maternal genome. However, despite this, we saw significant associations and have provided a suitable methodology for future studies in which the data can be collected in the ideal temporal configuration. In addition, the access to data biomarkers measures at every time point is very limited ALSPAC. However, the final ARIES data-point at age 15–17, with separate biological samples and repeated analyses did allow us to identify the residual signature of the early-life exposure, despite the significant dropout for these variables at this collection time. Importantly, two independent measures of exposure to low SES, despite inducing differential methylation at completely different probe locations, identified almost identical biological pathways that are associated with previously reported immunological and physiological effects of exposure to ELA.
We initially hypothesized that the long-term effects of ELA were in part due to accelerated epigenetic aging. While poor maternal circumstances were very weakly associated with epigenetic age, they had much stronger effects on epigenome-wide DNAm levels. While there were no changes detected at birth, they became apparent at age 7 and a residual signature remained after puberty, at age 15–17. Despite MFP and MD having unique epigenomic signatures, they program common BP, showing that physiological processes underlie the long-term effects of ELA. We suggest that these epigenetic changes are the key determining the subsequent health trajectory and potentially the lifelong disease profile. The ALSPAC/ARIES data suggests that there is little influence of in-utero exposure to MFP or MD on the child’s epigenome; the period from birth to age 7 appears to be more important. Our analysis suggests that preventative measures in the postnatal period may have a stronger epigenetic effect than those put in place during pregnancy.
Supplementary material
The supplementary material for this article can be found at https://doi.org/10.1017/S095457942400083X.
Availability of data and material
All data are available commercially from the ALSPAC consortium. Link: Access data and samples | Avon Longitudinal Study of Parents and Children | University of Bristol.
Acknowledgments
The authors acknowledge Sophie Mériaux and Pauline Guébels for the technical help in the research group and members of working group four from COST Action CA18211 for fruitful discussion.
Author contributions
Conceptualization. J.D.T., CH; literature review: C.H. and J.D.T.; data collection: C.D.A, and the ALSPAC team; data analysis: C.H., G.M, and J.D.T.; manuscript writing: C.H. and J.D.T.; manuscript editing: all authors. All authors have read and agreed to the published version of the manuscript.
Funding statement
JDT together with CDA, CH, and JCC are funded by the Fonds National de la Recherche Luxembourg: ALAC (C19/SC/13650569 “ALAC”). JDT is a management board member of the EU-funded COST actions CA18211.
Competing interests
None.
Ethics standards
We are extremely grateful to all the families who took part in this study, the midwives for their help in recruiting them, and the whole ALSPAC team, which includes interviewers, computer and laboratory technicians, clerical workers, research scientists, volunteers, managers, receptionists and nurses. Please note that the study website contains details of all the data that is available through a fully searchable data dictionary and variable search tool: http://www.bristol.ac.uk/alspac/researchers/our-data/. The UK Medical Research Council and Wellcome (Grant ref: 217065/Z/19/Z) and the University of Bristol provide core support for ALSPAC. This publication is the work of the authors and Holuka, Menta, Caro, Vögele, D’Ambrosio and Turner will serve as guarantors for the contents of this paper. A comprehensive list of grants funding is available on the ALSPAC website (http://www.bristol.ac.uk/alspac/external/documents/grant-acknowledgements.pdf). Ethical approval for the study was obtained from the ALSPAC Ethics and Law Committee and the Local Research Ethics Committees. Consent for biological samples has been collected in accordance with the Human Tissue Act (2004). Informed consent for the use of data collected via questionnaires and clinics was obtained from participants following the recommendations of the ALSPAC Ethics and Law Committee at the time.


 Open access