

It is well established that higher levels of circulating biomarkers of inflammation are present in the obese state, strongly suggesting inappropriate immune activation or regulation (as reviewed by Warnberg & Marcos(Reference Warnberg and Marcos1)). In addition, obese individuals are more likely to develop other chronic inflammatory conditions, including certain forms of cancer(Reference Calle and Kaaks2, Reference Pan, Johnson and Ugnat3), CVD and type 2 diabetes, and specific markers of inflammation can predict the development of CVD(Reference Ridker, Buring and Shih4, Reference Ridker, Hennekens and Buring5) and type 2 diabetes(Reference Duncan, Schmidt and Pankow6). Impairments in the acquired immune system have also been identified in the overweight population. Individuals with a higher BMI are reported to be at an increased risk of infection and infection-related mortality (as reviewed by Falagas & Kompoti(Reference Falagas and Kompoti7)), have poor antibody responses to vaccines(Reference Weber and Rutala8–Reference Eliakim, Schwindt and Zaldivar10) and immune cells have a reduced capacity to proliferate when stimulated with T-cell mitogens(Reference Tanaka, Inoue and Isoda11, Reference Tanaka, Isoda and Ishihara12). Overall, these studies support that immune function is abnormal in obesity, although the literature on human subjects is sparse. It is generally concluded that dysregulation of inflammatory responses is the key link among the metabolic syndrome, CVD and type 2 diabetes.
The JCR:LA-cp rat is a genetic model of obesity that expresses a dysfunctional leptin receptor which prevents any known receptor (ObR)-mediated signal of leptin. Rats that are homozygous for the autosomal recessive cp gene (cp/cp) are obese and insulin resistant, have dyslipidaemia and develop atherosclerosis(Reference Russell, Koeslag and Amy13–Reference Dolphin, Stewart and Amy15). Consequently, this model has been used extensively to study the impact of metabolic syndrome on various parameters of CVD; however, this is the first study to examine immune function. Several researchers have demonstrated that overweight human subjects also have higher circulating levels of inflammatory mediators (as reviewed by Warnberg & Marcos(Reference Warnberg and Marcos1)). Although one group has noted impairments in the proliferative response to T-cell mitogens(Reference Tanaka, Inoue and Isoda11, Reference Tanaka, Isoda and Ishihara12), the contribution of T-cells to inflammation or the effect of inflammation on T-cell function in the obese state is unknown.
It is well established that dietary nutrients, particularly lipids, can influence T-cell function and the inflammatory response(Reference Calder and Grimble16). Of particular interest in the literature has been the n-3 PUFA, EPA and DHA, which have potent effects on immunity and inflammation that improve chronic inflammatory conditions (as reviewed by Calder(Reference Calder17)). However, the impact of feeding fish oil to obese rodents on immune parameters is limited to only three studies, including one that reported no effect of fish oil on serum TNF-α concentrations(Reference Aguilera, Diaz and Barcelata18). One research group, using macrosomic offspring of diabetic rat dams, reported that feeding EPA and DHA improved the proliferative response of splenocytes to concanavalin A (ConA) and lowered the Th1:Th2 of serum cytokines(Reference Guermouche, Yessoufou and Soulimane19, Reference Khan, Yessoufou and Kim20). These studies indicate that feeding fish oil to obese offspring lowers the Th1 inflammatory response and improves the T-cell proliferative response; however, there is little support for the EPA and DHA's role in more specific aspects of the innate immune system in obesity.
Although the immune-modifying potential of EPA and DHA has been examined in various chronic inflammatory states, there is very little evidence for their effects on immune health in overweight adults. Collectively, these studies indicate that supplementing mixtures of EPA and DHA (1·1–4·2 g/d) for a short duration (6–12 weeks) have only a limited effect on systemic markers of inflammation in obese men or women, but offer little insight into the direct impact of long-chain n-3 PUFA on immune cell function(Reference Chan, Watts and Barrett21–Reference Browning, Krebs and Moore24).
An emerging area of interest in immunology is the role that lipid rafts have on immune cell signalling and general function. Lipid rafts are membrane microdomains found within the plane of the plasma membrane. They are enriched in cholesterol and sphingolipid and are insoluble in non-ionic detergents at low temperatures(Reference Brown and London25). Lipid rafts serve as platforms for the aggregation of specific membrane-bound components requiring coordinated assembly for signal transduction (as reviewed by Dykstra et al. (Reference Dykstra, Cherukuri and Sohn26)). Recently, it was concluded that lipid rafts may be partly responsible for the n-3 PUFA-mediated effects on immune cells (as reviewed by Shaikh & Edidin(Reference Shaikh and Edidin27)); however, these studies are limited to in vitro experiments or studies involving healthy mice.
The objectives of the present study were to determine whether immune function was altered in obese JCR:LA-cp rats fed a high n-6 PUFA diet and whether feeding a diet supplemented with long-chain n-3 PUFA would (1) improve the immune dysfunction present in the JCR:LA-cp rat and (2) alter the fatty acid composition of lipid rafts in immune cells of obese rats. Furthermore, we chose to examine two levels of EPA and DHA: the lower level to reflect what could be easily achieved through supplements and dietary modifications and the higher level to represent therapeutic levels, which would require considerable manipulation of the food supply and greater supplementation.
Methods
All animal care and experimental protocols were conducted in accordance with the Canadian Council on Animal Care and approved by the Faculty of Agricultural, Life and Environmental Sciences Animal Ethics Committee at the University of Alberta. Male obese (cp/cp) and lean (+/+ or +/ − ) rats of the JCR:LA-cp strain were raised in our breeding colony at the University of Alberta. All animals were individually housed in a temperature- and humidity-controlled environment with a 12/12 h reversed light cycle.
The animals were weaned at 3 weeks of age and given free access to water and a standard laboratory rat non-purified diet (Lab diet 5001; PMI Nutrition International, Brentwood, MO, USA). At 12 weeks of age, 1 % (w/w) cholesterol (Sigma-Aldrich, Oakville, ON, Canada) was added to the rat non-purified diet of all rodents for 2 weeks to accelerate the atherosclerotic disease process in the JCR:LA-cp rodents(Reference Dolphin28). At 14 weeks, cp/cp rats were randomly allocated to receive one of the following nutritionally complete diets (n 10) for 3 weeks: control (0 % EPA+DHA, 1 % (w/w) cholesterol); low fish oil (LFO, 0·8 % (w/w) or 1·7 % of energy EPA+DHA, 1 % (w/w) cholesterol); high fish oil (HFO, 1·4 % (w/w) or 3·1 % of energy EPA+DHA, 1 % (w/w) cholesterol). Moreover, lean (+/+ or +/ − ) rats (n 5) were allocated to the control diet for 3 weeks. A 3-week feeding period was chosen based on a previous dietary intervention study in the JCR:LA-cp rats(Reference Reimer and Russell29). The nutrient composition of the experimental diets is provided in Table 1 and the fatty acid composition of the fat included in these diets is provided in Table 2. Fresh batches of diet containing oil were prepared weekly and stored at 4°C until fed; feed cups were replaced every 2–3 d to ensure that the lipid did not oxidise. The rats were weighed and feed consumption, adjusted for food spillage, was recorded twice weekly. After an overnight fast, the rats were killed by cardiac exsanguination under isoflurane anaesthesia. Blood was collected via cardiac puncture in BD Vacuntainer® (BD Biosciences, Mississauga, ON, Canada) and serum stored at − 80°C until later analysis. The spleen was removed under aseptic conditions.
Composition of the experimental diets (g/kg)
Ctl, control; LFO, low fish oil; HFO, high fish oil.
* Harlan Teklad (Madison, WI, USA).
† Save-On-Foods (Edmonton, AB, Canada).
‡ Sigma (Oakville, Canada).
§ Holistic® Flaxseed Oil (London Drugs, Edmonton, AB, Canada).
∥ Completely hydrogenated soyabean oil (CanAmera, Edmonton, AB, Canada).
¶ Safeway (Edmonton, AB, Canada).
** Fish oil contained 3 mg/g mixture of α-tocopherols (Ocean Nutrition, Dartmouth, NS, Canada).
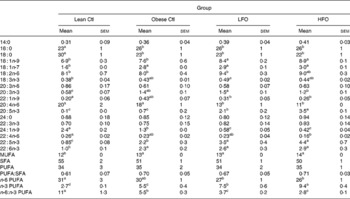
Fatty acid composition of the experimental diets (g/100 g fatty acids)
Ctl, control; LFO, low fish oil; HFO, high fish oil; SFA, sum of SFA; MUFA, sum of MUFA; n-6 PUFA, sum of n-6 PUFA; n-3 PUFA, sum of n-3 PUFA.
Isolation of splenocytes and primary culture conditions
The spleens were weighed and placed in sterile 0·5 % (w/v) bovine serum albumin in Krebs–Ringer–HEPES buffer (pH 7·4) and isolated as we have previously described(Reference Field, Wu and Metroz-Dayer30). Isolated splenocytes were resuspended in complete culture media (RPMI-1640 supplemented with 5 % (v/v) heat-inactivated fetal calf serum, 1 % (v/v) antimycotic–antibiotic solution, HEPES (25 mmol/l) and 2-mercaptoethanol (2·5 mmol/l)) and counted on a haemocytometer (Fisher Scientific, Edmonton, AB, Canada). The essential fatty acid composition (w/w) of the fetal calf serum was as follows: 4·4 % 18 : 2n-6; 0·1 % 18 : 3n-3; 0·5 % 20 : 2n-6; 3 % 20 : 4n-6; 0·1 % 20 : 5n-3; 0·1 % 22 : 4n-6; 0·3 % 22 : 5n-3; 0·8 % 22 : 6n-3. Splenocytes (1·25 × 106 cells/l) were resuspended in the culture media, as previously described, and incubated in 4 ml sterile polystyrene tubes in a humidified atmosphere at 37°C in the presence of 5 % (v/v) CO2. Splenocytes were cultured without mitogen (unstimulated cells) or with ConA (2·5 mg/l), bacterial lipopolysaccharide (LPS; 1 mg/l) or pokeweed mitogen (PWM; 55 mg/L) as previously described(Reference Ruth, Taylor and Zahradka31). After 48 h of culture, the supernatant was removed and stored at − 80°C until cytokine assays were performed. Preliminary studies confirmed that by 48 h the maximum production of cytokines was achieved for cells from both lean and obese rats (data not shown).
Phenotype analysis
Immune cell subsets in freshly isolated splenocytes were identified by a one-, two- or three-colour direct immunofluorescence assay, as previously described(Reference Field, Thomson and Van Aerde32). The following pre-labelled mAbs were used: CD3, OX6 and CD28 (FITC-labelled); CD4, CD8, CD3, CD11b/c and OX12 (PE-labelled); CD25 and CD8 (biotin-labelled). All antibodies were purchased from BD Biosciences, PharMingen (Mississauga, ON, Canada) except CD4 and OX12, which were purchased from Serotec (Cedarlane Laboratories Ltd, Hornby, ON, Canada) and Streptavidin-Quantum Red™ was purchased from Sigma-Aldrich (Oakville, ON, Canada). Streptavidin-Quantum Red™ (R-PE-Cy5 flurochrome) was added to wells containing biotin-labelled Ab. After the final wash, plates were aspirated and 200 μl of cell fix (1 % (w/v) paraformaldehyde) was added to each well. The proportion of cells that were positive for each marker was determined by flow cytometry (FACScan; BD Biosciences, Mississauga, ON, Canada) according to the relative fluorescence intensity using the CellQuest software (BD Biosciences, Mississauga, ON, Canada).
Cytokine production and serum haptoglobin
All of the following assays were performed according to the manufacturer's instructions. The cultured cell supernatants of unstimulated, ConA, bacterial lipopolysaccharide and PWM-stimulated splenocytes were used to determine IL-1β and TNF-α (detection limit: 31·2–2000 pg/ml), IL-2 (23·4–1500 pg/ml), IL-4 (1·6–100 pg/ml), IL-6 (78–5000 pg/ml), IL-10 (15·6–1000 pg/ml) and interferon (IFN)-γ (31·25–2000 pg/ml) levels with OptEIA anti-rat (ELISA) sets were purchased from BD Biosciences, PharMingen (Mississauga, ON, Canada). The values below the range of detection were assigned half of the value of the lowest standard value. The serum haptoglobin levels were determined by a colorimetric assay purchased from Tri-Delta Development Limited (Maynooth, Ireland), according to the manufacturer's instructions. All samples were measured in duplicate and the absorbance for cytokine assays was measured at 450 and 630 nm for haptoglobin on a microtitre plate reader (SPECTRAmax 190, Molecular Devices, Sunnyvale, CA, USA). If the coefficient of variance exceeded 10 % for duplicate samples, the samples were rerun. The average of the duplicate data with a coefficient of variance of ≤ 10 % was used for statistical analysis.
Lipid-raft isolation
Lipid rafts were isolated from unstimulated, freshly isolated splenocytes from obese rats only, as previously described by our group(Reference Schley, Brindley and Field33). Briefly, 2 × 10⁸ of freshly isolated splenocytes were lysed in 500 μl of TNE (25 mm-Tris–Cl, pH 7·5, 150 mm-NaCl, 5 mm-EDTA) containing 1 % (v/v) Triton X-100 (VWR) with fresh protease and phosphatase inhibitors (Sigma-Aldrich) for 30 min at 4°C. Lysates were spun for 30 min at 4°C (1000 rpm) and the supernatant was transferred to cooled ultracentrifuge tubes (Beckham Coulter, Mississauga, ON, Canada). An 80 % (w/v, 800 g/l in TNE) sucrose solution was added to the supernatant to make a 40 % (w/v) sucrose solution. The lysates were gently overlaid with 2 ml of a 30 % (w/v, 300 g/l in TNE) sucrose solution, followed by 2 ml of a 5 % (w/v, 50 g/l in TNE) sucrose solution on ice. The samples were centrifuged for 8 h at 268 000 g at 4°C in an Optima Max ultracentrifuge MLS-50 rotor (Beckham Coulter). Based on previous experiments described later, the lipid-raft material (1ml) was collected from the 5/30 % glucose interface. Ice-cold TNE solution was added to raft fractions centrifuged at 268 000 g for 30 min to pellet and concentrate the rafts.
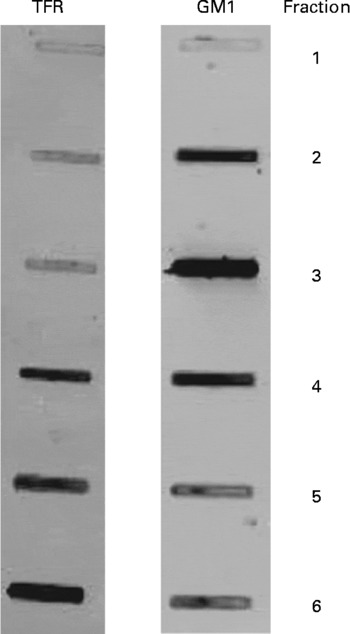
Initial experiments were conducted using four obese JCR:LA-cp rats that were fed the control diet to confirm the isolation of lipid rafts. Six consecutive 800 μl samples were taken, starting at the top of the gradient and the fractions were stored at − 80°C until dot-blotting was performed. A bicinchoninic acid assay (Sigma-Aldrich) was used to determine the protein concentration in each raft fraction. Each fraction (2 μg/10 μl) was dot-blotted onto a nitrocellulose membrane and antibodies directed against the positive raft marker, GM1 ganglioside (cholera toxin B-subunit conjugated with horseradish peroxidase; Sigma), and the negative raft marker, transferrin receptor (Zymogen Laboratories, Invitrogen, Burlington, ON, Canada), were used to confirm the isolation of lipid rafts. The GM1-ganglioside marker stained most strongly in the third fraction and the transferrin receptor stained most intensely in fractions 4–6 and least intensely in fractions 1–3 (Fig. 1).
Immunoblots characterising lipid rafts isolated from obese JCR : LA-cp rats fed the control diet. GM1, positive raft marker; TFR (transferrin receptor), negative raft marker. Numbers represent the fraction number, where 1 is the top layer and 6 is the bottom layer. Fraction 3 represents the raft fraction and fractions 4–6 represent soluble membrane fractions.
Splenocyte phospholipid fatty acid composition
A modified Folch method was used to extract lipids from freshly isolated, unstimulated splenocytes and lipid rafts (fraction 3), as previously described(Reference Field, Ryan and Thomson34). For lipid extracted from whole cells, total phospholipids were separated on silica G plates, as previously described(Reference Layne, Goh and Jumpsen35), and visualised with 8-anilino-1-naphthalenesulfonic acid under ultraviolet light against the appropriate standards. FA methyl esters were prepared from splenocyte total phospholipids and from total lipid of lipid rafts(Reference Field, Ryan and Thomson34), and were separated by automated GLC (Varian 3800; Varian Instruments, Mississauga, ON, Canada) using a 100 m CP-Sil 88 fused capillary column (Varian Instruments), as described elsewhere(Reference Cruz-Hernandez, Deng and Zhou36).
Statistics
Statistical analysis was conducted by one-way ANOVA using the SAS software statistical package (version 9.1; SAS Institute, Cary, NC, USA). All data were reported as means with their standard errors. Significant differences among groups were determined by Duncan's multiple range test (P < 0·05) and all non-parametric data were log-transformed prior to running statistical analyses. The differences between groups with data that remained non-parametric after log-transforming were analysed using the Kruskal–Wallis/Wilcoxon test (P < 0·05).
Results
Feed intake, body-weight and spleen characteristics
Obese rats had higher daily feed intake (33 (sem 0·4) g/d v. 20 (sem 0·3) g/d, P < 0·05), final body weight (592 (sem 5) g v. 378 (sem 4) g, P < 0·05) and spleen weight (1165 (sem 40) mg v. 856 (sem 23) mg, P < 0·05) than lean rats. When adjusted for body weight (bwt), spleens of obese rats weighed less than lean rats (1·98 (sem 0·06) mg/g bwt v. 2·27 (sem 0·06) mg/g bwt, P < 0·05), but the concentration of splenocytes per gram of spleen did not differ between lean and obese rats (5·3 (sem 0·5) × 108 cells v. 5·6 (sem 0·4) × 108 cells, P < 0·05). Obese rats fed the LFO (556 (sem 16 )g) or HFO (561 (sem 6 g) diet had lower final body weights than the obese rats fed the control diet (592 (sem 5 g), P < 0·05), but the change in body weight (76 (sem 11) g, Ctl v. 85 (sem 4 )g, LFO v. 80 (sem 5 )g, HFO) and feed intake did not differ (34 (sem 0·6, LFO or 32 (sem 0·3), HFO). Feeding FO did not alter spleen weight (LFO, 1930 (sem 130 )mg or HFO, 1910 (sem 75) mg) or concentration of immune cells (LFO, 5·2 (sem 0·6) × 108 or HFO, 5·7 (sem 1·0) × 108) in the spleen.
Fatty acid composition of splenocyte phospholipids
Obese rats fed the control diet had a higher proportion of 16 : 0, 18 : 1n-9, 20 : 3n-3, 22 : 5n-3, 22 : 6n-3 and total MUFA and n-3 PUFA and a lower proportion of 18 : 0, 24 : 1n-9 and n-6:n-3 PUFA ratio in splenocyte phospholipids, compared with the lean animals fed the same diet (Table 3). Obese animals fed either FO diet had a significantly higher proportion of 18 : 1n-9, 20 : 5n-3, 22 : 5n-3 and total n-3 PUFA and lower proportion of 20 : 4n-6, 24 : 1n-9 and a lower n-6:n-3 PUFA ratio. Only the rats fed the LFO diet had a significantly higher proportion of 18 : 2n-6, compared with the obese rats fed the control diet. Compared with the HFO diet, rats fed the LFO diet had a higher percentage of 20 : 4n-3 and n-6:n-3 PUFA and a lower percentage of 20 : 5n-3 and total n-3 PUFA. Feeding fish oil did not significantly change the proportion of 22 : 6n-3 that was incorporated into the splenocyte PL membrane of the obese JCR:LA-cp rat (Table 3).
Mean values with their standard errors for ten rats per group for the obese rats and five rats per group for the lean rats)
SFA, sum of SFA; MUFA, sum of MUFA; n-6 PUFA, sum of n-6 PUFA; n-3 PUFA, sum of n-3 PUFA.
a,b,c Means within the same row that do not share a common letter are significantly different (P < 0·05).
* The relative proportions of fatty acids from 12 : 0 to 24 : 1n-9 were measured in the whole splenocyte membrane, but only the major fatty acids are reported.
Fatty acid composition of lipid rafts
Obese rats fed either FO diet had a higher proportion of 18 : 2n-6, 20 : 5n-3, 22 : 5n-3 and total n-3 PUFA and a lower proportion of 20 : 4n-6 and n-6:n-3 PUFA ratio (Table 4). Only the rats fed the HFO diet had a higher proportion of cis-9-16 : 1, cis-9-18 : 1 and 22 : 6n-3. Compared with the rats fed the HFO diet, the rats fed the LFO had a higher proportion of 18 : 0 and a lower percentage of cis-11-18 : 1, 20 : 5n-3, total MUFA, total n-3 PUFA and a lower n-6:n-3 PUFA ratio (Table 4).
(Mean values with their standard errors for nine rats per group)

SFA, sum of SFA; MUFA, sum of MUFA; n-6 PUFA, sum of n-6 PUFA; n-3 PUFA, sum of n-3 PUFA.
a,b,c Means within the same row that do not share a common letter are significantly different (P < 0·05).
* The relative proportions of fatty acids from 12 : 0 to 24 : 1n-9 were measured, but only the major fatty acids are reported.
Phenotype of splenocytes
Obese rats fed the control diet had a higher proportion of CD3+CD4+ and CD11b/c+OX6 − , but a lower proportion of CD4+CD25+, CD11b/c+OX6+ and OX12+ (B-cells) splenocytes compared with lean rats fed the control diet (Table 5). Obese rats fed the FO diet had a higher proportion of CD3+, CD3+CD4+, CD4+CD28+, CD4+CD28 − and CD11b/c+OX6 − splenocytes, but only those rats fed the LFO diet had a higher proportion of CD4+CD25+ splenocytes and only the rats fed the HFO diet had a lower proportion of CD11b/c+OX6+ (Table 5)
(Mean values with their standard errors for ten rats per group for the obese rats and five rats per group for the lean rats)
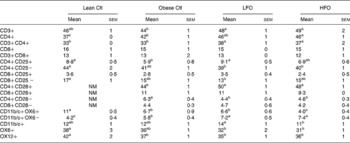
NM, not measured.
* The values are a proportion of the total gated cells as determined by immunofluorescence.
a,b,c Means within the same row that do not share a common letter are significantly different (P < 0·05)
Cytokine production
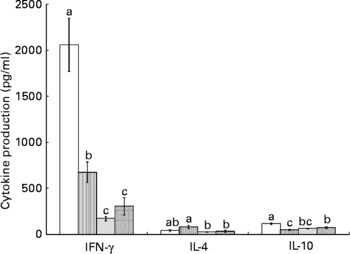
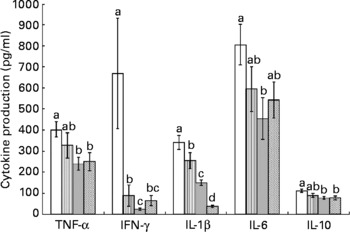
Splenocytes of obese rats fed the control diet produced less mitogen-stimulated IFN-γ (ConA, bacterial lipopolysaccharide and PWM), less LPS-stimulated IL-1β and less ConA-stimulated IL-10 compared with lean rats fed the control diet (Figs. 2–4). Unstimulated splenocytes of obese rats fed the control diet produced less IL-6 (26 (sem 4) pg/ml v. 61 (sem 20) pg/ml) and IL-10 (348 (sem 23) pg/ml v. 499 (sem 86) pg/ml) than lean rats fed the control diet. IL-2, IL-4 or IL-10 (LPS or PWM stimulated; Figs. 2–4) or unstimulated TNF-α or IL-1β (data not shown) production did not differ between the lean and obese rats.
Concanavalin A (ConA)-stimulated splenocyte cytokine production in lean and obese JCR : LA-cp rats fed the control (Ctl) diet and obese rats fed the low fish (LFO) or the high fish oil (HFO) diet. The bars represent means with their standard errors (ten per group for obese Ctl, LFO and HFO and five per group for lean Ctl). a,b,cThe bars not sharing a common letter are significantly different (P < 0·05). ![]() , Lean Ctl;
, Lean Ctl; ![]() , obese Ctl;
, obese Ctl; ![]() , LFO;
, LFO; ![]() , HFO. ConA-stimulated IL-2 (1328 (sem 79), n 34), TNF-α (62 (sem 7), n 35) and IL-6 (180 (sem 12), n 35) were not statistically different among groups. IFN, interferon.
, HFO. ConA-stimulated IL-2 (1328 (sem 79), n 34), TNF-α (62 (sem 7), n 35) and IL-6 (180 (sem 12), n 35) were not statistically different among groups. IFN, interferon.
Lipopolysaccharide-stimulated splenocyte cytokine production in lean and obese JCR : LA-cp rats fed the control (Ctl) diet and obese rats fed the fish oil diet. The bars represent means with their standard errors (ten per group for obese, Ctl, low fish oil (LFO) and high fish oil (HFO) and five per group for lean Ctl). a,b,c,d The bars not sharing a common letter are significantly different (P < 0·05). ![]() , Lean Ctl;
, Lean Ctl; ![]() , obese Ctl;
, obese Ctl; ![]() , LFO;
, LFO; ![]() , HFO. IFN, interferon.
, HFO. IFN, interferon.
Pokeweed mitogen (PWM)-stimulated splenocyte cytokine production in lean and obese JCR:LA-cp rats fed the control (Ctl) diet and obese rats fed the fish oil diet. The bars represent means with their standard errors (ten per group for obese Ctl, low fish oil (LFO) and high fish oil (HFO) and five per group for lean Ctl). a,b,c The bars not sharing a common letter are significantly different (P < 0·05). ![]() , Lean Ctl;
, Lean Ctl; ![]() , obese Ctl;
, obese Ctl; ![]() , LFO;
, LFO; ![]() , HFO. PWM-stimulated TNF-α (273 (sem 22), n 35), IL-2 (184 (sem 15), n 34) and IL-6 (289 (sem 19), n 34) were not statistically different among groups. IFN, interferon.
, HFO. PWM-stimulated TNF-α (273 (sem 22), n 35), IL-2 (184 (sem 15), n 34) and IL-6 (289 (sem 19), n 34) were not statistically different among groups. IFN, interferon.
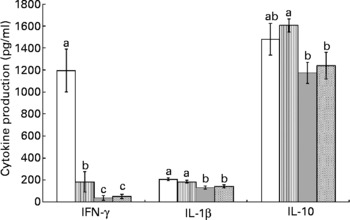
Feeding either FO diet to obese rats resulted in lower production of IL-1β (LPS or PWM stimulated), IL-10 (PWM stimulated), IFN-γ (PWM and ConA stimulated) and IL-4 (ConA stimulated) compared with obese rats fed the control diet (Figs. 2–4). Obese rats fed the LFO diet had lower LPS-stimulated IFN-γ production and lower IL-10 (236 (sem 54) pg/ml v. 348 (sem 23) pg/ml) production by unstimulated splenocytes. Obese rats fed the HFO diet had higher ConA-stimulated IL-10 production compared with obese control rats and lower LPS-stimulated IL-1β compared with obese rats fed the LFO diet. Feeding FO to obese rats did not alter IL-2 or IL-6 (Figs. 2–4) production or unstimulated TNF-α or IL-1β (data not shown).
Haptoglobin
The concentration of serum haptoglobin in either the LFO-fed rats (1·6 (sem 0·1) mg/ml) or HFO-fed rats (1·6 (sem 0·1) mg/ml) did not differ from obese Ctl rats (1·7 (sem 0·1) mg/ml) (P < 0·05).
Discussion
Immune dysfunction in the JCR:LA-cp rat
The present preliminary study demonstrated altered immune responses in the JCR:LA-cp rat, an established model of the metabolic syndrome. In comparison with lean rats, obese rats have a lower inflammatory response (defined by IL-6 production) in the unstimulated condition and a lower production of inflammatory cytokines (IL-1β and IFN-γ) with mitogen stimulation. The lower production of LPS-stimulated IFN-γ is consistent with our previous findings in Zucker fa/fa rats(Reference Ruth, Taylor and Zahradka31), a study in ob/ob mice lymph nodes (37) and a study using diet-induced obese (DIO) mice(Reference Katagiri, Arakawa and Kurahashi38). However, ConA-stimulated IFN-γ production was also lower in obese rats. We and other groups have reported higher T-cell mitogen-induced IFN-γ production in splenocytes of fa/fa Zucker rats(Reference Ruth, Taylor and Zahradka31). Similar to our observation in the present study that unstimulated splenocytes of obese rats produced less IL-6, Lamas et al. (2004) reported lower IL-6 mRNA levels in basal-state splenocytes of DIO rats(Reference Lamas, Martinez and Marti39). In obese human subjects, the effects of obesity on ex vivo mitogen-stimulated cytokine production are limited to two studies. Although one study has reported that blood mononuclear cells of obese individuals produce more TNF-α in response to bacterial lipopolysaccharide(Reference Tanaka, Isoda and Ishihara12), a study conducted in morbidly obese patients reported significantly less production of monocyte chemoattractant protein-1 (MCP-1) and IFN-γ in response to bacterial lipopolysaccharide and PMAI (phorbol-12-myristate 13-acetate + ionomycin) stimulation(Reference Fontana, Eagon and Colonna40). The present study suggests that inflammatory cytokine production in the JCR:LA-cp rat may better represent morbid obesity in human subjects. However, despite the lower n-6:n-3 PUFA ratio in membranes and a leptin receptor defect, IL-2 production (a measure of T-cell proliferative response) after mitogen stimulation was not different between obese and lean JCR:LA-cp rats, suggesting that unlike Zucker fa/fa rats and genetic and diet-induced rodent models of obesity(Reference Ruth, Taylor and Zahradka31, Reference Mito, Hosoda and Kato41, Reference Lamas, Martinez and Marti42–Reference Mito, Kaburagi and Yoshino46), mitogen-induced proliferation by splenocytes does not appear to be impaired in obese JCR:LA-cp rats. Presently, mitogen-stimulated IL-2 production in obese individuals has not been measured ex vivo. However, two groups have reported that there was no difference in the percentage of PMAI-stimulated CD4+ cells that expressed IL-2 in obese children(Reference Pacifico, Di and Anania47, Reference Svec, Vasarhelyi and Paszthy48). This suggests that the JCR:LA-cp rat represents the mitogen-stimulated production of IL-2 observed in human obesity.
Leptin receptor and immunity
The JCR:LA-cp rat expresses a dysfunctional form of the leptin receptor due to a single point mutation in the corpulent (cp) or leptin receptor gene(Reference Russell and Amy49, Reference Russell and Amy50). As a consequence, the extracellular domain of the leptin receptor is absent and thus obese (cp/cp) rats lack the ability to respond to leptin via the long form of the leptin receptor (Ob-Rb). Recent evidence indicates that leptin has a significant role in immune cell function (37,51–56) and is expressed on several immune cell types, including macrophages and dendritic cells and T- and B-lymphocytes(Reference Mattioli, Straface and Quaranta54, Reference Papathanassoglou, El-Haschimi and Li57). Researchers have identified leptin as a key regulator of the inflammatory response of both the innate and acquired immune systems(Reference Busso, So and Chobaz-Peclat37, Reference Loffreda, Yang and Lin51–Reference Siegmund, Sennello and Jones-Carson56). Therefore, the absence of a functional leptin receptor signalling via the Ob-Rb likely accounts, at least in part, for the impaired production of inflammatory mediators in splenocytes of the JCR:LA-cp rat(Reference Wu-Peng, Chua and Okada58). The present finding that ConA-stimulated IL-2 production is unaltered in obese JCR:LA-cp rats is surprising in the light of evidence which suggests that leptin is critical for the proliferative response of CD4+T-lymphocytes, the prevention of T-lymphocyte apoptosis and the secretion of IL-2 (as reviewed by Matarese et al. (Reference Matarese, Moschos and Mantzoros59)). This suggests that in this rodent model leptin is not critical for adequate IL-2 secretion, a measure of T-cell proliferation in mitogen-stimulated splenocytes.
Effect of feeding fish oil on immune function in obese JCR:LA-cp rats
Feeding fish oil reduced the production of inflammatory cytokines by splenocytes in this rodent model, without altering the proliferative response (measured by IL-2 production) of T-lymphocytes. It is interesting that despite normal IL-2 production, feeding EPA and DHA lowered both the Th1 (IFN-γ) and Th2 (IL-4) cytokines when JCR:LA-cp rat splenocytes were stimulated with a T-cell mitogen. It is difficult to ascertain if this finding is specific to this rodent model or reflective of the obese state, as few studies have examined the impact of fish oil on immune function in obese and/or insulin-resistant conditions. While we did not include a group of lean rats fed the FO diet, previous studies in non-obese rodents have shown that dietary n-3 PUFA suppress IL-2 production(Reference Jolly, Jiang and Chapkin60–Reference Fan, Ly and Barhoumi63). It has recently been postulated that n-3 PUFA lower both the Th1 and Th2 cytokine responses in other inflammatory disease states, which is consistent with our data (as reviewed by Calder & Grimble(Reference Calder and Grimble16)).
In addition to the effects on the adaptive immune system, feeding fish oil also resulted in a lower innate immune response as determined by ex vivo LPS-stimulated cytokine production. Feeding the higher level of EPA and DHA resulted in a significantly lower LPS-stimulated IL-1β production and higher ConA-stimulated IL-10, suggesting that the higher dose is more effective at suppressing the inflammatory response than the lower dose. It is well established in other inflammatory disease states that high doses of EPA and DHA can reduce the inflammatory response and improve disease pathology (as reviewed by Calder(Reference Calder17)). Consistent with studies feeding FO to overweight subjects(Reference Chan, Watts and Barrett21–Reference Browning, Krebs and Moore24), the n-3 PUFA diets did not influence a serum marker of inflammation (haptoglobin). The HFO diet contained slightly higher levels of total MUFA compared with the Ctl diet. The changes in the MUFA content of the diet have been reported to alter immune function, but the differences in these studies far exceeded the 3 % difference in the present study (64,65).
Effects of diet and obesity on lipid membrane composition
The differences in PUFA composition of the PL membrane between lean and obese rats may have contributed to the lower production of inflammatory cytokines. Obese rats fed the control diet had a lower n-6:n-3 PUFA ratio due to a higher incorporation of total n-3 fatty acids, including DHA (22 : 6n-3). The lower PL n-6:n-3 PUFA ratio agrees with our previous findings (31) and others using the fa/fa Zucker rat(Reference Phinney, Tang and Thurmond66, Reference Guesnet, Bourre and Guerre-Millo67). It is well established that lowering the n-6:n-3 PUFA ratio in the membrane of immune cells can reduce the inflammatory response in both healthy and inflammatory states (as reviewed by Calder(Reference Calder17)). Obese JCR:LA-cp rats had significant differences in the fatty acid composition of splenocyte phospholipids despite consuming the same diet as lean rats (Table 3), suggesting an abnormality in fatty acid metabolism.
Feeding fish oil further lowered the n-6:n-3 PUFA ratio in the splenocyte membrane of obese rats, due to both a higher content of EPA and DPA (docosapentaenoic acid, 22 : 5n-3) and lower AA. Recently, it has been suggested that PUFA-mediated alterations in immune cell function can be explained, in part, by the changes in the protein and lipid content and composition of lipid rafts (as reviewed by Ma et al. (Reference Ma, Seo and Switzer68)). In the present study, compared with obese rats fed the control diet, obese rats fed the FO diet had significantly higher incorporation of linoleic acid, EPA and DPA and a lower proportion of AA and n-6:n-3 PUFA in lipid rafts isolated from the splenocyte. Only obese rats fed the HFO diet had a significantly higher percentage of DHA in the lipid component of splenocyte rafts. The present results suggest that there is a preferential incorporation of n-3 PUFA into the lipid-raft domains compared with the whole membrane when FO is fed. Relative to the whole membrane, there was a greater increase of EPA into the lipid raft when FO was fed (76 % and 265 % greater for the LFO and HFO diets, respectively). Furthermore, in relation to the whole membrane, the incorporation of DHA into the lipid raft was 21 % greater for rats fed the higher dose of fish oil. The significantly higher incorporation of DHA into the lipid raft of obese rats fed the HFO diet may have contributed to the finding that JCR:LA-cp rats fed the HFO diet had a lower proportion of activated innate immune cells (CD11b/c+OX6+, non-B-cells expressing the MHC class II molecule). The major histocompatability complex (MHC) class II molecule has been shown to reside in membrane microdomains of dendritic cells and macrophages/monocytes(Reference Buatois, Baillet and Becart69–Reference Anderson, Hiltbold and Roche72) and n-3 fatty acids can down-regulate the expression of the MHC II molecule on immune cells from healthy rodents(Reference Sanderson, MacPherson and Jenkins73). Thus, it is possible that the significantly higher proportion of DHA in splenocyte lipid rafts of rats fed the HFO diet could have displaced the MHC class II molecule from the lipid-raft component of the splenocyte membrane and contributed to the lower inflammatory response (lower LPS-stimulated IL-1β).
Conclusion
This is the first study to report that the JCR:LA-cp rat, a genetic rodent model of obesity and insulin resistance, has impaired immune responses. With the exception of IL-2 production, splenocytes of obese rats were poor responders to mitogen stimulation. There was lower mitogen-stimulated inflammatory cytokine production in these rats, which may be due to the higher proportion of n-3 PUFA in splenocyte PL membranes. Feeding fish oil to obese rats reduced mitogen-stimulated inflammatory cytokine production without affecting ConA-stimulated IL-2 production, possibly via modification to the fatty acid composition of the whole membrane and lipid raft. Furthermore, the HFO diet improved the inflammatory response to a greater extent than the lower FO diet (lower IL-β and higher IL-10 production). The relatively higher incorporation of DHA into the lipid rafts of splenocyte membranes coincided with a reduced MHC class II molecule expression and lower IL-1β production.
Acknowledgements
There are no conflicts of interest. Funding for the present study was made possible in part by contributions from Dairy Farmers of Canada, the Natural Sciences and Engineering Research Council of Canada (NSERC), Alberta Livestock and Industry Development Fund (ALIDF) and the Alberta Diabetes Institute. M. R. R. held the Muttart/Collip Diabetes Studentship from the Muttart Diabetes and Research Training Centre, University of Alberta, Edmonton, Alberta, Canada. M. R. R. designed the experimental diets and performed all experimental assays, statistical analyses and wrote the manuscript with feedback from all authors. S. D. P. and C. J. F. were involved with experimental design and supported all stages with intellectual guidance. We wish to thank Susan Goruk and Marnie Newell for their excellent technical assistance and Kristina McNaughton and Sharon Sokolik for their exceptional care of the animals and assistance with the present study.


