


Glycaemic index (GI) is defined as the incremental area under the blood glucose response curve of available carbohydrate in a food expressed as a percentage of the response to available carbohydrate in a reference food (usually glucose, white bread or white rice), and thus represents the quality of carbohydrateReference Jenkins, Wolever, Taylor, Barker, Fielden, Baldwin, Bowling, Newman, Jenkins and Goff1. Glycaemic load (GL) is the product of the GI and the available carbohydrate content of the food, and thus represents both the quality and the quantity of carbohydrateReference Salmeron, Ascherio, Rimm, Colditz, Spiegelman, Jenkins, Stampfer, Wing and Willett2. The recent publication of accumulated GI and GL values for about 750 individual food itemsReference Foster-Powell, Holt and Brand-Miller3 has made possible the incorporation of GI and GL into questionnaire-based assessments of usual diet, and hence to calculate dietary GI and GL. To date, numerous dietary assessment questionnaires have been used in epidemiological studies to investigate associations between dietary GI and GL and various health outcomes, including type 2 diabetesReference Salmeron, Ascherio, Rimm, Colditz, Spiegelman, Jenkins, Stampfer, Wing and Willett2, Reference Hodge, English, O'Dea and Giles4, CVDReference Liu, Willett, Stampfer, Hu, Franz, Sampson, Hennekens and Manson5, several cancersReference Jonas, McCullough, Teras, Walker-Thurmond, Thun and Calle6 and metabolic risk factorsReference Liese, Gilliard, Schulz, D'Agostino and Wolever7–Reference Murakami, Sasaki, Takahashi, Okubo, Hosoi, Horiguchi, Oguma and Kayama11.
Although the dietary questionnaires used in these studies have been validated for a wide range of nutrients and foods, information on the reproducibility and relative validity of dietary GI and GL derived from dietary questionnaires is extremely limited. Very recently, a Swedish study examined this issue using 2 × 7 d dietary records (DR) as a gold standardReference Levitan, Westgren, Liu and Wolk12. However, the subjects in this study were limited to menReference Levitan, Westgren, Liu and Wolk12. Additionally, portion sizes derived from the DR used as the gold standard were also used during the calculation of dietary GI and GL in the dietary questionnaire, resulting in an overestimation of the ability of the dietary questionnaireReference Levitan, Westgren, Liu and Wolk12. More importantly, the ability of the dietary questionnaire observed in Swedish menReference Levitan, Westgren, Liu and Wolk12 may differ that in other populations with different dietary habits, including Japanese individuals.
Here, we examined the reproducibility and relative validity of dietary GI and GL estimated from a self-administered diet-history questionnaire (DHQ) for adult JapaneseReference Sasaki, Yanagibori and Amano13–Reference Sasaki, Ushio, Amano, Morihara, Todoriki, Uehara and Toyooka15, using 4 d semi-weighed DR conducted in each season over a 1-year period (16 d in total) as the gold standard. In the present study of Japanese adults, whose dietary GI and GL are primarily determined on the basis of the GI of white rice (a characteristic seldom observed in Western individuals)Reference Murakami, Sasaki, Takahashi, Okubo, Hosoi, Horiguchi, Oguma and Kayama11, Reference Amano, Kawakubo, Lee, Tang, Sugiyama and Mori16, Reference Murakami, Sasaki, Okubo, Takahashi, Hosoi and Itabashi17, we included not only men but also women, and estimated dietary GI and GL using a DHQ independently of information derived from the DR.
Subjects and methods
Subjects
The present study was conducted in three areas in Japan – Osaka (urban), Nagano (rural inland) and Tottori (rural coastal). In each area, we recruited apparently healthy women aged 30–69 years who were willing to participate and were living together with their husbands, such that each 10-year age class (30–39, 40–49, 50–59 and 60–69 years) contained eight women equally (without consideration of the age of the men), giving a total of ninety-six women and ninety-six men invitees. None of the subjects was a dietitian, was currently receiving or had recently received dietary counselling from a doctor or dietitian, or had a history of educational hospitalisation for diabetes or nutritional education from a dietitian. Group orientations for the subjects were held before the study at which the study purpose and protocol were explained. Written informed consent was obtained from each subject. A total of ninety-two women aged 31–69 years and ninety-two men aged 32–76 years completed the study protocol and were included in the present analysis. Body height was measured to the nearest 0·1 cm with the subject standing without shoes. Body weight in light indoor clothes was measured to the nearest 0·1 kg. BMI was calculated as body weight (kg) divided by the square of body height (m).
Dietary records
Between November 2002 and September 2003, the subjects completed the semi-weighed DR on four non-consecutive days in each of the four seasons at intervals of approximately 3 months (DR1 in November and December 2002 (autumn), DR2 in February 2003 (winter), DR3 in May 2003 (spring) and DR4 in August and September 2003 (summer)). Each of the four recording days consisted of one weekend day and three weekdays. During the orientation session, the staff (registered dietitians) gave the subjects both written and verbal instructions on how to keep the DR and provided as an example a completed recording sheet. Each couple was given recording sheets and a digital scale, instructed how to weigh each food and drink, and asked to record and weigh all foods and drinks consumed on each recording day. When weighing was difficult (for example, eating out), we instructed them to record the size and quantity of foods they ate using household measures in as much detail as possible. For each recording day, the subjects were asked to fax the completed forms to the local staff (registered dietitians), who reviewed the submitted forms and, if necessary, asked the subjects to add or modify the records by telephone or fax. The responses were faxed or, in some cases, handed directly to the staff.
All the collected records were checked by trained registered dietitians in each local centre and then again in the study centre. The coding of records and conversion of other measurements of quantities into g were performed by trained registered dietitians in the survey centre in accordance with uniform procedures. A total of 1299 food and beverage items appeared in the DR. Intakes of energy, total carbohydrate and total dietary fibre were estimated based on the estimated intakes of all items and the Standard Tables of Food Composition in Japan 18. Available carbohydrate was calculated as total carbohydrate minus total dietary fibreReference Foster-Powell, Holt and Brand-Miller3.
Diet-history questionnaire
Between November 2002 and September 2003, subjects answered the DHQ four times (in each season) at intervals of approximately 3 months (DHQ1 in November 2002 (autumn), DHQ2 in February 2003 (winter), DHQ3 in May 2003 (spring) and DHQ4 in August and September 2003 (summer)). In each season, the DHQ was answered before the start of the dietary recording period. Subjects also answered an additional DHQ (DHQ5) about 1 year after completing DHQ1 (in November 2003 (autumn)). Responses to the DHQ were checked at least twice for completeness, and when necessary reviewed with the subject to ensure the clarity of answers.
The DHQReference Sasaki, Yanagibori and Amano13–Reference Sasaki, Ushio, Amano, Morihara, Todoriki, Uehara and Toyooka15 is a sixteen-page structured self-administered questionnaire assessing dietary habits during the preceding month, consisting of the following seven sections: (1) general dietary behaviour; (2) usual cooking methods; (3) consumption frequency and amount of six alcoholic beverages; (4) consumption frequency and semi-quantitative portion size of 118 selected food and non-alcoholic beverage items; (5) dietary supplements; (6) consumption frequency and semi-quantitative portion size of eighteen staple foods (rice, other grains, noodles, bread and other grain products), soup for noodles, and miso (fermented soyabean paste) soup, and with questions on the size of cups (bowls) usually used for rice and miso soup; (7) open-ended items for foods consumed regularly ( ≥ once/week) but not appearing in the DHQ. The food and beverage items were selected as foods commonly consumed in Japan, mainly from a food list used in the National Nutrition Survey of Japan, and standard portion sizes and the size of cups (bowls) for rice and miso soup were derived mainly from several recipe books for Japanese dishesReference Sasaki, Yanagibori and Amano13.
Estimates of dietary intake for a total of 150 food and beverage items were calculated using an ad hoc computer algorithm for the DHQ according to the following procedures. For most items (145 items listed in sections 3, 4 and 6), dietary intake was calculated based on the reported consumption frequency and portion size according to the semi-quantitative food-frequency methodology. Dietary intake of the remaining five items (four seasonings used during cooking and soya sauce) was estimated according to the diet-history method, using the qualitative information in sections 1 and 2 of the DHQ and the quantitative information in section 4. Information on dietary supplements (section 5) and data from the open-ended questionnaire items (section 7) were not used in the calculation of dietary intake. Although the DHQ originally provided estimates of intake of a total of 147 items, a modification of the algorithm made it possible to divide the estimation of ice cream (one item) into three kinds (three items) (regular, premium (high-fat) and unspecified varieties), and to provide an estimation of water used in miso soup, giving a total of 150 items.
For men, the intake of foods categorised into meats, fish and shellfish, and eggs was calculated as the product of reported consumption frequency and portion size multiplied by a factor of 1·2, for several reasons. First, standard portion sizes in the DHQ may be generally considered as those for women, not only because the recipe books for Japanese dishes, from which standard portion sizes were derived, generally show portion sizes for women, but also because the DHQ was originally developed for womenReference Sasaki, Yanagibori and Amano13. Second, the possibility of sex differences in portion size is likely to be higher in foods used as a main dish (such as meats, fish and shellfish, and eggs) than in other foodsReference Ogawa, Tsubono and Nishino19. Finally, intake of meats, fish and shellfish, and eggs (and rice), but not other foods, is generally higher in men than in women in Japan20. Although these arbitrary procedures have little influence on ranking ability, the ability of the DHQ to provide average estimations should be improved. Possible sex differences in rice portion size should be considered in terms of rice cup (bowl) size. Intakes of energy and available carbohydrate (total carbohydrate minus total dietary fibre)Reference Foster-Powell, Holt and Brand-Miller3 were estimated based on the estimated intake of all 150 items and the Standard Tables of Food Composition in Japan 18.
Calculation of dietary glycaemic index and load
Dietary GI was calculated by multiplying the contribution of each individual food to daily available carbohydrate intake by the food's GI value and then summing the products:

Dietary GL was calculated by multiplying the dietary GI by the total amount of daily available carbohydrate intake (divided by 100):

For these calculations, we used a strategy used in our previous studyReference Ma, Olendzki, Chiriboga, Hebert, Li, Li, Campbell, Gendreau and Ockene10 with several modifications, as follows.
To determine the GI value of individual food items, each food on the DR and DHQ was directly matched to foods appearing in the available databases on GI values. The databases used were an international table of GIReference Foster-Powell, Holt and Brand-Miller3, several publications concerning the GI of Japanese foodsReference Sugiyama, Tang, Wakaki and Koyama21–Reference Hashizume, Ihara, Kakinoki, Inage, Kimura and Kimura23, recent articles on GI values published after the publication of the international GI tableReference Fernandes, Velangi and Wolever24, Reference Henry, Lightowler, Strik, Renton and Hails25 and an online database provided by the Sydney University Glycemic Index Research Service26. Glucose was used as the reference (GI for glucose = 100). The white bread-based GI values were transformed into glucose-based GI values by multiplying the white bread-based GI by 0·7, as in Western studiesReference Foster-Powell, Holt and Brand-Miller3, Reference Fernandes, Velangi and Wolever24–26, or by 0·73 ( = 100/137 (white bread-based GI value of white bread/white bread-based GI value of glucose)) as in Japanese studiesReference Hashizume, Ihara, Kakinoki, Inage, Kimura and Kimura23. The white rice-based GI values were transformed into glucose-based GI values by multiplying the white rice-based GI by 0·82 ( = 100/122 (white rice-based GI value of white rice/white rice-based GI value of glucose))Reference Sugiyama, Tang, Wakaki and Koyama21, Reference Sugiyama, Wakaki and Nakamoto22. Because between-subject variability is relatively small when the glycaemic response to a test food is presented relative to a standard foodReference Brand-Miller, Thomas, Swan, Ahmad, Petocz and Colagiuri27, Reference Frost, Brynes, Bovill-Taylor and Dornhorst28, we did not restrict GI values to those obtained from non-diabetic subjects onlyReference Neuhouser, Tinker and Thomson29. Additionally, GI values were applied without regard to the reference time periodReference Neuhouser, Tinker and Thomson29. GI values were also applied without regard to the geographical locale of the original studyReference Neuhouser, Tinker and Thomson29, except for the case of white rice as mentioned later. When more than one GI value was available, the mean value was used.
Specific details on the GI value of white rice chosen are worth mentioning. For Japanese individuals, not only is white rice (a completely self-sufficient grain product30) a major determinant of dietary GI and GLReference Murakami, Sasaki, Takahashi, Okubo, Hosoi, Horiguchi, Oguma and Kayama11, Reference Amano, Kawakubo, Lee, Tang, Sugiyama and Mori16, Reference Murakami, Sasaki, Okubo, Takahashi, Hosoi and Itabashi17, but also the GI of rice needs to be tested brand by brand locally since GI values for rice cannot be reliably predicted on the basis of the size of the grain or the type of cooking methodReference Foster-Powell, Holt and Brand-Miller3. In the literature, we found five GI values of white rice harvested in JapanReference Sugiyama, Tang, Wakaki and Koyama21–Reference Hashizume, Ihara, Kakinoki, Inage, Kimura and Kimura23, Reference Matsuo, Mizushima, Komuro, Sugeta and Suzuki31. One of these values was derived from a study with insufficient methodologies (a single measurement for the reference food and different timing of blood sampling) using white rice boiled with an unusually large amount of water (rice:water 1:1·5)Reference Matsuo, Mizushima, Komuro, Sugeta and Suzuki31, compared with the typical ratio of 1:118. Further, the GI value obtained in this study (GI 48)Reference Matsuo, Mizushima, Komuro, Sugeta and Suzuki31 was extremely low compared with four other values obtained in studies with sufficient methodologies using white rice boiled with a typical amount of water (GI 71, 78, 79 and 82)Reference Sugiyama, Tang, Wakaki and Koyama21–Reference Hashizume, Ihara, Kakinoki, Inage, Kimura and Kimura23. Therefore, we rejected the former GI value30 and used the mean value (GI 77)Reference Murakami, Sasaki, Takahashi, Okubo, Hosoi, Horiguchi, Oguma and Kayama11 of the latter four GI valuesReference Sugiyama, Tang, Wakaki and Koyama21–Reference Hashizume, Ihara, Kakinoki, Inage, Kimura and Kimura23 as the GI of white rice.
A total of 151 food items in the DR for which a GI value had not been determined were assigned a value according to the closest comparable food. Ten food items in the DHQ for which a GI value had not been determined were assigned a value according to the closest comparable food, as follows: Chinese noodles were assigned the GI of instant noodles; Japanese-style pancakes were assigned the GI of pizza; jellies were assigned the GI of pudding; lotus roots were assigned the GI of carrots; vegetable juice was assigned the mean value of the GI of tomato juice and apple juice; curry and roux in stew were assigned the GI of white rice with curry; nutritional supplement drinks were assigned the GI of sports drinks; nutritional supplement bars were assigned the GI of a sports bar; ground fish-meat products and boiled fish and shellfish in soya sauce were assigned the GI of fish fingers.
Although alcoholic beverages contain little carbohydrate, large quantities of several alcoholic beverages, such as beer and sake, may raise glucose concentrations slightly. Unfortunately, however, the GI values of alcoholic beverages have not been establishedReference Ma, Olendzki, Chiriboga, Hebert, Li, Li, Campbell, Gendreau and Ockene10, Reference Murakami, Sasaki, Takahashi, Okubo, Hosoi, Horiguchi, Oguma and Kayama11, and these items were thus ignored in the calculation of dietary GI and GLReference Hodge, English, O'Dea and Giles4, Reference Ma, Olendzki, Chiriboga, Hebert, Li, Li, Campbell, Gendreau and Ockene10, Reference Murakami, Sasaki, Takahashi, Okubo, Hosoi, Horiguchi, Oguma and Kayama11. Further, foods with very low available carbohydrate content were excluded from calculation because their GI values cannot be tested. The cut-off for exclusion of foods was set at 3·5 g available carbohydrate per mean serving in the DR and per standard serving in the DHQReference Ma, Olendzki, Chiriboga, Hebert, Li, Li, Campbell, Gendreau and Ockene10, Reference Murakami, Sasaki, Takahashi, Okubo, Hosoi, Horiguchi, Oguma and Kayama11.
Of the total 1299 food and beverage items reported in the DR, twenty (1·5 %) were alcoholic beverages, 117 (9·0 %) contained no available carbohydrate and 759 (58·4 %) contained < 3·5 g available carbohydrate per mean serving. Calculation of dietary GI and GL in the DR was thus based on the remaining 403 items. Of the total 150 food and beverage items included in the DHQ, six (4·0 %) were alcoholic beverages, nine (6·0 %) contained no available carbohydrate and sixty-three (42·0 %) contained < 3·5 g available carbohydrate per mean serving, and calculation was similarly based on the remaining seventy-two items. A table of the GI value of each item in the DHQ has been published elsewhereReference Ma, Olendzki, Chiriboga, Hebert, Li, Li, Campbell, Gendreau and Ockene10; the GI value of ice cream was 61 for the regular type, 38 for the premium (high-fat) type and 50 for unspecified varieties. In the present study, the mean contribution of the available carbohydrate content of the foods used in the calculation of dietary GI and GL to total available carbohydrate intake was 89·0 (sd 2·8) % for women and 88·0 (sd 4·3) % for men in the DR, and 93·2 (sd 2·3) % for women and 91·8 (sd 4·2) % for men in the DHQ, which were comparable with previous studies (91–96 %)Reference Ma, Olendzki, Chiriboga, Hebert, Li, Li, Campbell, Gendreau and Ockene10, Reference Murakami, Sasaki, Takahashi, Okubo, Hosoi, Horiguchi, Oguma and Kayama11, Reference Amano, Kawakubo, Lee, Tang, Sugiyama and Mori16, Reference Murakami, Sasaki, Okubo, Takahashi, Hosoi and Itabashi17, Reference Nielsen, Bjornsbo, Tetens and Heitmann32, Reference Ma, Li, Chiriboga, Olendzki, Hebert, Li, Leung, Hafner and Ockene33.
Statistical analysis
All statistical analyses were performed for women and men separately using SAS statistical software version 8.2 (SAS Institute Inc., Cary, NC, USA). The reproducibility and relative validity of available carbohydrate intake and dietary GI and GL derived from the DHQ were examined using energy-adjusted values by the residual and density modelsReference Willett34 as well as crude values. Dietary GI adjusted using the density model was not used owing to its strong correlation with energy intake (Pearson correlation coefficients − 0·93 to − 0·94). Distributions of these dietary variables were evaluated for deviations from normality; because none of the variables was strongly skewed, reproducibility and relative validity were evaluated using untransformed values. Mean and sd values for available carbohydrate intake and dietary GI and GL were calculated for both the DR and DHQ. To assess seasonal variation in these dietary variables, intraclass correlations were calculated using DR (DR1, DR2, DR3 and DR4) and DHQ (DHQ1, DHQ2, DHQ3 and DHQ4) conducted in each season over a 1-year period. Intraclass correlations were calculated between DHQ completed in the same season about 1 year apart (DHQ1 and DHQ5) to assess reproducibility.
To assess the relative validity of the DHQ, Pearson correlations between the mean of DR1–4 and mean of DHQ1–4 were calculated. Pearson correlations were also calculated between the mean of DR1–4 and DHQ1 to examine whether the DHQ (assessing dietary habits during the preceding 1 month) can capture habitual dietary GI and GL over a longer period (i.e. 1 year). We used DHQ1 for this purpose because the answers provided in other DHQ (administered after the experience of conducting DR), but not DHQ1 (administered before the experience), may have been influenced by the attention to diet required to complete the DR. Since random within-individual error in the measurement of any of the variables being compared tends to reduce correlation coefficients toward zeroReference Beaton, Milner and Corey35, correlations with the corrections for the attenuating effects of such measurement error in the 4 × 4 d DR were computed. Correction of correlations for random within-individual error was based on the formula r t = r 0 √(1+λ/n), where r t is the true (corrected) correlation of dietary intakes derived from the DHQ and DR, r 0 is the observed correlation of dietary intakes derived from the DHQ and DR, λ is the ratio of the within- to between-individual variances in 4 × 4 d dietary variables, and n is the number of replicates per individual. For the present study, n is 4, denoting the four 4 d DR. Additionally, we calculated the percentage of subjects who were classified in the same, adjacent or opposite quintile of dietary variables in the two different assessment methods.
The percentage contribution of each individual food to dietary GI (and hence GL) for both assessment methods was calculated by dividing the product of the contribution of each individual food to daily available carbohydrate intake and the food's GI value by dietary GI (multiplied by 100):
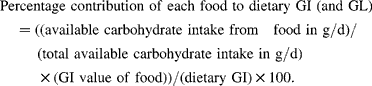
The percentage contribution of each food group was then calculated.
Results
Characteristics of subjects are shown in Table 1. Mean energy intake estimated from DHQ1–4 was similar to that estimated from DR1–4. As shown in Tables 2 (for DR) and 3 (for DHQ), available carbohydrate intake and dietary GI and GL were calculated from both assessment methods conducted in each season over 1 year (DR1, DR2, DR3 and DR4 and DHQ1, DHQ2, DHQ3 and DHQ4) for assessing seasonal variations in these dietary variables. Both energy-adjusted values by the residual method and energy-adjusted values by the density method as well as crude values are presented, except for dietary GI adjusted using the density model because of its strong correlation with energy intake (Pearson correlation coefficients − 0·93 to − 0·94). Energy adjustment reduced the variability in available carbohydrate intake and dietary GL, but not dietary GI. Mean differences were within 6 % for DR and 5 % for DHQ, and intraclass correlations for energy-adjusted values ranged from 0·40 to 0·68 for DR and from 0·57 to 0·74 for DHQ. To assess the reproducibility of available carbohydrate intake and dietary GI and GL assessed by DHQ, the intraclass correlations between DHQ completed 1 year apart (DHQ1 and DHQ5) were calculated (Table 3). The reproducibility correlations for energy-adjusted values ranged from 0·57 to 0·72.
(Mean values and standard deviations)

* Mean values of 4 d semi-weighed dietary records were conducted in each season during 1 year (i.e. in November and December 2002 (autumn), February 2003 (winter), May 2003 (spring) and August and September 2003 (summer)).
† Mean values of self-administered diet-history questionnaires (assessing dietary habits during the preceding month) were conducted in each season during 1 year (i.e. in November 2002 (autumn), February 2003 (winter), May 2003 (spring) and August and September 2003 (summer)). In each season, the diet-history questionnaire was answered before the start of the dietary recording period.
(Mean values and standard deviations and intraclass correlations)

* Conducted in November and December 2002 (autumn).
† Conducted in February 2003 (winter).
‡ Conducted in May 2003 (spring).
§ Conducted in August and September 2003 (summer).
‖ Calculated as total carbohydrate minus total dietary fibre.
¶ Glycaemic index for glucose = 100.
** The density model was not used because of a high correlation with energy intake (Pearson r − 0·93 to − 0·94).
(Mean values and standard deviations and intraclass correlations)

* The DHQ is designed to assess dietary habits during the preceding month.
† Conducted in November 2002 (autumn).
‡ Conducted in February 2003 (winter).
§ Conducted in May 2003 (spring).
‖ Conducted in August and September 2003 (summer).
¶ Conducted in November 2003 (autumn).
** Calculated as total carbohydrate minus total dietary fibre.
†† Glycaemic index for glucose = 100.
‡‡ The density model was not used because of a high correlation with energy intake (Pearson r − 0·93 to − 0·94).
The relative validity of available carbohydrate intake and dietary GI and GL estimated from DHQ was assessed by comparing those derived from DHQ1–4 with those derived from DR1–4 (Table 4). Mean differences between DR1–4 and DHQ1–4 were within 7 %. The Pearson correlations between DR1–4 and DHQ1–4 ranged from 0·64 to 0·74 for energy-adjusted values. The percentage of subjects categorised into the same or adjacent quintiles using energy-adjusted values was >75 %, while the percentage categorised into the opposite quintile was ≤ 1 %. Comparison of the first DHQ (DHQ1) with DR1–4 was also conducted to examine whether the DHQ (assessing dietary habits during the preceding month) can capture habitual dietary GI and GL over a longer period (i.e. 1 year) (Table 4). Mean differences between DR1–4 and DHQ1 were within 8 %, while Pearson correlations ranged from 0·53 to 0·63 for energy-adjusted values, the percentage of subjects categorised to the same or adjacent quintiles using energy-adjusted values was >70 % and the percentage categorised to the opposite quintile was ≤ 2 %.
(Mean values and standard deviations and Pearson correlations)

* Conducted in November and December 2002 (autumn), February 2003 (winter), May 2003 (spring) and August and September 2003 (summer).
† The DHQ is designed to assess dietary habits during the preceding month. In each season, the DHQ was answered before the start of the dietary recording period.
‡ Conducted in November 2002 (autumn), February 2003 (winter), May 2003 (spring) and August and September 2003 (summer).
§ Corrected for seasonal variation in DR.
‖ Calculated as total carbohydrate minus total dietary libre.
¶ Glycaemic index for glucose = 100.
** The density model was not used because of a high correlation with energy intake (Pearson r − 0·93 to − 0·94).
White rice was the major contributor to dietary GI and GL in both assessment methods (49–64 %) (Table 5). Other relatively important contributors included brown rice and other grains (1–6 %), noodles (5–6 %), bread (6–9 %), confectioneries (5–13 %), sugar (4–6 %) and fruits (3–5 %).
(Mean values and standard deviations)

* Food items are listed in descending order of their mean contribution to dietary glycaemic index and load in DR among women.
† Conducted in November and December 2002 (autumn), February 2003 (winter), May 2003 (spring) and August and September 2003 (summer).
‡ The DHQ is designed to assess dietary habits during the preceding month. In each season, the DHQ was answered before the start of the dietary recording period.
§ Conducted in November 2002 (autumn), February 2003 (winter), May 2003 (spring) and August and September 2003 (summer).
‖ Including pickled vegetables, seaweeds and mushrooms.
¶ Including nuts.
Discussion
The present study of ninety-two Japanese women and ninety-two Japanese men showed reasonable reproducibility and relative validity of dietary GI and GL assessed by a DHQ for Japanese adults, whose dietary GI and GL were primarily determined by the GI of white rice. Although numerous epidemiological studies have examined dietary GI and GL estimated using dietary assessment questionnaires in relation to various health outcomesReference Salmeron, Ascherio, Rimm, Colditz, Spiegelman, Jenkins, Stampfer, Wing and Willett2, Reference Hodge, English, O'Dea and Giles4–Reference Murakami, Sasaki, Takahashi, Okubo, Hosoi, Horiguchi, Oguma and Kayama11, only one previous study of 141 Swedish men has investigated the reproducibility and relative validity of dietary GI and GL estimated from a dietary questionnaireReference Levitan, Westgren, Liu and Wolk12. Regarding reproducibility, intraclass correlations between two FFQ completed 1 year apart ranged from 0·61 to 0·66 in this Swedish studyReference Levitan, Westgren, Liu and Wolk12. These reproducibility correlations are comparable with those observed in the present study. Regarding relative validity, Pearson correlations between the mean of two 7 d DR and that of two FFQ ranged from 0·62 to 0·77, and the percentage of subjects classified in the same or an adjacent quintile was relatively high (70–79 %) while that classified into the opposite quintile was low (0–2 %)Reference Levitan, Westgren, Liu and Wolk12. These findings on relative validity are again comparable with the present results despite the fact that in the Swedish study, portion sizes derived from DR used as a gold standard were also used during the calculation of dietary GI and GL from FFQ, resulting in overestimation of the ability of the FFQReference Levitan, Westgren, Liu and Wolk12. Additionally, one administration of our DHQ (assessing dietary habits during the preceding month) seemed to relatively accurately capture habitual dietary GI and GL over a longer period (i.e. 1 year), seemingly due to relatively small seasonal variations in dietary GI and GL. To our knowledge, the present study is the first to examine the reproducibility and relative validity of dietary GI and GL estimated from dietary questionnaires in women or in Asian populations.
In the present Japanese study, 49–64 % of dietary GI and GL was derived from white rice. This finding is consistent with previous studies in Asia (41–59 %), where white rice is consumed as a staple foodReference Murakami, Sasaki, Takahashi, Okubo, Hosoi, Horiguchi, Oguma and Kayama11, Reference Murakami, Sasaki, Okubo, Takahashi, Hosoi and Itabashi17, Reference Hui and Nelson36, but contrasts with those from Western studies, where dietary GI and GL are determined by a variety of foods including potatoes (7–8 %), breakfast cereals (4–7 %), bread (5 %), rice (5 %) and orange juice (5 %)Reference Liu, Willett, Stampfer, Hu, Franz, Sampson, Hennekens and Manson5, Reference Jonas, McCullough, Teras, Walker-Thurmond, Thun and Calle6, Reference Liu, Manson, Buring, Stampfer, Willett and Ridker9, Reference Liu and Willett37. The quite large contribution of white rice may account for our relatively accurate estimate of dietary GI and GL from the DHQ, because white rice is a staple food in Japan and, because it is consumed regularly and in relatively fixed amounts, is believed to be more accurately reported than other foods in the DHQ.
The validity of dietary GI and GL derived from the DHQ is indirectly supported by our previous findings of both a positive association between dietary GI and GL and fasting TAG concentrations and a negative association between dietary GL and HDL-cholesterol concentrations in Japanese womenReference Murakami, Sasaki, Takahashi, Okubo, Hosoi, Horiguchi, Oguma and Kayama11. Two other FFQ have provided estimates of dietary GI and GL, and showed them to be associated with fasting TAG and HDL-cholesterol concentrations in the expected directionsReference Liese, Gilliard, Schulz, D'Agostino and Wolever7, Reference Liu, Manson, Stampfer, Holmes, Hu, Hankinson and Willett8, although the relative validity of dietary GI and GL derived from these FFQ have not been reported.
Several limitations of the present study should be mentioned. First, we used DR as a gold standard, but DR are also susceptible to measurement error due to erroneous recording and potential changes in eating behaviourReference Willett34. However, errors in DR are thought to have lesser correlation with errors in DHQ than are errors in 24 h dietary recall or other instruments that rely on memoryReference Willett34. Second, concerns have been expressed regarding the utility of GI in mixed mealsReference Coulston, Hollenbeck, Swislocki and Reaven38, Reference Hollenbeck and Coulston39. However, many researchers have shown that the GI of a mixed meal can be predicted consistently as the mean of the GI values of each of the component foods, weighted according to their relative contribution to carbohydrate intakeReference Wolever and Jenkins40–Reference Wolever, Jenkins, Jenkins and Josse42. In fact, studies using standardised techniques have observed high correlations between observed and calculated GI values, ranging from 0·84 to 0·99Reference Wolever and Jenkins40–Reference Wolever, Jenkins, Jenkins and Josse42. Third, GI measurements are currently limited to a fairly small number of foods, and for some of these foods, the measurements were performed in a small number of individualsReference Foster-Powell, Holt and Brand-Miller3. Errors in the GI values for foods will be shared by the DR and DHQ and may increase the observed correlations. Also, the formulations of packaged foods and the varieties of fruits and vegetables can vary across countries, and the GI values could be rather different in Japan and other countries. In the present study, only 136 of 403 GI values in DR (34 %) and twenty-one of seventy-two GI values in DHQ (29 %) were derived from Japanese version of foods. Further information on GI values of Japanese foods is undoubtedly needed. Fourth, due to the limited amount of information on GI values as mentioned above, we had to assign several foods the GI value of the nearest comparable food in both the DR (37 %) and DHQ (14 %). This strategy is at present the only feasible epidemiological approach when the GI value for a food is unavailable. Finally, the generalisability of the present results may be limited because our subjects were not a representative sample of general Japanese but rather volunteers, and thus possibly health-conscious. Despite the growing interest in dietary GI and GL as markers of disease risk factors, only two dietary questionnaires (including our DHQ) have been validated against DR for dietary GI and GL. Additional validation studies of other dietary questionnaires would add valuable information on this topic.
In conclusion, our data indicated the reasonable reproducibility and relative validity of dietary GI and GL estimated from a DHQ for Japanese adults, whose dietary GI and GL are primarily determined on the basis of the GI of white rice. Along with our previous findings of expected associations between dietary GI and GL and fasting TAG and between dietary GL and HDL-cholesterol using a DHQReference Murakami, Sasaki, Takahashi, Okubo, Hosoi, Horiguchi, Oguma and Kayama11, the present findings may lend support to the potential use of dietary questionnaires in studying the relationship between dietary GI and GL and health in epidemiological studies of Asian individuals, who eat rice as a staple food.



