

Introduction
A number of glaciers are known to exhibit periods of strongly enhanced surface velocities lasting for a few days (Reference IkenIken, 1978; Reference Harrison, Raymond and MacKeithHarrison and others, 1986; Reference Raymond and MaloneRaymond and Malone, 1986; Reference Kamb and EngelhardtKamb and Engelhardt, 1987; Reference Jansson and HookeJansson and Hooke, 1989; Reference JanssonJansson, 1995; Reference WillisWillis, 1995; Reference Hanson, LeB Hooke and GraceHanson and others, 1998). On Unteraargletscher, Bernese Alps, Switzerland, a number of such short-term speed-up events have been observed using various surveying techniques (Reference FlotronFlotron, 1973; Reference Iken, Rothlisberger, Flotron and HaeberliIken and others, 1983; Reference GudmundssonGudmundsson, 1996). These speed-up events seem to be characterized by an increase in surface velocities by at least a factor of two and a concomitant surface uplift of a few decimeters. The uplift is thought to be caused largely by an increase in water storage at the glacier bed (Reference Iken, Rothlisberger, Flotron and HaeberliIken and others, 1983). Measurements of vertical and horizontal strain have shown that temporal variations in the strain-rate regime may also contribute to the observed surface uplift (Reference GudmundssonGudmundsson, 1996).
Surface displacement measurements with a time resolution of a few hours are needed to detect short-term speedup events. Because of logistical and technical difficulties, on Unteraargletscher such measurements have so far been limited to time periods of up to a few weeks, with usually only three or four stakes being measured simultaneously. It has therefore not been possible to determine the frequency of occurrence of these events, or the size of the area of glacier which is activated during such an event.
In order to obtain a better estimate of the spatial extent and the temporal frequency of the speed-up events on Unteraargletscher, a programmable motorized theodolite was installed during summer 1998. This operated fully automatically and unattended for a period of about 4 months (26 June-28 October). Positions of some 30 stakes drilled into the glacier surface were surveyed up to eight times a day. On average, the frequency of measurements of individual stakes was, however, considerably lower, or two to four times a day. The purpose of this paper is to present and discuss these data. We use these data to answer a number of questions related to the spatial and temporal distribution of the speed-up events on Unteraargletscher. Furthermore, we analyze how the flow regime over time-scales of weeks and months is affected by these short-term events.
Field Measurements
In June 1998 a programmable motorized theodolite (Leica TM1800) combined with a distancer (DI3000S) was installed at the ˚Abschwung" overlooking the glacier where Finsteraar- and Lauteraargletscher merge and form Unteraargletscher (star, Fig. 1). The theodolite was connected to a notebook computer, and its operations were controlled from the computer using the Leica APSWin software. Data were stored on the computer and collected at convenience. Solar panels were used for power generation.
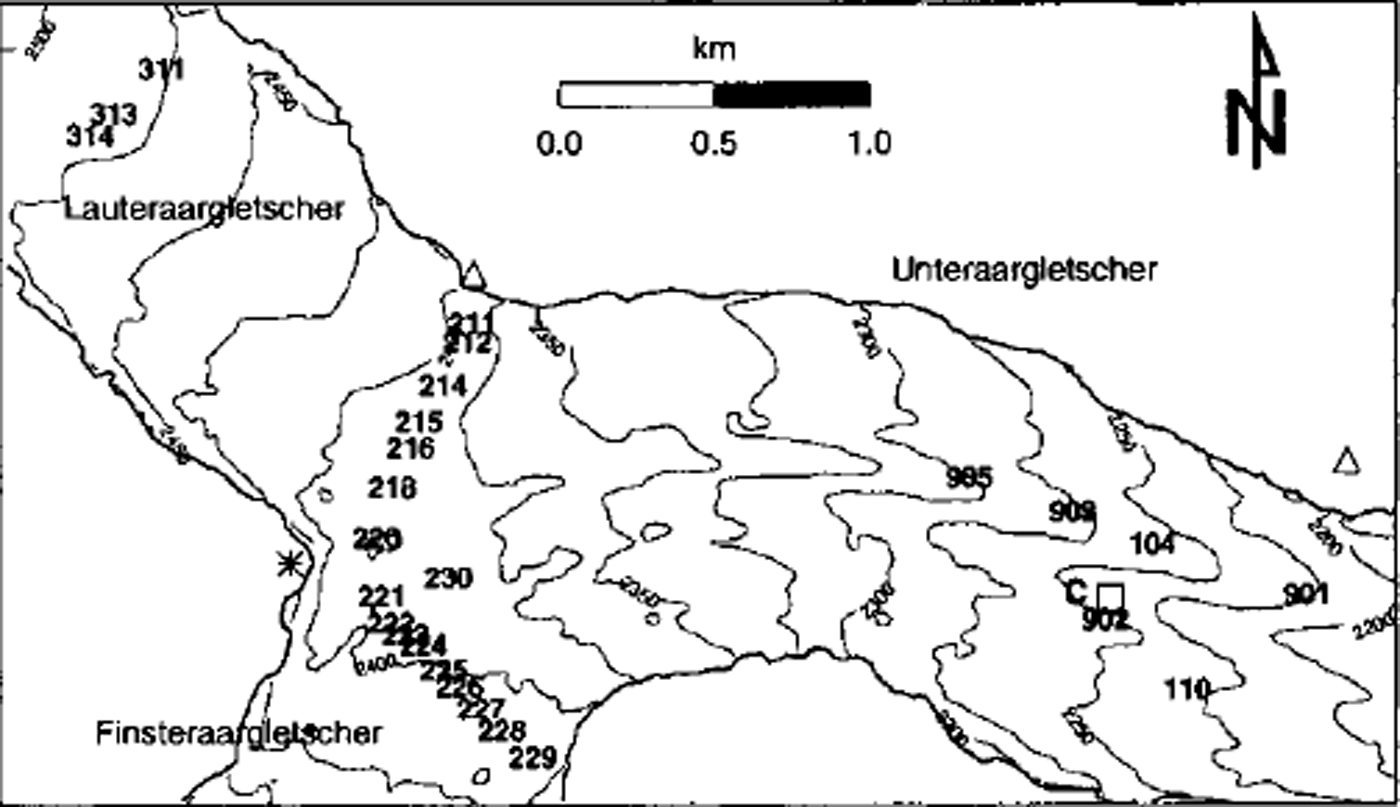
Map of Unteraargletscher showing the location of stakes (three-digit numerical labels), automatic theodolite (star), reference marker sites (triangles) and drilling site C (square). The surface topography (contours in ma.s.l) is dominated by the medial moraine. The overall glacier flow direction is from left to right.
About 30 6.5 m long aluminum stakes were drilled into the surface of the glacier (Fig. 1). A reflector was permanently attached to each of these stakes. The distancer emits an infrared laser signal which is reflected by the reflectors. The horizontal and vertical angles are then estimated from the angular distribution of the strength of the reflected signal. It is thus on the basis of the signal from the distancer that both the distance to the stakes and the horizontal and vertical angles are determined. Since this is an active system, measurements can be conducted during the day and night.
For various reasons, not all stakes could be monitored throughout the whole measurement period. During the summer some stakes would melt out and had to be reset. Sometimes a stake would rotate around its axis, so no reflected signal could be detected by the distancer.
Figure 1 shows the spatial distribution of the stakes monitored during summer 1998 (three-digit numbers). Most of the stakes were situated at the confluence area. Stakes 211 220 and stakes 220–229 formed two transverse profiles across Lauteraar- and Finsteraargletscher, respectively. In addition, three stakes (311, 313 and 314) were located further up-glacier on Lauteraargletscher. Six stakes were situated on the medial moraine of Unteraargletscher (901, 104, 903, 905) and somewhat to the south of it (110, 902). Each stake plus two reference reflectors (triangles, Fig. 1) were surveyed at every measurement cycle. About eight such measurement cycles were attempted every day. For each cycle, the orientation of the theodolite was determined anew on the basis of the measurements of the reference reflectors. The distance measurements were also corrected in a similar manner. By surveying the reference reflectors at each measurement cycle, the effects of temporal changes in atmospheric conditions could be accounted for without having to measure air temperature and atmospheric pressure.
The accuracy of the measurements was estimated in a number of different ways. The different coordinates calculated using both or only one of the reference reflectors were, for example, compared. A detailed account of the error analysis can be found in Reference BassiBassi (1999). The estimated error in corrected distance towards the stakes is 0.25 cm. The raw distance data contained diurnal variations with an amplitude of about 0.5 cm. These temporal variations were essentially absent in the corrected data.
The horizontal and vertical angles could be determined with an accuracy of ± 2 and ± 3 mgon, respectively. This is considerably poorer than the stated accuracy of the theodolite, which is 0.3 mgon. The poor angle accuracy reflects the limitations of the tracking method which is based on the angular distribution of the reflected signal. For the distances measured, these errors in angles translate into positional errors of about ± 3 cm in the horizontal plane transverse to the line-of-sight and about ± 5 cm in height. The accuracy is thus sufficient for detecting temporal changes in horizontal speed during a speed-up event, but not for detecting a possible concomitant surface uplift.
Analysis
Displacement curves
Figure 2 shows four typical examples of horizontal changes in stake positions as a function of time with respect to initially surveyed stake locations. If a stake had to be reset, a new initial position was defined. Each symbol (diamonds) represents one measurement. For clarity and plotting purposes an arbitrary trend line has been removed from the data. This sometimes results in negative slopes of the distance curves, although the actual distance to initial stake location always increased with time.
Four typical examples of measured temporal changes in (horizontal) stake positions. The locations of these four stakes on the glacier surface can be seen in Figure 1. Symbols (diamonds) represent individual measurements. From each of the four displacement curves a trend line (different for each figure) has been removed in order to make sudden temporal changes more evident. Dashed vertical lines mark the beginning and the end of short-term speed-up events. Dashed-dotted vertical lines indicate when the corresponding stake was reset. Regression lines for different time periods and corresponding 99 % confidence intervals are depicted as solid lines.
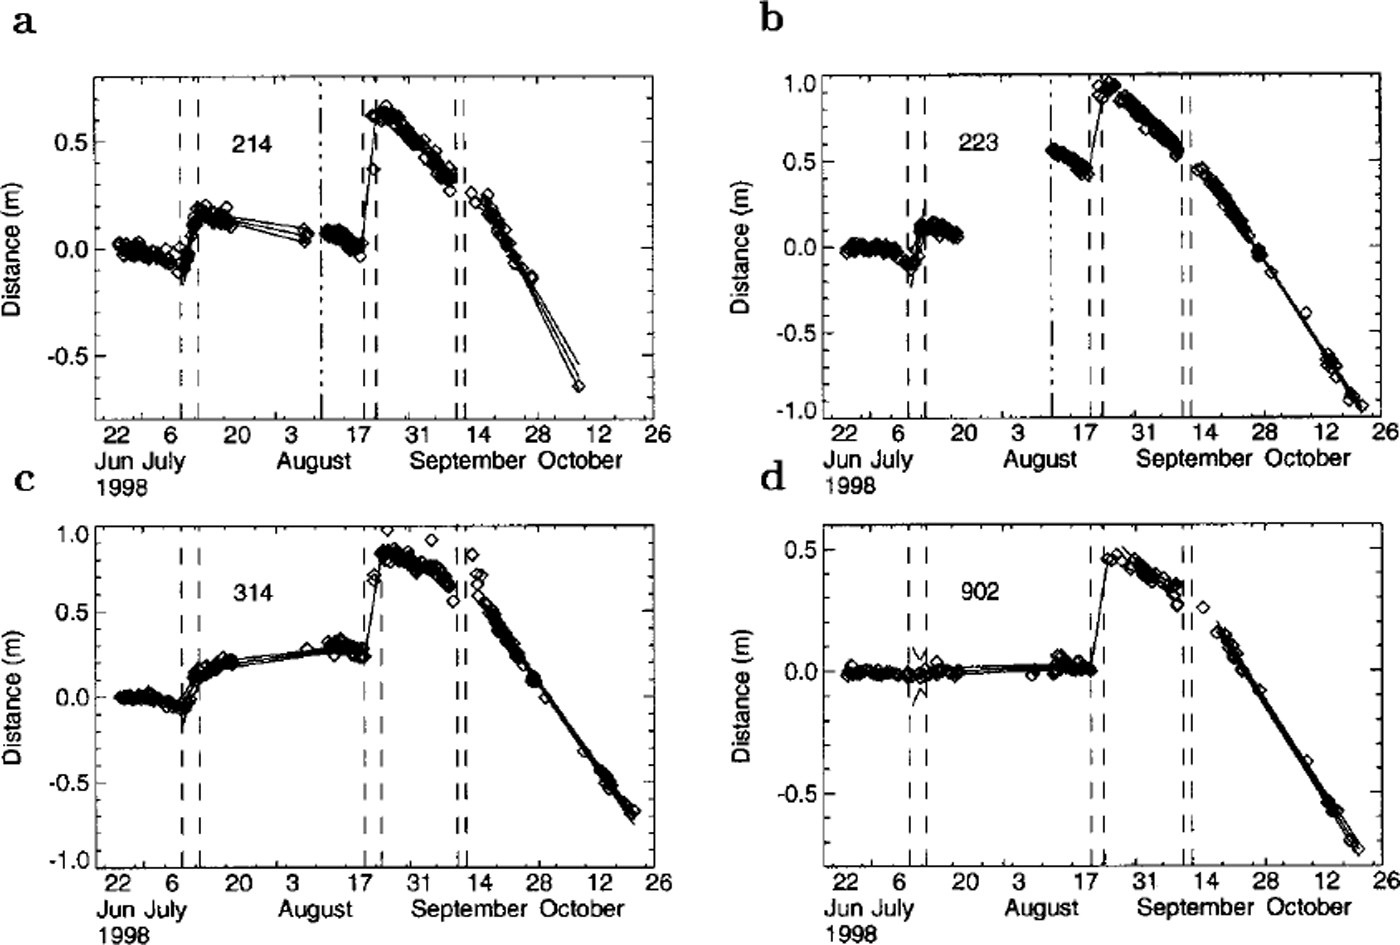
Figure 2a-d display a number of interesting common features. These features can also be seen in the corresponding displacements curves of most of the other surveyed stakes (not shown). Two time periods of large increases in displacement with time can be identified. The first time period starts on 10 July and ends on 14 July. The second period lasts from 21 to 24 August. The July speed-up event is not seen in the data from all stakes (e.g. Fig. 2d). There are gaps in the measurement series of almost all stakes during the August speedup event. This event can nevertheless be unambiguously identified by comparing the displacement shifts of the stakes during this time period with typical stake velocities before and after this event. There is also an indication of a further possible speed-up event taking place in the time period 12–14 September. These three time periods of enhanced glacier motion are marked by vertical dashed lines in the figure. No diurnal velocity variations are seen in the data. Such variations have also not been seen in much more precise global positioning system (GPS) measurements conducted previously on the glacier Reference MeinckMeinck (1998). There are large gaps in the measurement series of most stakes during the speed-up event in August, as well as during the possible event in September. Both of these gaps were caused by insufficient power production by the solar panels. As discussed later, these were periods of heavy rainfall.
Between speed-up events, surface velocities appear to be quite constant. Comparing the mean slopes of the curves in Figure 2 before and after a speed-up event, it also appears that after a speed-up event the surface velocities do not always return to their previous values. In order to determine if these changes in the slopes of the distance curves as functions of time are significant, the distance curves were, for each time interval between two speed-up events, approximated by straight lines (Fig. 2). The confidence intervals and the slope errors were estimated using linear regression methods. This was also done with the data obtained during speed-up events for those stakes where five or more measurements were available.
Stake speeds
Figure 3 shows estimated horizontal stake speeds for a number of different time periods. These stake speeds are calculated from the slopes of the regression lines such as those seen in Figure 2. For the time period 23 August 1996 to 15 August 1997, speeds were derived from aerial photographs. Figure 3a gives stake speeds along a transverse profile across Lauteraargletscher (Fig. 1), Figure 3b stake speeds along a corresponding transverse profile across Finsteraargletscher, and Figure 3c stake speeds along a roughly longitudinal profile that extends down-glacier from the uppermost stakes on Lauteraargletscher towards the lowermost stakes on Unteraargletscher.
Velocities of stakes laid out in transverse profiles across (a) Lauteraargletscher and (b) Finsteraargletscher and (c) a longitudinal profile along the medial moraine of Unteraargletscher. The positions of the stakes can be seen in Figure 1. For each stake the average velocities for every time interval are calculated from regression lines such as those seen in Figure 2 The error bars (vertical lines) correspond to a 99% confidence interval. The positions of the glacier margins along the transverse profiles in (a) and (b) are depicted as black bars. Individual velocity estimates for each time period are connected by straight lines. The velocity profiles during the speed-up events of 10–14 July and 21–24 August are shown as dashed curves. The velocities during the speed-up event in September could not be determined accurately.

Figure 3 reveals that stake speeds are generally significantly different for the time periods before and after a short-term speed-up event. This is particularly clear for the speedup events in August and September, but less so for the event in July. By comparing, for example, the positions of the crosses and the triangles for each stake in the figure, it can be seen that velocities during the time period 14 July-21 August are consistently higher than during the period from 28 August-12 September. At all stakes the smallest speeds are observed after the September event. The speeds over this time period are also considerably smaller than the average annual speeds of the year before. We speculate that the stake speeds after the September event may reflect the winter speeds, and that the transition to the winter state is thus not gradual but very abrupt.
Average stake speeds during the short-term speed-up events (square and star symbols connected by dashed lines in Figure 3) are a factor of 2–5 times larger than those during other time periods. The speed estimates, in particular for the July event, are less accurate than for the ˚normal-time periods. This is in part because of the small number of measurements made during these events, which makes it necessary to define average speeds for these time periods, whereas in reality the velocities may have varied substantially with time (Reference GudmundssonGudmundsson, 1996; Reference MeinckMeinck, 1998), and in part because of the difficulty of accurately defining the beginning and the end of the acceleration periods. The velocity profiles for the time periods (dashed lines in Fig. 3) thus serve only as a rough indication of speeds during the short-term speed-up events when compared with the more ˚normal" states of the velocity regime (solid lines in Fig. 3).
Spatial distribution and propagation of events
From Figure 3c it can be seen that the July event is observed at the stakes on Lauteraargletscher (313, 314), at those in the confluence area (Fig. 3a and b), as well as at stakes 903 and 905 on Unteraargletscher (Fig. 3c). However, at stake 104 and the ones down-glacier (110 and 901), this speed-up event is not observed. A slight increase in surface speed is seen at stake 902.
The speed-up event in August is apparent at all stakes. The increase in speed relative to the previous and subsequent time periods is, however, smaller for the lowermost stakes on Unteraargletscher than for the stakes located in the confluence area and on Lauteraargletscher. Because of the lack of data, the spatial distribution of the possible speed-up event in September cannot be determined.
No propagation of events up- or down-glacier can be seen from the data. We estimate that the time resolution and the accuracy of the measurements do not allow a time difference of ≤ l dσy between the initiation of the motion events at different stakes to be detected. This sets a lower limit on possible propagation speeds of about 125 mh–1. Time shifts of a few hours over a distance of about 700 m were detected on Unteraargletscher in spring 1996 and 1998 using GPS measurements. Propagation speeds were estimated to be around 110 m h–1. The motion event did not propagate as a shape-conserving wave, however (Reference GudmundssonGudmundsson, 1996). Propagation speeds of >200 m h–16 have been observed on a number of different glaciers (Reference WillisWillis, 1995). The accuracy and the time resolution of the theodolite data are not high enough to detect such speeds
Water-pressure measurements
On 23 July 1998, a water-pressure transducer was installed in a hole at site C, on Unteraargletscher (square, Fig. 1). The pressure transducer was located about 170 m above the glacier bed. It was connected to a data logger with readings taken every 5 mm. Figure 4 shows the distance from bed to water table in that borehole as a function of time. There is a slow, almost linear decrease in water level with time. Superimposed on this general trend are diurnal fluctuations in water level, with a peak-to-peak amplitude of about 0.8 m. The most conspicuous feature of Figure 4 is the drastic decrease of about 60 m in measured water level within the borehole on 24 August. A few other, much smaller, drops in water level are seen. One of these, a drop of about 9 m, coincides with the possible September motion event.
Water pressure measured at location C (square in Fig. 1). Ice thickness is about 300 m at this site. Dashed vertical lines indicate the beginning and the end of the speed-up events in August and September 1998.
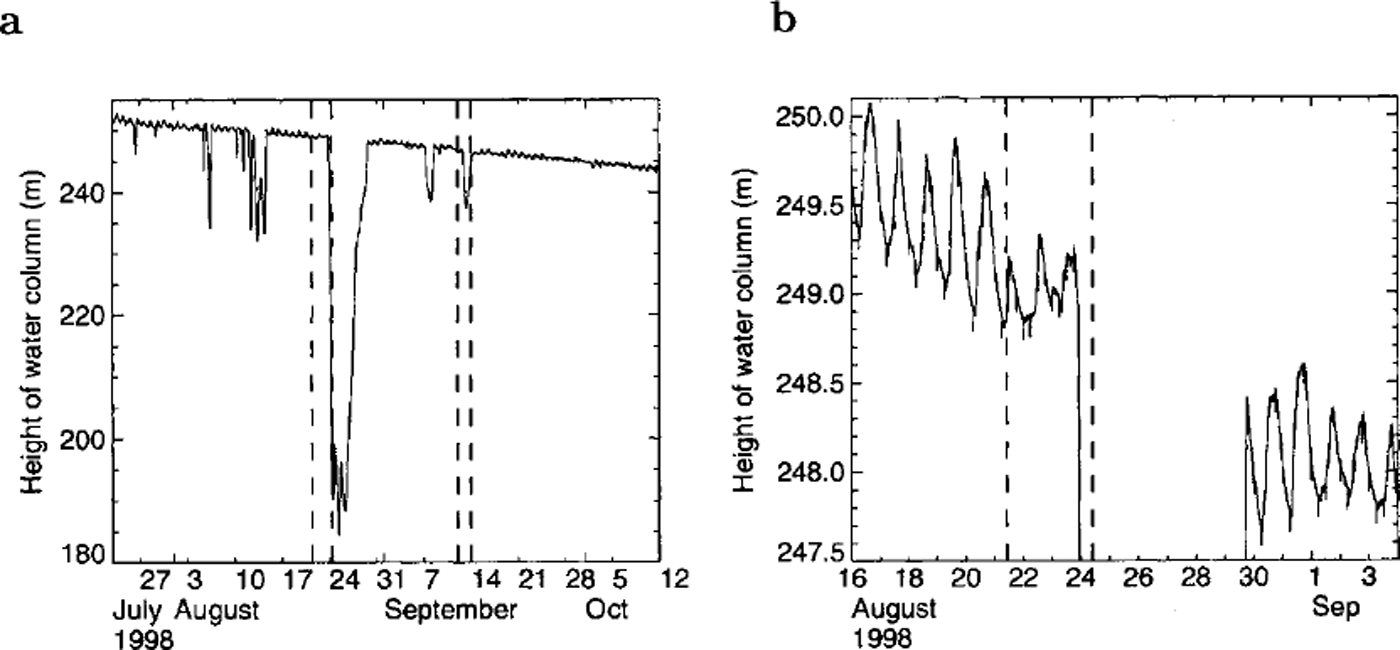
The dramatic drop in water level of about 60 m starts around midnight on 24 August. At around noon on 26 August the water level starts to rise again, and reaches its previous value (taking into account the slope of the trend line) in the early afternoon of 29 August. The start of the drop in measured water level coincides, within the time resolution of the theodolite measurements, with the end of the August motion event. No similarly striking increase in water pressure is observed during the speed-up event as one might have expected. The water-level variation in the borehole is nevertheless unusual during the motion event as compared to the previous and subsequent time periods. The amplitudes of the diurnal water-level fluctuations are reduced by a factor of two during the event, and the longterm trend of gradual water-level lowering is suddenly reversed (Fig. 4b). There is thus an increase in water pressures observed during the motion event, albeit a small one.
There are no further measurements of water pressures available from other sites. From measurements of subglacial water pressures conducted on a number of different glaciers, it is known that water levels in nearby boreholes may react quite differently to subglacial events (Reference Murray and ClarkeMurray and Clarke, 1995). One should therefore be cautious in drawing conclusions about subglacial water-pressure variations from measurements at a single site. It is, for example, possible that subglacial water pressures in cavities at bed may have varied much more widely during the August motion event than the pressure data from site C suggest.
Correlation with surficial water input
Short-term motion events are generally considered to be caused by exceptionally high subglacial water pressures. These high water pressures may, in turn, be the result of various factors such as high rates of water input from the surface, collapse or some sort of reorganization of the subglacial drainage system, release of englacial water pockets, or sudden drainage of supraglacial lakes (Reference Iken, Rothlisberger, Flotron and HaeberliIken and others, 1983; Reference Naruse, Fukami and AniyaNaruse and others, 1992; Reference Raymond, Benedict, Harrison, Echelmeyer and SturmRaymond and others, 1995; Reference WillisWillis, 1995; Reference Hanson, LeB Hooke and GraceHanson and others, 1998).
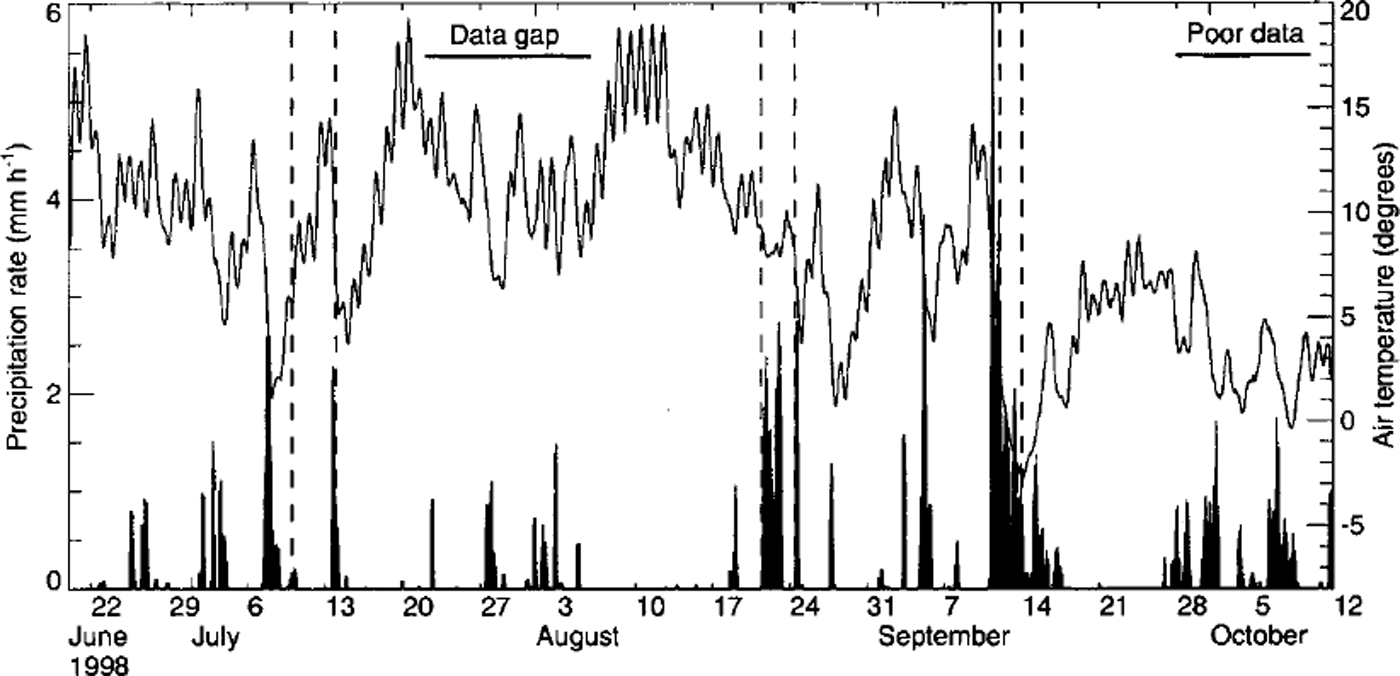
The apparently contemporaneous increase in surface velocities at all stakes, together with the large size of the area which became activated during the motion events, suggests an external trigger mechanism, such as a sudden increase in water input from surface melt or rainfall. Further support for an external trigger mechanism comes from precipitation records. Precipitation and surface melting were not measured on the glacier during summer 1998. However, records of precipitation and air temperatures are available from a nearby weather station (Fig. 5). The August and September speedup events both coincided with periods of large precipitation. There was almost no rainfall during the July event (10–14 July), but it was preceded by a period of strong rainfall which started around noon on 7 July and continued until noon on 10 July. The July event also coincided with a period of high air temperatures. The September motion event occurred simultaneously with the first snowfall of the autumn, which started on the afternoon of 12 September. Although the snow disappeared within a few days, this day presumably marks the end of the melt season.
Six hours running means of precipitation (bars), and hourly temperature values (solid line). Measurements are from a site about 10 km east of the glacier snout. Extended time periods with no or poor surveying data are indicated by horizontal lines. Pairs of vertical dashed lines give the duration of short-term speed-up events.
Conclusions
Through automated surveying, two short-term speed-up events were observed on Unteraargletscher in the time period from latejune until late October 1998. The first event took place on 10–14 July and the second one on 21–24 August. In addition, a possible third event took place in September. Previously that year (12–18 May), one such motion event had been observed at site C (Fig. 1) by GPS measurements. These events are thus not limited to the beginning of the melt period or early summer. All events lasted for a few days, with a several-fold increase in surface velocities, in agreement with previous measurements of such events on the glacier (Reference Iken, Rothlisberger, Flotron and HaeberliIken and others, 1983; Reference GudmundssonGudmundsson, 1996). The August event was observed at all stakes (Fig. 1), and the July event on all but a few of the lowermost stakes.
These data have given a much better picture of the spatial and temporal distribution of these motion events on Unteraargletscher than previously existed. Some important questions, however, could not be answered. GPS measurements have indicated down-glacier propagation of events with speeds of a few hundred meters per hour. The GPS measurements were limited to a small area of the glacier (close to site C), and a possible location of event initiation could therefore not be determined. Since the time resolution of the theodolite data was not sufficient to detect a propagation of events of this type with such speeds, the question where any such events originate still remains open.
A strong association of the motion events with short periods of heavy rainfall was observed. This has also been observed on a number of other glaciers, and seems to be typical of late-season events.
Measurements of the water level in a borehole at site C showed reduced diurnal fluctuations and slightly increased water level during the August event. The termination of that event was followed by a drastic 60 m drop in water level within about 14 hours. No measurements of water levels are available for the July event. During the September event, the water level dropped by about 9 m.
Similar observations of both increase and decrease in water pressure during short-term motion events, and dramatic drops in water level at the termination of motion events, have been made on a number of other glaciers. In general terms, the observed pressure variation during the August event seems to be characteristic of such events. We speculate that during the motion event in August the borehole at site C was hydrologically poorly connected to the bed. The sudden drop in water pressure may have been caused by a temporarily improved connection related to extended cavity formation and generally increased water storage at the bed.
Stake speeds before and after the two motion events in August and the possible motion event in September are significantly different. It thus appears that the motion events can have a lasting effect on the velocity regime of the glacier. The pressure data from the single site C do not suggest any associated changes in water levels. Nevertheless, we conjecture that the motion events may have led to a widespread reorganization of the drainage system, and that basal water pressures changed because of associated changes in the geometry of the subglacial water conduits.
Acknowledgements
This research was supported by Swiss National Science Foundation grant 2000–053561.98. Comments from E.Waddington and an anonymous reviewer led to substantial improvements in the manuscript.


