


1. Introduction
Prototyping is a fundamental method employed in product or part design (Houde & Hill Reference Houde and Hill1997). Prototyping enables designers to explore design options, evaluate component function and interaction and communicate designs to stakeholders (Ulrich, Eppinger, & Yang Reference Ulrich, Eppinger and Yang2008). The prototypes created during a prototyping activity can comprise of an almost inexhaustible array of virtual and physical assets with different traits (e.g., mass, texture, haptic interaction) and can represent features of a product through to an entire Product Service System.
Physical prototypes can be touched, handled and tangibly interacted with, but can be expensive and time-consuming to create and iterate (Liker & Pereira Reference Liker and Pereira2018). Virtual prototypes are those that exist in the digital world, generated and processed by a computer. These can be easily manipulated and analysed (with the prerequisite knowledge and skills) using computer-aided engineering tools enabling greater design exploration (Wang Reference Wang2003). Consequently, both physical and virtual prototypes are often used in concert throughout the design process.
The emergence of Mixed Reality (MR) combines both physical and virtual assets. Thus, there is the potential to leverage the affordances of both domains (Milgram & Fumio Reference Milgram and Fumio1994) to create prototypes with tangible physicality, virtual iterability and virtual analytical capability (Kent et al. Reference Kent, Snider, Gopsill and Hicks2021).
Human–computer interaction research has shown the combination of physical and virtual assets at contrasting levels of fidelity can illude and deceive a stakeholder into perceiving a prototype as having a greater combined fidelity (Razzaque Reference Razzaque2005; Azmandian et al. Reference Azmandian, Hancock, Benko, Ofek and Wilson2016).
This effect derives from the way that humans interpret their environment based on various sensory inputs and prior expectation (Knill & Richards Reference Knill and Richards1996). This “prior expectation” can lead people to misinterpret incoming sensory information, leading to a different impression of what they are interacting with or seeing. The Müller-Lyer illusion (Figure 1) is one of the earliest records of this effect (Muller-Lyer Reference Muller-Lyer1886; Charpentier Reference Charpentier1891) and provides a good example of the relevant neurological processes. In this example, the way that human brains interpret the angled “wings” illudes and modifies their perception of the length of the horizontal lines.
Müller-Lyer illusion: The addition of angled “wings” to identical, parallel lines causes the impression that the lines are of differing lengths.

Due to a similar process, in the work by Azmandian et al. (Reference Azmandian, Hancock, Benko, Ofek and Wilson2016); Razzaque (Reference Razzaque2005), visual information represented in the virtual domain illuded the participant’s interpretation of the physical environment they were interacting with. This led the user to believe that what they were seeing was the true physical state, rather than the virtual and physical environments not matching. This is due to the participants “expecting” that what they were seeing was congruent with what they were physically interacting with (based on a lifetime of experience). This enabled the authors to enhance a simple physical environment with virtual elements, to be perceived as something more complex by the participants.
Understanding the neurological mechanisms and the influence of physical and virtual assets and their traits behind these types of illusion could offer potential benefits. For example, reducing physical fidelity of the prototype while maintaining the visually perceived virtual fidelity could reduce design cost and development time (Razzaque Reference Razzaque2005; Azmandian et al. Reference Azmandian, Hancock, Benko, Ofek and Wilson2016).
However, how to configure the ‘illusion’ in the context of prototyping, where products have many more features and participants interact and manipulate the prototype in a variety of ways, has yet to be fully understood. This leads to the contribution of this article, evaluating how MR can be applied for interactive prototyping tasks by understanding how the user perception of an MR prototype is influenced by different physical and virtual traits – namely, mass and size.
The paper continues with a review of the related work into why designers prototype, the human mechanisms through which we perceive prototypes, and MR prototyping (Background and related work section). Next, the design of the experimental setup and study is described (Study section), followed by the Results and discussion sections. The paper then concludes with the key findings from the study (Conclusions section).
2. Background and related work
This section provides the background information that informed the study. It consists of three subsections that detail the purpose of prototypes and the value of varying prototype fidelity, the implementation and affordances of MR, and the way that humans perceive prototypes based on our sensory capability. A summary provides the rationale for the work.
2.1. The purpose of prototyping and importance of prototyping fidelity
Prototypes are an essential part of the design process, used to inform decision-making. Lauff, Kotys-Schwartz, & Rentschler (Reference Lauff, Kotys-Schwartz and Rentschler2018), Jensen, Elverum, & Martin (Reference Jensen, Elverum and Martin2017) and Goudswaard et al. (Reference Goudswaard, Real, Snider, Camargo, Zamora and Hicks2023) highlight that prototypes are purposefully created with Ulrich et al. (Reference Ulrich, Eppinger and Yang2008) defining the following four purposes: Learning, Communication, Integration and Milestones. Houde & Hill (Reference Houde and Hill1997) classified prototypes into those that consider the “Role”, “Look and Feel”, and/or “Implementation” of a concept or design. Fundamental to all these purposes is the need to create the necessary knowledge for a design team to progress the design process. Insufficient knowledge generated from one prototyping activity will often lead to further activities resulting in delays and additional costs.
This is especially true when creating customer-facing prototypes for user evaluation, as the organisation of these evaluation sessions can be slow and expensive (Marti & Bannon Reference Marti and Bannon2009). A “high-fidelity” prototype is perceived to accurately represent the design definition while a “low-fidelity” prototype refers to a rough approximation (Houde & Hill Reference Houde and Hill1997). Real et al. (Reference Real, Snider, Goudswaard and Hicks2021) and Deininger et al. (Reference Deininger, Daly, Lee, Seifert and Sienko2019) show that different prototyping methods afford different knowledge contributions, and in general, a higher fidelity prototype offers more insights than lower fidelity prototypes. For example, Felton, Yon, & Hicks (Reference Felton, Yon and Hicks2020) showed that a prototype with higher mass fidelity was preferred over less representative alternatives, and this affected the participant’s interpretation of task performance.
While high-fidelity prototypes are often beneficial to the design process, they are more costly to produce and require greater commitment in a design’s definition in order to realise them. Thus, any changes as a consequence of a later-stage prototyping activity can introduce delays and be costly (Pahl et al. Reference Pahl, Beitz, Feldhusen and Grote1996).
The time and cost of developing prototypes has been a consistent deciding factor on which prototypes get produced. Only in the past decade have technologies such as MR emerged that have the potential to decouple fidelity from high-cost prototyping development processes (Kent et al. Reference Kent, Snider, Gopsill and Hicks2021).
2.2. MR: A means of manipulating a user’s perception of fidelity
MR refers to technologies that combine elements of the physical and virtual domains. Milgram & Fumio (Reference Milgram and Fumio1994) proposed a continuum of reality-virtuality (Figure 2), ranging from the real, physical world to the virtual world. MR occupies the middle ground on this continuum; blending, twinning and synchronising virtual and physical assets to create a single perceived reality.
Mixed Reality spectrum as defined by Milgram & Fumio (Reference Milgram and Fumio1994).

MR affords the ability to insert both virtual and physical assets into either domain, and allows a degree of control over the fidelity of these assets through the interplay between them. The opportunity to mix physical and virtual assets of varying fidelities has received increased attention from researchers who see it as a way to create prototypes that can provide the feedback and knowledge generation capabilities of traditionally higher-fidelity models through more cost-effective lower-fidelity assets with the right combination of traits (Kent et al. Reference Kent, Snider, Gopsill and Hicks2021).
Bordegoni & Francesco (Reference Bordegoni and Francesco2013) used MR to create multi-sensory prototypes that could be rapidly iterated in a single session. This enabled designers to quickly identify appropriate values for key parameters of the design. They also demonstrated that a single physical asset can be used to represent a design space by modifying the traits of virtual assets. This is a unique capability of MR.
Utilising the mutability of the virtual domain, the “as seen” representation of a prototype can be easily varied to represent a new design. There is also potential that the physical asset of an MR prototype can be of lower fidelity than the virtual asset, with the virtual asset “upgrading” the stakeholder’s perception of the prototype. This could help reduce costs and development costs of the prototype, without sacrificing the communication of the design. This would be especially helpful for user-facing prototypes as the primary goal of these prototypes is to communicate a design as accurately as possible, to enable feedback. However, to ensure that a user or stakeholder’s perception of a prototype aligns with the designers intent, the designer must make sure that the fidelity of each prototype trait across the physical and virtual assets is appropriate.
Most MR prototyping studies have taken an ad-hoc approach with little to no justification of how they chose their blend of virtual and physical assets and their traits (Bordegoni & Francesco Reference Bordegoni and Francesco2013; Kelly et al. Reference Kelly, Shapiro, Halleux and Ball2018; De Crescenzio et al. Reference De Crescenzio, Sara, Severine and Nigel2019; Maurya et al. Reference Maurya, Kengo, Koyo, Pierre-Antoine and Céline2019; Kent Reference Kent2022). This is likely because, presently, there is little to no guidance on how the blend of physical and virtual assets and traits affects user perception. Without this guidance, it becomes difficult to know how best to create a prototype, and there is no way to be sure that the MR prototype being interacted with is being perceived as the designer intends.
2.3. Perceiving prototypes
Cox et al. (Reference Cox, Hicks and Gopsill2022) described how the prototype fidelity can be broken down into several dimensions, which can be used to map how accurately a prototype approximates the visual, haptic, functional or environmental traits of a final product (Figure 3). This facilitates a more specific understanding of the overall prototype fidelity. It is important to consider the different dimensions of fidelity when creating an MR prototype, as the chosen fidelity profile will play a significant role in determining the prototype’s realism, development cost and time. However, the exact role and interplay between these different components is as yet unexplored.
Taxonomy of Mixed Reality prototype fidelity (Cox, Hicks, & Gopsill Reference Cox, Hicks and Gopsill2022).

Prior to investigating the interplay between virtual and physical assets, it is necessary to understand how humans perceive prototypes and how their sensory system gathers information from the combination of assets and traits to create a single representation (Mesulam Reference Mesulam1998). The human sensory system is complex and multifaceted, with a multitude of sensors located throughout the body that provide data to the central nervous system (Brodal Reference Brodal2004; Marani & Lakke Reference Marani and Lakke2012). The data are then combined with the individual’s understanding and expectation of the world to generate their perception of the prototype and environment (Knill & Richards Reference Knill and Richards1996).
Classically, an individual has five senses (Hicks Reference Hicks2015): Vision (sight), Somatosensation (touch), Audition (hearing), Olfaction (smell) and Gustation (taste). All five senses have a role to play in perceiving a prototype and will need to be realised to some level of fidelity (Ferrise, Graziosi, & Bordegoni Reference Ferrise, Graziosi and Bordegoni2017). Of these senses, it could be argued that touch is one of the most complex (Paterson Reference Paterson2007). It is not one sensory pathway, but many sensory subclasses (including various skin and skeletal/muscle sensors) that are combined in the brain to yield a single sensory output that can then be processed by the conscious brain (Lederman & Klatzky Reference Lederman and Klatzky2009). It also requires active exploration to obtain this sensory information, such as lifting and rotating an object to determine mass and inertial properties, or a range of grasping and stroking activities to obtain and verify shape and form information (Lederman & Klatzky Reference Lederman and Klatzky2009).
Due to the magnitude of sensation coming from the body, the brain has adapted to try and shortcut some of the required processing to establish the world state (Knill & Richards Reference Knill and Richards1996). One of the main ways it achieves this is preferencing vision to create an assumption of the world state, based on previous knowledge, and combining this assumed state with the incoming sensory information through Bayesian Inference (Knill & Richards Reference Knill and Richards1996). Vision provides large amounts of information with low levels of movement. In contrast, somatosensation which often requires more active exploration with the hands (Lederman & Klatzky Reference Lederman and Klatzky2009). Furthermore, evidence from Fairhurst Merle et al. (Reference Fairhurst Merle, Eoin, Vincent and Ophelia2018) shows that vision often provides a more accurate understanding of the environment around us. Consequently, our vision has become the dominant sense (Snowden et al. Reference Snowden, Snowden, Thompson and Troscianko2012) with other senses used to investigate the remaining traits that cannot be easily assumed, or verifying the assumptions with a few cursory procedures, that is, rubbing a hand over a glass vase to verify its smoothness.
Because the brain makes these assumptions based on visual cues and previous knowledge, it is relatively simple to deceive the brain into thinking an object has different physical traits than it actually does (Gregory Reference Gregory2015). A classic example of this is the size/mass illusion (Murray et al. Reference Murray, Ellis, Bandomir and Ross1999). If a person sees two metal spheres of differing sizes, they will assume that the larger one will be heavier based on previous experience. However, if they weigh the same amount, a person will perceive the smaller ball to be heavier than the large ball when they pick them up. This is because the large ball is relatively lighter than expected and the small ball relatively heavier than expected. This phenomenon extends to how we interact with objects. Plaisier & Smeets (Reference Plaisier and Smeets2012) found that if participants are asked to push a metal sphere on a string up to a certain angle, with only an initial impulse, the size of the equally weighted balls directly affected how far the ball was pushed. Other illusions such as optical illusions (e.g., the Müller-Lyer illusion) (Gregory Reference Gregory2015), the phantom limb illusion (Giummarra et al. Reference Giummarra, Gibson, Nellie and Bradshaw2007) and more, all come about due to similar effects, where the brain “joins the dots”, based on previous knowledge and assumption.
The historical limit to creating these illusions has been due to the viewer or participant being limited to physical objects, and not being able to disconnect the somatosensory and visual senses. However, with the advent of MR, the visual and the physical properties of a perceived object can be controlled independently (Azmandian et al. Reference Azmandian, Hancock, Benko, Ofek and Wilson2016), vastly increasing the scope to use this opportunity.
Although as different MR techniques and technologies work in fundamentally different ways, these techniques have differing affordances for controlling physical and virtual interactions. Systems such as VR CAVE devices, or screen based AR methods, do not inherently offer any physical interaction so do not offer this capability. Systems such as head-mounted devices (HMDs) used for MR or VR also do not inherently have significant physical interaction. However, with the addition of passive haptic elements (Insko Reference Insko2001) or haptic gloves (such as the HaptX gloves), the physical and virtual interactions and behaviours of the surrounding objects and environment can be decoupled. In the case of haptic gloves, the physical sensations may not be fully realistic but greater flexibility is enabled. Passive haptics, on the other hand, offer more realistic interactions, but lack the flexibility of the gloves. Spatial AR systems (such as the SPARK project (O’Hare et al. Reference O’Hare, Dekoninck, Giunta, Boujut and Becattini2018)) use projections onto a blank 3D object to visualise the visual properties of a prototype. This allows a level of virtual decoupling from the physical asset, but due to the fixed, visible, physical assets and the physical interactions cannot be modified.
2.4. Summary
The related work has shown that prototyping plays an essential and purposeful role in the design process. The purpose of the prototype drives the selection of the prototyping process and required fidelity, and the development of new technologies has enabled new purposes for prototypes to be developed and reduced the cost of higher fidelity prototypes. The selection processes have remained at a high and/or abstract level to support decisions such as whether the prototype should be physical or virtual. Many of the selection processes are driven by the fidelity that can be achieved through the prototyping method or the fidelity that is required. The emergence of MR has opened up the opportunity to independently control the physical and virtual traits of a prototype, and therefore enables greater control of the prototype fidelity profile. This may make it possible for MR to support many prototyping processes through a single technology.
The review of the human sensory mechanisms shows that vision dominates other senses, but the sense of touch is still essential to verify assumptions made based on sight. Although there is evidence to show that MR can be used to make a person believe they are interacting with something different to what they are physically holding, there has not yet been a review of the limits of this effect and how it could be applied to prototyping. Thus, it is important to understand how different prototype traits across the physical and virtual assets influence user perception during MR prototyping.
This understanding is essential to develop tangible MR prototypes with low required physical fidelity that are perceived as higher fidelity, without the associated development cost of a high-fidelity physical prototype. Furthermore, it will verify and help to develop understanding of how a single MR prototype can be used to represent a range of design variants without any required re-manufacture, through purely virtual modifications. This could be very valuable in user-facing prototypes, where design and variant evaluation, and the ability to instantly iterate, could increase the information gained from design review sessions.
To develop this understanding, this article explores the perceived effect of varying the virtual and physical size and mass on the user perception of the prototype.
3. Study
In order to investigate the interplay between the virtual and physical assets and their traits of an MR prototype, and their influence on user perception, an inductive hypothesis-led approach was applied in order to guide the design of an empirical study.
The direct investigation of prototype fidelity would only be possible with a fully realised design as fidelity can only be defined relative to the fully realised product. As such, an understanding of a user’s sensitivity to different physical and virtual traits was sought as a proxy variable. This will enable designers to assess a suitable fidelity level for their situation, based on an understanding of this sensitivity. For example, if proven that users are less sensitive to physical size than virtually represented size, designers can make an informed choice to reduce the fidelity of the physical representation of their prototype without worrying about significantly reducing prototype performance.
This section first develops the hypotheses, then presents the study design, summarises the participants and analysis method.
3.1. Hypotheses
A set of five hypotheses were developed from the literature and for the purpose of brevity are shown in Table 1, alongside rationale and supporting citations.
Study hypotheses with rationale, supporting references and analysis overview

3.2. Experimental context and setup
The context for the study was the prototyping of an electric drill. This product has several characteristics that make it suitable for exploring the use of MR in a wide range of cases. These are highlighted in Figure 4 with several examples shown. This choice is further supported by the significant market size of power drills, estimated to be 11.28bn USD in 2023 (China Market Monitor 2021).

The MR environment featured a VR headset (Valve Index) to create the virtual environment and representation of the prototype. Physicality was created using passive haptics, through the use of physical artefacts and furniture, which were used to inform the position of their virtual counterparts. This implementation was chosen as it enabled representative physical interactions unlike pure VR. It also facilitated the separation and independent control of the “as-seen” and the “as-felt”, which differentiates MR from AR prototyping (O’Hare et al. Reference O’Hare, Dekoninck, Giunta, Boujut and Becattini2018). The setup enabled the evaluation of the relative impact of both virtual and physical prototype traits, as required to address the proposed hypotheses.
The experimental setup is illustrated in Figure 5, showing the position of the participant during the study and their view, as well as an example of a participant engaging with the study. The setup included:
Experimental setup.

-
1. A modularised 3D-printed drill in three different sizes with cavities to insert brass masses (shown Figure 6).
Figure 6.Physical props used to provide physical interaction.

-
2. A Virtual Reality scene created in Unity and viewed through a Valve Index HMD (shown in Figure 7).
Figure 7.Virtual scene in which the participants interacted with the MR prototypes.
-
3. Hand and object tracking, to localise the prototype and participant’s hands.
-
4. A pair of cameras, mounted above the participant and within the HMD, and microphones to record the participant’s interactions and speech.
-
5. A chair and seated desk for the participant to sit at during the study.


The modularised 3D-printed drill (Figure 6) comprised of three size variations (Figure 6a) shown in Table 2 that covered the typical size range of cordless drills (based on the range from HILTI (2023). A single drill was 3D scanned and the point-cloud re-scaled to provide the three variations in size. The three STLs were subsequently split into three modules – the chuck and motor housing (1), handle (2) and battery housing (3).
Key dimensions of the reference drills and models used in the study

Neodymium magnets and alignment dowels made for a quick and easy interface for changing between modules during the study. The mass inserts were made to a standard size using brass and low-density 3D printed parts, to reduce rattling within their respective cavities and facilitate changing between iterations.
The chuck and motor housing module featured a standard camera stand screw, which enabled a HTC Vive Tracker to be attached to capture the position of the prototype in real-space and map it to a position in the virtual space.
All modules featured a cavity that enabled the mass and centre-of-mass to be modified (Figure 6b). Three different mass values for each module were selected based on the reference HILTI design information, and an additional “As-Printed” mass class (no mass inserts used) was included in the study to verify Hypothesis H3. The result was a total of 12 combinations for the physical component of the prototype, 4 mass variations and 3 physical size variations.
The virtual assets were created using Unity3D in concert with the Steam VR and LeapMotion plugins. The Steam VR plugin provided management of the Vive trackers and the ability to display the scene through the HMD. The LeapMotion plugin provided the ability to track and place participants hands in the virtual scene. The LeapMotion controller was placed on the HMD.
The virtual environment is shown in Figure 7 and featured:
-
1. A virtual table matched to the position of a real physical desk.
-
2. A poster showing the different components of a drill to facilitate any conversation/insight they might have about the design of the drill itself.
-
3. A wooden panel was placed inside the scene to give the participants something to interact with when evaluating the drill prototypes.
-
4. Floor and walls to provide perspective within the scene.
-
5. Virtual representation of the drill.
The virtual drill used the same 3D models as the physical 3D printed modules. As with the physical assets, three different sizes were used. An overview of the different potential prototype mass/size combinations is shown in Table 3.
Possible values of mass, physical size and virtual size for each prototype iteration, an example combination is highlighted

Synchronisation between the physical and virtual prototypes was achieved through two tracking lighthouses mounted above the experimentation area (shown in Figure 5a), that detected and monitored the position of the Vive Tracker mounted on the physical asset (seen in Figure 6a) and the position of the HMD.
3.3. Experimental procedure
Figure 8 provides an overview of the experimental procedure with each of the steps discussed further in this section.
Step 1. Participant Introduction.
Participants arrived at the study location, with all experimental equipment concealed to reduce priming. They were briefed that the study would focus on evaluating prototype cordless drills in two sections with a break. Consent was obtained for recording and data storage for up to a year or until paper publication. Data were anonymised.
Step 2. Participant enters VR.
After the introduction, participants were handed the Valve Index HMD and received fitting instructions. They were informed of their right to pause or cancel the study for any reason, and given time to become comfortable in the virtual environment.
Step 3. Activate prototype.
A randomly selected prototype instance was presented to participants by placing the physical prop with a tracker in front of them. The virtual asset of the prototype was then activated, enabling participants to both see and physically interact with it.
Flowchart of experimental procedure for each participant.

It is worth reiterating that the virtual and physical assets of the prototype did not need to be identical. Each iteration could feature various combinations of physical asset size, virtual asset size and mass level, as in Table 3.
Step 4. Picking up and interacting with the prototype.
Participants were prompted to pick up and interact with the prototype as they would a real drill, with a virtually generated wooden board to facilitate role-playing.
Step 5a. Section 1 questions.
For the first five prototype iterations (Section 1), the questions shown in Table 4 were asked. The rationale for asking these questions is summarised in Table 4.
Step 5b. Section 2 questions:
In Section 2, the participants were required to qualify the change between the current and previous prototype iterations. The participants were asked the following:
-
• Has the prototype changed from the previous iteration?
-
• What has changed? (i.e., size/mass)
-
• How much has it changed by? (i.e., slight/significant change)
-
• How would you rate the realism of the prototype between 1 and 5? (Where 1 is very un-realistic and 5 is very realistic).
The objective of this section was to study the links between the actual and perceived change, and to determine to what level the different variables influence the participant’s perception.
Step 6. Return the prototype.
Once the user was satisfied they had given sufficient feedback on the prototype, they were asked to return the prototype back on the table. The facilitator disabled the visual asset of the prototype so that it became invisible to the participant.
Step 7. Update prototype.
The physical and virtual assets were both iterated and replaced, with the next physical asset placed on the table and the virtual model updated.
Section 1 questions and rationale

This iteration could include a change in either one, two or all three variables, and the variables within each iteration would always change in the same direction (i.e., if one variable increases, the other variables can either stay constant or also increase by the same amount). For example, iteration 1 might consist of an increase in mass with the size remaining the same, iteration 2 might consist of a reduction in all three variables, and iteration 3 might comprise no change. For each iteration with a change, the variables could only change by one step, that is, moving from the lower bound to the medium value, or the medium value to the higher bound. This was done to investigate the effects on perception from both individual and coupled variable changes, without creating too many sub-groups of different coupled variable changes. This is a representative restriction, as a single design change is unlikely to increase size and decrease mass at the same time and designers are unlikely to reduce the size of the physical artefact while increasing the virtual size. This means that coupling directionality of the variables should not reduce result validity for an engineering design application. Over the course of the study for each participant, the different types of iteration (i.e., one, two or three variables changing per iteration) were evenly distributed to obtain a balanced dataset.
Step 8. End of section.
The participant was asked to remove their headset, and was then given a NASA TLX questionnaire to fill out. This was done to gain insight into their opinion of the prototyping tool, and to reset their thinking.
Step 9. Finish.
Upon finishing the second section, the participant was then given an opportunity to ask any questions they had about the study.
3.3.1. Assumptions
Two key assumptions were made during the study. First, the human perception of an increase in mass or size is directly comparable to a decrease; therefore, the two directions could be combined when analysing the resulting data.
The second assumption was that participants would not be able to easily detect a change in mass below 10%. This means that although the mass of the different sized physical props is not identical, they are sufficiently similar that they can be treated as the same mass for experimental purposes.
These assumptions are supported by research on the Weber’s fraction and Just Noticeable Difference in human perception. They found that an increase or decrease in a parameter does not affect detection chance, and that mass changes of 10% or less cannot be reliably detected by a human (Ross & Brodie Reference Ross and Brodie1987).
3.4. Participant and recruitment information
Fifteen participants were recruited. They were engineering design researchers from the University of Bristol, UK, ranging from PhD students to professors. A total of 450 prototype instances were evaluated by the participants. Further information about the participants is shown in Table 5. The participants were not rewarded for the study, and were recruited through word of mouth. The study size was equivalent to similar studies investigating the use of VR and MR in the design process (Suh Reference Suh2017; Chaniaud et al. Reference Chaniaud, Sylvain, Benjamin, Olivier, Thibaut and Simon2023). Participants were recruited in two blocks, several months part. To minimise bias or difference between the two blocks, the experimental procedure, equipment, environment and facilitator were identical between them.
Study participant information

The small number of participants in some demographic sub-groups (i.e., used VR fewer than five times) meant that no meaningful comparison between these sub-groups could be generated in terms of behaviour or responses. However, as an overall group there was enough data to generate insight. As each participant was exposed to the full range of prototype variants, any variation between participants due to previous experience or demographic would be equally present across the full range of prototype variants. Therefore, although the overall results may vary between participants, the trends within each participant should be consistent and therefore not skew the overall results.
3.5. Coding scheme and analysis
For the purpose of testing the five hypotheses (Table 1), a multi-level coding scheme was developed for analysing the video and audio footage recorded. Divided into two main categories, this coding scheme was devised to classify and count different participant interactions, and participant feedback.
The coding scheme for observed participant interactions was used throughout the whole study (Sections 1 and 2), and is outlined in Table 6. To create this scheme, an initial set of codes (#1–3) was created based on the expected haptic interactions associated with the independent variables of the study (mass and size), based on the work by Lederman & Klatzky (Reference Lederman and Klatzky2009). These codes were then used on a sample of each of the participant’s recorded footage to assess suitability.
Participant interaction coding scheme with the associated purpose of the coded interactions

While these codes were deemed appropriate to capture the intended information, several other notable haptic interactions were regularly observed in the footage (codes #4–7) so these were also added to the scheme. The inclusion of the additional codes was necessary to test Hypotheses 4 and 5.
Another sample of the participant footage was tested with this finalised scheme and the selected codes were able describe the full range of relevant interactions with minimal overlap and clear distinction between them. Finally, to ensure a consistent counting method, each of these interactions was marked as a single instance for each time they were observed. If the interaction continued for more than 3 seconds, it was recorded as two instances and so on.
The coding scheme for recording participant feedback was divided by the two sections of the study. The development process for both feedback coding schemes followed the same method as with the participant interaction coding scheme. The coding scheme for Sections 1 and 2 are shown in Tables 7 and 8, respectively.
Section 1 feedback coding scheme

Section 2 feedback coding scheme

The first iteration of Section 1 coding scheme had codes for comments on mass properties, size, appearance, realism and comfort based on the questions asked in this section. After testing this scheme with some sample footage, additional codes for surface texture, interactivity and balance were added as these were also discussed by the participants. Following a third sample test, the code for appearance was split into two: comments on the prototype design itself and comments about the appearance due to the prototype’s implementation. This differentiated between valid prototype feedback, and feedback about the prototyping tool itself, which would not be of assistance in a real prototyping scenario. Finally, an indication of sentiment was also added for each code, with each code broken down into positive, negative and neutral statements. This set of codes (Table 7) was found to be satisfactory on a fourth sample test, with negligible overlapping between statements.
Section 2 coding scheme (Table 8) assessed perceived change between prototype iterations. The first iteration of this scheme contained codes for small and large perceived increases and decreases in mass and size, and a code for perceived realism. However, after an initial trial of this scheme with a sample of the data, the participant confidence was also categorised, as either “high” or “low” based on whether the participant spent more or less than 3 seconds deliberating. After testing the updated scheme on another data sample, it was found that the perceived change and realism was captured sufficiently for further analysis.
3.6. Analysis
The analysis conducted for this study, and the data used for each stage of analysis are shown in Figure 9. The relationship between the analysis conducted and the hypotheses addressed is shown in Table 9.
Flowchart of the data throughout the study and the resultant analysis conducted.

Hypotheses addressed by different analysis sections

4. Results
An overview of the top-level metrics throughout this study are shown in Table 10. These provide a summary of the high-level characteristics of the dataset generated and confirm the inability for the study to correlate results against demographic.
Overview of key study metrics

Results are now presented for each step of the methodology documented in Figure 9, with this section divided according to the five stages of analysis described.
4.1. Interaction analysis
The results of the interaction analysis are shown in Figure 10. This chart shows the number of each interaction type characterised in Table 6 carried out for each prototype iteration.
Average number of each interaction type carried out for each iteration by the participants across the study.

A clear hierarchy is exhibited in the number of times different interactions were carried out, with “Manipulations for Inspection” being the most common interaction type (avg. 13.3 interactions/iteration). Following this was “Interactions with Operational Features” (avg. 5.9 interactions/iteration) and “Prototype Rotations” (avg. 6.1 interactions/iteration). “Raising and Lowering the Prototype” (avg. 3.9 interactions/iteration) and “Grasping with a Second Hand” (avg. 3.4 interactions/iteration) are the next most prominent interactions. “Stroking” (avg. 1.8 interactions/iteration) and “Pretending to Use the Drill” (avg. 1.4 interactions/iteration) were the least common interaction types.
In the first five iterations (Section 1), there were significantly more interactions conducted (average of 107 interactions on iteration 1 and 59 interactions on iteration 5), decreasing in frequency and settling into a mostly steady state for Section 2 of the study (average of 28.5 interactions per iteration).
4.2. Feedback analysis
A summary of the feedback given in Section 1 of the experiment is given in Table 11. The most common comments concerned mass (average of 3.6 comments per iteration), comfort (2.6 comments per iteration), balance (2.3 comments per iteration) and design-focused appearance (2.2 comments per iteration). In contrast, the least frequent comments were about the surface texture (0.2 comments per iteration) and interactivity (0.4 comments per iteration). By aggregating comments focused primarily on the design (mass, size, appearance – design, comfort and balance) and on qualities of the prototyping tool itself (realism, surface texture, interactivity and appearance-tool); we observe that on average per iteration, 12.3 comments were made about the prototype design and 3.1 comments were made about the prototype tool itself.
Section 1 feedback summary

In addition to the coded feedback, 11/15 participants made at least one comment saying they would prefer it if the drill was interactive, and 9/15 participants made at least one comment saying they did not like how the drill was rendered and would prefer a more realistic visual presentation.
4.3. Realism analysis
A t test was used to compare the perceived realism for prototypes with no brass masses inserted (the “As-Printed” mass class) to the perceived realism of the entire sample collected. A summary of the results and key values used for this analysis are shown in Table 12.
One-sample, one-tailed t test for the perceived realism of “As-Printed” mass level prototypes
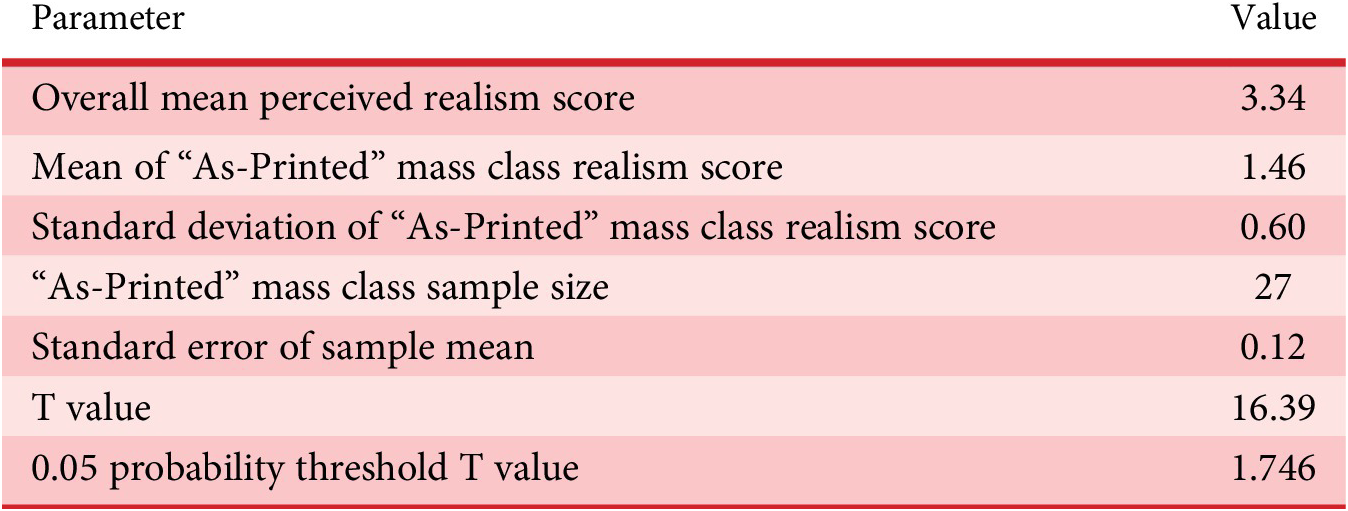
The T value of 16.4 for the perceived realism of the “As-Printed” mass class prototypes is significantly larger than the 0.05 probability threshold value. This indicates that the perceived realism of the “As-Printed” mass class prototypes was statistically significantly lower than those with a mass profile one might expect from an actual drill, supporting H3.
A visual representation of this finding is shown in Figure 11a, where it can be seen that the realism value of the “As-Printed” mass class prototypes is two standard deviations below the perceived realism values of the weighted iterations.
Perceived realism of the drill prototypes, based on the mass levels and virtual/physical size discrepancy.

Figure 11b shows that there is a slight, but not significant reduction in perceived realism when there is a difference between the physical and virtual sizes (within standard deviation), which supports H1. There is also only a slight difference between a one-step difference (e.g., medium and large virtual size) and a two-step difference (e.g., small and large physical size).
4.4. Correlation analysis
Table 13 shows the results of the Pearson’s correlation analysis, with threshold descriptors to qualify the correlation values (Guilford Reference Guilford1950).
Correlation between independent and dependent variables

As expected based on H1, the changes in the size of the virtual component were more influential on the participant’s perception of size (0.945) than the physical component (0.437). A low negative correlation (−0.263) between the perceived realism and the discrepancy between virtual and physical size reinforces H2, as this demonstrates that as this discrepancy increases, perceived realism decreases somewhat. The moderate positive correlation between drill mass and perceived realism (0.445) may support H3, as this shows that as mass decreases, so does the participant’s perception of prototype realism. The slight/low positive correlation values between the perceived realism and number of interactions/time taken with each prototype iteration indicates that there might be a relationship that supports H5; however, these relationship’s weak threshold descriptors mean they are therefore not definitive. Another significant relationship is the high positive correlation between the actual and perceived mass changes (0.836), and was expected based on previous literature (Murray et al. Reference Murray, Ellis, Bandomir and Ross1999).
4.5. Perceived change analysis
The results comparing the actual and perceived changes by the participants are shown in Figure 12. Figure 12a,b shows the perceived size and mass change, respectively, and the confidence levels are shown in Figure 13.
Perceived size and mass change in response to varying actual changes.

Confidence in perceived size and mass change in response to varying actual changes.

These show that every time the virtual size of the prototype changed, this was correctly identified, with 90+% of these categorised as a “large change in size”. Conversely, a change in physical size without the virtual size changing was only identified 45% of the time, and only as a “small change in size”. This significant difference reveals that the visual perception, provided by the virtual component, dominates the overall perception of the prototype size, as stated in H1.
Figure 13 also shows the confidence in the perceived size change is 90%+ when there is a change in virtual size, but is significantly less when the physical size changes without the virtual size (50%). This is a similar level of uncertainty as when there is no change (50%).
There is a similar trend in the confidence when assessing mass changes. When there was a mass change, 75%+ high confidence was reported, whereas high confidence answers were only given for 30–55% of iterations with no mass change.
4.6. TLX data
Although not directly addressing the hypotheses posed, the responses from the TLX surveys carried out after the first and second study sections verify that the tool did not negatively impact the participants. The results from this are shown in Table 14. The average scores are all below 10/20 (where 0/20 is “very low” and 20/20 is “very high”), save for the Mental Demand in Section 2 of the study.
TLX results from Sections 1 and 2 of the study

5. Discussion
Results are discussed with respect to each of the hypotheses.
5.1. H1 – Visuals predominate over haptics in size perception
The required information to verify this hypothesis is shown in Table 13 and Figure 12. The very high positive correlation (0.945) between the perceived and virtual size change, compared to the moderate positive correlation (0.437) between the perceived and physical size change, shows that the virtual asset of the prototype is significantly more impactful on user perception in this case. This suggests hypothesis H1 to be true, agreeing with the work by (Murray et al. Reference Murray, Ellis, Bandomir and Ross1999), and reveals that this effect also applies to MR applications.
H1 is further supported by the results in Figure 12. These show that iterations where the virtual size remained constant and other parameters changed exhibited no significant (large) perceived size changes. And iterations with a change in virtual size had a $ \sim $
95% reporting of a significant size change. This is evidence that the virtual asset of the prototype can be dominant over the physical asset. This demonstrates the potential capability of MR prototypes to represent part or all of a design space; or to induce a user to believe the physical artefact they are interacting with is of higher fidelity than it really is, provided a sufficient level of virtual fidelity is implemented.
$ \sim $
95% reporting of a significant size change. This is evidence that the virtual asset of the prototype can be dominant over the physical asset. This demonstrates the potential capability of MR prototypes to represent part or all of a design space; or to induce a user to believe the physical artefact they are interacting with is of higher fidelity than it really is, provided a sufficient level of virtual fidelity is implemented.
Based on this evidence, hypothesis H1 can be deemed true. That is, the visual perception provided through the virtual asset of an MR prototype has a greater effect on the overall user perception than the physical, haptically perceived asset. However, this has only been proven in the case of an electric drill, which has different properties to other product classes. Therefore, this hypothesis cannot implicitly be extended to other product classes without further research.
5.2. H2 – Visual dominance requires sufficient similarity between the virtual and physical traits
This hypothesis is tested in Table 13 and Figure 11a. Table 13 shows that there is a low negative correlation between the perceived realism and the discrepancy between the virtual and physical size of the prototype. This suggests that as the distance between the physical and virtual sizes increases, there is a slight reduction in perceived realism. However, Figure 11b shows that there is only a slight drop in realism as this discrepancy increases, although not significant. Although this does not disprove H2, it implies that the prototypes used in this study did not have a sufficient virtual – physical size discrepancy to significantly reduce the participant’s perceived realism.
As the drop in perceived realism across even the most extreme physical-virtual size discrepancy tested in this study was not significant (within one standard deviation), this suggests that the allowable difference between the “as seen” and the “as felt” components of an MR prototype can be dramatic. In this case, a roughly 70% difference in drill size between the virtual and physical (177 mm × 160 mm to 229 mm × 210 mm) did not significantly affect the participant’s perceived realism; however, as the size of the drill handle did not change as significantly, this factor may explain this finding.
When combined with the validation of H1, this suggests that a single MR prototype could represent a large portion of a design space, with only modifications to one, or a handful, of the virtual assets and/or traits. Or that a low-fidelity physical component could be used with a higher fidelity virtual asset to create an MR prototype that is perceived to be high fidelity.
Overall, while not verifying H2, this finding does not disprove H2 and does instead highlight a significant opportunity for MR prototyping.
5.3. H3 – Perceived realism is maintained with representative, but not necessarily accurate, mass
Evidence to test H3 is given in Table 13 and Figure 11. Table 13 shows that there is a moderate correlation (0.445) between the prototype mass and perceived realism, suggesting that there is a significant relationship between the two factors, and as prototype mass decreases so does the perceived realism. Table 12 shows that the perceived realism score of the “As-Printed” mass level prototype iterations (average of 1.46 out of 5) is statistically significantly lower than the average perceived realism score over the whole experiment of 3.34 out of 5. This reveals that when the mass level of a prototype is not within an expected range, the perceived realism drops dramatically. However, the difference in perceived realism score between the lower, average and upper mass levels used in the study are much closer to each other (3.31, 3.69 and 3.67 out of 5, respectively), with overlapping standard deviations. This suggests that as stated in H3, as long as the mass level of the prototype is within the expected range, the perceived realism is maintained. The application of this finding is that when creating an MR prototype, the mass should be within the expected range, but does not need to be exactly accurate to still produce a prototype that is perceived as real.
5.4. H4 – Users perform expected haptic interactions to assess prototype traits
Evidence to test this hypothesis is provided in Figure 10. The expected haptic interactions in this hypothesis (based on the work by Lederman & Klatzky (Reference Lederman and Klatzky2009)) are described in Table 6, and the results shown in Figure 10 demonstrate that all of these expected interactions were present to varying levels.
As the mass and size of the prototypes were the primary traits being investigated, seeing the “Rotating” and “Raising and Lowering” interactions featuring prominently is not surprising, as these are required to evaluate the mass and balance/rotational inertia of the prototype. Also, as discussed previously, vision is the primary sense in the human sensory toolkit, and is suitable for accurately predicting the shape and size of an object. Hence, the “Manipulation for Inspection” interaction being most popular follows expectation, and also highlights that the MR prototype offers a sufficiently intuitive method to investigate the visual characteristics of a design.
However, it was surprising to see the “Interacting with Operational Features” interaction featuring so commonly, given that there were no dynamic interactive features with which to interact. This is reflected in the comments made by the participants, as 11/15 mentioned they would prefer it if the prototype responded to their interactions. Given this and the high frequency of the “Interaction with Operational Features”, it reveals that the interactiveness of these MR prototypes is a highly desired feature. Furthermore, as the low-fidelity physical asset with no dynamic components was able to elicit these interactions, it is possible that a purely virtual, or virtual with a low-fidelity physical response to these interactions could provide a rich experience of similar value to a fully interactive prototype.
The infrequency of the “Stroking” and “Pretending to Use the Drill” may be explained by the lack of development of these characteristics in the prototype. For example, the lack of operational and task realism may have meant that the participants did not feel the need to pretend to use the drill. Similarly, the smooth and unrealistic colour scheme given to the virtual component of the prototype (as reported by 9/15 of the participants) may have led the participants to assume that this was not the intended surface finish for the final design, and therefore did not require evaluation.
5.5. H5 – Increased perceived realism leads to more extensive haptic interaction and feedback
Evidence to test this hypothesis is presented in Table 13. Here, a slight positive correlation is observed between the perceived realism and the number of interactions with the prototype (0.116). Although this alone is not sufficient evidence to verify H5, the correlation between the perceived realism and the time taken interacting with each iteration (0.152) also exhibits a positive correlation, which supports the findings about the number of interactions and suggests the hypothesis may be true. However, further validation is necessary.
A summary of the status of each of the study hypotheses is shown in Table 15, categorised as either not proven, weakly proven to be true or strongly proven to be true.
Proven status of study hypotheses

5.6. Reflections on the study design
The main issue identified during the study was the participants’ varying understanding and mental model of “prototype realism”. Some interpreted this term to mean “is the object I am interacting with a real object” and others took the term to mean “is this object a realistic design of a cordless drill”. This then led to some participants (estimated 2/15) underrating their perceived realism, due to the colour scheme and lack of interactive features of the prototypes used for the study not matching their expectation of how a drill should be designed.
However, it is not expected that this has had a significant effect on the results, as only a minority of participants appear to have understood the term as the latter. Furthermore, each participant interacted with a sufficient number of prototype iterations and variations that this effect would have been applied to each prototype variant being tested. Thus, although this error may have reduced the overall perceived realism results, it would not have introduced bias towards one prototype iteration or type.
From the TLX scores in Table 14, we see that the MR system did not induce significant cognitive load onto the participants, although there was a higher mental demand in Section 2 of the study. From an evaluation of the recorded participant sessions, several of the participants commented that it became difficult to tell the prototype iterations apart, which induced the increased mental demand. In the future, studies navigating the relationship between the “as seen” and the “as felt” should be mindful that direct questioning about differences over many iterations can lead to increased mental demand. This could be mitigated through a different question framing than “What, if anything, has changed between iterations?” or through a reduction in the number of iterations evaluated.
5.7. Controlling and influencing stakeholder perception during design
It has been shown that in the case of an MR prototype electric drill, the visual component of perception has the most significant effect on overall perception, and using this effect the virtual component of an MR prototype can dominate the overall perception of a prototype.
There can also seemingly be a significant variation between what is seen and what is felt, based on how little the perceived realism dropped as the difference between the virtually displayed drill size and the physically held drill increased significantly.
As such, MR prototypes in general could offer unique flexibility by allowing a significant difference between the virtual and physical components of a prototype. The potential implications of this are that:
-
• A single physical artefact could be used to represent a large portion, or even all, of a design space, by iterating only the virtual component (assuming the physical component is located at the centre).
-
• A tangible prototype perceived to be high fidelity could be created from a lower fidelity physical component with a high-fidelity virtual component.
The application of these findings in industry will primarily benefit the creation of user-facing prototypes, used to generate design feedback. The findings could help to reduce the cost and iteration time for prototypes. By only requiring a virtual change to create a physically perceived change, real-time iteration of a tangible prototype is possible without any requirement for re-manufacture or the production of multiple physical assets. Furthermore, as the physical component of an MR prototype can be lower fidelity than the virtual component without reducing perceived fidelity, the cost of creating tangible prototypes could be reduced.
5.8. Future work
As interactivity was identified as a desirable prototype feature during the study, investigation of low-cost methods of introducing interactivity into MR prototypes could open avenues to extend the potential utility of MR prototypes. This could be enacted through a combination of virtual and physical techniques, and could focus on both the operational realism of the prototype, or the reproduction of realistic tasks or environments in which the product being prototyped might be used. This would allow designers to gather feedback about the functionality of their designs earlier in the design process, with higher confidence.
Another valuable extension of this work will be to investigate the extent to which the physical and the virtual can differ before affecting perceived realism, as this study did not establish the bounds of the allowable discrepancy (a 70% size difference was mostly undetected in this study, although the size change of the key interaction zones may be better detected). Investigating the allowable discrepancy in shape as well as size between the physical and virtual would help to further inform designers on how to create future MR prototypes as efficiently as possible.
Finally, a helpful extension of this work would be to characterise the effects observed in this study across a range of other product classes, to investigate and verify the application of these findings across different sectors of product design.
5.9. Implications for researchers and designers
When carrying out these future studies, or when using this prototyping paradigm in product design, the following features have been noted by the authors as important and worth considering.
-
• Ensure the virtual/visual component of the prototype is as high fidelity as feasible, as this has the greatest impact on overall perceived fidelity. This includes accurate colouring, patterning and lighting.
-
• The mass of the physical artefact should be within the expected bounds for that product class (e.g., a drill should be in the region of 0.9–2.8 kg), but does not need to be exactly accurate (unless that is a key investigative point of the prototype) to maintain prototype realism.
-
• Participants almost exclusively interact with the intended interaction regions or features of the prototype (in this case, the handle and the chuck), as such, the fidelity of the non-interaction points can be significantly reduced or even removed.
-
• Ensure that terminology being used with the participants (e.g. “prototype realism”) is clearly discussed with the participants and agreed upon.
6. Conclusion
This study investigates and highlights the capability of mixed fidelity, MR prototypes. The key finding was the demonstration that the visual elements generated by the virtual component of an MR prototype dominate the shaping of user perceptions. This was proven through a correlation between virtual change and perceived change of 0.945 (correlation between physical and perceived change was 0.437), and a 100% success rate of detection of virtual changes, against a 45% detection rate of physical size changes.
As such, virtual fidelity emerges as a key determinant, surpassing the impact of physical attributes and demonstrating its capability to deceive users interacting with the prototype. However, striking a balance between the physical and virtual domains is crucial when creating an MR prototype as it is expected that sufficient physicality is required to maintain perceived realism. Beyond this point, the user’s brain will no longer be able to “join the dots” and reconcile the difference between the “as-seen” and “as-felt” object or environment. The magnitude and type of the acceptable discrepancy between the physical and virtual requires further exploration, as the ~70% difference between virtual and physical size used in this study did not significantly reduce perceived realism.
It was also found that the mass accuracy of an MR prototype, while not demanding exact precision, is required to be within the expected limits of that product type (e.g., a drill should be in the region of 0.9–2.8 kg), otherwise a significant drop in the user’s perceived realism occurs. In this study, this drop in realism was found to be equal to two standard deviations.
Developing from this work, designers are advised to prioritise virtual fidelity when creating MR prototypes, and to manage form and mass representations strategically to minimise cost and design effort while maintaining tangibility and perceived realism. Furthermore, consideration should be given to interactive capability of the prototype as this was found to be a desired capability that could boost perceived realism and therefore improve the quality and value of user feedback. If following these strategies, MR prototypes offer substantial time and cost savings in iterative design processes.
The study further demonstrates that the fusion of the physical and virtual domains in prototyping opens new opportunities for high perceived fidelity prototypes, without the associated high cost and development time. Making use of MR prototypes could unlock a step increase in design productivity, provided they are designed intelligently.
Acknowledgements
The work reported in this article was supported by the Engineering and Physical Research Council’s Doctoral Training Partnership and project EP/W024152/1 titled: 21st Century Prototyping: Improving product prototyping through the integration of physical and digital workflow.


 Open access