


1. Introduction
Open jet flows are ubiquitous in technological processes such as fuel injection, thermal plasma spraying and electronics cooling. Researchers (Batchelor & Gill Reference Batchelor and Gill1962; Huerre & Monkewitz Reference Huerre and Monkewitz1990; Schmid & Henningson Reference Schmid and Henningson2012 ; Drazin & Reid Reference Drazin and Reid2004) have examined their spatiotemporal stability and have established, through numerical and experimental investigations, that round jets with thin shear layers are convectively unstable to both the axisymmetric mode ( $m=0$
) and the helical modes (
$m=0$
) and the helical modes ( $m=\pm 1,\pm 2,\ldots$
) (Mattingly & Chang Reference Mattingly and Chang1974; Strange & Crighton Reference Strange and Crighton1983; Cohen & Wygnanski Reference Cohen and Wygnanski1987a
,Reference Cohen and Wygnanski
b
; Drubka, Reisenthel & Nagib Reference Drubka, Reisenthel and Nagib1989; Raman, Rice & Reshotko Reference Raman, Rice and Reshotko1994). Past studies have shown that the
$m=\pm 1,\pm 2,\ldots$
) (Mattingly & Chang Reference Mattingly and Chang1974; Strange & Crighton Reference Strange and Crighton1983; Cohen & Wygnanski Reference Cohen and Wygnanski1987a
,Reference Cohen and Wygnanski
b
; Drubka, Reisenthel & Nagib Reference Drubka, Reisenthel and Nagib1989; Raman, Rice & Reshotko Reference Raman, Rice and Reshotko1994). Past studies have shown that the $m=0$
mode dominates the near field, while the helical modes become prominent towards the end of the potential core (Michalke Reference Michalke1984; Cohen & Wygnanski Reference Cohen and Wygnanski1987b
; Corke, Shakib & Nagib Reference Corke, Shakib and Nagib1991; Corke & Kusek Reference Corke and Kusek1993). These modes generate large-scale coherent structures that are distributed either axisymmetrically (for
$m=0$
mode dominates the near field, while the helical modes become prominent towards the end of the potential core (Michalke Reference Michalke1984; Cohen & Wygnanski Reference Cohen and Wygnanski1987b
; Corke, Shakib & Nagib Reference Corke, Shakib and Nagib1991; Corke & Kusek Reference Corke and Kusek1993). These modes generate large-scale coherent structures that are distributed either axisymmetrically (for $m=0$
) or non-axisymmetrically (for
$m=0$
) or non-axisymmetrically (for $m\neq 0$
) with respect to the jet centreline, and they drive the spatiotemporal dynamics of the jet, including its mixing and entrainment (Becker & Massaro Reference Becker and Massaro1968; Crow & Champagne Reference Crow and Champagne1971; Winant & Browand Reference Winant and Browand1974; Brown & Roshko Reference Brown and Roshko1974; Yule Reference Yule1978; Rogers & Moser Reference Rogers and Moser1992; Moser & Rogers Reference Moser and Rogers1993). While these structures enhance mass, momentum and heat transport, they can prove detrimental when coupled with other system modes.
$m\neq 0$
) with respect to the jet centreline, and they drive the spatiotemporal dynamics of the jet, including its mixing and entrainment (Becker & Massaro Reference Becker and Massaro1968; Crow & Champagne Reference Crow and Champagne1971; Winant & Browand Reference Winant and Browand1974; Brown & Roshko Reference Brown and Roshko1974; Yule Reference Yule1978; Rogers & Moser Reference Rogers and Moser1992; Moser & Rogers Reference Moser and Rogers1993). While these structures enhance mass, momentum and heat transport, they can prove detrimental when coupled with other system modes.
Most open jets are convectively unstable and therefore behave as spatial amplifiers of extrinsic perturbations through shear layers instabilities (Freymuth Reference Freymuth1966; Michalke Reference Michalke1984). However, when the jet density is sufficiently below that of its surroundings, a region of local absolute instability develops in the near field (Monkewitz & Sohn Reference Monkewitz and Sohn1988). If this region is sufficiently large, then global instability arises, transforming the jet from a spatial amplifier of extrinsic perturbations to a self-excited oscillator with $m=0$
axisymmetric oscillations at a discrete natural frequency (Sreenivasan, Raghu & Kyle Reference Sreenivasan, Raghu and Kyle1989; Yu & Monkewitz Reference Yu and Monkewitz1990; Monkewitz et al. Reference Monkewitz, Bechert, Barsikow and Lehmann1990; Kyle & Sreenivasan Reference Kyle and Sreenivasan1993; Jendoubi & Strykowski Reference Jendoubi and Strykowski1994; Chomaz Reference Chomaz2005; Lesshafft & Huerre Reference Lesshafft and Huerre2007; Coenen, Sevilla & Sánchez Reference Coenen, Sevilla and Sánchez2008; Lesshafft & Marquet Reference Lesshafft and Marquet2010; Srinivasan, Hallberg & Strykowski Reference Srinivasan, Hallberg and Strykowski2010; Coenen & Sevilla Reference Coenen and Sevilla2012). The onset of global instability in low-density axisymmetric jets is concomitant with the periodic roll-up of thin laminar shear layers into coherent vortical structures (Hallberg et al. Reference Hallberg, Srinivasan, Gorse and Strykowski2007), which advect downstream, grow, and undergo time-periodic vortex pairing through coalescence (Kyle & Sreenivasan Reference Kyle and Sreenivasan1993; Lesshafft, Huerre & Sagaut Reference Lesshafft, Huerre and Sagaut2007; Kushwaha et al. Reference Kushwaha, Worth, Dawson, Gupta and Li2022). Compared with convectively unstable jets, globally unstable jets are less sensitive to low-amplitude perturbations, but their dynamics can still be controlled through forced synchronisation using high-amplitude time-periodic forcing applied around their natural global frequency (Chomaz Reference Chomaz2005; Li & Juniper Reference Li and Juniper2013a
,Reference Li and Juniper
c
; Coenen et al. Reference Coenen, Lesshafft, Garnaud and Sevilla2017; Kushwaha et al. Reference Kushwaha, Worth, Dawson, Gupta and Li2022). Studies to date have primarily focused on axial forcing with only temporal measurements, leaving the spatiotemporal dynamics under axisymmetric and non-axisymmetric forcing largely unexplored.
$m=0$
axisymmetric oscillations at a discrete natural frequency (Sreenivasan, Raghu & Kyle Reference Sreenivasan, Raghu and Kyle1989; Yu & Monkewitz Reference Yu and Monkewitz1990; Monkewitz et al. Reference Monkewitz, Bechert, Barsikow and Lehmann1990; Kyle & Sreenivasan Reference Kyle and Sreenivasan1993; Jendoubi & Strykowski Reference Jendoubi and Strykowski1994; Chomaz Reference Chomaz2005; Lesshafft & Huerre Reference Lesshafft and Huerre2007; Coenen, Sevilla & Sánchez Reference Coenen, Sevilla and Sánchez2008; Lesshafft & Marquet Reference Lesshafft and Marquet2010; Srinivasan, Hallberg & Strykowski Reference Srinivasan, Hallberg and Strykowski2010; Coenen & Sevilla Reference Coenen and Sevilla2012). The onset of global instability in low-density axisymmetric jets is concomitant with the periodic roll-up of thin laminar shear layers into coherent vortical structures (Hallberg et al. Reference Hallberg, Srinivasan, Gorse and Strykowski2007), which advect downstream, grow, and undergo time-periodic vortex pairing through coalescence (Kyle & Sreenivasan Reference Kyle and Sreenivasan1993; Lesshafft, Huerre & Sagaut Reference Lesshafft, Huerre and Sagaut2007; Kushwaha et al. Reference Kushwaha, Worth, Dawson, Gupta and Li2022). Compared with convectively unstable jets, globally unstable jets are less sensitive to low-amplitude perturbations, but their dynamics can still be controlled through forced synchronisation using high-amplitude time-periodic forcing applied around their natural global frequency (Chomaz Reference Chomaz2005; Li & Juniper Reference Li and Juniper2013a
,Reference Li and Juniper
c
; Coenen et al. Reference Coenen, Lesshafft, Garnaud and Sevilla2017; Kushwaha et al. Reference Kushwaha, Worth, Dawson, Gupta and Li2022). Studies to date have primarily focused on axial forcing with only temporal measurements, leaving the spatiotemporal dynamics under axisymmetric and non-axisymmetric forcing largely unexplored.
Globally unstable jets exhibit modal complexity: they are globally unstable to the axisymmetric mode ( $m=0$
), but convectively unstable to the helical modes (
$m=0$
), but convectively unstable to the helical modes ( $m=\pm 1,\pm 2,\ldots$
) (Monkewitz & Sohn Reference Monkewitz and Sohn1988; Jendoubi & Strykowski Reference Jendoubi and Strykowski1994; Lesshafft & Huerre Reference Lesshafft and Huerre2007; Coenen et al. Reference Coenen, Sevilla and Sánchez2008). The
$m=\pm 1,\pm 2,\ldots$
) (Monkewitz & Sohn Reference Monkewitz and Sohn1988; Jendoubi & Strykowski Reference Jendoubi and Strykowski1994; Lesshafft & Huerre Reference Lesshafft and Huerre2007; Coenen et al. Reference Coenen, Sevilla and Sánchez2008). The $m=0$
mode dominates the self-excited behaviour, yet the helical modes remain susceptible to external perturbations. Transverse forcing can preferentially excite these helical modes, breaking the natural axisymmetry by altering the topology of the vortical structures (Urbin & Métais Reference Urbin and Métais1997; Suzuki, Kasagi & Suzuki Reference Suzuki, Kasagi and Suzuki2004; Worth et al. Reference Worth, Mistry, Berk and Dawson2020; Æsøy et al. Reference Æsøy, Aguilar, Worth and Dawson2021). This motivates the study of how different forcing orientations (i.e. axial versus transverse) influence the spatiotemporal dynamics of globally unstable jets via their distinct modal interactions.
$m=0$
mode dominates the self-excited behaviour, yet the helical modes remain susceptible to external perturbations. Transverse forcing can preferentially excite these helical modes, breaking the natural axisymmetry by altering the topology of the vortical structures (Urbin & Métais Reference Urbin and Métais1997; Suzuki, Kasagi & Suzuki Reference Suzuki, Kasagi and Suzuki2004; Worth et al. Reference Worth, Mistry, Berk and Dawson2020; Æsøy et al. Reference Æsøy, Aguilar, Worth and Dawson2021). This motivates the study of how different forcing orientations (i.e. axial versus transverse) influence the spatiotemporal dynamics of globally unstable jets via their distinct modal interactions.
In the present experimental study, we adopt a classical vortex dynamics approach to exploring the evolution of a globally unstable self-excited jet under axial and transverse acoustic forcing applied around its natural global frequency over a wide range of forcing amplitudes. Before presenting our methodology (§ 2) and results (§ 3), we briefly review the concepts of synchronisation and its suppression mechanisms (§ 1.1), discuss previous work on the axial (§ 1.2) and transverse (§ 1.3) forcing of axisymmetric jets, using examples with global instability whenever possible, and review the application of complex networks for the analysis of vortical structures (§ 1.4).
1.1. Forced synchronisation as an open-loop control strategy
Forced synchronisation, also known as lock-in in fluid mechanics, occurs when a self-excited system oscillating at its natural frequency $f_n$
synchronises with external forcing applied at frequency
$f_n$
synchronises with external forcing applied at frequency $f_{\!f}$
, which is necessarily different from
$f_{\!f}$
, which is necessarily different from $f_n$
(Pikovsky, Rosenblum & Kurths Reference Pikovsky, Rosenblum and Kurths2003; Balanov et al. Reference Balanov, Janson, Postnov and Sosnovtseva2008). At lock-in, the applied forcing dictates the overall dynamics of the self-excited system, with minimal signs of the natural mode at
$f_n$
(Pikovsky, Rosenblum & Kurths Reference Pikovsky, Rosenblum and Kurths2003; Balanov et al. Reference Balanov, Janson, Postnov and Sosnovtseva2008). At lock-in, the applied forcing dictates the overall dynamics of the self-excited system, with minimal signs of the natural mode at $f_n$
(Sreenivasan et al. Reference Sreenivasan, Raghu and Kyle1989; Kyle & Sreenivasan Reference Kyle and Sreenivasan1993). In recent years, this phenomenon has been exploited as an open-loop control strategy in various flow systems, including low-density jets (Sreenivasan et al. Reference Sreenivasan, Raghu and Kyle1989; Hallberg & Strykowski Reference Hallberg and Strykowski2008; Li & Juniper Reference Li and Juniper2013a
,
Reference Li and Juniperc
; Kushwaha et al. Reference Kushwaha, Worth, Dawson, Gupta and Li2022), jet diffusion flames (Juniper, Li & Nichols Reference Juniper, Li and Nichols2009; Li & Juniper Reference Li and Juniper2013b
; Balusamy et al. Reference Balusamy, Li, Han, Juniper and Hochgreb2015), cylinder wakes (Provansal, Mathis & Boyer Reference Provansal, Mathis and Boyer1987; Baek & Sung Reference Baek and Sung2000) and thermoacoustic devices (Guan et al. Reference Guan, Gupta, Wan and Li2019; Mondal, Pawar & Sujith Reference Mondal, Pawar and Sujith2019). Depending on the forcing conditions, external actuation can either suppress the oscillation amplitude – sometimes to less than
$f_n$
(Sreenivasan et al. Reference Sreenivasan, Raghu and Kyle1989; Kyle & Sreenivasan Reference Kyle and Sreenivasan1993). In recent years, this phenomenon has been exploited as an open-loop control strategy in various flow systems, including low-density jets (Sreenivasan et al. Reference Sreenivasan, Raghu and Kyle1989; Hallberg & Strykowski Reference Hallberg and Strykowski2008; Li & Juniper Reference Li and Juniper2013a
,
Reference Li and Juniperc
; Kushwaha et al. Reference Kushwaha, Worth, Dawson, Gupta and Li2022), jet diffusion flames (Juniper, Li & Nichols Reference Juniper, Li and Nichols2009; Li & Juniper Reference Li and Juniper2013b
; Balusamy et al. Reference Balusamy, Li, Han, Juniper and Hochgreb2015), cylinder wakes (Provansal, Mathis & Boyer Reference Provansal, Mathis and Boyer1987; Baek & Sung Reference Baek and Sung2000) and thermoacoustic devices (Guan et al. Reference Guan, Gupta, Wan and Li2019; Mondal, Pawar & Sujith Reference Mondal, Pawar and Sujith2019). Depending on the forcing conditions, external actuation can either suppress the oscillation amplitude – sometimes to less than $20\,\%$
of the unforced levels – through asynchronous quenching (Guan et al. Reference Guan, Gupta, Wan and Li2019; Mondal et al. Reference Mondal, Pawar and Sujith2019; Kushwaha et al. Reference Kushwaha, Worth, Dawson, Gupta and Li2022), or increase the amplitude through resonant amplification of the actuation signal (Keen & Fletcher Reference Keen and Fletcher1969; Abel, Ahnert & Bergweiler Reference Abel, Ahnert and Bergweiler2009; Guan et al. Reference Guan, Gupta, Wan and Li2019; Mondal et al. Reference Mondal, Pawar and Sujith2019; Kushwaha et al. Reference Kushwaha, Worth, Dawson, Gupta and Li2022). Collectively, these studies demonstrate that it is possible to manipulate the self-excited oscillations of globally unstable flows through a judicious choice of the applied forcing.
$20\,\%$
of the unforced levels – through asynchronous quenching (Guan et al. Reference Guan, Gupta, Wan and Li2019; Mondal et al. Reference Mondal, Pawar and Sujith2019; Kushwaha et al. Reference Kushwaha, Worth, Dawson, Gupta and Li2022), or increase the amplitude through resonant amplification of the actuation signal (Keen & Fletcher Reference Keen and Fletcher1969; Abel, Ahnert & Bergweiler Reference Abel, Ahnert and Bergweiler2009; Guan et al. Reference Guan, Gupta, Wan and Li2019; Mondal et al. Reference Mondal, Pawar and Sujith2019; Kushwaha et al. Reference Kushwaha, Worth, Dawson, Gupta and Li2022). Collectively, these studies demonstrate that it is possible to manipulate the self-excited oscillations of globally unstable flows through a judicious choice of the applied forcing.
It is worth noting that in globally unstable flows, the spatial location where velocity fluctuations reach maximum amplitude (the direct mode maximum) does not necessarily coincide with where the instability mechanism originates (the wavemaker region), nor does it identify the region most receptive to external forcing (Qadri, Chandler & Juniper Reference Qadri, Chandler and Juniper2018). The wavemaker region is determined by the overlap of the direct and adjoint modes (structural sensitivity), while receptivity is determined by the adjoint mode alone. Owing to convective amplification, the direct mode amplitude typically peaks downstream of the wavemaker region, a distinction that becomes important when interpreting spatially resolved measurements and when designing distributed control strategies (Lesshafft et al. Reference Lesshafft, Huerre, Sagaut and Terracol2006; Coenen et al. Reference Coenen, Lesshafft, Garnaud and Sevilla2017).
1.2. Response of jets to axial forcing
Axisymmetric jets generate large-scale coherent vortical structures in their near field (Becker & Massaro Reference Becker and Massaro1968; Brown & Roshko Reference Brown and Roshko1974; Laufer & Monkewitz Reference Laufer and Monkewitz1980). Axial forcing at the jet base controls the formation of these structures by influencing the vortex spacing and pairing dynamics (Crow & Champagne Reference Crow and Champagne1971; Zaman & Hussain Reference Zaman and Hussain1980; Hussain & Zaman Reference Hussain and Zaman1980; Ho & Huang Reference Ho and Huang1982; Gohil, Saha & Muralidhar Reference Gohil, Saha and Muralidhar2013; Boguslawski, Wawrzak & Tyliszczak Reference Boguslawski, Wawrzak and Tyliszczak2019). The forcing parameters impose distinct effects on vortex formation in convectively unstable jets. Specifically, higher forcing amplitudes produce larger vortex rings with enhanced circulation, while frequency variations control nonlinear phenomena such as vortex pairing and ring fragmentation (Aydemir, Worth & Dawson Reference Aydemir, Worth and Dawson2012; Gohil et al. Reference Gohil, Saha and Muralidhar2013). Previous studies (O’Connor & Lieuwen Reference O’Connor and Lieuwen2012a
; Lespinasse, Baillot & Boushaki Reference Lespinasse, Baillot and Boushaki2013; Malanoski et al. Reference Malanoski, Aguilar, Acharya and Lieuwen2013) have demonstrated that axial forcing preferentially excites the $m=0$
mode, resulting in axisymmetric roll-up of the shear layers into concentrated ring vortices. However, most studies have focused on convectively unstable jets, which respond to perturbations across a broad range of frequencies, whereas globally unstable jets exhibit fundamentally different responses.
$m=0$
mode, resulting in axisymmetric roll-up of the shear layers into concentrated ring vortices. However, most studies have focused on convectively unstable jets, which respond to perturbations across a broad range of frequencies, whereas globally unstable jets exhibit fundamentally different responses.
Recently, Kushwaha et al. (Reference Kushwaha, Worth, Dawson, Gupta and Li2022) investigated an axially forced globally unstable jet in the framework of synchronisation across a range of frequencies ( $0.8\leqslant f_{\!f}/f_n \leqslant 1.18$
) and amplitudes, revealing various nonlinear phenomena: (i) quasi-periodic behaviour when the jet is forced below the lock-in amplitude with its response at both
$0.8\leqslant f_{\!f}/f_n \leqslant 1.18$
) and amplitudes, revealing various nonlinear phenomena: (i) quasi-periodic behaviour when the jet is forced below the lock-in amplitude with its response at both $f_{\!f}$
and
$f_{\!f}$
and $f_n$
; (ii) a transition from quasi-periodic oscillations to periodic oscillations at
$f_n$
; (ii) a transition from quasi-periodic oscillations to periodic oscillations at $f_{\!f}$
when the forcing amplitude is above the critical lock-in threshold; (iii) an increase in the minimum forcing amplitude required for lock-in with an increase in frequency detuning, forming a V-shaped Arnold tongue centred at
$f_{\!f}$
when the forcing amplitude is above the critical lock-in threshold; (iii) an increase in the minimum forcing amplitude required for lock-in with an increase in frequency detuning, forming a V-shaped Arnold tongue centred at $f_{\!f}/f_n=1$
; (iv) synchronisation to
$f_{\!f}/f_n=1$
; (iv) synchronisation to $f_{\!f}$
via either a saddle-node bifurcation (the phase-locking route) or a torus-death bifurcation (the suppression route), depending on the proximity of
$f_{\!f}$
via either a saddle-node bifurcation (the phase-locking route) or a torus-death bifurcation (the suppression route), depending on the proximity of $f_{\!f}$
to
$f_{\!f}$
to $f_n$
(Li & Juniper Reference Li and Juniper2013a
). Similar synchronisation phenomena have been observed across other globally unstable flows, including low-density jets (Sreenivasan et al. Reference Sreenivasan, Raghu and Kyle1989; Hallberg & Strykowski Reference Hallberg and Strykowski2008), bluff-body wakes (Koopmann Reference Koopmann1967; Stansby Reference Stansby1976; Provansal et al. Reference Provansal, Mathis and Boyer1987; Van Atta & Gharib Reference Van Atta and Gharib1987; Karniadakis & Triantafyllou Reference Karniadakis and Triantafyllou1989), capillary jets (Olinger Reference Olinger1992), cross-flow jets (Davitian et al. Reference Davitian, Getsinger, Hendrickson and Karagozian2010a
,
Reference Davitian, Hendrickson, Getsinger, M’Closkey and Karagozianb
; Karagozian Reference Karagozian2010; Shoji et al. Reference Shoji, Harris, Besnard, Schein and Karagozian2020) and jet diffusion flames (Juniper et al. Reference Juniper, Li and Nichols2009; Li & Juniper Reference Li and Juniper2013b
). However, the spatiotemporal dynamics and coherent structure evolution during these nonlinear transitions remain largely unexplored.
$f_n$
(Li & Juniper Reference Li and Juniper2013a
). Similar synchronisation phenomena have been observed across other globally unstable flows, including low-density jets (Sreenivasan et al. Reference Sreenivasan, Raghu and Kyle1989; Hallberg & Strykowski Reference Hallberg and Strykowski2008), bluff-body wakes (Koopmann Reference Koopmann1967; Stansby Reference Stansby1976; Provansal et al. Reference Provansal, Mathis and Boyer1987; Van Atta & Gharib Reference Van Atta and Gharib1987; Karniadakis & Triantafyllou Reference Karniadakis and Triantafyllou1989), capillary jets (Olinger Reference Olinger1992), cross-flow jets (Davitian et al. Reference Davitian, Getsinger, Hendrickson and Karagozian2010a
,
Reference Davitian, Hendrickson, Getsinger, M’Closkey and Karagozianb
; Karagozian Reference Karagozian2010; Shoji et al. Reference Shoji, Harris, Besnard, Schein and Karagozian2020) and jet diffusion flames (Juniper et al. Reference Juniper, Li and Nichols2009; Li & Juniper Reference Li and Juniper2013b
). However, the spatiotemporal dynamics and coherent structure evolution during these nonlinear transitions remain largely unexplored.
1.3. Response of jets to transverse forcing
Only a handful of researchers, including O’Connor & Lieuwen (Reference O’Connor and Lieuwen2012) and Kushwaha et al. (Reference Kushwaha, Worth, Dawson, Gupta and Li2022), have experimentally explored the forced response of a globally unstable jet to pure transverse forcing. They applied transverse forcing by positioning the jet at the pressure node of planar acoustic standing waves, where antisymmetric perturbations selectively excite the odd- $m$
helical hydrodynamic modes (
$m$
helical hydrodynamic modes ( $m = \pm 1, \pm 3,\ldots$
) and induce transverse flapping motion through the superposition of counter-rotating
$m = \pm 1, \pm 3,\ldots$
) and induce transverse flapping motion through the superposition of counter-rotating $m = \pm 1$
modes of equal amplitude (O’Connor & Lieuwen Reference O’Connor and Lieuwen2012a
,
Reference O’Connor and Lieuwenb
; Smith et al. Reference Smith, Emerson, Proscia and Lieuwen2018)
$m = \pm 1$
modes of equal amplitude (O’Connor & Lieuwen Reference O’Connor and Lieuwen2012a
,
Reference O’Connor and Lieuwenb
; Smith et al. Reference Smith, Emerson, Proscia and Lieuwen2018)
O’Connor & Lieuwen (Reference O’Connor and Lieuwen2012) applied transverse forcing to a swirling annular jet wherein the global mode manifests as a central vortex breakdown bubble. While transverse forcing caused mode switching between $m=-1$
and
$m=-1$
and $m=-2$
by altering their relative amplitudes without affecting the axisymmetric
$m=-2$
by altering their relative amplitudes without affecting the axisymmetric $m=0$
mode, it did not give rise to lock-in or asynchronous/synchronous quenching, even at higher forcing amplitudes. In contrast to swirling jets, Kushwaha et al. (Reference Kushwaha, Worth, Dawson, Gupta and Li2022) demonstrated that transverse forcing of a globally unstable axisymmetric jet leads to fundamentally different behaviour: (i) a transition from a periodic state to a quasi-periodic state at low amplitudes; and (ii) when forced above a critical amplitude, a transition from quasi-periodicity to lock-in via the suppression route, regardless of the proximity of
$m=0$
mode, it did not give rise to lock-in or asynchronous/synchronous quenching, even at higher forcing amplitudes. In contrast to swirling jets, Kushwaha et al. (Reference Kushwaha, Worth, Dawson, Gupta and Li2022) demonstrated that transverse forcing of a globally unstable axisymmetric jet leads to fundamentally different behaviour: (i) a transition from a periodic state to a quasi-periodic state at low amplitudes; and (ii) when forced above a critical amplitude, a transition from quasi-periodicity to lock-in via the suppression route, regardless of the proximity of $f_{\!f}$
to
$f_{\!f}$
to $f_n$
. Unlike that of a swirling jet, transverse forcing of an axisymmetric jet disrupts the natural axisymmetry, yielding substantial amplitude reduction via asynchronous quenching without resonant amplification. These contrasting responses highlight how the forcing symmetry influences the modal excitation and nonlinear dynamics that depend critically on the jet configuration.
$f_n$
. Unlike that of a swirling jet, transverse forcing of an axisymmetric jet disrupts the natural axisymmetry, yielding substantial amplitude reduction via asynchronous quenching without resonant amplification. These contrasting responses highlight how the forcing symmetry influences the modal excitation and nonlinear dynamics that depend critically on the jet configuration.
Over the past few years, Lieuwen and co-workers (O’Connor et al. Reference O’Connor, Natarajan, Malanoski and Lieuwen2010, Reference O’Connor, Acharya and Lieuwen2015; O’Connor & Lieuwen Reference O’Connor and Lieuwen2011, Reference O’Connor and Lieuwen2012a , Reference O’Connor and Lieuwenb ; Blimbaum et al. Reference Blimbaum, Zanchetta, Akin, Acharya, O’Connor, Noble and Lieuwen2012; Malanoski et al. Reference Malanoski, Aguilar, Acharya and Lieuwen2013; Smith et al. Reference Smith, Emerson, Proscia and Lieuwen2018; Acharya & Lieuwen Reference Acharya and Lieuwen2018) and several other researchers, including Parekh, Leonard & Reynolds (Reference Parekh, Leonard and Reynolds1988), Corke & Kusek (Reference Corke and Kusek1993), Da Silva & Métais (Reference Da Silva and Métais2002), Reynolds et al. (Reference Reynolds, Parekh, Juvet and Lee2003), Sadeghi & Pollard (Reference Sadeghi and Pollard2012), Tyliszczak & Geurts (Reference Tyliszczak and Geurts2014) and Gohil, Saha & Muralidhar (Reference Gohil, Saha and Muralidhar2015), have extensively studied the effects of transverse forcing on the mixing, entrainment and spreading characteristics of convectively unstable jets and flames. Unlike globally unstable jets, convectively unstable jets act as spatial amplifiers, making their coherent structures readily susceptible to external forcing (Urbin & Métais Reference Urbin and Métais1997; Danaila & Boersma Reference Danaila and Boersma2000; Worth et al. Reference Worth, Mistry, Berk and Dawson2020; Douglas et al. Reference Douglas, Emerson, Hemchandra and Lieuwen2021), including combinations of axial and transverse forcing applied at a common frequency (Æsøy et al. Reference Æsøy, Aguilar, Worth and Dawson2021) or at two distinct frequencies (Da Silva & Métais Reference Da Silva and Métais2002). These studies collectively indicate that transverse forcing induces out-of-phase roll-up of the shear layers on both sides of the jet centreline, resulting in the formation of staggered vortical structures in the near field (Hauser, Lorenz & Sattelmayer Reference Hauser, Lorenz and Sattelmayer2010; O’Connor & Lieuwen Reference O’Connor and Lieuwen2012; Saurabh & Paschereit Reference Saurabh and Paschereit2017, Reference Saurabh and Paschereit2018; Saurabh, Moeck & Paschereit Reference Saurabh, Moeck and Paschereit2017). Most non-axisymmetric forcing studies (Juniper Reference Juniper2012; O’Connor & Lieuwen Reference O’Connor and Lieuwen2012; Tammisola & Juniper Reference Tammisola and Juniper2016) have focused on convectively unstable jets, leaving the effects of transverse forcing on globally unstable jets largely unexplored.
1.4. Complex network analysis of vortical structures
The vortical structures in the near field of a jet nonlinearly interact during vortex merging. These dynamics are influenced by the spatial symmetry of external forcing. Network-based analysis can aid in characterising these interactions through complex networks, in which nodes represent vortical structures and edges represent their interactions (Nair & Taira Reference Nair and Taira2015; Krishnan et al. Reference Krishnan, Sujith, Marwan and Kurths2021). This approach has been applied across various scientific disciplines to uncover insights into the collective behaviour of complex systems. Recent applications include epidemics (Morris Reference Morris1993; Lloyd-Smith et al. Reference Lloyd-Smith, Schreiber, Kopp and Getz2005), climatology (Tsonis & Roebber Reference Tsonis and Roebber2004; Donges et al. Reference Donges, Zou, Marwan and Kurths2009, Reference Donges, Petrova, Loew, Marwan and Kurths2015), sociology (Arenas et al. Reference Arenas, Díaz-Guilera, Kurths, Moreno and Zhou2008), economics (Namatame, Kaizouji & Aruka Reference Namatame, Kaizouji and Aruka2006), thermoacoustics (Murugesan & Sujith Reference Murugesan and Sujith2015; Murayama et al. Reference Murayama, Kinugawa, Tokuda and Gotoda2018; Krishnan et al. Reference Krishnan, Sujith, Marwan and Kurths2021; Guan et al. Reference Guan, Moon, Kim and Li2022; Tandon & Sujith Reference Tandon and Sujith2023) and hydrodynamics (Nair & Taira Reference Nair and Taira2017; Iacobello et al. Reference Iacobello, Scarsoglio, Kuerten and Ridolfi2018; Meena, Nair & Taira Reference Meena, Nair and Taira2018; Nair, Brunton & Taira Reference Nair, Brunton and Taira2018). Using the framework of network-based analysis, Nair & Taira (Reference Nair and Taira2015) and Krishnan et al. (Reference Krishnan, Sujith, Marwan and Kurths2021) have demonstrated that targeting the primary hub vortices can provide an effective means of controlling the flow dynamics and suppressing self-excited instabilities. In the present study, we use the Biot–Savart law to construct time-resolved weighted spatial networks, with the aim of uncovering any hidden spatiotemporal patterns in the near field and exploring how vortical networks yield distinct dynamics under different forcing conditions.
1.5. Contributions of the present study
It is now well known that globally unstable axisymmetric jets exhibit periodic vortex formation at their natural frequency $f_n$
. When axially forced, these jets undergo forced synchronisation, and can experience substantial amplitude reduction through asynchronous quenching when
$f_n$
. When axially forced, these jets undergo forced synchronisation, and can experience substantial amplitude reduction through asynchronous quenching when $f_{\!f}$
deviates sufficiently from
$f_{\!f}$
deviates sufficiently from $f_n$
. Although these nonlinear transitions are well-characterised, the underlying spatiotemporal evolution of the coherent structures remains largely unexplored. Furthermore, the influence of transverse forcing on globally unstable jets and the resulting topological variations in their vortical structures have received limited attention compared to the influence of axial forcing. To address these knowledge gaps, we use time-resolved particle image velocimetry (PIV) to investigate the spatiotemporal dynamics of a globally unstable jet under axial and transverse acoustic forcing. Specifically, we aim to answer the following research questions.
$f_n$
. Although these nonlinear transitions are well-characterised, the underlying spatiotemporal evolution of the coherent structures remains largely unexplored. Furthermore, the influence of transverse forcing on globally unstable jets and the resulting topological variations in their vortical structures have received limited attention compared to the influence of axial forcing. To address these knowledge gaps, we use time-resolved particle image velocimetry (PIV) to investigate the spatiotemporal dynamics of a globally unstable jet under axial and transverse acoustic forcing. Specifically, we aim to answer the following research questions.
-
(i) While axial forcing can either amplify or attenuate oscillations depending on the frequency detuning, transverse forcing consistently suppresses oscillations through asynchronous quenching. What are the underlying physical mechanisms responsible for the distinct amplitude responses observed under axial versus transverse forcing?
-
(ii) How does the spatiotemporal evolution of vortical structures differ between axial and transverse forcing as the jet transitions through different dynamical states? Specifically, how do different forcing symmetries and amplitudes affect vortex formation and the spatial organisation of coherent structures during transitions from an unforced periodic state through quasi-periodicity to forced synchronisation at lock-in?
-
(iii) How do different forcing orientations redistribute energy among the modal structures and modify the vortical interaction patterns to influence the global flow response?
2. Experimental methodology
2.1. Jet set-up and characterisation
The experimental set-up consists of two primary components: (i) a hydrodynamic system that generates a globally unstable axisymmetric jet, and (ii) a rectangular enclosure housing the acoustic forcing system. The coordinate system defines the streamwise, transverse (radial) and cross-stream directions as $x$
,
$x$
, $y$
and
$y$
and $z$
, respectively, as shown in figure 1. The hydrodynamic system comprises an axisymmetric convergent nozzle (exit diameter
$z$
, respectively, as shown in figure 1. The hydrodynamic system comprises an axisymmetric convergent nozzle (exit diameter $D = 6$
mm) with an upstream settling chamber equipped with a honeycomb flow straightener. Pure helium is supplied from a compressed gas cylinder and regulated using a mass flow controller (Alicat MCR-500), producing a low-density jet with density ratio
$D = 6$
mm) with an upstream settling chamber equipped with a honeycomb flow straightener. Pure helium is supplied from a compressed gas cylinder and regulated using a mass flow controller (Alicat MCR-500), producing a low-density jet with density ratio $S \equiv \rho _{\!j}/\rho _{\infty } = 0.14$
, which is sufficiently below the upper limit for global instability (Monkewitz et al. Reference Monkewitz, Bechert, Barsikow and Lehmann1990; Kyle & Sreenivasan Reference Kyle and Sreenivasan1993). The nozzle features an area contraction ratio of 34 : 1, with its wall profile defined by a fifth-order polynomial to prevent flow separation. The nozzle outlet protrudes
$S \equiv \rho _{\!j}/\rho _{\infty } = 0.14$
, which is sufficiently below the upper limit for global instability (Monkewitz et al. Reference Monkewitz, Bechert, Barsikow and Lehmann1990; Kyle & Sreenivasan Reference Kyle and Sreenivasan1993). The nozzle features an area contraction ratio of 34 : 1, with its wall profile defined by a fifth-order polynomial to prevent flow separation. The nozzle outlet protrudes $1.67D$
into the enclosure to minimise wall effects, and can be repositioned along the transverse direction to adjust the jet position relative to the acoustic standing wave.
$1.67D$
into the enclosure to minimise wall effects, and can be repositioned along the transverse direction to adjust the jet position relative to the acoustic standing wave.
Schematic of the experimental set-up, whose key components consist of a nozzle with exit diameter 6 mm, a rectangular enclosure of dimensions $L \times W \times H =0.96 \times 0.22 \times 0.59\ \text{m}^3$
in which a standing wave acoustic field is set up, and a pair of loudspeakers fitted with resonance tubes mounted on the movable end-walls of the enclosure. The measurement diagnostics include a high-speed Nd:YLF laser, a set of sheet-forming optics, a pair of high-speed monochrome cameras, and four microphones mounted on the side-walls of the enclosure. MFC: mass flow controller. DAQ: data acquisition system.
$L \times W \times H =0.96 \times 0.22 \times 0.59\ \text{m}^3$
in which a standing wave acoustic field is set up, and a pair of loudspeakers fitted with resonance tubes mounted on the movable end-walls of the enclosure. The measurement diagnostics include a high-speed Nd:YLF laser, a set of sheet-forming optics, a pair of high-speed monochrome cameras, and four microphones mounted on the side-walls of the enclosure. MFC: mass flow controller. DAQ: data acquisition system.

Before examining the jet dynamics, we first characterise the velocity field using hot-wire anemometry (HWA) across Reynolds numbers $700 \leqslant \textit{Re} \equiv U_{\!j}\rho _{\!j}D/\mu _{\!j}\leqslant 3990$
, where
$700 \leqslant \textit{Re} \equiv U_{\!j}\rho _{\!j}D/\mu _{\!j}\leqslant 3990$
, where $U_{\!j}$
,
$U_{\!j}$
, $\rho _{\!j}$
and
$\rho _{\!j}$
and $\mu _{\!j}$
are the jet centreline velocity, density and dynamic viscosity, respectively. We acquire the time-averaged streamwise velocity and its local fluctuations as functions of radial position at
$\mu _{\!j}$
are the jet centreline velocity, density and dynamic viscosity, respectively. We acquire the time-averaged streamwise velocity and its local fluctuations as functions of radial position at $x/D \approx 0.1$
. Figure 2(a) shows radial profiles of the normalised time-averaged streamwise velocity
$x/D \approx 0.1$
. Figure 2(a) shows radial profiles of the normalised time-averaged streamwise velocity $\overline {u}/\overline {u}_{\textit{max}}$
, revealing a top-hat profile characterised by thin shear layers. While these velocity profiles contribute to a quiet mean flow, sufficiently weak velocity fluctuations in the jet core (
$\overline {u}/\overline {u}_{\textit{max}}$
, revealing a top-hat profile characterised by thin shear layers. While these velocity profiles contribute to a quiet mean flow, sufficiently weak velocity fluctuations in the jet core ( $u_{\textit{rms}}/\overline {u} \lt 0.35 \,\%$
), as observed in figure 2(b), indicate that the shear layers are laminar (Hallberg & Strykowski Reference Hallberg and Strykowski2006). This flow state facilitates the detection of global instability at low
$u_{\textit{rms}}/\overline {u} \lt 0.35 \,\%$
), as observed in figure 2(b), indicate that the shear layers are laminar (Hallberg & Strykowski Reference Hallberg and Strykowski2006). This flow state facilitates the detection of global instability at low $\textit{Re}$
, restricting amplification of inherent disturbances by convective modes (Hallberg et al. Reference Hallberg, Srinivasan, Gorse and Strykowski2007). The transverse curvature
$\textit{Re}$
, restricting amplification of inherent disturbances by convective modes (Hallberg et al. Reference Hallberg, Srinivasan, Gorse and Strykowski2007). The transverse curvature $D/\theta _0$
, which is an inverse non-dimensional form of the momentum thickness of the initial shear layers
$D/\theta _0$
, which is an inverse non-dimensional form of the momentum thickness of the initial shear layers $\theta _0$
, scales linearly with
$\theta _0$
, scales linearly with $\sqrt {\textit{Re}}$
, as per figure 2(c). This linear dependence suggests that the initial shear layers are indeed laminar (Kyle & Sreenivasan Reference Kyle and Sreenivasan1993; Hallberg & Strykowski Reference Hallberg and Strykowski2006), aiding the detection of global instability.
$\sqrt {\textit{Re}}$
, as per figure 2(c). This linear dependence suggests that the initial shear layers are indeed laminar (Kyle & Sreenivasan Reference Kyle and Sreenivasan1993; Hallberg & Strykowski Reference Hallberg and Strykowski2006), aiding the detection of global instability.
Characterisation of the flow: (a) normalised time-averaged streamwise velocity and (b) its local fluctuation, both as functions of the radial position. (c) Transverse curvature as a function of the square root of $\textit{Re}$
. (d) Normalised amplitude and (e) PSD of the HWA velocity fluctuations in the unforced jet across a range of
$\textit{Re}$
. (d) Normalised amplitude and (e) PSD of the HWA velocity fluctuations in the unforced jet across a range of $\textit{Re}$
, with (e) showing the forward path only. The selected operating point (regime IV,
$\textit{Re}$
, with (e) showing the forward path only. The selected operating point (regime IV, $\textit{Re} = 800$
) corresponds to conditions where the jet is dominated by global hydrodynamic instability, producing self-excited axisymmetric oscillations (
$\textit{Re} = 800$
) corresponds to conditions where the jet is dominated by global hydrodynamic instability, producing self-excited axisymmetric oscillations ( $m = 0$
) as confirmed by schlieren visualisation (see inset). Measurements were acquired using a hot-wire anemometer (Dantec 55P11) positioned at
$m = 0$
) as confirmed by schlieren visualisation (see inset). Measurements were acquired using a hot-wire anemometer (Dantec 55P11) positioned at $x/D \approx 0.1$
, as per our previous work (Kushwaha et al. Reference Kushwaha, Worth, Dawson, Gupta and Li2022), establishing the baseline flow characteristics for subsequent forcing experiments.
$x/D \approx 0.1$
, as per our previous work (Kushwaha et al. Reference Kushwaha, Worth, Dawson, Gupta and Li2022), establishing the baseline flow characteristics for subsequent forcing experiments.

The rectangular enclosure (length $L = 0.96{-}1.35$
m, width
$L = 0.96{-}1.35$
m, width $W = 0.22$
m, height
$W = 0.22$
m, height $H = 0.59$
m) is used to generate planar transverse acoustic standing waves through two loudspeakers mounted at either end. The adjustable length of the enclosure enables resonance between the chamber acoustics and the loudspeaker forcing at a specified frequency:
$H = 0.59$
m) is used to generate planar transverse acoustic standing waves through two loudspeakers mounted at either end. The adjustable length of the enclosure enables resonance between the chamber acoustics and the loudspeaker forcing at a specified frequency: $0.8\lt f_{\!f}/f_n\lt 1.18$
. A signal generator (Aim-TTi TGA1244) connected to power amplifiers (200 W Crown CE1000) drives the two loudspeakers (Monacor KU-516) to produce the desired acoustic forcing. The loudspeakers are fitted with resonance tubes mounted on the movable end-walls of the enclosure. We apply both axial and transverse forcing at
$0.8\lt f_{\!f}/f_n\lt 1.18$
. A signal generator (Aim-TTi TGA1244) connected to power amplifiers (200 W Crown CE1000) drives the two loudspeakers (Monacor KU-516) to produce the desired acoustic forcing. The loudspeakers are fitted with resonance tubes mounted on the movable end-walls of the enclosure. We apply both axial and transverse forcing at $f_{\!f}/f_n = 1.09$
across a wide range of forcing amplitudes. Four flush-mounted microphones (Brüel and Kjær 4939-A-011), installed along the side-wall of the enclosure, capture the pressure field, enabling reconstruction of the acoustic mode shape using the multiple microphone method, which estimates the magnitudes of the incident (
$f_{\!f}/f_n = 1.09$
across a wide range of forcing amplitudes. Four flush-mounted microphones (Brüel and Kjær 4939-A-011), installed along the side-wall of the enclosure, capture the pressure field, enabling reconstruction of the acoustic mode shape using the multiple microphone method, which estimates the magnitudes of the incident ( $p_i$
) and reflected (
$p_i$
) and reflected ( $p_r$
) plane waves (Jang & Ih Reference Jang and Ih1998). The quality of the standing wave generated can be quantified by the spin ratio
$p_r$
) plane waves (Jang & Ih Reference Jang and Ih1998). The quality of the standing wave generated can be quantified by the spin ratio $\textit{SR} = (|p_i| - |p_r|)/(|p_i| + |p_r|)$
, where
$\textit{SR} = (|p_i| - |p_r|)/(|p_i| + |p_r|)$
, where $\textit{SR} \rightarrow 0$
indicates a perfect standing wave (Bourgouin et al. Reference Bourgouin, Durox, Moeck, Schuller and Candel2013). In our experiments, a high-quality standing wave is consistently maintained with
$\textit{SR} \rightarrow 0$
indicates a perfect standing wave (Bourgouin et al. Reference Bourgouin, Durox, Moeck, Schuller and Candel2013). In our experiments, a high-quality standing wave is consistently maintained with $\textit{SR} = \pm 0.01$
. Pure axial and pure transverse forcing are achieved by positioning the jet nozzle at the pressure antinode and pressure node of the standing wave, respectively. The nozzle position relative to the acoustic mode shape is adjusted by moving both end-walls in the same direction, while maintaining a constant enclosure length, ensuring that the acoustic resonance condition is preserved.
$\textit{SR} = \pm 0.01$
. Pure axial and pure transverse forcing are achieved by positioning the jet nozzle at the pressure antinode and pressure node of the standing wave, respectively. The nozzle position relative to the acoustic mode shape is adjusted by moving both end-walls in the same direction, while maintaining a constant enclosure length, ensuring that the acoustic resonance condition is preserved.
2.2. Natural jet dynamics
Before examining the spatiotemporal dynamics of the forced jet, we first identify an operational state for applying external forcing. This involves systematically varying $\textit{Re}$
and searching for potential hysteresis and bistability regimes. Figures 2(d) and 2(e) show the amplitude and power spectral density (PSD) of the HWA velocity fluctuations in the unforced jet at different
$\textit{Re}$
and searching for potential hysteresis and bistability regimes. Figures 2(d) and 2(e) show the amplitude and power spectral density (PSD) of the HWA velocity fluctuations in the unforced jet at different $\textit{Re}$
values. The jet amplitude is defined as the root mean square velocity fluctuation normalised by the time-averaged velocity:
$\textit{Re}$
values. The jet amplitude is defined as the root mean square velocity fluctuation normalised by the time-averaged velocity: $\gamma _{\textit{rms}}/\overline {\gamma }$
. By examining the jet amplitude and PSD, we uncover four distinct jet regimes.
$\gamma _{\textit{rms}}/\overline {\gamma }$
. By examining the jet amplitude and PSD, we uncover four distinct jet regimes.
In regime I ( $148 \lt \textit{Re} \lt 400$
), the jet is globally stable but convectively unstable, as indicated by the low oscillation amplitudes in figure 2(d) and a lack of a distinct spectral peak in figure 2(e). This suggests that the amplification of background disturbances by local convective modes is insufficient to overcome the stabilising effect of viscosity.
$148 \lt \textit{Re} \lt 400$
), the jet is globally stable but convectively unstable, as indicated by the low oscillation amplitudes in figure 2(d) and a lack of a distinct spectral peak in figure 2(e). This suggests that the amplification of background disturbances by local convective modes is insufficient to overcome the stabilising effect of viscosity.
In regime II ( $400 \lt \textit{Re} \lt 562$
), the jet exhibits hysteresis: as
$400 \lt \textit{Re} \lt 562$
), the jet exhibits hysteresis: as $\textit{Re}$
increases along the forward path, the jet amplitude exhibits an abrupt increase (figure 2
d) at a critical Reynolds number (
$\textit{Re}$
increases along the forward path, the jet amplitude exhibits an abrupt increase (figure 2
d) at a critical Reynolds number ( $\textit{Re} = 474$
), coinciding with the emergence of a sharp peak in the PSD (figure 2
e). This marks a sudden transition from a globally stable state (a fixed-point attractor) to a globally unstable state (a self-excited limit cycle). Conversely, along the backward path achieved by decreasing
$\textit{Re} = 474$
), coinciding with the emergence of a sharp peak in the PSD (figure 2
e). This marks a sudden transition from a globally stable state (a fixed-point attractor) to a globally unstable state (a self-excited limit cycle). Conversely, along the backward path achieved by decreasing $\textit{Re}$
, the jet remains globally unstable throughout the entire regime; the PSD depicted in figure 2(e) pertains to the forward path only. These differences between the forward and backward paths are indicative of a subcritical Hopf bifurcation.
$\textit{Re}$
, the jet remains globally unstable throughout the entire regime; the PSD depicted in figure 2(e) pertains to the forward path only. These differences between the forward and backward paths are indicative of a subcritical Hopf bifurcation.
In regime III ( $562 \lt \textit{Re} \lt 695$
), the jet amplitude initially rises sharply before decreasing as
$562 \lt \textit{Re} \lt 695$
), the jet amplitude initially rises sharply before decreasing as $\textit{Re}$
increases, while the dominant frequency in the PSD remains relatively constant. This non-monotonic amplitude behaviour suggests that the global hydrodynamic mode of the jet has synchronised with the natural acoustic mode of the nozzle. This hydroacoustic resonance at a fixed Helmholtz number renders this regime unsuitable for forcing experiments, as the jet dynamics is no longer governed by global hydrodynamic instability alone.
$\textit{Re}$
increases, while the dominant frequency in the PSD remains relatively constant. This non-monotonic amplitude behaviour suggests that the global hydrodynamic mode of the jet has synchronised with the natural acoustic mode of the nozzle. This hydroacoustic resonance at a fixed Helmholtz number renders this regime unsuitable for forcing experiments, as the jet dynamics is no longer governed by global hydrodynamic instability alone.
In regime IV ( $695 \lt \textit{Re} \lt 888$
), the jet amplitude and frequency resume increasing trends with further increases in
$695 \lt \textit{Re} \lt 888$
), the jet amplitude and frequency resume increasing trends with further increases in $\textit{Re}$
, indicating that the global hydrodynamic mode is no longer synchronised with the nozzle acoustic modes. In regimes II and IV, the dominant frequency scales with
$\textit{Re}$
, indicating that the global hydrodynamic mode is no longer synchronised with the nozzle acoustic modes. In regimes II and IV, the dominant frequency scales with $\textit{Re}$
, a trend consistent with the viscous diffusion time scaling proposed by Hallberg & Strykowski (Reference Hallberg and Strykowski2006).
$\textit{Re}$
, a trend consistent with the viscous diffusion time scaling proposed by Hallberg & Strykowski (Reference Hallberg and Strykowski2006).
2.3. Stereoscopic PIV
We perform planar time-resolved stereoscopic PIV measurements to examine the spatiotemporal dynamics of the jet. The system comprises a high-speed Nd:YLF laser (LDY303HE-PIV) operating at 527 nm wavelength with 5 $\text{mJ}\ \text{pulse}^{-1}$
energy at 10 kHz repetition rate, sheet-forming optics (Thorlabs), and two high-speed monochrome cameras (Photron FASTCAM SA1.1) with maximum frame rate 5.1 kHz at 1 megapixel resolution. Both cameras are equipped with Scheimpflug adapters and 180 mm lenses, with optical axes positioned
$\text{mJ}\ \text{pulse}^{-1}$
energy at 10 kHz repetition rate, sheet-forming optics (Thorlabs), and two high-speed monochrome cameras (Photron FASTCAM SA1.1) with maximum frame rate 5.1 kHz at 1 megapixel resolution. Both cameras are equipped with Scheimpflug adapters and 180 mm lenses, with optical axes positioned $12.5^\circ$
relative to the measurement plane normal for stereoscopic reconstruction. The measurement plane bisects the nozzle in the
$12.5^\circ$
relative to the measurement plane normal for stereoscopic reconstruction. The measurement plane bisects the nozzle in the $x$
–
$x$
– $y$
plane, illuminated by a laser sheet of 1 mm thickness. Both the ambient air in the enclosure and the jet flow are seeded with olive oil droplets produced by a Laskin nozzle, ensuring sufficient particle density throughout the measurement domain.
$y$
plane, illuminated by a laser sheet of 1 mm thickness. Both the ambient air in the enclosure and the jet flow are seeded with olive oil droplets produced by a Laskin nozzle, ensuring sufficient particle density throughout the measurement domain.
We acquire time-resolved image pairs at $768 \times 512$
pixel resolution and
$768 \times 512$
pixel resolution and $5442$
Hz frame rate, capturing six instantaneous snapshots per forcing cycle. The inter-frame time delay is set to
$5442$
Hz frame rate, capturing six instantaneous snapshots per forcing cycle. The inter-frame time delay is set to $\delta t = 12$
microseconds, maintaining a maximum pixel displacement below 7 pixels. The recorded images span a field of view
$\delta t = 12$
microseconds, maintaining a maximum pixel displacement below 7 pixels. The recorded images span a field of view $4.44D \times 2.96D$
, with
$4.44D \times 2.96D$
, with $4000$
image pairs acquired at each experimental condition. Image processing is performed using DaVis 8.2.2 software (LaVision) following established protocols. Initially, a self-calibration routine corrects any misalignment between the laser sheet and calibration plate. Next, the image pairs are preprocessed using a sliding background subtraction filter with a 32 pixel kernel and a particle intensity normalisation filter with an 8 pixel filter kernel to enhance particle contrast and reduce background noise. Velocity vectors are computed using multi-pass stereo cross-correlation: an initial pass with
$4000$
image pairs acquired at each experimental condition. Image processing is performed using DaVis 8.2.2 software (LaVision) following established protocols. Initially, a self-calibration routine corrects any misalignment between the laser sheet and calibration plate. Next, the image pairs are preprocessed using a sliding background subtraction filter with a 32 pixel kernel and a particle intensity normalisation filter with an 8 pixel filter kernel to enhance particle contrast and reduce background noise. Velocity vectors are computed using multi-pass stereo cross-correlation: an initial pass with $64 \times 64$
pixel interrogation windows with square weighting,
$64 \times 64$
pixel interrogation windows with square weighting, $50 \,\%$
overlap, followed by two refinement passes with
$50 \,\%$
overlap, followed by two refinement passes with $32 \times 32$
pixel windows with elliptical 2 : 1 weighting,
$32 \times 32$
pixel windows with elliptical 2 : 1 weighting, $75 \,\%$
overlap. The final interrogation window dimensions correspond to
$75 \,\%$
overlap. The final interrogation window dimensions correspond to $1.11 \times 1.11$
mm
$1.11 \times 1.11$
mm $^2$
in physical coordinates. Each subsequent pass uses the velocity estimates from the previous iteration to improve the accuracy of the final vector field through a refinement process. Upon completion of the cross-correlation analysis, velocity vectors undergo post-processing through vector validation routines incorporating three rejection criteria: (i) velocity vectors exceeding 30 m s
$^2$
in physical coordinates. Each subsequent pass uses the velocity estimates from the previous iteration to improve the accuracy of the final vector field through a refinement process. Upon completion of the cross-correlation analysis, velocity vectors undergo post-processing through vector validation routines incorporating three rejection criteria: (i) velocity vectors exceeding 30 m s $^{-1}$
are discarded as unphysical; (ii) a median filter removes spurious vectors whose root-mean-square magnitude exceeds twice the local neighbourhood average; and (iii) isolated clusters containing more than five erroneous vectors are eliminated. These validation procedures collectively result in the rejection of fewer than
$^{-1}$
are discarded as unphysical; (ii) a median filter removes spurious vectors whose root-mean-square magnitude exceeds twice the local neighbourhood average; and (iii) isolated clusters containing more than five erroneous vectors are eliminated. These validation procedures collectively result in the rejection of fewer than $6 \,\%$
of total vectors, with empty locations subsequently filled through interpolation using neighbouring data points. The final velocity fields have spatial resolution
$6 \,\%$
of total vectors, with empty locations subsequently filled through interpolation using neighbouring data points. The final velocity fields have spatial resolution $\Delta x = \Delta y = 0.046D$
, yielding
$\Delta x = \Delta y = 0.046D$
, yielding $4000$
instantaneous vector fields per experimental condition. These velocity measurements yield three orthogonal components
$4000$
instantaneous vector fields per experimental condition. These velocity measurements yield three orthogonal components $u$
,
$u$
, $v$
and
$v$
and $w$
corresponding to the streamwise (
$w$
corresponding to the streamwise ( $x$
), transverse (
$x$
), transverse ( $y$
) and cross-steam (
$y$
) and cross-steam ( $z$
) directions, respectively. The magnitude of the total velocity vector is given by
$z$
) directions, respectively. The magnitude of the total velocity vector is given by $V \equiv |U(x,y,z)| = \sqrt {u^2+v^2+w^2}$
.
$V \equiv |U(x,y,z)| = \sqrt {u^2+v^2+w^2}$
.
2.4. Triple decomposition for phase-resolved analysis
Following Hussain & Reynolds (Reference Hussain and Reynolds1970), we decompose the instantaneous velocity field $U(x,y,t)$
into three components,
$U(x,y,t)$
into three components, $U(x,y,t) = \overline {U}(x,y) + \tilde {U}^\prime (x,y,\phi (t)) + U^{\prime \prime }(x,y,t)$
, where
$U(x,y,t) = \overline {U}(x,y) + \tilde {U}^\prime (x,y,\phi (t)) + U^{\prime \prime }(x,y,t)$
, where $\overline {U}(x,y) = (\overline {u},\overline {v})$
denotes the time-averaged mean,
$\overline {U}(x,y) = (\overline {u},\overline {v})$
denotes the time-averaged mean, $\tilde {U}^\prime (x,y,\phi (t))$
denotes phase-coherent fluctuations,
$\tilde {U}^\prime (x,y,\phi (t))$
denotes phase-coherent fluctuations, $U^{\prime \prime }(x,y,t)$
denotes phase-incoherent random fluctuations, and
$U^{\prime \prime }(x,y,t)$
denotes phase-incoherent random fluctuations, and $\phi (t)$
is the instantaneous phase of the periodic fluctuations. The phase-averaged velocity field, computed as
$\phi (t)$
is the instantaneous phase of the periodic fluctuations. The phase-averaged velocity field, computed as $U^{\!p}(x,y,\phi (t))= \overline {U}(x,y)+\tilde {U}^\prime (x,y,\phi (t))$
, isolates the coherent structures associated with the global mode while suppressing phase jitter induced by small-scale turbulence. This approach effectively highlights the dominant phase-locked dynamics in the near field of the jet. While phase-averaged fields are readily obtained for purely periodic oscillations, complexities arise under quasi-periodicity where the jet evolves at multiple incommensurate frequencies. Phase identification can be achieved through external reference signals (synchronised pressure or HWA measurements) or signals extracted from velocity fields (Perrin et al. Reference Perrin, Braza, Cid, Cazin, Barthet, Sevrain, Mockett and Thiele2007). External methods provide localised phase information but suffer from sensitivity to phase jitter and require prior knowledge for optimal probe placement (Pan, Wang & Wang Reference Pan, Wang and Wang2013). Conversely, internal flow-based methods use the global flow features, including cross-correlation techniques (Konstantinidis, Balabani & Yianneskis Reference Konstantinidis, Balabani and Yianneskis2005), pattern recognition (Kim et al. Reference Kim, Lee, Yoon, Boo and Chun2002) and proper orthogonal decomposition (POD) (Van Oudheusden et al. Reference Van Oudheusden, Scarano, Van Hinsberg and Watt2005), all of which enable robust phase extraction in flows exhibiting complex spatiotemporal dynamics.
$U^{\!p}(x,y,\phi (t))= \overline {U}(x,y)+\tilde {U}^\prime (x,y,\phi (t))$
, isolates the coherent structures associated with the global mode while suppressing phase jitter induced by small-scale turbulence. This approach effectively highlights the dominant phase-locked dynamics in the near field of the jet. While phase-averaged fields are readily obtained for purely periodic oscillations, complexities arise under quasi-periodicity where the jet evolves at multiple incommensurate frequencies. Phase identification can be achieved through external reference signals (synchronised pressure or HWA measurements) or signals extracted from velocity fields (Perrin et al. Reference Perrin, Braza, Cid, Cazin, Barthet, Sevrain, Mockett and Thiele2007). External methods provide localised phase information but suffer from sensitivity to phase jitter and require prior knowledge for optimal probe placement (Pan, Wang & Wang Reference Pan, Wang and Wang2013). Conversely, internal flow-based methods use the global flow features, including cross-correlation techniques (Konstantinidis, Balabani & Yianneskis Reference Konstantinidis, Balabani and Yianneskis2005), pattern recognition (Kim et al. Reference Kim, Lee, Yoon, Boo and Chun2002) and proper orthogonal decomposition (POD) (Van Oudheusden et al. Reference Van Oudheusden, Scarano, Van Hinsberg and Watt2005), all of which enable robust phase extraction in flows exhibiting complex spatiotemporal dynamics.
In the present study, phase averaging is performed using a global phase identification method based on POD analysis. This approach leverages the entire spatial velocity field, reducing the sensitivity to phase jitter and small-scale fluctuations compared to localised reference methods (Van Oudheusden et al. Reference Van Oudheusden, Scarano, Van Hinsberg and Watt2005; Stöhr et al. Reference Stöhr, Sadanandan and Meier2011). The first two POD modes capture the majority of the kinetic energy and characterise the dominant coherent structures, enabling robust phase identification (Oberleithner et al. Reference Oberleithner, Sieber, Nayeri, Paschereit, Petz, Hege, Noack and Wygnanski2011). Snapshot POD analysis is performed on the complete dataset of $N = 4000$
instantaneous velocity fields, yielding temporal coefficients
$N = 4000$
instantaneous velocity fields, yielding temporal coefficients $a_i(t)$
for each mode (see Appendix A for details). The phase angle
$a_i(t)$
for each mode (see Appendix A for details). The phase angle $\phi _i$
for each snapshot is determined by expressing the temporal coefficients of the first two POD modes as
$\phi _i$
for each snapshot is determined by expressing the temporal coefficients of the first two POD modes as $a_1^i = r_i\sin (\phi _i)$
and
$a_1^i = r_i\sin (\phi _i)$
and $a_2^i(t) = r_i\cos (\phi _i)$
, from which the phase angle is computed as
$a_2^i(t) = r_i\cos (\phi _i)$
, from which the phase angle is computed as $\phi _i =\tan ^{-1}(a_1^i/a_2^i)$
. Based on the computed phase angles, the velocity fields are sorted into seven evenly spaced phase bins spanning a complete oscillation cycle. These phase-averaged fields are obtained by ensemble-averaging the velocity fields within each bin, reconstructing the dominant phase-locked jet dynamics.
$\phi _i =\tan ^{-1}(a_1^i/a_2^i)$
. Based on the computed phase angles, the velocity fields are sorted into seven evenly spaced phase bins spanning a complete oscillation cycle. These phase-averaged fields are obtained by ensemble-averaging the velocity fields within each bin, reconstructing the dominant phase-locked jet dynamics.
2.5. Vorticity field and vortex tracking
The out-of-plane vorticity component ( $\omega _z$
) is computed from phase-averaged velocity fields acquired in the
$\omega _z$
) is computed from phase-averaged velocity fields acquired in the $x{-}y$
plane:
$x{-}y$
plane: $\omega _z = {\partial v}/{\partial x } - {\partial u}/{\partial y }$
, where
$\omega _z = {\partial v}/{\partial x } - {\partial u}/{\partial y }$
, where $u$
and
$u$
and $v$
are the axial and transverse velocity components, respectively. The required spatial derivatives are computed using a second-order accurate least squares finite-difference scheme (Raffel et al. Reference Raffel, Willert, Scarano, Kähler, Wereley and Kompenhans2018):
$v$
are the axial and transverse velocity components, respectively. The required spatial derivatives are computed using a second-order accurate least squares finite-difference scheme (Raffel et al. Reference Raffel, Willert, Scarano, Kähler, Wereley and Kompenhans2018):
 \begin{equation} \frac {\partial v}{\partial x}\bigg|_i = (2v_{i+2}+v_{i+1}-v_{i-1}-2v_{i-2})/10\,\Delta x. \end{equation}
The resulting vorticity field is non-dimensionalised as $\omega _z^* \equiv \omega _z D/V_e$
, where
$\omega _z^* \equiv \omega _z D/V_e$
, where $V_e$
is the exit velocity at the nozzle lip. Although the vorticity magnitude provides a measure of local fluid rotation, it cannot inherently distinguish between coherent vortical structures and regions dominated by strong shear. To address this limitation, we identify vortical structures using the
$V_e$
is the exit velocity at the nozzle lip. Although the vorticity magnitude provides a measure of local fluid rotation, it cannot inherently distinguish between coherent vortical structures and regions dominated by strong shear. To address this limitation, we identify vortical structures using the $\lambda _2$
criterion (Jeong & Hussain Reference Jeong and Hussain1995), which isolates regions of high vorticity concentration indicative of vortices – which are bounded regions of vorticity in a flow where the vortex lines form closed loops (Lim & Nickels Reference Lim and Nickels1995) – from those arising from strong shear. The algorithm computes the eigenvalues of the symmetric tensor
$\lambda _2$
criterion (Jeong & Hussain Reference Jeong and Hussain1995), which isolates regions of high vorticity concentration indicative of vortices – which are bounded regions of vorticity in a flow where the vortex lines form closed loops (Lim & Nickels Reference Lim and Nickels1995) – from those arising from strong shear. The algorithm computes the eigenvalues of the symmetric tensor $S^2 + \varOmega ^2$
, where
$S^2 + \varOmega ^2$
, where $S_\textit{ij} = ({1}/{2})(\partial u_i/\partial x_{\!j} + \partial u_{\!j}/\partial x_i)$
and
$S_\textit{ij} = ({1}/{2})(\partial u_i/\partial x_{\!j} + \partial u_{\!j}/\partial x_i)$
and $\varOmega _\textit{ij} = ({1}/{2})(\partial u_i/\partial x_{\!j} - \partial u_{\!j}/\partial x_i)$
are the symmetric and antisymmetric components of the velocity gradient tensor, respectively. After sorting the eigenvalues (
$\varOmega _\textit{ij} = ({1}/{2})(\partial u_i/\partial x_{\!j} - \partial u_{\!j}/\partial x_i)$
are the symmetric and antisymmetric components of the velocity gradient tensor, respectively. After sorting the eigenvalues ( $\lambda _1 \geqslant \lambda _2 \geqslant \lambda _3$
) by magnitude, we identify the vortical structures as connected regions where
$\lambda _1 \geqslant \lambda _2 \geqslant \lambda _3$
) by magnitude, we identify the vortical structures as connected regions where $\lambda _2 \lt 0$
. This criterion effectively isolates coherent vortical structures from background shear, providing the foundation for subsequent tracking analysis.
$\lambda _2 \lt 0$
. This criterion effectively isolates coherent vortical structures from background shear, providing the foundation for subsequent tracking analysis.
Besides tracking vortex positions, quantifying their strength provides crucial insight into how external forcing affects vortex formation and evolution. The strength of evolving vortices is quantified via circulation analysis, as per Gharib, Rambod & Shariff (Reference Gharib, Rambod and Shariff1998). This analysis enables the identification of pinch-off timing – when vortical structures cease entraining vorticity from the shear layers – and comparison of the vortex strength across different forcing conditions. The dimensionless circulation is computed by integrating the vorticity above a threshold value $|\omega _{z}|^{*}\geqslant 1$
contained in the region of interest at each time step:
$|\omega _{z}|^{*}\geqslant 1$
contained in the region of interest at each time step:
 \begin{equation} \varGamma ^* = \iint _S \omega _z^* \, {\rm d}x^*\, {\rm d}y^*, \end{equation}
where the integration domain $S$
encompasses the bounded vortex region at each time step.
$S$
encompasses the bounded vortex region at each time step.
3. Results and discussion
3.1. Jet response en route to forced synchronisation
We begin by examining the response of a globally unstable jet as it approaches synchronisation under axial and transverse forcing. We apply time-periodic acoustic forcing at a frequency close to the natural global frequency ( $f_{\!f}/f_n = 1.09$
), with the forcing amplitude
$f_{\!f}/f_n = 1.09$
), with the forcing amplitude $A_{\!f}$
systematically varying across five different values. We quantify the response amplitude through
$A_{\!f}$
systematically varying across five different values. We quantify the response amplitude through $V^\prime _{\textit{rms}}$
, the root mean square of the fluctuating velocity magnitude
$V^\prime _{\textit{rms}}$
, the root mean square of the fluctuating velocity magnitude $V^\prime \equiv V-\overline {V}$
, evaluated within the jet potential core. To characterise synchronisation, we examine the relative amplitudes of the PSD peaks at
$V^\prime \equiv V-\overline {V}$
, evaluated within the jet potential core. To characterise synchronisation, we examine the relative amplitudes of the PSD peaks at $f_{\!f}$
and
$f_{\!f}$
and $f_n$
as the forcing strengthens. We identify the onset of synchronisation when the spectral peak at
$f_n$
as the forcing strengthens. We identify the onset of synchronisation when the spectral peak at $f_n$
disappears and the spectral peak at
$f_n$
disappears and the spectral peak at $f_{\!f}$
becomes dominant. This spectral signature provides a robust indicator of phase-locked limit-cycle oscillations, indicating forced synchronisation.
$f_{\!f}$
becomes dominant. This spectral signature provides a robust indicator of phase-locked limit-cycle oscillations, indicating forced synchronisation.
3.1.1. Forced response to transverse forcing
Figures 3(a–e) show spatial maps of $V^\prime _{\textit{rms}}$
for the jet when forced transversely at five different amplitudes. The black line marks the potential core boundary, defined as the region where the mean velocity
$V^\prime _{\textit{rms}}$
for the jet when forced transversely at five different amplitudes. The black line marks the potential core boundary, defined as the region where the mean velocity $\overline {V}$
exceeds
$\overline {V}$
exceeds $95\,\%$
of its value at the nozzle outlet centreline.
$95\,\%$
of its value at the nozzle outlet centreline.
Spatial maps of (a–e) the velocity fluctuations and (f–j) their spectra for a globally unstable jet forced transversely at $f_{\!f}/f_n=1.09$
. Root mean square velocity fluctuations
$f_{\!f}/f_n=1.09$
. Root mean square velocity fluctuations $V_{\textit{rms}}^\prime$
for five forcing amplitudes: (a) unforced, (b) low-amplitude forcing, (c) moderate-amplitude forcing, (d) critical amplitude at lock-in, and (e) above the lock-in threshold. (f–j) The PSDs of the centreline velocity fluctuations (
$V_{\textit{rms}}^\prime$
for five forcing amplitudes: (a) unforced, (b) low-amplitude forcing, (c) moderate-amplitude forcing, (d) critical amplitude at lock-in, and (e) above the lock-in threshold. (f–j) The PSDs of the centreline velocity fluctuations ( $V_{c}^\prime$
) along
$V_{c}^\prime$
) along $x/D$
for the corresponding forcing conditions. The unforced jet (a, f) exhibits strong periodic oscillations at a well-defined natural frequency (
$x/D$
for the corresponding forcing conditions. The unforced jet (a, f) exhibits strong periodic oscillations at a well-defined natural frequency ( $f_n$
). Below lock-in, asynchronous oscillations occur with spectral broadening around
$f_n$
). Below lock-in, asynchronous oscillations occur with spectral broadening around $f_{\!f} /f_n = 1$
in the PSD in (g,h), and the oscillation amplitudes gradually decrease with
$f_{\!f} /f_n = 1$
in the PSD in (g,h), and the oscillation amplitudes gradually decrease with $A_{\!f}$
in (b,c). At lock-in and beyond, the jet is synchronised to
$A_{\!f}$
in (b,c). At lock-in and beyond, the jet is synchronised to $f_{\!f}$
in (i,j), with a substantial drop in its oscillation amplitude in (d,e).
$f_{\!f}$
in (i,j), with a substantial drop in its oscillation amplitude in (d,e).

The unforced jet exhibits low-amplitude oscillations at the nozzle outlet ( $x/D \approx 0$
). With downstream development, the jet amplitude
$x/D \approx 0$
). With downstream development, the jet amplitude $V^\prime _{\textit{rms}}$
grows and reaches a local peak within the potential core at
$V^\prime _{\textit{rms}}$
grows and reaches a local peak within the potential core at $1 \lt x/D \lt 2$
, as seen in figure 3(a). The corresponding PSD (figure 3
f) shows the fundamental frequency of the natural global mode (
$1 \lt x/D \lt 2$
, as seen in figure 3(a). The corresponding PSD (figure 3
f) shows the fundamental frequency of the natural global mode ( $f_n$
) as the dominant spectral feature, evidenced by a sharp peak at
$f_n$
) as the dominant spectral feature, evidenced by a sharp peak at $f_n$
. Farther downstream (
$f_n$
. Farther downstream ( $x/D \gt 2.3$
), a dominant spectral peak emerges at
$x/D \gt 2.3$
), a dominant spectral peak emerges at $f_n/2$
. This subharmonic dominance coincides with large
$f_n/2$
. This subharmonic dominance coincides with large $V_{\textit{rms}}^\prime$
values outside the potential core, typically associated with vortex pairing (Kyle & Sreenivasan Reference Kyle and Sreenivasan1993).
$V_{\textit{rms}}^\prime$
values outside the potential core, typically associated with vortex pairing (Kyle & Sreenivasan Reference Kyle and Sreenivasan1993).
When forced below the lock-in threshold, $V_{\textit{rms}}^\prime$
within the potential core decreases below the unforced levels, particularly in the region
$V_{\textit{rms}}^\prime$
within the potential core decreases below the unforced levels, particularly in the region $1 \lt x/D \lt 2$
(figures 3
b,c). The corresponding PSDs (figures 3
g,h) reveal the emergence of a new spectral peak at
$1 \lt x/D \lt 2$
(figures 3
b,c). The corresponding PSDs (figures 3
g,h) reveal the emergence of a new spectral peak at $f_{\!f}$
, while the peak at
$f_{\!f}$
, while the peak at $f_n$
broadens relative to the unforced case. These observations suggest the presence of several weaker spectral peaks surrounding
$f_n$
broadens relative to the unforced case. These observations suggest the presence of several weaker spectral peaks surrounding $f_n$
. The coexistence of two incommensurate frequencies (
$f_n$
. The coexistence of two incommensurate frequencies ( $f_n$
and
$f_n$
and $f_{\!f}$
) and additional frequencies around
$f_{\!f}$
) and additional frequencies around $f_{\!f}$
indicates that the global mode exhibits quasi-periodic rather than purely periodic dynamics.
$f_{\!f}$
indicates that the global mode exhibits quasi-periodic rather than purely periodic dynamics.
At lock-in (figure 3
d), $V_{\textit{rms}}^\prime$
within the potential core takes on substantially lower values. Further increases in the forcing amplitude above the lock-in threshold produce even greater reductions in
$V_{\textit{rms}}^\prime$
within the potential core takes on substantially lower values. Further increases in the forcing amplitude above the lock-in threshold produce even greater reductions in $V_{\textit{rms}}^\prime$
without resonant amplification (figure 3
e). In the corresponding PSDs (figures 3
i, j), the spectral peak at
$V_{\textit{rms}}^\prime$
without resonant amplification (figure 3
e). In the corresponding PSDs (figures 3
i, j), the spectral peak at $f_{\!f}$
becomes sharp and dominant, with complete suppression of the peaks at
$f_{\!f}$
becomes sharp and dominant, with complete suppression of the peaks at $f_n$
, indicating synchronisation of the global mode to the transverse forcing. The suppression of the global mode in the potential core of this synchronised jet – as illustrated by the transition from dark to light shading in figures 3(a,e) – indicates asynchronous quenching, consistent with the findings of our previous work (Kushwaha et al. Reference Kushwaha, Worth, Dawson, Gupta and Li2022). In the downstream region (
$f_n$
, indicating synchronisation of the global mode to the transverse forcing. The suppression of the global mode in the potential core of this synchronised jet – as illustrated by the transition from dark to light shading in figures 3(a,e) – indicates asynchronous quenching, consistent with the findings of our previous work (Kushwaha et al. Reference Kushwaha, Worth, Dawson, Gupta and Li2022). In the downstream region ( $x/D \gt 2$
), the subharmonics of the forcing frequency (
$x/D \gt 2$
), the subharmonics of the forcing frequency ( $f_{\!f}/2$
) dominate the PSD, attributable to vortex pairing under synchronised conditions.
$f_{\!f}/2$
) dominate the PSD, attributable to vortex pairing under synchronised conditions.
3.1.2. Forced response to axial forcing
Figure 4 shows the hydrodynamic response of the jet under axial forcing applied at $f_{\!f}/f_n=1.09$
for five different amplitudes leading up to lock-in and beyond. As before, the colour maps depict the spatial distribution of
$f_{\!f}/f_n=1.09$
for five different amplitudes leading up to lock-in and beyond. As before, the colour maps depict the spatial distribution of $V_{\textit{rms}}^\prime$
, with the black line delineating the potential core boundary. Comparing figures 3 and 4 reveals both qualitative similarities and notable differences in the forced response between the axially and transversely forced jets. Below lock-in, the axially forced jet exhibits dynamics that initially resembles the transversely forced jet. Both forcing configurations produce: (i) a transition from limit-cycle periodicity to quasi-periodicity, evidenced by the emergence of a spectral peak at
$V_{\textit{rms}}^\prime$
, with the black line delineating the potential core boundary. Comparing figures 3 and 4 reveals both qualitative similarities and notable differences in the forced response between the axially and transversely forced jets. Below lock-in, the axially forced jet exhibits dynamics that initially resembles the transversely forced jet. Both forcing configurations produce: (i) a transition from limit-cycle periodicity to quasi-periodicity, evidenced by the emergence of a spectral peak at $f_{\!f}$
accompanied by additional peaks in the vicinity of
$f_{\!f}$
accompanied by additional peaks in the vicinity of $f_n$
; and (ii) a modest reduction in
$f_n$
; and (ii) a modest reduction in $V'_{\textit{rms}}$
within the potential core, as indicated by changes in shading intensities in figures 4(b,c). These similarities suggest that both forcing types can disrupt the natural global mode and induce complex dynamical states at low forcing amplitudes. However, notable differences emerge as the forcing amplitude rises above the lock-in threshold. Unlike the transversely forced jet, the axially forced jet does not exhibit significant suppression of its amplitude at synchronisation. Instead, at forcing amplitudes exceeding the lock-in threshold,
$V'_{\textit{rms}}$
within the potential core, as indicated by changes in shading intensities in figures 4(b,c). These similarities suggest that both forcing types can disrupt the natural global mode and induce complex dynamical states at low forcing amplitudes. However, notable differences emerge as the forcing amplitude rises above the lock-in threshold. Unlike the transversely forced jet, the axially forced jet does not exhibit significant suppression of its amplitude at synchronisation. Instead, at forcing amplitudes exceeding the lock-in threshold, $V'_{\textit{rms}}$
recovers to levels comparable to the unforced state. This behaviour stands in sharp contrast to the continued attenuation of the oscillation amplitude observed under transverse forcing. This asymmetric response is consistent with the findings of Kushwaha et al. (Reference Kushwaha, Worth, Dawson, Gupta and Li2022), who demonstrated that transverse forcing leads to suppression across a wide range of forcing frequencies:
$V'_{\textit{rms}}$
recovers to levels comparable to the unforced state. This behaviour stands in sharp contrast to the continued attenuation of the oscillation amplitude observed under transverse forcing. This asymmetric response is consistent with the findings of Kushwaha et al. (Reference Kushwaha, Worth, Dawson, Gupta and Li2022), who demonstrated that transverse forcing leads to suppression across a wide range of forcing frequencies: $0.8\lt f_{\!f}/f_n\lt 1.2$
. In contrast, axial forcing exhibits a distinctly asymmetric response about
$0.8\lt f_{\!f}/f_n\lt 1.2$
. In contrast, axial forcing exhibits a distinctly asymmetric response about $f_{\!f}/f_n = 1$
, wherein suppression occurs when
$f_{\!f}/f_n = 1$
, wherein suppression occurs when $f_{\!f}/f_n \gt 1$
, while amplification occurs when
$f_{\!f}/f_n \gt 1$
, while amplification occurs when $f_{\!f}/f_n \lt 1$
, as illustrated in figure 5(a).
$f_{\!f}/f_n \lt 1$
, as illustrated in figure 5(a).
The quantities shown are the same as those in figure 3 but for the axially forced jet. When synchronised with $f_{\!f}$
, the axially forced jet maintains substantial oscillation amplitudes throughout the lock-in regime, contrasting sharply with the oscillation suppression arising from transverse forcing.
$f_{\!f}$
, the axially forced jet maintains substantial oscillation amplitudes throughout the lock-in regime, contrasting sharply with the oscillation suppression arising from transverse forcing.

(a,b) Root mean square of the total velocity fluctuations ( $V^\prime _{\textit{rms}}$
), and (c,d) the normalised PSD of
$V^\prime _{\textit{rms}}$
), and (c,d) the normalised PSD of $V^\prime$
along the centreline of the jet when it is forced purely axially, at (a,c)
$V^\prime$
along the centreline of the jet when it is forced purely axially, at (a,c) $f_{\!f}/f_n=0.82$
and (b,d)
$f_{\!f}/f_n=0.82$
and (b,d) $f_{\!f}/f_n=1.09$
. (e) The normalised PSD of the velocity fluctuations acquired from HWA experiments when the jet is forced purely axially across a range of frequencies (
$f_{\!f}/f_n=1.09$
. (e) The normalised PSD of the velocity fluctuations acquired from HWA experiments when the jet is forced purely axially across a range of frequencies ( $0.8\lt f_{\!f}/f_n\lt 1.18$
) at lock-in.
$0.8\lt f_{\!f}/f_n\lt 1.18$
) at lock-in.

The contrasting amplitude responses observed under axial forcing are closely linked to the distinct spectral signatures in the downstream region ( $x/D \gt 2$
). When the jet is axially forced above its natural frequency (
$x/D \gt 2$
). When the jet is axially forced above its natural frequency ( $f_{\!f}/f_n = 1.09$
), its PSD reveals a pronounced spectral peak at the subharmonic frequency (
$f_{\!f}/f_n = 1.09$
), its PSD reveals a pronounced spectral peak at the subharmonic frequency ( $f_{\!f}/2$
), as shown in figure 5(d). This subharmonic emergence signifies large-scale vortex interactions and marks the onset of vortex pairing, a key nonlinear phenomenon discussed further in § 3.3.3. Conversely, when forced below its natural frequency (
$f_{\!f}/2$
), as shown in figure 5(d). This subharmonic emergence signifies large-scale vortex interactions and marks the onset of vortex pairing, a key nonlinear phenomenon discussed further in § 3.3.3. Conversely, when forced below its natural frequency ( $f_{\!f}/f_n = 0.82$
), the jet oscillates strictly at
$f_{\!f}/f_n = 0.82$
), the jet oscillates strictly at $f_{\!f}$
, with no discernible
$f_{\!f}$
, with no discernible $f_{\!f}/2$
subharmonic component in the PSD (figure 5
c). The absence of this subharmonic signature implies that successive vortices advect downstream without merging, thereby preserving their individual coherence. This lack of nonlinear energy transfer from the fundamental mode to the subharmonic components contributes directly to the observed amplification of the oscillation amplitude under synchronised conditions. These spectral differences are further substantiated by HWA measurements taken at
$f_{\!f}/2$
subharmonic component in the PSD (figure 5
c). The absence of this subharmonic signature implies that successive vortices advect downstream without merging, thereby preserving their individual coherence. This lack of nonlinear energy transfer from the fundamental mode to the subharmonic components contributes directly to the observed amplification of the oscillation amplitude under synchronised conditions. These spectral differences are further substantiated by HWA measurements taken at $x/D \approx 1.5$
, as shown in figure 5(e). These local PSD measurements corroborate the global trends: subharmonic content remains absent when
$x/D \approx 1.5$
, as shown in figure 5(e). These local PSD measurements corroborate the global trends: subharmonic content remains absent when $f_{\!f}/f_n \lt 1$
, while pronounced subharmonic peaks appear when
$f_{\!f}/f_n \lt 1$
, while pronounced subharmonic peaks appear when $f_{\!f}/f_n \gt 1$
. Collectively, these observations underscore the central role of local vortex interactions in shaping the global response of the jet to axial forcing. The connection between vortex advection and global-mode modulation will be examined further in § 3.3.
$f_{\!f}/f_n \gt 1$
. Collectively, these observations underscore the central role of local vortex interactions in shaping the global response of the jet to axial forcing. The connection between vortex advection and global-mode modulation will be examined further in § 3.3.
3.2. Spatially resolved phase dynamics of the forced synchronised jet
Having established the contrasting amplitude responses and spectral characteristics between axially and transversely forced jets, we proceed to examine the phase-resolved fluctuations of the streamwise and transverse velocity components. Specifically, we investigate how the symmetry of the applied perturbations modifies the spatiotemporal jet dynamics, and how this influences the modal structure of the jet response. This provides insight into the physical mechanisms behind the observed oscillation suppression under transverse forcing compared with the amplitude recovery seen with axial forcing beyond lock-in. We examine spatial maps of the streamwise ( $u'$
) and transverse (
$u'$
) and transverse ( $v'$
) velocity fluctuations for both the unforced jet and the phase-locked synchronised jet.
$v'$
) velocity fluctuations for both the unforced jet and the phase-locked synchronised jet.
Weighted phase maps of velocity components for unforced and forced jet configurations at lock-in. (a–c) Phase distributions of the streamwise velocity component in the (a) unforced, (b) axially forced, and (c) transversely forced cases. (d–f) Corresponding transverse phase distributions for the same forcing conditions. The phase values are represented by coloured bands distributed along the streamwise direction ( $x/D$
), with the colours spanning from red (
$x/D$
), with the colours spanning from red ( $-\pi$
) through green to cyan (
$-\pi$
) through green to cyan ( $0$
), and continuing through blue and back to red (
$0$
), and continuing through blue and back to red ( $\pi$
). Brightness indicates the local magnitude of the velocity fluctuations, with high-amplitude regions appearing bright, and low-amplitude regions fading to black.
$\pi$
). Brightness indicates the local magnitude of the velocity fluctuations, with high-amplitude regions appearing bright, and low-amplitude regions fading to black.

Figure 6 presents weighted phase maps, where the spatially resolved velocity fluctuation fields are visualised to offer a phase-aligned representation of the underlying modal structure. The phase analysis is performed by applying a fast Fourier transform to time-resolved velocity signals extracted at each spatial location across 4000 samples, spanning over 650 natural oscillation cycles. At each location, we compute the dominant spectral amplitude and the corresponding phase. The phase patterns are visualised using a cyclic colour map, with brightness encoding the fluctuation amplitude (Hauser et al. Reference Hauser, Lorenz and Sattelmayer2010). This technique facilitates interpretation of regions exhibiting significant (bright) versus minimal (dark) fluctuation activity, providing insight into how the imposed perturbations interact with the natural axisymmetric mode to either preserve its inherent axisymmetry ( $m=0$
) or induce symmetry-breaking phenomena. The white lines overlaid on the phase maps demarcate the potential core boundary. Figures 6(a–c) show the spatial distributions of the phase-resolved streamwise velocity fluctuations (
$m=0$
) or induce symmetry-breaking phenomena. The white lines overlaid on the phase maps demarcate the potential core boundary. Figures 6(a–c) show the spatial distributions of the phase-resolved streamwise velocity fluctuations ( $u'$
), while figures 6(d–f) show the corresponding transverse fluctuations (
$u'$
), while figures 6(d–f) show the corresponding transverse fluctuations ( $v'$
). The phase plots reveal coherent convective wavepackets marked by streamwise phase progression, consistent with the dynamics of a globally unstable jet. The pronounced bright bands near
$v'$
). The phase plots reveal coherent convective wavepackets marked by streamwise phase progression, consistent with the dynamics of a globally unstable jet. The pronounced bright bands near $1 \lt x/D \lt 2$
indicate regions of high-amplitude velocity fluctuations, corresponding to the maximum of the direct mode structure. However, it is important to note that this region of maximum amplitude does not necessarily coincide with either the wavemaker region – where the intrinsic feedback mechanism sets the frequency and growth rate of the global mode – or the region of maximum receptivity to external forcing, as identified by the adjoint mode. This spatial offset arises because disturbances in the upstream region, where the adjoint mode is located, undergo convective amplification as they advect downstream, causing the direct mode amplitude to peak downstream of the wavemaker region (Lesshafft et al. Reference Lesshafft, Huerre, Sagaut and Terracol2006; Coenen et al. Reference Coenen, Lesshafft, Garnaud and Sevilla2017; Qadri et al. Reference Qadri, Chandler and Juniper2018). Thus the bright regions in figure 6 indicate where the instability is most observable experimentally, rather than where it originates or where forcing would be most effective.
$1 \lt x/D \lt 2$
indicate regions of high-amplitude velocity fluctuations, corresponding to the maximum of the direct mode structure. However, it is important to note that this region of maximum amplitude does not necessarily coincide with either the wavemaker region – where the intrinsic feedback mechanism sets the frequency and growth rate of the global mode – or the region of maximum receptivity to external forcing, as identified by the adjoint mode. This spatial offset arises because disturbances in the upstream region, where the adjoint mode is located, undergo convective amplification as they advect downstream, causing the direct mode amplitude to peak downstream of the wavemaker region (Lesshafft et al. Reference Lesshafft, Huerre, Sagaut and Terracol2006; Coenen et al. Reference Coenen, Lesshafft, Garnaud and Sevilla2017; Qadri et al. Reference Qadri, Chandler and Juniper2018). Thus the bright regions in figure 6 indicate where the instability is most observable experimentally, rather than where it originates or where forcing would be most effective.
For both the unforced and axially forced jets, the convective wavepackets associated with $u'$
exhibit clear axisymmetry, with almost identical phase patterns mirrored about the centreline (
$u'$
exhibit clear axisymmetry, with almost identical phase patterns mirrored about the centreline ( $y/D = 0$
), as shown in figures 6(a,b). In contrast, the wavepackets associated with
$y/D = 0$
), as shown in figures 6(a,b). In contrast, the wavepackets associated with $v^\prime$
in figures 6(d,e) exhibit antisymmetric behaviour across the centreline, with peak amplitudes localised within the shear layers at
$v^\prime$
in figures 6(d,e) exhibit antisymmetric behaviour across the centreline, with peak amplitudes localised within the shear layers at $y/D \approx \pm 0.5$
and a nodal line of vanishing amplitude along the centreline. This pattern is characteristic of an axisymmetric jet dominated by the
$y/D \approx \pm 0.5$
and a nodal line of vanishing amplitude along the centreline. This pattern is characteristic of an axisymmetric jet dominated by the $m=0$
global mode, reinforcing that axial forcing preserves the natural symmetry of the jet modal structure. The phase-resolved fluctuations under transverse forcing reveal markedly different characteristics. As illustrated in figure 6( f), transverse forcing induces axisymmetric behaviour in
$m=0$
global mode, reinforcing that axial forcing preserves the natural symmetry of the jet modal structure. The phase-resolved fluctuations under transverse forcing reveal markedly different characteristics. As illustrated in figure 6( f), transverse forcing induces axisymmetric behaviour in $v'$
, with coherent wavepacket patterns that remain symmetric about the jet centreline. The phase plot reveals reduced dark regions along the centreline, indicating minimal but finite oscillation amplitude, while the brighter regions on both sides indicate substantial symmetric transverse velocity fluctuations. This symmetry in the
$v'$
, with coherent wavepacket patterns that remain symmetric about the jet centreline. The phase plot reveals reduced dark regions along the centreline, indicating minimal but finite oscillation amplitude, while the brighter regions on both sides indicate substantial symmetric transverse velocity fluctuations. This symmetry in the $v'$
fluctuations suggests that transverse forcing disrupts the natural axisymmetry of the jet, inducing a transition away from the purely axisymmetric mode. Furthermore, the phase plot of
$v'$
fluctuations suggests that transverse forcing disrupts the natural axisymmetry of the jet, inducing a transition away from the purely axisymmetric mode. Furthermore, the phase plot of $u'$
in figure 6(c) reveals slanted colour bands within the potential core region, accompanied by asymmetric brightness patterns. One side of the centreline exhibits greater brightness than the other, indicating that the streamwise velocity fluctuations deviate substantially from the natural axisymmetric distribution. This asymmetry suggests that transverse forcing induces a tilting or deflection of the jet column. The combination of symmetric
$u'$
in figure 6(c) reveals slanted colour bands within the potential core region, accompanied by asymmetric brightness patterns. One side of the centreline exhibits greater brightness than the other, indicating that the streamwise velocity fluctuations deviate substantially from the natural axisymmetric distribution. This asymmetry suggests that transverse forcing induces a tilting or deflection of the jet column. The combination of symmetric $v'$
and asymmetric
$v'$
and asymmetric $u'$
patterns provides compelling evidence that transverse forcing excites helical modes (
$u'$
patterns provides compelling evidence that transverse forcing excites helical modes ( $m = \pm 1$
), which interact with the natural
$m = \pm 1$
), which interact with the natural $m = 0$
global mode to break the inherent axisymmetric structure. This modal interaction represents the fundamental mechanism underlying the amplitude suppression observed under transverse forcing, distinguishing it from the symmetry-preserving characteristics of axial forcing.
$m = 0$
global mode to break the inherent axisymmetric structure. This modal interaction represents the fundamental mechanism underlying the amplitude suppression observed under transverse forcing, distinguishing it from the symmetry-preserving characteristics of axial forcing.
3.3. Phase-averaged vortical structures
Having established that transverse forcing systematically disrupts the inherent axisymmetry of the jet, whereas axial forcing preserves this fundamental characteristic, we next investigate how these contrasting symmetry modifications manifest in the spatial organisation and spatiotemporal evolution of coherent vortical structures within the near field. Specifically, we focus on forcing at $f_{\!f}/f_n = 1.09$
, examining the evolution of vortical dynamics as the forcing amplitude increases from the unforced state to beyond lock-in.
$f_{\!f}/f_n = 1.09$
, examining the evolution of vortical dynamics as the forcing amplitude increases from the unforced state to beyond lock-in.
3.3.1. In response to transverse forcing
Figure 7 shows maps of the normalised phase-averaged vorticity ( $\omega _z^*$
) in the
$\omega _z^*$
) in the $x$
–
$x$
– $y$
plane at six time instants within one natural oscillation cycle of the unforced self-excited jet. To quantitatively characterise these dynamics, we first identify coherent vortical structures using the
$y$
plane at six time instants within one natural oscillation cycle of the unforced self-excited jet. To quantitatively characterise these dynamics, we first identify coherent vortical structures using the $\lambda _2 \lt 0$
criterion, which distinguishes rotational cores from shear-dominated regions (Jeong & Hussain Reference Jeong and Hussain1995). Following the identification of vortical structures near the nozzle exit at
$\lambda _2 \lt 0$
criterion, which distinguishes rotational cores from shear-dominated regions (Jeong & Hussain Reference Jeong and Hussain1995). Following the identification of vortical structures near the nozzle exit at $t/T = 0$
, we track their temporal evolution via successive phase snapshots by identifying regions of
$t/T = 0$
, we track their temporal evolution via successive phase snapshots by identifying regions of $\lambda _2 \lt 0$
that exhibit partial spatial overlap with those detected in the preceding phase instant. The streamwise and transverse positions of vortex cores are quantified by computing the
$\lambda _2 \lt 0$
that exhibit partial spatial overlap with those detected in the preceding phase instant. The streamwise and transverse positions of vortex cores are quantified by computing the $x$
-centroid and
$x$
-centroid and $y$
-centroid coordinates of the
$y$
-centroid coordinates of the $\lambda _2\lt 0$
regions, as per Saffman (Reference Saffman1992):
$\lambda _2\lt 0$
regions, as per Saffman (Reference Saffman1992):
 \begin{align} x_v^{*} = \frac { \iint _S 2\pi x^{*}y^{*}\omega _{z}^{*} \,{\rm d}x^{*}\, {\rm d}y^{*}}{ \iint _S 2\pi y^{*}\omega _{z}^{*} \,{\rm d}x^{*}\, {\rm d}y^{*}}, \quad y_v^{*} = \frac { \iint _S 2\pi x^{*} y^{*} \omega _{z}^{*} \,{\rm d}x^{*}\, {\rm d}y^{*} }{ \iint _S 2\pi x\omega _{z}^{*} \,{\rm d}x^{*}\, {\rm d}y^{*} }, \end{align}
where $^{*}$
represents non-dimensionalisation, with
$^{*}$
represents non-dimensionalisation, with $x_v^{*} =x/D$
and
$x_v^{*} =x/D$
and $y_v^{*}=y/D$
denoting the non-dimensional
$y_v^{*}=y/D$
denoting the non-dimensional $x$
-centroid and
$x$
-centroid and $y$
-centroid, respectively, and
$y$
-centroid, respectively, and $\omega _{z}^{*} = \omega _{z}D/u_e$
denoting the non-dimensional
$\omega _{z}^{*} = \omega _{z}D/u_e$
denoting the non-dimensional $z$
-component of vorticity.
$z$
-component of vorticity.
Maps of the normalised iso-vorticity $\omega ^* = \omega D/U_e$
in the
$\omega ^* = \omega D/U_e$
in the $x{-}y$
plane corresponding to six phases of the natural oscillation cycle of the unforced jet. When unforced, the vortical structures on both sides of the jet centreline evolve and advect in phase with each other.
$x{-}y$
plane corresponding to six phases of the natural oscillation cycle of the unforced jet. When unforced, the vortical structures on both sides of the jet centreline evolve and advect in phase with each other.

To further quantify the vortex dynamics, we compute the circulation of individual vortical structures during their downstream advection, and the total circulation on either side of the jet centreline for various forcing amplitudes. This enables us to assess the influence of the forcing amplitude on the vortex growth characteristics, and determine the pinch-off time, which is defined as the moment when vortical structures cease entraining vorticity from the surrounding shear layers. The methodology for estimating the vortex ring and total circulation follows the approach established by Gharib et al. (Reference Gharib, Rambod and Shariff1998), with specific modifications made to exclude contributions from the preceding oscillation cycles. To isolate the circulation of individual vortices, we establish upper and lower spatial bounds relative to the vortex core centroid at each time instant, with circulation calculations performed for vortices tracked starting from $t/T = 0$
and progressing through successive time steps. The circulations for left-hand-side (LHS) and right-hand-side (RHS) vortices are computed separately by excluding positive and negative vorticity regions, respectively. The total circulation is estimated via a domain integration approach wherein the lower spatial bound remains fixed at
$t/T = 0$
and progressing through successive time steps. The circulations for left-hand-side (LHS) and right-hand-side (RHS) vortices are computed separately by excluding positive and negative vorticity regions, respectively. The total circulation is estimated via a domain integration approach wherein the lower spatial bound remains fixed at $x/D = 0$
, while the upper bound translates in accordance with the instantaneous vortex structure centroid position. The non-dimensional circulation (
$x/D = 0$
, while the upper bound translates in accordance with the instantaneous vortex structure centroid position. The non-dimensional circulation ( $\varGamma ^*$
) is computed by integrating the vorticity magnitude over regions satisfying
$\varGamma ^*$
) is computed by integrating the vorticity magnitude over regions satisfying $|\omega _z^*| \geqslant 1$
at each time step, as expressed mathematically in (2.2). This framework enables systematic tracking of vortex formation, advection and interaction processes throughout an oscillation cycle, providing quantitative insight into the symmetry-breaking phenomena observed within the phase-averaged vorticity fields.
$|\omega _z^*| \geqslant 1$
at each time step, as expressed mathematically in (2.2). This framework enables systematic tracking of vortex formation, advection and interaction processes throughout an oscillation cycle, providing quantitative insight into the symmetry-breaking phenomena observed within the phase-averaged vorticity fields.
In the unforced state (figure 7), the jet exhibits clear axisymmetric behaviour: spatially growing instabilities within the laminar shear layers undergo synchronous roll-up near the nozzle exit ( $x/D \approx 0$
), forming symmetric vortex cores at
$x/D \approx 0$
), forming symmetric vortex cores at $t/T=0$
(figure 7). These vortical structures evolve into coherent axisymmetric vortex ring structures whose LHS and RHS components remain synchronised, occupying identical axial positions while evolving along congruent downstream trajectories (figure 8
a). This spatial and temporal alignment indicates that both LHS and RHS vortices advect in phase with a common convective velocity. As these vortical structures advect downstream, they continuously entrain and accumulate vorticity from the trailing shear layers, resulting in a steady increase in both individual vortex circulations (
$t/T=0$
(figure 7). These vortical structures evolve into coherent axisymmetric vortex ring structures whose LHS and RHS components remain synchronised, occupying identical axial positions while evolving along congruent downstream trajectories (figure 8
a). This spatial and temporal alignment indicates that both LHS and RHS vortices advect in phase with a common convective velocity. As these vortical structures advect downstream, they continuously entrain and accumulate vorticity from the trailing shear layers, resulting in a steady increase in both individual vortex circulations ( $\varGamma _{vr}$
) and the total circulation (
$\varGamma _{vr}$
) and the total circulation ( $\varGamma _{\textit{tot}}$
) on both sides of the jet centreline (figure 8
f). These advecting vortices undergo pinch-off within the streamwise region
$\varGamma _{\textit{tot}}$
) on both sides of the jet centreline (figure 8
f). These advecting vortices undergo pinch-off within the streamwise region $1 \lt x/D \lt 2$
where their self-induced velocity exceeds the mean shear-layer velocity. This pinch-off process is reflected in the circulation plateau at
$1 \lt x/D \lt 2$
where their self-induced velocity exceeds the mean shear-layer velocity. This pinch-off process is reflected in the circulation plateau at $\varGamma _{vr}^* \approx 1$
at
$\varGamma _{vr}^* \approx 1$
at $t/T \approx 1$
for both LHS and RHS vortices (figure 8
f), indicating cessation of vorticity entrainment. In the far field (
$t/T \approx 1$
for both LHS and RHS vortices (figure 8
f), indicating cessation of vorticity entrainment. In the far field ( $x/D \gt 2$
), successive vortical structures undergo pairing and merging, inducing structural deformation and coherence degradation through nonlinear vortical interactions (figure 7). This downstream interaction correlates with the emergence of the
$x/D \gt 2$
), successive vortical structures undergo pairing and merging, inducing structural deformation and coherence degradation through nonlinear vortical interactions (figure 7). This downstream interaction correlates with the emergence of the $f_n/2$
subharmonic in the far field, consistent with the spectral characteristics observed in figure 3.
$f_n/2$
subharmonic in the far field, consistent with the spectral characteristics observed in figure 3.
Temporal evolution of vortical structures under transverse forcing at $f_{\!f}/f_n = 1.09$
for five forcing amplitudes. (a–e) Axial positions of vortex cores as functions of normalised time
$f_{\!f}/f_n = 1.09$
for five forcing amplitudes. (a–e) Axial positions of vortex cores as functions of normalised time $t/T$
for LHS (blue) and RHS (red) vortical structures. At lock-in (d) and beyond (e), vortical structures on both sides of the jet centreline exhibit phase differences
$t/T$
for LHS (blue) and RHS (red) vortical structures. At lock-in (d) and beyond (e), vortical structures on both sides of the jet centreline exhibit phase differences $90^\circ$
and
$90^\circ$
and $120^\circ$
, respectively. (f–j) Vortex ring circulation
$120^\circ$
, respectively. (f–j) Vortex ring circulation $\varGamma ^*_{vr}$
and total circulation
$\varGamma ^*_{vr}$
and total circulation $\varGamma ^*_{\textit{tot}}$
as functions of
$\varGamma ^*_{\textit{tot}}$
as functions of $t/T$
for the corresponding forcing conditions. The vortex ring circulation initially grows with
$t/T$
for the corresponding forcing conditions. The vortex ring circulation initially grows with $t/T$
before saturating at
$t/T$
before saturating at $\varGamma ^*_{vr}\approx 1$
across all forcing amplitudes, indicating that the vortical structures reach a saturation threshold where additional vorticity entrainment from the shear layers ceases despite continued increases in the forcing amplitude.
$\varGamma ^*_{vr}\approx 1$
across all forcing amplitudes, indicating that the vortical structures reach a saturation threshold where additional vorticity entrainment from the shear layers ceases despite continued increases in the forcing amplitude.

The quantities shown are the same as those in figure 7 but for the quasi-periodic state when forced transversely at two different amplitudes: (a) low amplitude, $A_{\!f} =0.56$
; and (b) moderate amplitude,
$A_{\!f} =0.56$
; and (b) moderate amplitude, $A_{\!f} =0.72$
. While the initial shear layers on both sides of the jet centreline roll up in phase with each other, the vortical structures become out of phase as they evolve and advect downstream.
$A_{\!f} =0.72$
. While the initial shear layers on both sides of the jet centreline roll up in phase with each other, the vortical structures become out of phase as they evolve and advect downstream.

The quantities shown are the same as those in figure 7 but at a lock-in state when forced transversely (a) at the critical lock-in amplitude $A_{\!f} =1$
and (b) above the lock-in amplitude
$A_{\!f} =1$
and (b) above the lock-in amplitude $A_{\!f} =1.45$
. Under lock-in conditions, vortical structures on both sides of the jet centreline evolve and advect out of phase with each other, producing symmetry-breaking phenomena that underlie the suppression mechanism characteristic of transverse forcing.
$A_{\!f} =1.45$
. Under lock-in conditions, vortical structures on both sides of the jet centreline evolve and advect out of phase with each other, producing symmetry-breaking phenomena that underlie the suppression mechanism characteristic of transverse forcing.

When transversely forced at amplitudes below the lock-in threshold, the jet exhibits quasi-periodicity characterised by complex temporal dynamics (Kushwaha et al. Reference Kushwaha, Worth, Dawson, Gupta and Li2022). In this state, the initial shear layers near the nozzle exit roll up axisymmetrically at $t/T = 0$
, preserving in-phase vortex formation on both sides of the jet centreline. This symmetric roll-up is evident in figures 9(a,b) and quantitatively corroborated by figures 8(b,c), revealing that during early convection (
$t/T = 0$
, preserving in-phase vortex formation on both sides of the jet centreline. This symmetric roll-up is evident in figures 9(a,b) and quantitatively corroborated by figures 8(b,c), revealing that during early convection ( $t/T \lt 1$
), the LHS and RHS vortex cores follow nearly congruent axial trajectories. However, as the vortical structures advect progressively downstream beyond
$t/T \lt 1$
), the LHS and RHS vortex cores follow nearly congruent axial trajectories. However, as the vortical structures advect progressively downstream beyond $t/T \gt 1$
, systematic phase divergence develops between the cores. This asymmetric evolution manifests through increasingly distinct axial trajectories for the respective vortex cores, as seen in figure 8(b). This implies differential convective velocities between the two sides for any given time instant. The resulting asymmetric evolution leads to preferential circulation accumulation on one side of the centreline, while the individual vortex circulation strength at pinch-off remains approximately symmetric across the jet centreline (figure 8
g). In the far field (
$t/T \gt 1$
, systematic phase divergence develops between the cores. This asymmetric evolution manifests through increasingly distinct axial trajectories for the respective vortex cores, as seen in figure 8(b). This implies differential convective velocities between the two sides for any given time instant. The resulting asymmetric evolution leads to preferential circulation accumulation on one side of the centreline, while the individual vortex circulation strength at pinch-off remains approximately symmetric across the jet centreline (figure 8
g). In the far field ( $x/D \gt 2$
), vortical structures undergo straining and deformation processes that promote structural fragmentation (figure 9
a). This degradation is evidenced by the bifurcation of the LHS vortex into two distinct segments near
$x/D \gt 2$
), vortical structures undergo straining and deformation processes that promote structural fragmentation (figure 9
a). This degradation is evidenced by the bifurcation of the LHS vortex into two distinct segments near $x/D \approx 2.5$
at
$x/D \approx 2.5$
at $t/T = 2$
(figure 8
b). At moderate forcing amplitudes (figures 9(b) and 8(c,h)), this premature splitting event initiates a cascade of effects: divergent convective velocities emerge between the separated vortical segments, culminating in the degradation of overall vortical coherence. This phenomenon is attributed to the intensified transverse velocity fluctuations accompanying the increased forcing amplitude. When forced transversely at the critical amplitude required for synchronisation, the jet undergoes profound symmetry breaking that fundamentally restructures the spatial distribution of vortical structures. The initial shear-layer roll-up processes become temporally phase-shifted, with the LHS and RHS shear layers no longer rolling up synchronously (figure 10
a). This asymmetric roll-up results in vortex cores consistently occupying distinct axial positions throughout the forcing cycle, leading to a persistent spatial separation between opposing vortical structures (figure 8
d). Consequently, a consistent
$t/T = 2$
(figure 8
b). At moderate forcing amplitudes (figures 9(b) and 8(c,h)), this premature splitting event initiates a cascade of effects: divergent convective velocities emerge between the separated vortical segments, culminating in the degradation of overall vortical coherence. This phenomenon is attributed to the intensified transverse velocity fluctuations accompanying the increased forcing amplitude. When forced transversely at the critical amplitude required for synchronisation, the jet undergoes profound symmetry breaking that fundamentally restructures the spatial distribution of vortical structures. The initial shear-layer roll-up processes become temporally phase-shifted, with the LHS and RHS shear layers no longer rolling up synchronously (figure 10
a). This asymmetric roll-up results in vortex cores consistently occupying distinct axial positions throughout the forcing cycle, leading to a persistent spatial separation between opposing vortical structures (figure 8
d). Consequently, a consistent $90^\circ$
phase lag develops between opposing vortices, producing a staggered arrangement of vortical structures in the near field (figure 10
a). This spatiotemporal offset manifests as an unequal total circulation distribution on either side of the jet centreline, with one side exhibiting preferential circulation accumulation relative to the other (figure 8
i). When the forcing amplitude exceeds the lock-in threshold, the asymmetric evolution intensifies markedly: the axial separation between vortex cores further increases (figures 10(b) and 8(e)), causing the phase difference between vortical structures to rise from
$90^\circ$
phase lag develops between opposing vortices, producing a staggered arrangement of vortical structures in the near field (figure 10
a). This spatiotemporal offset manifests as an unequal total circulation distribution on either side of the jet centreline, with one side exhibiting preferential circulation accumulation relative to the other (figure 8
i). When the forcing amplitude exceeds the lock-in threshold, the asymmetric evolution intensifies markedly: the axial separation between vortex cores further increases (figures 10(b) and 8(e)), causing the phase difference between vortical structures to rise from $90^\circ$
to approximately
$90^\circ$
to approximately $120^\circ$
. This staggered configuration induces additional geometric distortion of the vortex ring structure, producing pronounced tilting of the vortical elements relative to the jet centreline, and amplifying the departure from axisymmetric flow organisation. Despite the pronounced out-of-phase roll-up dynamics of the shear layers, a remarkable feature emerges: the peak circulation strength of the individual vortical structures remains invariant across all forcing amplitudes (figures 8
i, j). Each vortical structure exhibits linear circulation growth during the vorticity entrainment phase, followed by saturation at
$120^\circ$
. This staggered configuration induces additional geometric distortion of the vortex ring structure, producing pronounced tilting of the vortical elements relative to the jet centreline, and amplifying the departure from axisymmetric flow organisation. Despite the pronounced out-of-phase roll-up dynamics of the shear layers, a remarkable feature emerges: the peak circulation strength of the individual vortical structures remains invariant across all forcing amplitudes (figures 8
i, j). Each vortical structure exhibits linear circulation growth during the vorticity entrainment phase, followed by saturation at $\varGamma _{vr}^* \approx 1$
. The temporal offset inherent to asymmetric vortex formation results in staggered pinch-off times, but both sides ultimately achieve an equivalent circulation strength at their respective saturation points.
$\varGamma _{vr}^* \approx 1$
. The temporal offset inherent to asymmetric vortex formation results in staggered pinch-off times, but both sides ultimately achieve an equivalent circulation strength at their respective saturation points.
3.3.2. Symmetry breaking in a transversely forced jet
Having demonstrated that transverse forcing fundamentally disrupts the inherent axisymmetry of the $m=0$
global mode through systematic phase shifting of opposing shear layers, we next provide a quantitative metric to assess the symmetry-breaking phenomenon. First, we extract instantaneous streamwise vorticity profiles at
$m=0$
global mode through systematic phase shifting of opposing shear layers, we next provide a quantitative metric to assess the symmetry-breaking phenomenon. First, we extract instantaneous streamwise vorticity profiles at $y/D =\pm 0.5$
, and apply the Hilbert transform to these profiles. We then construct normalised histograms of the phase shift
$y/D =\pm 0.5$
, and apply the Hilbert transform to these profiles. We then construct normalised histograms of the phase shift $\varTheta$
between the LHS and RHS vortices, as shown in figure 11. For the unforced jet, the histogram peaks sharply at
$\varTheta$
between the LHS and RHS vortices, as shown in figure 11. For the unforced jet, the histogram peaks sharply at $\varTheta =0$
, confirming the in-phase roll-up of the axisymmetric
$\varTheta =0$
, confirming the in-phase roll-up of the axisymmetric $m=0$
global mode. However, figure 11 also shows that transverse forcing induces systematic phase divergence, which intensifies with increasing forcing amplitudes. Specifically, when forced below the critical amplitudes for which the jet exhibits quasi-periodicity, both the LHS and RHS vortical structures formed from the in-phase roll up of the initial shear layers gradually become out of phase as they advect downstream. This is evidenced by a broadening of the phase difference histogram around small but finite values of
$m=0$
global mode. However, figure 11 also shows that transverse forcing induces systematic phase divergence, which intensifies with increasing forcing amplitudes. Specifically, when forced below the critical amplitudes for which the jet exhibits quasi-periodicity, both the LHS and RHS vortical structures formed from the in-phase roll up of the initial shear layers gradually become out of phase as they advect downstream. This is evidenced by a broadening of the phase difference histogram around small but finite values of $\varTheta$
in figure 11, with
$\varTheta$
in figure 11, with $\varTheta$
peaking at approximately
$\varTheta$
peaking at approximately $\pi /4$
. At lock-in, the histogram peaks at approximately
$\pi /4$
. At lock-in, the histogram peaks at approximately $\varTheta =\pi /2$
, corroborating the temporal offset between opposing shear-layer roll-up events. When the forcing amplitude exceeds the lock-in threshold, the phase difference further increases to
$\varTheta =\pi /2$
, corroborating the temporal offset between opposing shear-layer roll-up events. When the forcing amplitude exceeds the lock-in threshold, the phase difference further increases to $2\pi /3$
, producing pronounced staggered vortical arrangements. These progressive phase shifts demonstrate that transverse forcing generates a transverse flapping motion that systematically breaks the
$2\pi /3$
, producing pronounced staggered vortical arrangements. These progressive phase shifts demonstrate that transverse forcing generates a transverse flapping motion that systematically breaks the $m=0$
axisymmetry by inducing temporally offset, spatially staggered roll-up of vortical structures in the opposing shear layers.
$m=0$
axisymmetry by inducing temporally offset, spatially staggered roll-up of vortical structures in the opposing shear layers.
Normalised histogram of the phase shift $\varTheta$
between the left- and right-hand shear layers of a jet forced transversely at
$\varTheta$
between the left- and right-hand shear layers of a jet forced transversely at $f_{\!f} /f_n = 1.09$
for four different amplitudes: (i) unforced where
$f_{\!f} /f_n = 1.09$
for four different amplitudes: (i) unforced where $\varTheta$
peaks at 0, (ii) moderate forcing during quasi-periodicity where
$\varTheta$
peaks at 0, (ii) moderate forcing during quasi-periodicity where $\varTheta$
peaks at
$\varTheta$
peaks at $\pi /4$
, (iii) lock-in onset where
$\pi /4$
, (iii) lock-in onset where $\varTheta$
peaks at
$\varTheta$
peaks at $\pi /2$
, and (iv) beyond lock-in where
$\pi /2$
, and (iv) beyond lock-in where $\varTheta$
peaks at
$\varTheta$
peaks at $2\pi /3$
. Progressive increases in phase shift values
$2\pi /3$
. Progressive increases in phase shift values $\varTheta$
indicate that transverse forcing breaks the
$\varTheta$
indicate that transverse forcing breaks the $m=0$
axisymmetry.
$m=0$
axisymmetry.

While modal interactions between the natural $m=0$
mode and the excited
$m=0$
mode and the excited $m=\pm 1$
modes can lead to oscillation suppression, mean-flow modification represents another plausible suppression mechanism. Specifically, transverse forcing can act as a counter to the natural axisymmetric mean flow by inducing strong in-phase transverse velocity fluctuations around the jet centreline. This modified mean flow can nonlinearly interact with the
$m=\pm 1$
modes can lead to oscillation suppression, mean-flow modification represents another plausible suppression mechanism. Specifically, transverse forcing can act as a counter to the natural axisymmetric mean flow by inducing strong in-phase transverse velocity fluctuations around the jet centreline. This modified mean flow can nonlinearly interact with the $m=0$
global mode, weakening the axisymmetric oscillations, and producing a drastic amplitude reduction. This stabilisation mechanism through mean-flow modification is analogous to that demonstrated by Skene, Qadri & Schmid (Reference Skene, Qadri and Schmid2020), where counter-rotating forcing stabilised swirling jets through analogous base-flow alterations.
$m=0$
global mode, weakening the axisymmetric oscillations, and producing a drastic amplitude reduction. This stabilisation mechanism through mean-flow modification is analogous to that demonstrated by Skene, Qadri & Schmid (Reference Skene, Qadri and Schmid2020), where counter-rotating forcing stabilised swirling jets through analogous base-flow alterations.
3.3.3. In response to axial forcing
Figure 12 shows the phase-averaged vorticity distribution in the $x{-}y$
plane, akin to figure 8, but focusing on the axially forced jet. As with the unforced case, figure 12(a) shows that the initial shear layers on both sides of the jet centreline roll up axisymmetrically, forming coherent vortical structures that remain in phase throughout near-field advection. These synchronously advecting vortical structures produce nearly equal total circulations on either side of the jet centreline, as quantitatively corroborated by figures 12(a) and 12( f).
$x{-}y$
plane, akin to figure 8, but focusing on the axially forced jet. As with the unforced case, figure 12(a) shows that the initial shear layers on both sides of the jet centreline roll up axisymmetrically, forming coherent vortical structures that remain in phase throughout near-field advection. These synchronously advecting vortical structures produce nearly equal total circulations on either side of the jet centreline, as quantitatively corroborated by figures 12(a) and 12( f).
The quantities shown are the same as those in figure 8 but for the axially forced jet. At lock-in (d) and beyond (e), both the LHS and RHS vortical structures on either side of the jet centreline occupy identical axial positions during downstream advection, confirming in-phase evolution that preserves the axisymmetric flow topology.

In the quasi-periodic regime, the spatial organisation of vortical structures in the near field of the jet exhibits striking similarities to configurations observed under transverse forcing (cf. figures 10(a,b) and 13(a,b)). The axial trajectories of both LHS and RHS vortex cores remain nearly aligned throughout the initial convection period $t/T \lt 1$
, as demonstrated in figures 12(b,c). This indicates that the in-phase roll-up of the initial shear layers between opposing sides of the jet centreline remains preserved during the early stages of vortical formation (figures 13
a,b). However, fundamental distinctions emerge during downstream evolution when
$t/T \lt 1$
, as demonstrated in figures 12(b,c). This indicates that the in-phase roll-up of the initial shear layers between opposing sides of the jet centreline remains preserved during the early stages of vortical formation (figures 13
a,b). However, fundamental distinctions emerge during downstream evolution when $t/T \gt 1$
. The axially forced jet exhibits no evidence of vortex fragmentation or splitting as the vortical structures advect downstream, contrasting markedly with bifurcation behaviour characteristic of transverse forcing. Notably, the phase disparity that develops between advecting vortical structures on opposing sides of the jet centreline is substantially higher for the axially forced jet than for the transversely forced jet, as evidenced in figures 12(b,c). This enhanced phase disparity generates differential convective velocities between the LHS and RHS vortical structures, establishing an asymmetric vorticity flux distribution that preferentially accumulates circulation on the side characterised by higher convective velocity. Consequently, the total circulation strength
$t/T \gt 1$
. The axially forced jet exhibits no evidence of vortex fragmentation or splitting as the vortical structures advect downstream, contrasting markedly with bifurcation behaviour characteristic of transverse forcing. Notably, the phase disparity that develops between advecting vortical structures on opposing sides of the jet centreline is substantially higher for the axially forced jet than for the transversely forced jet, as evidenced in figures 12(b,c). This enhanced phase disparity generates differential convective velocities between the LHS and RHS vortical structures, establishing an asymmetric vorticity flux distribution that preferentially accumulates circulation on the side characterised by higher convective velocity. Consequently, the total circulation strength $\varGamma _{\textit{tot}}^*$
becomes markedly unequal between the two sides of the jet centreline, as quantitatively demonstrated in figures 12(g,h). The progressive downstream advection of vortical structures at differential convective velocities amplifies this asymmetric evolution, ultimately producing a heightened degree of non-axisymmetric flow organisation during the quasi-periodic state (figures 13
a,b). This non-axisymmetric distribution of vortical structures within the near field exhibits direct correlation with amplitude reduction in the oscillation response, demonstrating a consistent mechanism that operates irrespective of the specific forcing symmetry, whether axial or transverse.
$\varGamma _{\textit{tot}}^*$
becomes markedly unequal between the two sides of the jet centreline, as quantitatively demonstrated in figures 12(g,h). The progressive downstream advection of vortical structures at differential convective velocities amplifies this asymmetric evolution, ultimately producing a heightened degree of non-axisymmetric flow organisation during the quasi-periodic state (figures 13
a,b). This non-axisymmetric distribution of vortical structures within the near field exhibits direct correlation with amplitude reduction in the oscillation response, demonstrating a consistent mechanism that operates irrespective of the specific forcing symmetry, whether axial or transverse.
The quantities shown are the same as those in figure 7 but for the quasi-periodic state when forced axially at two different forcing amplitudes: (a) low amplitude, $A_{\!f} =0.31$
; and (b) moderate amplitude,
$A_{\!f} =0.31$
; and (b) moderate amplitude, $A_{\!f} =0.57$
. While the initial shear layers on both sides of the jet centreline roll up in phase with each other, the vortical structures become out of phase as they evolve and advect downstream.
$A_{\!f} =0.57$
. While the initial shear layers on both sides of the jet centreline roll up in phase with each other, the vortical structures become out of phase as they evolve and advect downstream.

When the forcing amplitude reaches or exceeds the lock-in threshold – the critical forcing amplitude at which the jet achieves synchronisation to $f_{\!f}$
– the spatial organisation of vortical structures undergoes transition from the asymmetric to the natural axisymmetric configuration characteristic of the unforced jet, as visualised in figures 14(a,b). This axisymmetric spatial realignment emerges as a consequence of phase-coherent shear-layer roll-up processes, wherein successive vortices formed in the near field of the jet maintain consistent phase relationships throughout their downstream evolution. This transition to axisymmetry arrangement is reflected in figures 12(d,e), which show that LHS and RHS vortex cores consistently occupy identical axial positions throughout their downstream advection process. This spatial alignment ensures that both LHS and RHS vortical structures advect with equal convective velocities, thereby establishing a uniform vorticity flux distribution across the jet centreline (figures 12
i, j). The circulation strength
$f_{\!f}$
– the spatial organisation of vortical structures undergoes transition from the asymmetric to the natural axisymmetric configuration characteristic of the unforced jet, as visualised in figures 14(a,b). This axisymmetric spatial realignment emerges as a consequence of phase-coherent shear-layer roll-up processes, wherein successive vortices formed in the near field of the jet maintain consistent phase relationships throughout their downstream evolution. This transition to axisymmetry arrangement is reflected in figures 12(d,e), which show that LHS and RHS vortex cores consistently occupy identical axial positions throughout their downstream advection process. This spatial alignment ensures that both LHS and RHS vortical structures advect with equal convective velocities, thereby establishing a uniform vorticity flux distribution across the jet centreline (figures 12
i, j). The circulation strength $\varGamma _{vr}^*$
for both LHS and RHS vortical structures exhibits simultaneous, in-phase growth from
$\varGamma _{vr}^*$
for both LHS and RHS vortical structures exhibits simultaneous, in-phase growth from $t/T=0$
, subsequently reaching a concurrent plateau at maximum circulation strength
$t/T=0$
, subsequently reaching a concurrent plateau at maximum circulation strength $\varGamma _{vr}^*=1$
at approximately
$\varGamma _{vr}^*=1$
at approximately $t/T\approx 1$
, as evidenced in figures 12(i, j). This synchronous temporal evolution of vortical structures on both sides of the jet centreline closely resembles the behaviour observed in the unforced jet configuration, indicating that axial forcing at or above the lock-in amplitude effectively preserves the
$t/T\approx 1$
, as evidenced in figures 12(i, j). This synchronous temporal evolution of vortical structures on both sides of the jet centreline closely resembles the behaviour observed in the unforced jet configuration, indicating that axial forcing at or above the lock-in amplitude effectively preserves the $m=0$
azimuthal symmetry of the natural jet while imposing temporal periodicity.
$m=0$
azimuthal symmetry of the natural jet while imposing temporal periodicity.
The quantities shown are the same as those in figure 7 but at a lock-in state when forced axially (a) at critical lock-in amplitude $A_{\!f} =1$
and (b) above lock-in amplitude
$A_{\!f} =1$
and (b) above lock-in amplitude $A_{\!f} =1.68$
. Under lock-in conditions, vortical structures on both sides of the jet centreline evolve and advect in phase, preserving the axisymmetric topology of the unforced jet. This in-phase evolution maintains structural symmetry and prevents the symmetry-breaking dynamics observed under transverse forcing, thereby sustaining strong oscillation amplitudes as the jet transitions through lock-in.
$A_{\!f} =1.68$
. Under lock-in conditions, vortical structures on both sides of the jet centreline evolve and advect in phase, preserving the axisymmetric topology of the unforced jet. This in-phase evolution maintains structural symmetry and prevents the symmetry-breaking dynamics observed under transverse forcing, thereby sustaining strong oscillation amplitudes as the jet transitions through lock-in.

The quantities shown are the same as those in figure 7 but for the axially forced jet at lock-in when forced at (a) $f_{\!f}/f_n=1.09$
and (b)
$f_{\!f}/f_n=1.09$
and (b) $f_{\!f}/f/n=0.8$
. When
$f_{\!f}/f/n=0.8$
. When $f_{\!f}/f_n\gt 1$
as in (a), vortical structures remain more compact and undergo vortex merging as they advect downstream. Conversely, when
$f_{\!f}/f_n\gt 1$
as in (a), vortical structures remain more compact and undergo vortex merging as they advect downstream. Conversely, when $f_{\!f}/f_n\lt 1$
as in (b), the coherent vortical structures exhibit increased spatial growth and persistence without undergoing vortex merging as they advect downstream.
$f_{\!f}/f_n\lt 1$
as in (b), the coherent vortical structures exhibit increased spatial growth and persistence without undergoing vortex merging as they advect downstream.

The quantities shown are the same as those in figure 15 but for the transversely forced jet.

We now examine the development of vortical structures in the near field under lock-in conditions for both axially and transversely forced jets at two distinct frequency ratios: $f_{\!f}/f_n\lt 1$
and
$f_{\!f}/f_n\lt 1$
and $f_{\!f}/f_n\gt 1$
. Figures 15 and 16 reveal that the streamwise separation between successive vortices exhibits pronounced dependence on the frequency ratio for both forcing symmetries. Vortex spacing increases substantially when
$f_{\!f}/f_n\gt 1$
. Figures 15 and 16 reveal that the streamwise separation between successive vortices exhibits pronounced dependence on the frequency ratio for both forcing symmetries. Vortex spacing increases substantially when $f_{\!f}/f_n \lt 1$
(figures 15(b) and 16(b)) compared to conditions when
$f_{\!f}/f_n \lt 1$
(figures 15(b) and 16(b)) compared to conditions when $f_{\!f}/f_n \gt 1$
(figures 15(a) and 16(a)), reflecting the wavelength characteristics of the induced perturbations. Lower forcing frequencies (
$f_{\!f}/f_n \gt 1$
(figures 15(a) and 16(a)), reflecting the wavelength characteristics of the induced perturbations. Lower forcing frequencies ( $f_{\!f}/f_n \lt 1$
) generate longer wavelengths and correspondingly increased inter-vortex spacing, which inhibits interactions with downstream structures formed during previous cycles and hinders vortex merging, as evidenced in figures 15(b) and 16(b). Under these conditions, the vortical structures on both sides of the jet continue to grow while maintaining structural coherence during downstream advection. Conversely, when forced at
$f_{\!f}/f_n \lt 1$
) generate longer wavelengths and correspondingly increased inter-vortex spacing, which inhibits interactions with downstream structures formed during previous cycles and hinders vortex merging, as evidenced in figures 15(b) and 16(b). Under these conditions, the vortical structures on both sides of the jet continue to grow while maintaining structural coherence during downstream advection. Conversely, when forced at $f_{\!f}/f_n \gt 1$
, successive vortices exhibit reduced streamwise separation, facilitating interactions with downstream structures and promoting vortex merging. The advecting vortical structures consequently undergo rapid loss of structural coherence, and experience diffusive spreading during the merging process, as evidenced in figures 15(a) and 16(a). Although the spatiotemporal dynamics of vortical structures exhibit similar trends for both forcing orientations, a fundamental asymmetry emerges in the amplitude response of axially forced jets. Specifically, axial forcing produces oscillation amplitude enhancement when
$f_{\!f}/f_n \gt 1$
, successive vortices exhibit reduced streamwise separation, facilitating interactions with downstream structures and promoting vortex merging. The advecting vortical structures consequently undergo rapid loss of structural coherence, and experience diffusive spreading during the merging process, as evidenced in figures 15(a) and 16(a). Although the spatiotemporal dynamics of vortical structures exhibit similar trends for both forcing orientations, a fundamental asymmetry emerges in the amplitude response of axially forced jets. Specifically, axial forcing produces oscillation amplitude enhancement when $f_{\!f} \lt f_n$
, while generating amplitude attenuation when
$f_{\!f} \lt f_n$
, while generating amplitude attenuation when $f_{\!f} \gt f_n$
, as demonstrated in figure 5. This asymmetric behaviour about
$f_{\!f} \gt f_n$
, as demonstrated in figure 5. This asymmetric behaviour about $f_{\!f}/f_n = 1$
can be attributed to the interplay between the jet response time scale (
$f_{\!f}/f_n = 1$
can be attributed to the interplay between the jet response time scale ( $t_r \propto 1/f$
) and power transfer mechanisms involving the fundamental mode, subharmonic mode and applied forcing (Davitian et al. Reference Davitian, Getsinger, Hendrickson and Karagozian2010a
). For
$t_r \propto 1/f$
) and power transfer mechanisms involving the fundamental mode, subharmonic mode and applied forcing (Davitian et al. Reference Davitian, Getsinger, Hendrickson and Karagozian2010a
). For $f_{\!f} \lt f_n$
, the extended response time (
$f_{\!f} \lt f_n$
, the extended response time ( $t_{r,f} \gt t_{r,n}$
) provides greater temporal duration for forcing input to act upon the jet, resulting in enhanced power transfer from the external forcing to the global mode. This increased energy transfer manifests as higher oscillation amplitudes. Conversely, at
$t_{r,f} \gt t_{r,n}$
) provides greater temporal duration for forcing input to act upon the jet, resulting in enhanced power transfer from the external forcing to the global mode. This increased energy transfer manifests as higher oscillation amplitudes. Conversely, at $f_{\!f} \gt f_n$
, the reduced interaction time (
$f_{\!f} \gt f_n$
, the reduced interaction time ( $t_{r,f} \lt t_{r,n}$
) limits power transfer efficiency, leading to diminished oscillation amplitudes. Furthermore, when subjected to axial forcing at
$t_{r,f} \lt t_{r,n}$
) limits power transfer efficiency, leading to diminished oscillation amplitudes. Furthermore, when subjected to axial forcing at $f_{\!f} \gt f_n$
, energy redistribution occurs within the flow field through nonlinear interactions between successive vortices, particularly vortex pairing phenomena. This process facilitates energy transfer from the dominant global mode to subharmonic modes, contributing to amplitude reduction. The absence of such energy redistribution mechanisms when
$f_{\!f} \gt f_n$
, energy redistribution occurs within the flow field through nonlinear interactions between successive vortices, particularly vortex pairing phenomena. This process facilitates energy transfer from the dominant global mode to subharmonic modes, contributing to amplitude reduction. The absence of such energy redistribution mechanisms when $f_{\!f} \lt f_n$
results in oscillation amplification. In contrast to axial forcing, transversely forced jets exhibit no such disparity in their amplitude response, regardless of whether
$f_{\!f} \lt f_n$
results in oscillation amplification. In contrast to axial forcing, transversely forced jets exhibit no such disparity in their amplitude response, regardless of whether $f_{\!f}/f_n \lt 1$
or
$f_{\!f}/f_n \lt 1$
or $f_{\!f}/f_n \gt 1$
. This fundamental difference stems from the topological modifications imposed by transverse forcing on the naturally occurring vortical structures. Transverse forcing fundamentally reorganises the spatial distribution of vortical structures into a staggered arrangement within the near field, redistributing energy from the dominant global mode to alternative modes through systematic breaking of the
$f_{\!f}/f_n \gt 1$
. This fundamental difference stems from the topological modifications imposed by transverse forcing on the naturally occurring vortical structures. Transverse forcing fundamentally reorganises the spatial distribution of vortical structures into a staggered arrangement within the near field, redistributing energy from the dominant global mode to alternative modes through systematic breaking of the $m = 0$
axisymmetric character of the global mode, as detailed in § 3.4.
$m = 0$
axisymmetric character of the global mode, as detailed in § 3.4.
3.4. Spectral POD
Having established the fundamental differences in vortical evolution between axial and transverse forcing through direct analysis of instantaneous flow fields, we now employ spectral POD (SPOD) to extract the dynamically dominant coherent structures from the time-resolved velocity data (Picard & Delville Reference Picard and Delville2000). The SPOD decomposes the time-resolved data into frequency-specific modes of dynamical significance, which optimally represent second-order space–time flow statistics (Towne, Schmidt & Colonius Reference Towne, Schmidt and Colonius2018). This method provides insights into the underlying physics of the flow dynamics by separating the flow phenomena occurring at different time scales. The selection of SPOD over alternative decomposition techniques, such as spatial-only POD and dynamic mode decomposition (DMD), is motivated by its unique capability to combine the advantages of both methodologies: (i) the spatial orthogonalisation characteristic of classical POD, and (ii) the temporal orthogonalisation inherent in DMD. Specifically, SPOD produces energy-ranked modes that oscillate at a single frequency, maintain orthogonality with other modes at identical frequencies, and provide an optimal basis by accounting for the variability in the jet dynamics (Schmidt et al. Reference Schmidt, Towne, Rigas, Colonius and Brès2018). This methodology has demonstrated efficacy across diverse flow configurations, including flow over cylinders (Araya, Colonius & Dabiri Reference Araya, Colonius and Dabiri2017), flow over an aerofoil (Abreu, Cavalieri & Wolf Reference Abreu, Cavalieri and Wolf2017), boundary layer flows (Abreu et al. Reference Abreu, Cavalieri, Schlatter, Vinuesa and Henningson2020), and axisymmetric jet flows (Towne et al. Reference Towne, Schmidt and Colonius2018). In this study, we perform SPOD to extract and isolate the dynamically dominant structures that evolve coherently in both space and time under periodic and quasi-periodic oscillation regimes. These dynamical states can emerge under both axial and transverse forcing, providing an opportunity to discern differences in the spatial mode characteristics between similar dynamical states excited by different forcing symmetries. The SPOD procedure implemented in the present study follows the algorithm outlined in Schmidt & Colonius (Reference Schmidt and Colonius2020), and is briefly described in Appendix C.
3.4.1. Periodic states: unforced and forced synchronisation
Figures 17(a–c) show the normalised SPOD eigenvalue spectra of the vorticity field as functions of $f_{\!f}/f_n$
, providing insights into the relative distribution of modal energy between the leading SPOD mode (mode 1) and the subsequent modes of lower energy. A substantial separation between the eigenvalues of mode 1 and succeeding modes indicates that the leading mode possesses significantly greater energy and exerts dominance over the prevalent coherent structures within the flow field. The presence of a prominent peak in the eigenvalue spectra at the fundamental frequency
$f_{\!f}/f_n$
, providing insights into the relative distribution of modal energy between the leading SPOD mode (mode 1) and the subsequent modes of lower energy. A substantial separation between the eigenvalues of mode 1 and succeeding modes indicates that the leading mode possesses significantly greater energy and exerts dominance over the prevalent coherent structures within the flow field. The presence of a prominent peak in the eigenvalue spectra at the fundamental frequency $f_n$
and
$f_n$
and $f_{\!f}$
for unforced and forced configurations, respectively (as seen in figures 17
a–c), suggests that most of the energy is contained within these dominant modal frequencies.
$f_{\!f}$
for unforced and forced configurations, respectively (as seen in figures 17
a–c), suggests that most of the energy is contained within these dominant modal frequencies.
The SPOD of the vorticity field under periodic oscillations for three forcing conditions: (a,d) unforced jet, (b,e) axially forced jet at lock-in, and (c, f,g) transversely forced jet at lock-in. Shown are (a–c) SPOD eigenvalue spectra normalised by the total flow energy, (d–f) the leading SPOD modes with the highest eigenvalue at $f_n$
(unforced) and at
$f_n$
(unforced) and at $f_{\!f}$
(forced cases), and (g) the second SPOD mode for the transversely forced jet at
$f_{\!f}$
(forced cases), and (g) the second SPOD mode for the transversely forced jet at $f_{\!f}$
.
$f_{\!f}$
.

Figures 17(d–g) show the SPOD modes of the vorticity field at the most energetic frequency for three different forcing conditions: unforced, axially forced and transversely forced. The jet exhibits periodic oscillations for all three cases, due to natural self-excitation or lock-in. Figures 17(d) and 17(e) show the leading SPOD mode at $f_n$
and
$f_n$
and $f_{\!f}$
for the unforced and axially forced jets, respectively. These dominant spatial modes manifest as a series of counter-rotating vortical structures forming coherent wavepackets that advect along the shear layers on both sides of the jet centreline. Notably, these localised wavepackets appear particularly energetic at
$f_{\!f}$
for the unforced and axially forced jets, respectively. These dominant spatial modes manifest as a series of counter-rotating vortical structures forming coherent wavepackets that advect along the shear layers on both sides of the jet centreline. Notably, these localised wavepackets appear particularly energetic at $1 \lt x/D \lt 2$
, which coincides with the region of maximum velocity fluctuations. This region of maximum amplitude is downstream of the wavemaker region due to convective amplification of upstream disturbances (Lesshafft et al. Reference Lesshafft, Huerre, Sagaut and Terracol2006; Coenen et al. Reference Coenen, Lesshafft, Garnaud and Sevilla2017; Qadri et al. Reference Qadri, Chandler and Juniper2018); the region of maximum amplitude also differs from the region of maximum receptivity to forcing. Both the unforced jet (figure 17
d) and the purely axially forced jet (figure 17
e) exhibit vortical wavepackets with an antisymmetric pattern about the jet centreline, characteristic of an axisymmetric jet dominated by a global mode with azimuthal wavenumber
$1 \lt x/D \lt 2$
, which coincides with the region of maximum velocity fluctuations. This region of maximum amplitude is downstream of the wavemaker region due to convective amplification of upstream disturbances (Lesshafft et al. Reference Lesshafft, Huerre, Sagaut and Terracol2006; Coenen et al. Reference Coenen, Lesshafft, Garnaud and Sevilla2017; Qadri et al. Reference Qadri, Chandler and Juniper2018); the region of maximum amplitude also differs from the region of maximum receptivity to forcing. Both the unforced jet (figure 17
d) and the purely axially forced jet (figure 17
e) exhibit vortical wavepackets with an antisymmetric pattern about the jet centreline, characteristic of an axisymmetric jet dominated by a global mode with azimuthal wavenumber $m = 0$
. Their corresponding SPOD spectra (figures 17
a,b) reveal a significant difference in the eigenvalues between the two leading SPOD modes (modes 1 and 2) at the dominant frequency. Physically, this implies that the majority of the energy supplied by the axial forcing to the jet is concentrated in the leading SPOD mode, which shares the same characteristic features as that of the unforced jet exhibiting
$m = 0$
. Their corresponding SPOD spectra (figures 17
a,b) reveal a significant difference in the eigenvalues between the two leading SPOD modes (modes 1 and 2) at the dominant frequency. Physically, this implies that the majority of the energy supplied by the axial forcing to the jet is concentrated in the leading SPOD mode, which shares the same characteristic features as that of the unforced jet exhibiting $m=0$
oscillations. Put together, this finding provides compelling evidence that axial forcing not only preserves the inherent axisymmetry of the
$m=0$
oscillations. Put together, this finding provides compelling evidence that axial forcing not only preserves the inherent axisymmetry of the $m=0$
global mode but also reinforces it.
$m=0$
global mode but also reinforces it.
The SPOD spectra of the transversely forced jet (figure 17
c) reveal a marked reduction in eigenvalue separation between modes 1 and 2, suggesting departure from low-rank modal behaviour. This reduction indicates that the dynamics of the transversely forced jet undergoing periodic oscillations cannot be adequately represented by the leading mode alone, requiring contributions from multiple modes for complete characterisation. In figures 17( f,g), we show the first two leading SPOD modes (modes 1 and 2) at $f_{\!f}$
for the transversely forced jet. In contrast to unforced or axially forced configurations, these modes reveal that the vortical wavepackets are no longer antisymmetric about the jet centreline; instead, they exhibit a phase relationship of
$f_{\!f}$
for the transversely forced jet. In contrast to unforced or axially forced configurations, these modes reveal that the vortical wavepackets are no longer antisymmetric about the jet centreline; instead, they exhibit a phase relationship of $\pi /2$
. The more energetic mode (mode 1) is localised upstream, while the subdominant mode (mode 2) is localised in the downstream region. Collectively, these findings indicate that transverse forcing redistributes the power associated with the
$\pi /2$
. The more energetic mode (mode 1) is localised upstream, while the subdominant mode (mode 2) is localised in the downstream region. Collectively, these findings indicate that transverse forcing redistributes the power associated with the $m=0$
axisymmetric mode to asymmetric modes, weakening the global mode and breaking its inherent axisymmetry. This modal energy redistribution provides the fundamental mechanism for the substantial amplitude suppression observed in transversely forced configurations, as the coherent energy concentration characteristic of the natural global mode becomes dispersed across multiple modal structures.
$m=0$
axisymmetric mode to asymmetric modes, weakening the global mode and breaking its inherent axisymmetry. This modal energy redistribution provides the fundamental mechanism for the substantial amplitude suppression observed in transversely forced configurations, as the coherent energy concentration characteristic of the natural global mode becomes dispersed across multiple modal structures.
3.4.2. Quasi-periodic states
Figures 18(a,b) show the eigenvalue spectra for the vorticity field during quasi-periodic oscillations under both axial and transverse forcing conditions. As before, the substantial eigenvalue separation between the leading mode and subsequent modes, observed in both axially forced (figure 18
a) and transversely forced (figure 18
b) configurations, highlights the dominant role of mode 1 in governing the spatiotemporal dynamics of the flow field during this dynamical state. In addition to the prominent peaks at $f_{\!f}$
and
$f_{\!f}$
and $f_n$
, the eigenvalue spectra also reveal an additional peak at
$f_n$
, the eigenvalue spectra also reveal an additional peak at $f_{\!f}-f_n$
for the transversely forced case, which corresponds to the beating frequency. However, the amplitude at
$f_{\!f}-f_n$
for the transversely forced case, which corresponds to the beating frequency. However, the amplitude at $f_{\!f}-f_n$
is approximately one order of magnitude lower than that of the primary spectral peaks at
$f_{\!f}-f_n$
is approximately one order of magnitude lower than that of the primary spectral peaks at $f_{\!f}$
and
$f_{\!f}$
and $f_n$
, indicating that its energetic contribution to the overall jet dynamics remains comparatively limited.
$f_n$
, indicating that its energetic contribution to the overall jet dynamics remains comparatively limited.
The SPOD of the vorticity field under quasi-periodic conditions for (a,c,d) the axial forcing and (b,e, f) the transverse forcing. Shown are (a,b) SPOD eigenvalue spectra normalised by the total flow energy, (c–f) the leading SPOD modes at $f_{\!f}$
and
$f_{\!f}$
and $f_n$
for the axially forced cases (c,d) and the transversely forced cases (e, f).
$f_n$
for the axially forced cases (c,d) and the transversely forced cases (e, f).

Figures 18(c–f) show the dominant SPOD mode at $f_n$
and
$f_n$
and $f_{\!f}$
for both the axially forced and transversely forced jets, representing the two most dominant frequencies in the SPOD spectra. For the axially forced jet, the spatial mode structures at both frequencies exhibit qualitatively similar characteristics, as visualised in figures 18(c,d). Specifically, the vortical wavepackets on both sides of the jet centreline maintain neither axisymmetric nor antisymmetric arrangements; instead, they demonstrate out-of-phase advection relative to each other. Crucially, the vortex strengths of both LHS and RHS wavepackets exhibit comparable magnitudes, indicating that the axial forcing maintains a balanced energy distribution between the two shear layers despite the phase asymmetry.
$f_{\!f}$
for both the axially forced and transversely forced jets, representing the two most dominant frequencies in the SPOD spectra. For the axially forced jet, the spatial mode structures at both frequencies exhibit qualitatively similar characteristics, as visualised in figures 18(c,d). Specifically, the vortical wavepackets on both sides of the jet centreline maintain neither axisymmetric nor antisymmetric arrangements; instead, they demonstrate out-of-phase advection relative to each other. Crucially, the vortex strengths of both LHS and RHS wavepackets exhibit comparable magnitudes, indicating that the axial forcing maintains a balanced energy distribution between the two shear layers despite the phase asymmetry.
For the transversely forced jet (figures 18
e, f), the spatial SPOD mode reveals both similarities and differences compared to the axially forced case. Both LHS and RHS vortical wavepackets exhibit a staggered arrangement, indicating persistent out-of-phase behaviour analogous to the axially forced configuration. However, a notable disparity emerges in the vortex strengths between the LHS and RHS wavepackets, with this asymmetry persisting across both spatial mode structures extracted at $f_n$
(figure 18
e) and
$f_n$
(figure 18
e) and $f_{\!f}$
(figure 18
f). Physically, this asymmetry implies that the transverse forcing preferentially excites the shear layers on the side of the jet centreline relative to the other, constituting a fundamental departure from the inherent axisymmetry of the natural mode structure. This preferential excitation mechanism provides physical insight into how jets exhibiting identical dynamical states can be characterised by fundamentally different modal structures, resulting in distinct flow field dynamics. The SPOD mode shape corresponding to
$f_{\!f}$
(figure 18
f). Physically, this asymmetry implies that the transverse forcing preferentially excites the shear layers on the side of the jet centreline relative to the other, constituting a fundamental departure from the inherent axisymmetry of the natural mode structure. This preferential excitation mechanism provides physical insight into how jets exhibiting identical dynamical states can be characterised by fundamentally different modal structures, resulting in distinct flow field dynamics. The SPOD mode shape corresponding to $f_{\!f}-f_n$
(not shown here for brevity) reveals that the spatial structure associated with this beating frequency is predominantly localised in the far-field region at
$f_{\!f}-f_n$
(not shown here for brevity) reveals that the spatial structure associated with this beating frequency is predominantly localised in the far-field region at $x/D \gt 2$
, well outside the potential core. This region is characterised by vortex pairing and merging events.
$x/D \gt 2$
, well outside the potential core. This region is characterised by vortex pairing and merging events.
These findings provide insight into the underlying physical mechanisms through which different external forcing symmetries (i.e. axial and transverse) govern the flow dynamics in fundamentally different ways. While both forcing types can produce quasi-periodic states with comparable temporal characteristics, the spatial organisation of coherent structures reflects the specific symmetry properties imposed by each forcing configuration, driving the energy distribution and evolutionary pathways of the resulting flow field.
3.5. Complex network analysis of vortical structures
We apply the network-theoretic approach developed by Nair & Taira (Reference Nair and Taira2015) to investigate the interactions between vortical structures in two periodic states: one characterised by non-axisymmetric vortical structures induced by transverse forcing (figure 10
a), and one featuring axisymmetric structures under axial forcing (figure 15
a), both relative to the jet centreline. The network framework quantifies interactions between vortical fluid elements through their mutual velocity induction characteristics. Grid points within the vorticity field represent individual vortical fluid elements that influence one another through induced velocity fields. The magnitude of the induced velocity from a vortical element $i$
to vortical element
$i$
to vortical element $j$
is computed using the Biot–Savart law (Saffman Reference Saffman1992) as
$j$
is computed using the Biot–Savart law (Saffman Reference Saffman1992) as $u_{i\rightarrow j} = \lvert \omega (\boldsymbol{x}_i)\,\Delta x\,\Delta y\rvert /(2\pi\, \lvert \boldsymbol{x}_i-\boldsymbol{x}_{\!j}\rvert )$
, where
$u_{i\rightarrow j} = \lvert \omega (\boldsymbol{x}_i)\,\Delta x\,\Delta y\rvert /(2\pi\, \lvert \boldsymbol{x}_i-\boldsymbol{x}_{\!j}\rvert )$
, where $\omega (\boldsymbol{x}_i)$
represents the vorticity magnitude of the fluid element at
$\omega (\boldsymbol{x}_i)$
represents the vorticity magnitude of the fluid element at $\boldsymbol{x}_i$
, and
$\boldsymbol{x}_i$
, and $\Delta x$
and
$\Delta x$
and $\Delta y$
denote the grid sizes in the
$\Delta y$
denote the grid sizes in the $x$
- and
$x$
- and $y$
-directions, respectively. This formulation indicates that elements with higher vorticity magnitudes have a greater influence on distant vortical elements, while those with lower magnitudes influence only their immediate neighbours. Within the network representation, each vortical element constitutes a node, with the interaction strength between nodes
$y$
-directions, respectively. This formulation indicates that elements with higher vorticity magnitudes have a greater influence on distant vortical elements, while those with lower magnitudes influence only their immediate neighbours. Within the network representation, each vortical element constitutes a node, with the interaction strength between nodes $i$
and
$i$
and $j$
defined as the average of their respective induced velocities,
$j$
defined as the average of their respective induced velocities, $(u_{i\rightarrow j} + u_{j\rightarrow i})/2$
(Barrat et al. Reference Barrat, Barthélemy, Pastor-Satorras and Vespignani2004a
,Reference Barrat, Barthélemy, Pastor-Satorras and Vespignani
b
; Newman Reference Newman2004). The strength of the node interactions among all nodes is typically represented by an adjacency matrix
$(u_{i\rightarrow j} + u_{j\rightarrow i})/2$
(Barrat et al. Reference Barrat, Barthélemy, Pastor-Satorras and Vespignani2004a
,Reference Barrat, Barthélemy, Pastor-Satorras and Vespignani
b
; Newman Reference Newman2004). The strength of the node interactions among all nodes is typically represented by an adjacency matrix $A_\textit{ij}$
(Newman Reference Newman2010; Nair & Taira Reference Nair and Taira2015; Taira, Nair & Brunton Reference Taira, Nair and Brunton2016). The total interaction strength at node
$A_\textit{ij}$
(Newman Reference Newman2010; Nair & Taira Reference Nair and Taira2015; Taira, Nair & Brunton Reference Taira, Nair and Brunton2016). The total interaction strength at node $i$
is given by
$i$
is given by $s_i = \sum _{\!j}A_\textit{ij}$
, representing the node strength distribution. Nodes corresponding to coherent vortical structures typically exhibit elevated strength values and function as network hubs (detailed in Appendix B). Consequently, the present analysis focuses on extracting the network structures associated exclusively with these vortical hubs.
$s_i = \sum _{\!j}A_\textit{ij}$
, representing the node strength distribution. Nodes corresponding to coherent vortical structures typically exhibit elevated strength values and function as network hubs (detailed in Appendix B). Consequently, the present analysis focuses on extracting the network structures associated exclusively with these vortical hubs.
Temporal evolution of the weighted network hub strength distribution for (a) transverse and (b) axial forcing, presented as spatial maps with superimposed network edges. The network edges are represented by lines whose thickness and colour intensity encode the strength of dynamical interactions between coherent vortical structures.

Figures 19(a) and 19(b) show the spatial distributions of node strength $s$
in the
$s$
in the $x{-}y$
plane as spatial maps at six different time instants in the forcing cycle under lock-in for, respectively, transverse and axial forcing. These maps also feature black circular markers representing network hubs. The network hub is numerically labelled for ease of interpretation. The colour-coded lines between the network hubs represent the weighted network edges, whose thickness and colour intensity reflect their interaction strength. The staggered topological arrangement of the network hubs under transverse forcing generates substantial cross-interactions between structures formed during different forcing cycles. For instance, at
$x{-}y$
plane as spatial maps at six different time instants in the forcing cycle under lock-in for, respectively, transverse and axial forcing. These maps also feature black circular markers representing network hubs. The network hub is numerically labelled for ease of interpretation. The colour-coded lines between the network hubs represent the weighted network edges, whose thickness and colour intensity reflect their interaction strength. The staggered topological arrangement of the network hubs under transverse forcing generates substantial cross-interactions between structures formed during different forcing cycles. For instance, at $t/T=0$
in figure 19(a), network hubs 3 and 4 from the previous cycle exert significant influence on the newly formed hub 1, as indicated by the thick, dark-coloured edges connecting these elements. As the cycle progresses and hub 2 emerges, the interaction pattern reveals that while hub 2 experiences strong influence from hubs 1 and 4, its cross-interaction with hub 3 remains relatively weak. This asymmetric interaction pattern demonstrates non-uniform coupling among vortical structures, with interaction strengths varying substantially depending on spatial arrangement. Multiple cross-interactions of comparable strength characterise the transversely forced network, including cyclic interactions such as
$t/T=0$
in figure 19(a), network hubs 3 and 4 from the previous cycle exert significant influence on the newly formed hub 1, as indicated by the thick, dark-coloured edges connecting these elements. As the cycle progresses and hub 2 emerges, the interaction pattern reveals that while hub 2 experiences strong influence from hubs 1 and 4, its cross-interaction with hub 3 remains relatively weak. This asymmetric interaction pattern demonstrates non-uniform coupling among vortical structures, with interaction strengths varying substantially depending on spatial arrangement. Multiple cross-interactions of comparable strength characterise the transversely forced network, including cyclic interactions such as $6\leftrightarrow 5\leftrightarrow 3\leftrightarrow 6$
and
$6\leftrightarrow 5\leftrightarrow 3\leftrightarrow 6$
and $3\leftrightarrow 4\leftrightarrow 6\leftrightarrow 3$
. These asymmetric topological arrangements progressively weaken the global mode through distributed energy transfer across multiple vortical interactions spanning different forcing cycles, resulting in alterations in the axisymmetry of the global mode.
$3\leftrightarrow 4\leftrightarrow 6\leftrightarrow 3$
. These asymmetric topological arrangements progressively weaken the global mode through distributed energy transfer across multiple vortical interactions spanning different forcing cycles, resulting in alterations in the axisymmetry of the global mode.
Figure 19(b) shows the symmetric topological arrangement of the vortical network hubs under axial forcing at its critical amplitude. The network hubs on opposing sides of the jet centreline interact in an axisymmetric manner, preserving the natural symmetry characteristics of the unforced jet. The interaction strength between network hubs exhibits systematic temporal variation, beginning at minimum values at $t/T = 0$
, reaching peak intensity at approximately
$t/T = 0$
, reaching peak intensity at approximately $t/T = 5/6$
near
$t/T = 5/6$
near $x/D \approx 1$
, and subsequently diminishing as the hub strength dissipates towards the end of the second cycle. Crucially, cross-interactions between the network hubs formed during different forcing cycles remain relatively weak under axial forcing. For instance, hub pairs
$x/D \approx 1$
, and subsequently diminishing as the hub strength dissipates towards the end of the second cycle. Crucially, cross-interactions between the network hubs formed during different forcing cycles remain relatively weak under axial forcing. For instance, hub pairs $1\leftrightarrow4$
and
$1\leftrightarrow4$
and $2\leftrightarrow3$
exhibit weak but comparable interaction strengths, while connections
$2\leftrightarrow3$
exhibit weak but comparable interaction strengths, while connections $1\leftrightarrow2$
and
$1\leftrightarrow2$
and $3\leftrightarrow4$
demonstrate significantly stronger coupling. This interaction pattern reflects the preservation of axisymmetric network topology under axial forcing, maintaining the structural characteristics of the natural jet while enabling temporal modulation.
$3\leftrightarrow4$
demonstrate significantly stronger coupling. This interaction pattern reflects the preservation of axisymmetric network topology under axial forcing, maintaining the structural characteristics of the natural jet while enabling temporal modulation.
4. Concluding remarks
In this experimental study, we have used time-resolved stereoscopic PIV to examine the spatiotemporal dynamics of a globally unstable axisymmetric jet subjected to axial and transverse forcing at frequencies different from its natural frequency. Through systematic investigation across five forcing amplitudes leading to lock-in and beyond, we characterised the dynamical evolution of large-scale coherent structures in the near field.
4.1. Spatiotemporal evolution of vortical structures under different forcing symmetries
We have experimentally shown that the symmetry of the applied forcing – whether axial or transverse – dictates the way that coherent vortical structures emerge, interact and reorganise as the jet undergoes nonlinear transitions between distinct dynamical states: from natural limit-cycle periodicity through quasi-periodicity to forced synchronisation at lock-in conditions. We demonstrated that an unforced self-excited jet exhibits axisymmetric oscillations at a well-defined natural frequency $f_n$
with synchronous, in-phase roll-up of the shear layers, producing coherent vortex rings in the near field, characteristic of the
$f_n$
with synchronous, in-phase roll-up of the shear layers, producing coherent vortex rings in the near field, characteristic of the $m=0$
mode. Transverse forcing above a critical amplitude disrupts this phase synchrony, inducing out-of-phase shear-layer roll-up that results in a non-axisymmetric distribution of vorticity. This creates a staggered arrangement of vortical structures in the near field, breaking the
$m=0$
mode. Transverse forcing above a critical amplitude disrupts this phase synchrony, inducing out-of-phase shear-layer roll-up that results in a non-axisymmetric distribution of vorticity. This creates a staggered arrangement of vortical structures in the near field, breaking the $m = 0$
axisymmetry. By contrast, axial forcing above the critical lock-in amplitude induces in-phase roll-up of the shear layers on both sides of the jet centreline, sustaining the axisymmetric evolution of vortical structures, and preserving the original
$m = 0$
axisymmetry. By contrast, axial forcing above the critical lock-in amplitude induces in-phase roll-up of the shear layers on both sides of the jet centreline, sustaining the axisymmetric evolution of vortical structures, and preserving the original $m=0$
axisymmetry of the global mode.
$m=0$
axisymmetry of the global mode.
When forced below the critical lock-in amplitude, the globally unstable jet exhibits quasi-periodicity, irrespective of whether the forcing is axial or transverse. During quasi-periodicity, the jet responds not only at $f_{\!f}$
and
$f_{\!f}$
and $f_n$
, but also at several other frequencies that are linear combinations
$f_n$
, but also at several other frequencies that are linear combinations $f_{\!f}\pm f_n$
, reflecting nonlinear interactions between the forced and natural modes. In the quasi-periodic regime, the shear layers at the nozzle exit on both sides of the jet centreline roll up simultaneously, and the corresponding vortical structures advect downstream in phase with each other for approximately one forcing cycle, indicating phase coherence during the early stages of vortical development. However, during downstream advection (typically around
$f_{\!f}\pm f_n$
, reflecting nonlinear interactions between the forced and natural modes. In the quasi-periodic regime, the shear layers at the nozzle exit on both sides of the jet centreline roll up simultaneously, and the corresponding vortical structures advect downstream in phase with each other for approximately one forcing cycle, indicating phase coherence during the early stages of vortical development. However, during downstream advection (typically around $t/T\gt 1$
), both the LHS and RHS vortical structures develop differential advection velocities, leading to progressive phase separation. A particularly noteworthy finding is that the maximum circulation strength of both the LHS and RHS vortices remains invariant with increasing forcing amplitude, maintaining a constant value
$t/T\gt 1$
), both the LHS and RHS vortical structures develop differential advection velocities, leading to progressive phase separation. A particularly noteworthy finding is that the maximum circulation strength of both the LHS and RHS vortices remains invariant with increasing forcing amplitude, maintaining a constant value $\varGamma _{vr}^* = 1$
irrespective of the forcing symmetry – whether axial or transverse. This consistency in peak circulation strength persists even when a significant reduction in the jet oscillation amplitude occurs, indicating that the circulation magnitude is an intrinsic property of the vortex formation process that remains decoupled from the global amplitude response. This observation suggests that the forcing-induced amplitude modulation operates through mechanisms that affect vortex organisation and energy redistribution rather than fundamental alterations to the individual vortex strength characteristics.
$\varGamma _{vr}^* = 1$
irrespective of the forcing symmetry – whether axial or transverse. This consistency in peak circulation strength persists even when a significant reduction in the jet oscillation amplitude occurs, indicating that the circulation magnitude is an intrinsic property of the vortex formation process that remains decoupled from the global amplitude response. This observation suggests that the forcing-induced amplitude modulation operates through mechanisms that affect vortex organisation and energy redistribution rather than fundamental alterations to the individual vortex strength characteristics.
4.2. Physical mechanisms of amplitude response under axial versus transverse forcing
We have experimentally shown that axial forcing at frequencies below the natural frequency ( $f_{\!f}/f_n\lt 1$
) and above the critical amplitude threshold for lock-in produces amplified oscillations at
$f_{\!f}/f_n\lt 1$
) and above the critical amplitude threshold for lock-in produces amplified oscillations at $f_{\!f}$
, with no discernible subharmonic content at
$f_{\!f}$
, with no discernible subharmonic content at $f_{\!f}/2$
in the PSD. Conversely, axial forcing at frequencies above the natural frequency (
$f_{\!f}/2$
in the PSD. Conversely, axial forcing at frequencies above the natural frequency ( $f_{\!f}/f_n\gt 1$
) results in oscillation attenuation, accompanied by the emergence of a dominant spectral peak at
$f_{\!f}/f_n\gt 1$
) results in oscillation attenuation, accompanied by the emergence of a dominant spectral peak at $f_{\!f}/2$
. We established that the origin of this frequency-dependent asymmetric response lies in the streamwise separation between successive vortical structures. For
$f_{\!f}/2$
. We established that the origin of this frequency-dependent asymmetric response lies in the streamwise separation between successive vortical structures. For $f_{\!f}/f_n\lt 1$
, the streamwise distance between consecutive vortices increases substantially, inhibiting vortex merging during downstream advection. This enhanced inter-vortex spacing ensures that the actuation energy remains concentrated within the dominant global mode rather than being redistributed to subharmonic modes, inducing amplification. Conversely, when
$f_{\!f}/f_n\lt 1$
, the streamwise distance between consecutive vortices increases substantially, inhibiting vortex merging during downstream advection. This enhanced inter-vortex spacing ensures that the actuation energy remains concentrated within the dominant global mode rather than being redistributed to subharmonic modes, inducing amplification. Conversely, when $f_{\!f}/f_n\gt 1$
, successive vortices exhibit reduced streamwise separation, promoting vortex merging during downstream evolution. This merging process facilitates energy redistribution from the dominant global mode to the subharmonic modes, resulting in attenuation of the fundamental oscillation. We also demonstrated that variations in streamwise vortex spacing exert only a negligible influence on the amplitude response under transverse forcing, indicating a fundamentally different physical mechanism governing the forced response. Transverse forcing disrupts the intrinsic
$f_{\!f}/f_n\gt 1$
, successive vortices exhibit reduced streamwise separation, promoting vortex merging during downstream evolution. This merging process facilitates energy redistribution from the dominant global mode to the subharmonic modes, resulting in attenuation of the fundamental oscillation. We also demonstrated that variations in streamwise vortex spacing exert only a negligible influence on the amplitude response under transverse forcing, indicating a fundamentally different physical mechanism governing the forced response. Transverse forcing disrupts the intrinsic $m=0$
axisymmetry of the global mode by introducing phase delays in the initial shear-layer roll-up process. This symmetry-breaking mechanism facilitates energy redistribution from the
$m=0$
axisymmetry of the global mode by introducing phase delays in the initial shear-layer roll-up process. This symmetry-breaking mechanism facilitates energy redistribution from the $m=0$
mode to a broad set of helical modes irrespective of vortex spacing, so the oscillations are suppressed for both
$m=0$
mode to a broad set of helical modes irrespective of vortex spacing, so the oscillations are suppressed for both $f_{\!f}/f_n\lt 1$
and
$f_{\!f}/f_n\lt 1$
and $f_{\!f}/f_n\gt 1$
.
$f_{\!f}/f_n\gt 1$
.
4.3. Energy redistribution and modal interactions under different forcing strategies
Through SPOD analysis, we showed that during quasi-periodicity, vortical wavepackets on both sides of the jet centreline consistently maintain out-of-phase relationships, regardless of the forcing symmetry. This persistent phase opposition contrasts markedly with the behaviour seen during periodic states, where wavepackets exhibit either consistent in-phase or anti-phase alignment, demonstrating the fundamentally different organisational principles governing quasi-periodic dynamics. Furthermore, we showed that a critical distinction emerges in the modal characteristics, depending on the forcing symmetry. When forced transversely, the SPOD mode structures corresponding to both $f_n$
and
$f_n$
and $f_{\!f}$
exhibit pronounced asymmetry in vortical strength between the LHS and RHS wavepackets. Conversely, axially forced jets demonstrate no such asymmetries, maintaining a balanced energy distribution between opposing wavepackets throughout the quasi-periodic regime. This fundamental difference indicates that transverse forcing operates through preferential shear-layer excitation mechanisms that systematically break the
$f_{\!f}$
exhibit pronounced asymmetry in vortical strength between the LHS and RHS wavepackets. Conversely, axially forced jets demonstrate no such asymmetries, maintaining a balanced energy distribution between opposing wavepackets throughout the quasi-periodic regime. This fundamental difference indicates that transverse forcing operates through preferential shear-layer excitation mechanisms that systematically break the $m=0$
axisymmetry of the global mode, while axial forcing preserves symmetric energy distribution through temporal modulation rather than spatial bias. Through network analysis, we showed that axial forcing preserves the natural interaction patterns of the unforced jet, exhibiting weak cross-cycle interactions but strong intra-cycle interactions of the vortical elements. Conversely, transverse forcing generates asymmetric network topologies characterised by strong cross-interactions between vortical structures spanning multiple forcing cycles, creating distributed interaction pathways that systematically redistribute energy from the
$m=0$
axisymmetry of the global mode, while axial forcing preserves symmetric energy distribution through temporal modulation rather than spatial bias. Through network analysis, we showed that axial forcing preserves the natural interaction patterns of the unforced jet, exhibiting weak cross-cycle interactions but strong intra-cycle interactions of the vortical elements. Conversely, transverse forcing generates asymmetric network topologies characterised by strong cross-interactions between vortical structures spanning multiple forcing cycles, creating distributed interaction pathways that systematically redistribute energy from the $m=0$
global mode to the helical modes.
$m=0$
global mode to the helical modes.
Acknowledgements
The authors would like to thank Professor Y. Zhu for assistance with schlieren imaging.
Funding
This work was supported by the Research Grants Council of Hong Kong (project no. 16215521).
Declaration of interests
The authors report no conflict of interest.
Appendix A.
We use the snapshot POD methodology of Sirovich (Reference Sirovich1987) to decompose velocity fluctuation datasets into a set of optimal linear basis functions $\psi _i(x)$
, also known as POD modes, and the corresponding temporal coefficients
$\psi _i(x)$
, also known as POD modes, and the corresponding temporal coefficients $a_i(t)$
, thereby obtaining a minimal-order representation of the fluctuating velocity field
$a_i(t)$
, thereby obtaining a minimal-order representation of the fluctuating velocity field $\tilde {V}^\prime (x,y,t) =\sum _{i=1}^Na_i(t)\,\psi _i(x,y) + V_{\textit{res}}(x,y,t)$
that minimises the norm of the residual
$\tilde {V}^\prime (x,y,t) =\sum _{i=1}^Na_i(t)\,\psi _i(x,y) + V_{\textit{res}}(x,y,t)$
that minimises the norm of the residual $V_{\textit{res}}(x,y,t)$
(Meyer, Pedersen & Özcan Reference Meyer, Pedersen and Özcan2007). Within this POD framework, the sequence of basis functions is determined by solving the eigenvalue problem of the autocovariance matrix,
$V_{\textit{res}}(x,y,t)$
(Meyer, Pedersen & Özcan Reference Meyer, Pedersen and Özcan2007). Within this POD framework, the sequence of basis functions is determined by solving the eigenvalue problem of the autocovariance matrix, $\tilde {C}A^i = \lambda ^iA^i$
, where
$\tilde {C}A^i = \lambda ^iA^i$
, where $\tilde {C} = U^{\rm T}U$
. The matrix
$\tilde {C} = U^{\rm T}U$
. The matrix $U$
contains all the fluctuating velocity components from the
$U$
contains all the fluctuating velocity components from the $N$
snapshots arranged as follows:
$N$
snapshots arranged as follows:
 \begin{align} U = [\tilde {V}^1,\ldots ,\tilde {V}^N]= \begin{bmatrix} \tilde {V}^{\prime 1}_1 & \tilde {V}^{\prime 2}_1 &. . . &\tilde {V}^{\prime N}_1\\ \vdots & \vdots & \vdots & \vdots & \\ \tilde {V}^{\prime 1}_M & \tilde {V}^{\prime 2}_M& . . .& \tilde {V}^{\prime N}_M \end{bmatrix}\!, \end{align}
where $A_n^i$
represents the
$A_n^i$
represents the $n$
th component of the eigenvector corresponding to eigenvalue
$n$
th component of the eigenvector corresponding to eigenvalue $\lambda ^i$
. The eigenvalues are arranged in descending order of magnitude such that
$\lambda ^i$
. The eigenvalues are arranged in descending order of magnitude such that $\lambda ^1\gt \lambda ^2 \gt \cdots \gt \lambda ^N$
, ensuring that the most energetic modes appear first, reflecting the principal flow structures within the leading POD modes. The spatial basis functions
$\lambda ^1\gt \lambda ^2 \gt \cdots \gt \lambda ^N$
, ensuring that the most energetic modes appear first, reflecting the principal flow structures within the leading POD modes. The spatial basis functions $\psi _i(x,y)$
are obtained through projection of the velocity field realisations onto the eigenvectors:
$\psi _i(x,y)$
are obtained through projection of the velocity field realisations onto the eigenvectors: $\psi _i(x)=\sum _{n=1}^NA_n^iV^n/\left(\left\|\sum _{n=1}^NA_n^iV^n\right\|\right)$
. The temporal coefficients are subsequently computed by projecting the velocity field onto the spatial basis functions:
$\psi _i(x)=\sum _{n=1}^NA_n^iV^n/\left(\left\|\sum _{n=1}^NA_n^iV^n\right\|\right)$
. The temporal coefficients are subsequently computed by projecting the velocity field onto the spatial basis functions: $a^n = \psi ^{\rm T}V^n$
. The resulting spatial basis functions occur in orthogonal pairs ordered by decreasing energy content (Duwig & Iudiciani Reference Duwig and Iudiciani2010). For details of the POD analysis, readers are referred to Sirovich (Reference Sirovich1987). The snapshot POD methodology extracts the most energetic coherent structures through the first two spatial POD modes, which collectively represent the coherent velocity fluctuations of the global mode when expressed as linear combinations (Oberleithner et al. Reference Oberleithner, Sieber, Nayeri, Paschereit, Petz, Hege, Noack and Wygnanski2011). Phase angle information (
$a^n = \psi ^{\rm T}V^n$
. The resulting spatial basis functions occur in orthogonal pairs ordered by decreasing energy content (Duwig & Iudiciani Reference Duwig and Iudiciani2010). For details of the POD analysis, readers are referred to Sirovich (Reference Sirovich1987). The snapshot POD methodology extracts the most energetic coherent structures through the first two spatial POD modes, which collectively represent the coherent velocity fluctuations of the global mode when expressed as linear combinations (Oberleithner et al. Reference Oberleithner, Sieber, Nayeri, Paschereit, Petz, Hege, Noack and Wygnanski2011). Phase angle information ( $\phi _i$
) for each instantaneous velocity field is extracted via the temporal coefficients of the first two modes,
$\phi _i$
) for each instantaneous velocity field is extracted via the temporal coefficients of the first two modes, $a_1^i = r_i\sin (\phi _i)$
and
$a_1^i = r_i\sin (\phi _i)$
and $a_2^i(t) = r_i\cos (\phi _i)$
, where
$a_2^i(t) = r_i\cos (\phi _i)$
, where $r_i = \sqrt {(a_1^i)^2+(a_2^i)^2}$
and
$r_i = \sqrt {(a_1^i)^2+(a_2^i)^2}$
and $\phi _i = \tan ^{-1}(a_1^i/a_2^i)$
.
$\phi _i = \tan ^{-1}(a_1^i/a_2^i)$
.
Appendix B.
Figures 20(a–c) show the phase-averaged vorticity field, the node strength distribution, and the network-hub strength distribution. Comparative analysis reveals that coherent structures with higher vorticity magnitudes exhibit correspondingly greater node strengths, forming strongly interconnected node groups that constitute network communities functioning as network hubs. These hubs capture edge interactions among vortical structures within the flow field, as evidenced in figures 20(a) and 20(b). Given that vortical structures induce velocity fields on neighbouring fluid elements (Tennekes & Lumley Reference Tennekes and Lumley1972; Pope Reference Pope2000; Holmes et al. Reference Holmes, Lumley, Berkooz and Rowley2012), this network analysis considers only those fluid elements integral to vortical structures, as illustrated in figure 20(c). To characterise the inter-vortical interactions, we extract reduced vortical network structures by retaining only the network hubs from the original network configuration. Each hub position corresponds to vortex core coordinates, with the hub strength quantified via the total circulation of each vortical structure at its centroid. Subsequently, we construct the adjacency matrix for the reduced vortical network, incorporating vortex core positions and circulation strengths as the fundamental parameters. The resulting adjacency matrix, comprising the network edges of the reduced vortical network, effectively characterises the inter-vortical interactions through spatial reduction of the network nodes to their respective vortical centroids, enabling systematic quantification of vortical structure interactions while maintaining computational efficiency.
(a) Normalised iso-vorticity $\omega ^* = \omega D/U_e$
in the
$\omega ^* = \omega D/U_e$
in the $x{-}y$
plane. (b) Spatial distribution of the node strength of the corresponding vorticity field. The vortical fluid elements possess maximum node strength and are identified as network hubs in the vortical network. (c) Spatial distribution of the strength of the network hubs, which is computed by identifying the vortical structures in the vorticity field.
$x{-}y$
plane. (b) Spatial distribution of the node strength of the corresponding vorticity field. The vortical fluid elements possess maximum node strength and are identified as network hubs in the vortical network. (c) Spatial distribution of the strength of the network hubs, which is computed by identifying the vortical structures in the vorticity field.

Appendix C.
We implement SPOD following the methodology of Towne et al. (Reference Towne, Schmidt and Colonius2018) to extract the most energetically significant coherent structures evolving in both space and time. The analysis is performed on vorticity fluctuations computed from $N_t =4000$
velocity field snapshots obtained through time-resolved PIV measurements. Each vorticity snapshot at time
$N_t =4000$
velocity field snapshots obtained through time-resolved PIV measurements. Each vorticity snapshot at time $t_k$
is organised into a column vector
$t_k$
is organised into a column vector $q_k$
of length
$q_k$
of length $N_x$
, where
$N_x$
, where $N_x$
denotes the number of degrees of freedom, i.e. the number of grid points. The ensemble of
$N_x$
denotes the number of degrees of freedom, i.e. the number of grid points. The ensemble of $N_t$
vorticity snapshots is subsequently partitioned into
$N_t$
vorticity snapshots is subsequently partitioned into $N_{\textit{blk}}$
overlapping temporal blocks with
$N_{\textit{blk}}$
overlapping temporal blocks with $N_{\textit{o}v\textit{lp}}$
overlapping snapshots, wherein each block contains
$N_{\textit{o}v\textit{lp}}$
overlapping snapshots, wherein each block contains $N_{\textit{freq}}$
snapshots represented as
$N_{\textit{freq}}$
snapshots represented as $Q = [q_{1},q_{2},\ldots ,q_{N_{\textit{freq}}}]$
. A discrete Fourier transform is applied to each temporal block, yielding an ensemble of Fourier realisations
$Q = [q_{1},q_{2},\ldots ,q_{N_{\textit{freq}}}]$
. A discrete Fourier transform is applied to each temporal block, yielding an ensemble of Fourier realisations $\hat {Q}^{l}_{f_k} = [\hat {q}^{l}_{f_1},\hat {q}^{l}_{f_2},\ldots ,\hat {q}^{l}_{f_{N_{\textit{freq}}}}]$
, where
$\hat {Q}^{l}_{f_k} = [\hat {q}^{l}_{f_1},\hat {q}^{l}_{f_2},\ldots ,\hat {q}^{l}_{f_{N_{\textit{freq}}}}]$
, where $\hat {q}^{l}_{f_k}$
is the
$\hat {q}^{l}_{f_k}$
is the $l$
th realisation of the Fourier transform at the
$l$
th realisation of the Fourier transform at the $k$
th discrete frequency. Next, we collect ensembles of Fourier realisation at the
$k$
th discrete frequency. Next, we collect ensembles of Fourier realisation at the $k$
th frequency
$k$
th frequency $f_k$
for all
$f_k$
for all $N_{\textit{blk}}$
blocks into a data matrix
$N_{\textit{blk}}$
blocks into a data matrix $\hat {Q}_{f_k} = [\hat {q}^{1}_{k},\hat {q}^{2}_{k},\ldots ,\hat {q}^{N_{\textit{blk}}}_{k}]$
. Thereafter, we obtain the SPOD eigenvalues and eigenvectors corresponding to
$\hat {Q}_{f_k} = [\hat {q}^{1}_{k},\hat {q}^{2}_{k},\ldots ,\hat {q}^{N_{\textit{blk}}}_{k}]$
. Thereafter, we obtain the SPOD eigenvalues and eigenvectors corresponding to $f_k$
by performing eigenvalue decomposition of the weighted cross-spectral-density matrix at
$f_k$
by performing eigenvalue decomposition of the weighted cross-spectral-density matrix at $f_k$
:
$f_k$
: $\hat {Q}^H_{f_k}W\hat {Q_{f_k}}\varPsi _{f_k} = \varPsi _{f_k} \varLambda _{f_k}$
. Here,
$\hat {Q}^H_{f_k}W\hat {Q_{f_k}}\varPsi _{f_k} = \varPsi _{f_k} \varLambda _{f_k}$
. Here, $\varLambda _{f_k} = \mathrm{diag}(\lambda ^{1}_{f_k},\lambda ^{2}_{f_k},\ldots ,\lambda ^{N_{\textit{blk}}}_{f_k})$
is a diagonal matrix containing eigenvalues ranked in decreasing order of energy content from
$\varLambda _{f_k} = \mathrm{diag}(\lambda ^{1}_{f_k},\lambda ^{2}_{f_k},\ldots ,\lambda ^{N_{\textit{blk}}}_{f_k})$
is a diagonal matrix containing eigenvalues ranked in decreasing order of energy content from $i = 1$
to
$i = 1$
to $i=N_{\textit{blk}}$
, i.e.
$i=N_{\textit{blk}}$
, i.e. $\lambda ^{1}_{f_k}\geqslant \lambda ^{2}_{f_k}\geqslant \cdots \geqslant \lambda ^{N_{\textit{blk}}}_{f_k}$
. Finally, the corresponding SPOD modes
$\lambda ^{1}_{f_k}\geqslant \lambda ^{2}_{f_k}\geqslant \cdots \geqslant \lambda ^{N_{\textit{blk}}}_{f_k}$
. Finally, the corresponding SPOD modes $\hat{\varPhi}_{f_k}$
are obtained as
$\hat{\varPhi}_{f_k}$
are obtained as $\hat {\varPhi}_{f_k} = \hat {\varPhi}_{f_k} \varPsi _{f_k} \varLambda ^{-1/2}_{f_k}$
. The positive-definite Hermitian matrix
$\hat {\varPhi}_{f_k} = \hat {\varPhi}_{f_k} \varPsi _{f_k} \varLambda ^{-1/2}_{f_k}$
. The positive-definite Hermitian matrix $W$
accounts for both the weight and numerical quadrature associated with the discretised inner product,
$W$
accounts for both the weight and numerical quadrature associated with the discretised inner product, $\langle \hat {q}_1 ,\hat {q}_2\rangle _E= \hat {q}^H_{1}W\hat {q}_2$
. Further details on the theoretical foundations of SPOD can be found in Towne et al. (Reference Towne, Schmidt and Colonius2018).
$\langle \hat {q}_1 ,\hat {q}_2\rangle _E= \hat {q}^H_{1}W\hat {q}_2$
. Further details on the theoretical foundations of SPOD can be found in Towne et al. (Reference Towne, Schmidt and Colonius2018).


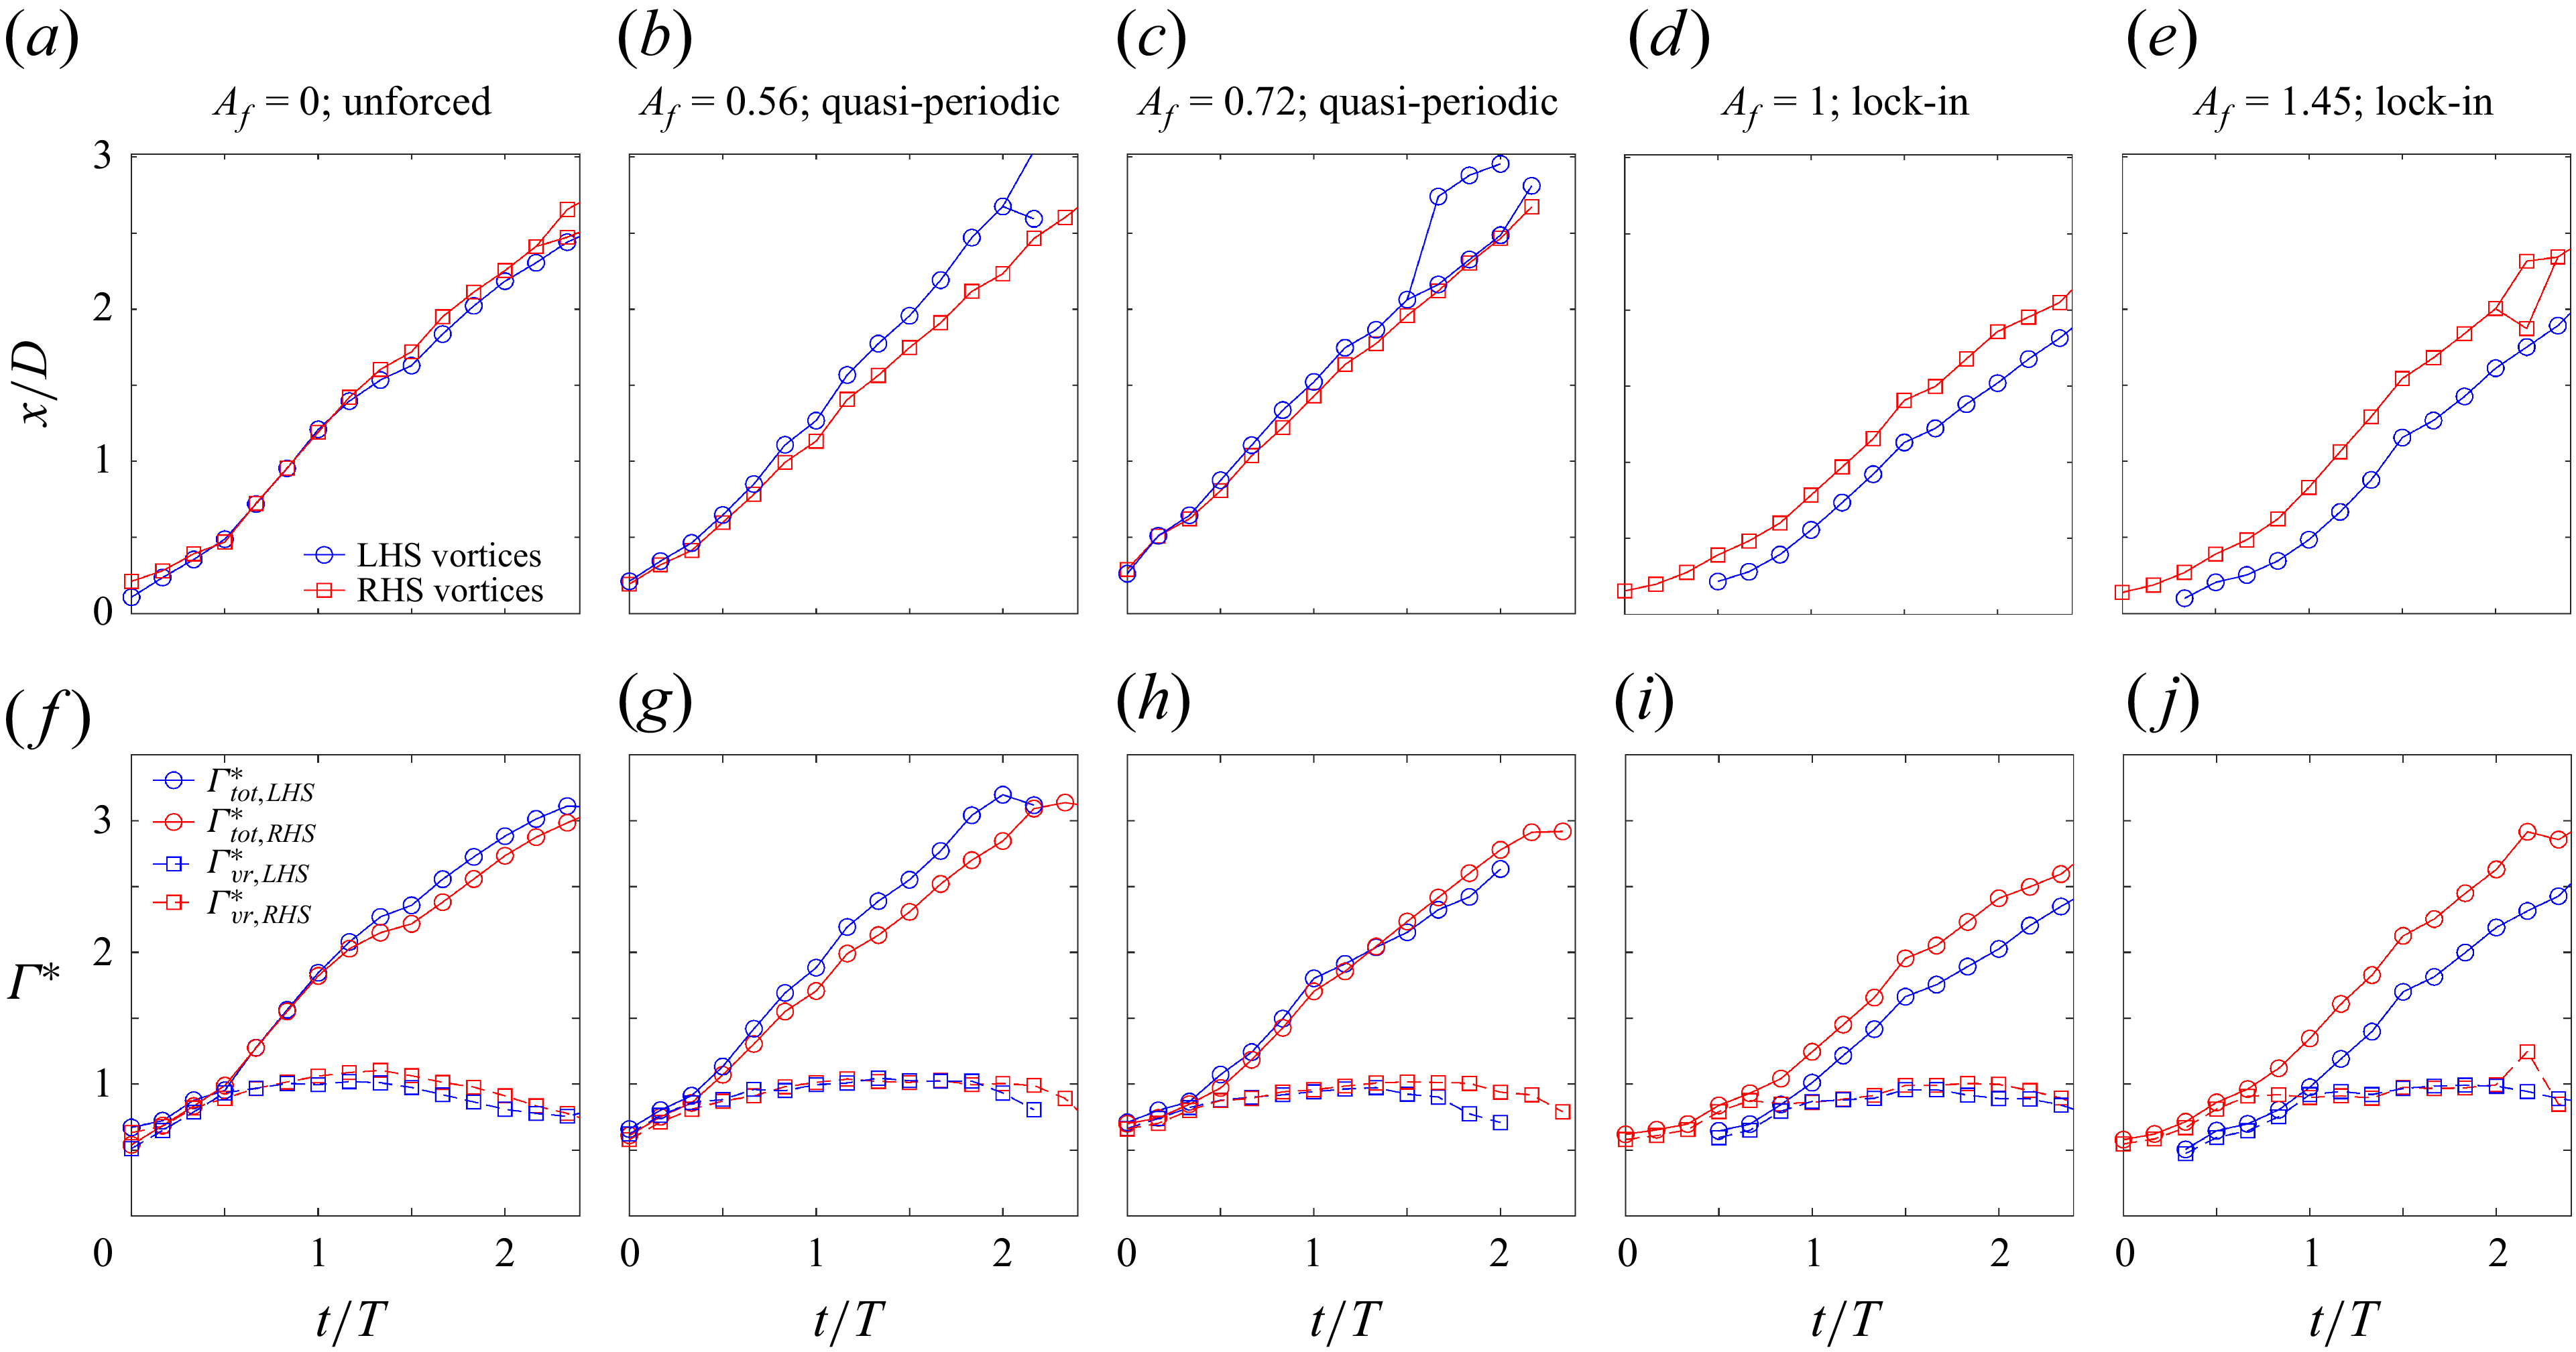


 Open access