

1. Introduction
Dialects can emerge from contact between different linguistic varieties, and when immigrants move to a new community, contact between immigrant languages and the native local dialects gives rise to specific ethnically affiliated linguistic features. Over time, these features can become enregistered (Agha, Reference Agha2003, Reference Agha2007) as certain local or ethnic dialects. For example, Remlinger et al. (Reference Remlinger, Salmons and von Schneidemesser2009) and Remlinger (Reference Remlinger2017) show how linguistic features once considered to be ethnic and immigrant features have become enregistered as regional features of American English spoken in Wisconsin and Michigan’s Upper Peninsula (UP). Focusing only on the Finnish community in Marquette County in Michigan’s UP, Rankinen (Reference Rankinen2014) showed how the vowel space of this speech community is distinct from Michigan’s Lower Peninsula vowel spaces. Rankinen’s sociophonetic analysis showed that Canadian English and substrate influence from Finnish were “arguably the two most evident influences” (Rankinen, Reference Rankinen2014:333) on the vowel spaces of the Finnish American speech community in Michigan’s UP. Whether certain ethnic linguistic features become an enregistered dialect or remain ethnic features, the dynamic relationship among linguistic forms, the contextual use of such forms (pragmatics), and the dominant ideologies of a certain society and time—the core elements of Silverstein’s (Reference Silverstein, Mertz and Parmentier1985) “total linguistic fact”—determine whether speakers of such dialects or ethnolects decide to use the ethnic markers in their language. Such a dynamic relationship among the core elements of Silverstein’s total linguistic fact makes the relation between the speakers’ and listeners’ underlying beliefs and cognitive processes, what the speakers say, and the listeners’ reaction to the speech acts interesting and worthy of researchers’ attention (Preston, Reference Preston and Preston1999; Purnell, Reference Purnell, Preston and Niedzielski2010). In this article, I present a preliminary analysis of the speech of residents of Dearborn, MI, and argue that the dynamic relationship between the settlement patterns in Dearborn and the broader social ideology in the USA has helped the development of an ethnolinguistic repertoire for Dearborners, which they could use in certain situations mostly depending on the listener.
Traditionally, dominant European American ethnic groups have been at the center of language variation and dialectology research in America, mostly because their speech has been deemed to be representative of the regional variety (Fought, Reference Fought, Chambers and Schilling2013:393). As such, the speech of minority ethnic groups has traditionally been compared against the regional variety as a benchmark. This traditional approach has been challenged recently, and more and more studies are looking at language variation and stylistic choices within minority communities (e.g. Holliday, Reference Holliday2019; King, Reference King2021). Such studies look at variation across time, space, and different personae to explore the complex interaction of linguistic behavior with identities and break down pre-defined linguistic and non-linguistic codifications. For example, King (Reference King2021) showed how speakers with different personae within a Black community in Rochester, NY, position themselves in terms of the local and social meanings of the Northern Cities Shift (NCS) features. Using corpus data and looking at variation across time, Holliday (Reference Holliday2019) explored prosodic variation among Black speakers in the DC area over two periods: one in the 1960s and the other in the 2010s. Using the same corpus data, Gunter, Vaughn & Kendall (Reference Gunter, Vaughn and Kendall2021) explored the intersection between race and space by looking at sibilant variation (i.e. /s/ vs. /ʃ/) in /stɹ/ clusters among Black speakers in the DC area, and found that the variation between /s/ and /ʃ/ variants is socially stratified. Investigating the intersection of race and space, Farrington (Reference Farrington2018) analyzed word-final /t/ and /d/ glottalization across three different geographical contexts of Memphis, TN, Durham, NC, and Washington, DC, and found that glottalization in this phonological context (specifically for the coda /t/) is common among Black speakers in all three locations. Wong & Hall-Lew (Reference Wong and Hall-Lew2014) also explored the intersection of ethnic identities and local identities among Asian Americans in two localities of New York City and San Francisco, finding that while Asian Americans from NYC had distinct low back vowels (thought and lot), those from San Francisco had merged low back vowels. The emerging literature on the interaction of ethnic identities and other layers of individuals’ identities emphasizes the agency of individual speakers (specifically ethnic minorities) by highlighting transracialization (Alim, Reference Alim, Alim, Rickford and Ball2016; Rosa & Flores, Reference Rosa and Flores2017) which challenges ethnic or racial codifications.
The present study is a contribution to this emerging literature by comparing the speech of Americans of Middle Eastern or North African descent (MENA Americans for short) across two localities in the Upper Midwest of the USA: Dearborn, MI, and outside of Dearborn. Ethnographic evidence shows that MENA Americans in Dearborn see their community as linguistically visible while other MENA Americans in the Upper Midwest do not feel they are linguistically visible (Sheydaei, Reference Sheydaei2021). In this study, I take a bottom-up approach in identifying some of the phonetic features of Dearborn English while also looking at the vowel patterns of Dearborn speech. This preliminary analysis provides evidence for an ethnolinguistic repertoire available to Dearborn speakers. Drawing on anthropological work in Arab Detroit (Shryock & Lin, Reference Shryock, Chih Lin and Baker2009), I argue that the specific locality of Dearborn (in terms of settlement patterns) at the intersection with ethno-religious identity has provided fertile ground for the development of this ethnolinguistic repertoire (Benor, Reference Benor2010; Burdin, Reference Burdin2020), which can, in the long term, transcend the specific locality of Dearborn and be used as an ethnic marker for MENA Americans across the USA. In the following section, I provide some brief background on Dearborn and previous work on Dearborn English; in Section 3 I describe the methodology of the present study. In Section 4 I provide the results, and finally, in Section 5 I conclude the paper.
2. Background
Ethnic visibility can influence individuals’ linguistic behavior in different ways. For example, Evans et al. (Reference Evans, Ito, Jones, Preston, Lee Simon and Murray2006) compared the speech of two groups of southern immigrant descendants in Michigan in terms of their participation in the Northern Cities Shift: Appalachians in Ypsilanti and African Americans in Lansing. Their findings showed that Appalachians’ vowels were more aligned with the NCS compared to those of African Americans, a pattern they surmised could partly be related to the latter group’s “visual barrier” (Evans et al., Reference Evans, Ito, Jones, Preston, Lee Simon and Murray2006:195). In another study, Hoffman & Walker (Reference Hoffman and Walker2010) looked at the correlation between ethnic orientation and linguistic behavior in Toronto, Canada; while they found no correlation between ethnic orientation and participation in local vowel patterns, they partly attributed higher rates of ethnic orientation by Chinese Canadians compared to Italian Canadians to the former group’s higher ethnic visibility. From a top-down perspective in terms of “statistical race” categories (to borrow the term from Prewitt, Reference Prewitt2013), MENA Americans have been historically and legally classified as “white.” However, from the bottom-up perspective, in terms of the “colloquial” race categories (to borrow the term from Hollinger, Reference Hollinger1995), MENA Americans are not perceived as white (Beydoun, Reference Beydoun2013, Reference Beydoun2015). Sheydaei (Reference Sheydaei2021) explored the ethnic visibility of MENA Americans both from a top-down and a bottom-up perspective. Using an online survey in the top-down framework, Sheydaei (Reference Sheydaei2021) showed that people of MENA descent are mostly confused with people of European white descent; however, sartorial markers and linguistic cues make MENA ancestry more visible. Ethnographic evidence in the bottom-up framework showed, however, that MENA Americans perceived themselves to be quite visible in terms of physical appearance (using features such as hair type, skin tone, dress, body movements, and even demeanor) but linguistically invisible in America (i.e. when they speak English, and these are L1 English or English-dominant speakers) (Sheydaei, Reference Sheydaei2021). However, MENA Americans in the city of Dearborn, MI, recognized their community to be not only physically visible but also linguistically visible (again, English spoken by L1 English or English-dominant speakers). From the community members’ perspective, linguistic features that make Dearborn English distinctive could fall into two categories of lexicon and phonology. Particular lexical items include both borrowings (such as allah ‘God’, words like wallah ‘[I] swear to God’, yallah ‘come on/be quick’, or sallying ‘praying’; this last one is also conjugated according to English syntactic rules for forming the progressive aspect), and English words adopted and used with specific meanings local to Dearborn (such as hawk ‘an Arab male person in Dearborn’ or boater ‘a recent immigrant with a foreign accent’). In terms of phonological features, Dearborn speakers described the variety as sounding “deeper,” “gruffy,” and “throaty” (Sheydaei, Reference Sheydaei2021).
Dearborn city is a suburb adjacent to Detroit in Wayne County, Michigan, and is part of the Detroit metropolitan area. Dearborn was described by some of my participants as the “Middle East of the Western world.” According to the US Census Bureau’s American Community Survey (2022), 88.2% of the population of Dearborn city is white; however, for statistical classification purposes mentioned above, Middle Easterners would most likely check white on census forms since there is not another option specified for them.Footnote 1 Samant (Reference Samant2011) describes the opportunity to work at the Ford Motor Company’s River Rouge automobile plant as a major pull factor that attracted many Arab immigrants to the region, which led to the creation of a community that would provide settlement resources for future Arab immigrants. Bakos (Reference Bakos2012) lists two push factors for the growth of the Arab population in the 1960s and 1970s. The first push factor listed by Bakos is Detroit’s race riots of the 1960s and 1970s, which actually pushed the white population of Dearborn out of the city, almost coinciding with the end of segregationist Mayor Orville Hubbard’s tenure with his campaign to “keep Dearborn clean,” which many understood to mean “keep Dearborn White” (Good, Reference Good1989). The second push factor listed by Bakos is the Lebanese Civil War (from 1975 to 1989), which pushed the Lebanese immigrants out of their home country. These two historical events correspond with Orfalea’s (Reference Orfalea2006) third wave of Arab immigration to the USA, corresponding to the period between 1967 and 2005. According to Orfalea, 60% of the third wave Arab immigrants to the USA were Muslims, compared to the same percentage rate of 60% Muslim immigrants in the second wave period from 1947 to 1966, and 90% Christian immigrants in the first wave period from 1878 to 1924. Religion is an important factor, specifically for ethnic visibility and its implications for linguistic behavior. For example, scholars have specifically addressed the racialization of Islam and “Muslim”-looking subjects—“Muslim”-looking by proxies such as names, attire, or even phenotype (e.g. Rana, Reference Rana2011; Durrani, Reference Durrani and Avineri2018; Thangaraj, Reference Thangaraj2021). More locally specific for the discussion of Dearborn English in the present paper, Shryock & Lin (Reference Shryock, Chih Lin and Baker2009) describe two distinct zones of the Arab Detroit community: zone 1, which is mostly Christian and suburban, and zone 2, which is “highly visible,” Muslim, and “predominantly in or near Dearborn and Detroit” (Shryock & Lin, Reference Shryock, Chih Lin and Baker2009:58). The discrepancy between the two zones in terms of visibility has social and, more importantly for linguists, linguistic implications. For example, Shryock & Lin’s (Reference Shryock, Chih Lin and Baker2009:58) findings show that the MENA Americans of zone 1 in southeastern Michigan “are substantially closer to the American mainstream, whereas the inhabitants of zone 2 are widely perceived as outsiders who must prove they are American.” In terms of linguistic behavior, the different groups of MENA Americans can reflect such social divisions, as suggested by the comments of Dearborners about their English variety summarized above.
Previous sociolinguistic work on Dearborn English has mostly focused on the vowel system. Samant (Reference Samant2010), for example, explored trap raising and fronting in Dearborn youth’s speech. Working in the context of a high school in Dearborn, Samant (Reference Samant2010) looked at whether specific nationality (within the broad Arab ethnic community in Dearborn) and religiosity would co-vary with different degrees of trap raising and fronting (an advanced feature of the NCS, traditionally characteristic of the local speech in southeastern Michigan). Samant specifically made a distinction between the Lebanese and non-Lebanese nationalities informed by patterns of internal hierarchies that she observed in the community. Additionally, Samant measured religiosity in terms of regular versus sporadic religious practice, and found no distinction between the Lebanese and non-Lebanese youths who were in the regular religious practice category in terms of raising and fronting of trap. Nonetheless, in her sporadic religious practice group, Samant (Reference Samant2010) found that the Lebanese youths had the most raised and fronted trap while the non-Lebanese had the least fronted and raised trap vowels. In another study, Bakos (Reference Bakos2012) looked at different features of the NCS in his analysis of the speech of Lebanese Dearborners. The Lebanese participants in Bakos’s study were both the immigrant parent generation and their children who were either born in the USA or moved to the USA at a young age. Bakos’s results showed that the speakers in his study were not participating in the NCS and did not merge their low back vowels. Focusing only on the younger generation (either Michigan-born or those who learned English before the age of 5 in Michigan), Preston (Reference Preston2014) used Bakos’s data in a thorough comparison of different ethnic groups in southeastern Michigan with reference to the NCS. Preston (Reference Preston2014) argued that the diffusion of NCS features to these immigrant groups within this “geographically compact” (2014:949) area was “tempered” (2014:957), resulting in a reformulated vowel system where marked asymmetry was avoided. In this reformulated system, the vowel spaces of different ethnic groups—including the Lebanese Dearborners—featured three point vowels (fleece, lot, and goose) and two pairs of short–long vowels in the mid front area (face–kit and trap–dress) and the mid back area (foot–goat and thought–strut). These results are consistent with what I found in terms of vowel patterns both in the speech of Dearborners and non-Dearborn MENA Americans in the Upper Midwest (Sheydaei, Reference Sheydaei2024), which showed that the speech of MENA Americans in the Upper Midwest is generally characterized by the avoidance of certain features of the NCS such as trap raising and fronting and lot fronting (a more detailed discussion of these vowel patterns will be presented in Section 4.3).
The consonantal and prosodic features of the speech of Dearborners have mainly been under-studied. Analyzing the same sociolinguistic data collected by Bakos (Reference Bakos2012), Hall (Reference Hall2021) explored rates of dental realization of alveolar /t/ and /d/ sounds among Lebanese Dearborners by measuring center of gravity values. Hall’s findings showed that there were higher rates of dental /t/ and /d/ sounds compared to alveolar realizations among second generation Lebanese Dearborners in both the casual and word list reading speech styles. Dental /t/ and /d/ realizations remained higher than alveolar realizations among third generation Lebanese Dearborners in the word list reading context but dropped down to almost 50% of the /t/ and /d/ sounds analyzed by Hall in the casual speech context. The present study contributes to the literature on Dearborn English by analyzing both vowel patterns and consonantal features. The consonantal features discussed in this study were features that caught my attention during the interviews conducted for the present study; that is, they are not pre-selected but have been selected from a bottom-up approach. It is important to note here that I am not arguing that the features analyzed in this article are part of an ethnolect; rather, my main argument is that these features are part of an ethnolinguistic repertoire for residents of Dearborn. In the next section, I will describe the methodology of the present analysis.
3. Methodology
Data collected for analysis in the present paper comes from Labovian Sociolinguistic InterviewsFootnote 2 with 44 MENA Americans in the Upper Midwest: 9 from south-central and southeastern Wisconsin, and 35 from southeastern Michigan. The average age of speakers at the time of the interviews was 21, ranging from 18 to 32. Eighteen of the speakers self-identified as male and 26 speakers self-identified as female. The primary focus of the present study is on 32 of the speakers in southeastern Michigan who either were born or grew up in Dearborn, MI. The average age of these Dearborn speakers was 20 at the time of the interviews, ranging from 18 to 29. Sixteen of these 32 Dearborn speakers self-identified as female and 16 self-identified as male. The interviews were done over the course of the period from November 2017 to May 2023. The Sociolinguistic Interviews were conducted in a quiet area either on a college campus or in a community center that would provide such a space during the fieldwork trips. The average duration of the interviews was 28 minutes, ranging from 12 minutes to 68 minutes. The shortest and longest interviews were both done with Dearborn speakers: the average duration of interviews with Dearborn speakers was 25 minutes.
The interview procedure consisted of three components: (1) casual speech, which started with questions asking general demographic information and then focused on topics of cultural and ethnic identities, (2) a reading passage, and (3) a sentence list. After a few demographic information questions asking, among other things, about the interviewees’ age, places spent in between ages 4 and 12, and acquired and learned languages, the focus of the casual speech section of the interview shifted towards questions about racial and ethnic identities. Interviewees were asked how they would feel about the addition of a MENA (Middle Eastern or North African) box to census and application forms, and the follow-up questions asked whether an interviewee would be able to recognize people of MENA descent based on physical and linguistic markers. All interviews were recorded on a solid-state digital voice recorder. The interviews were transcribed using ELAN (Wittenburg et al., Reference Wittenburg, Brugman, Russel, Klassmann and Sloetjes2006) and force-aligned (with manual correction) using the FAVE-aligner (Rosenfelder et al., Reference Rosenfelder, Fruehwald, Evanini and Yuan2011).
3.1. Consonantal features for analysis
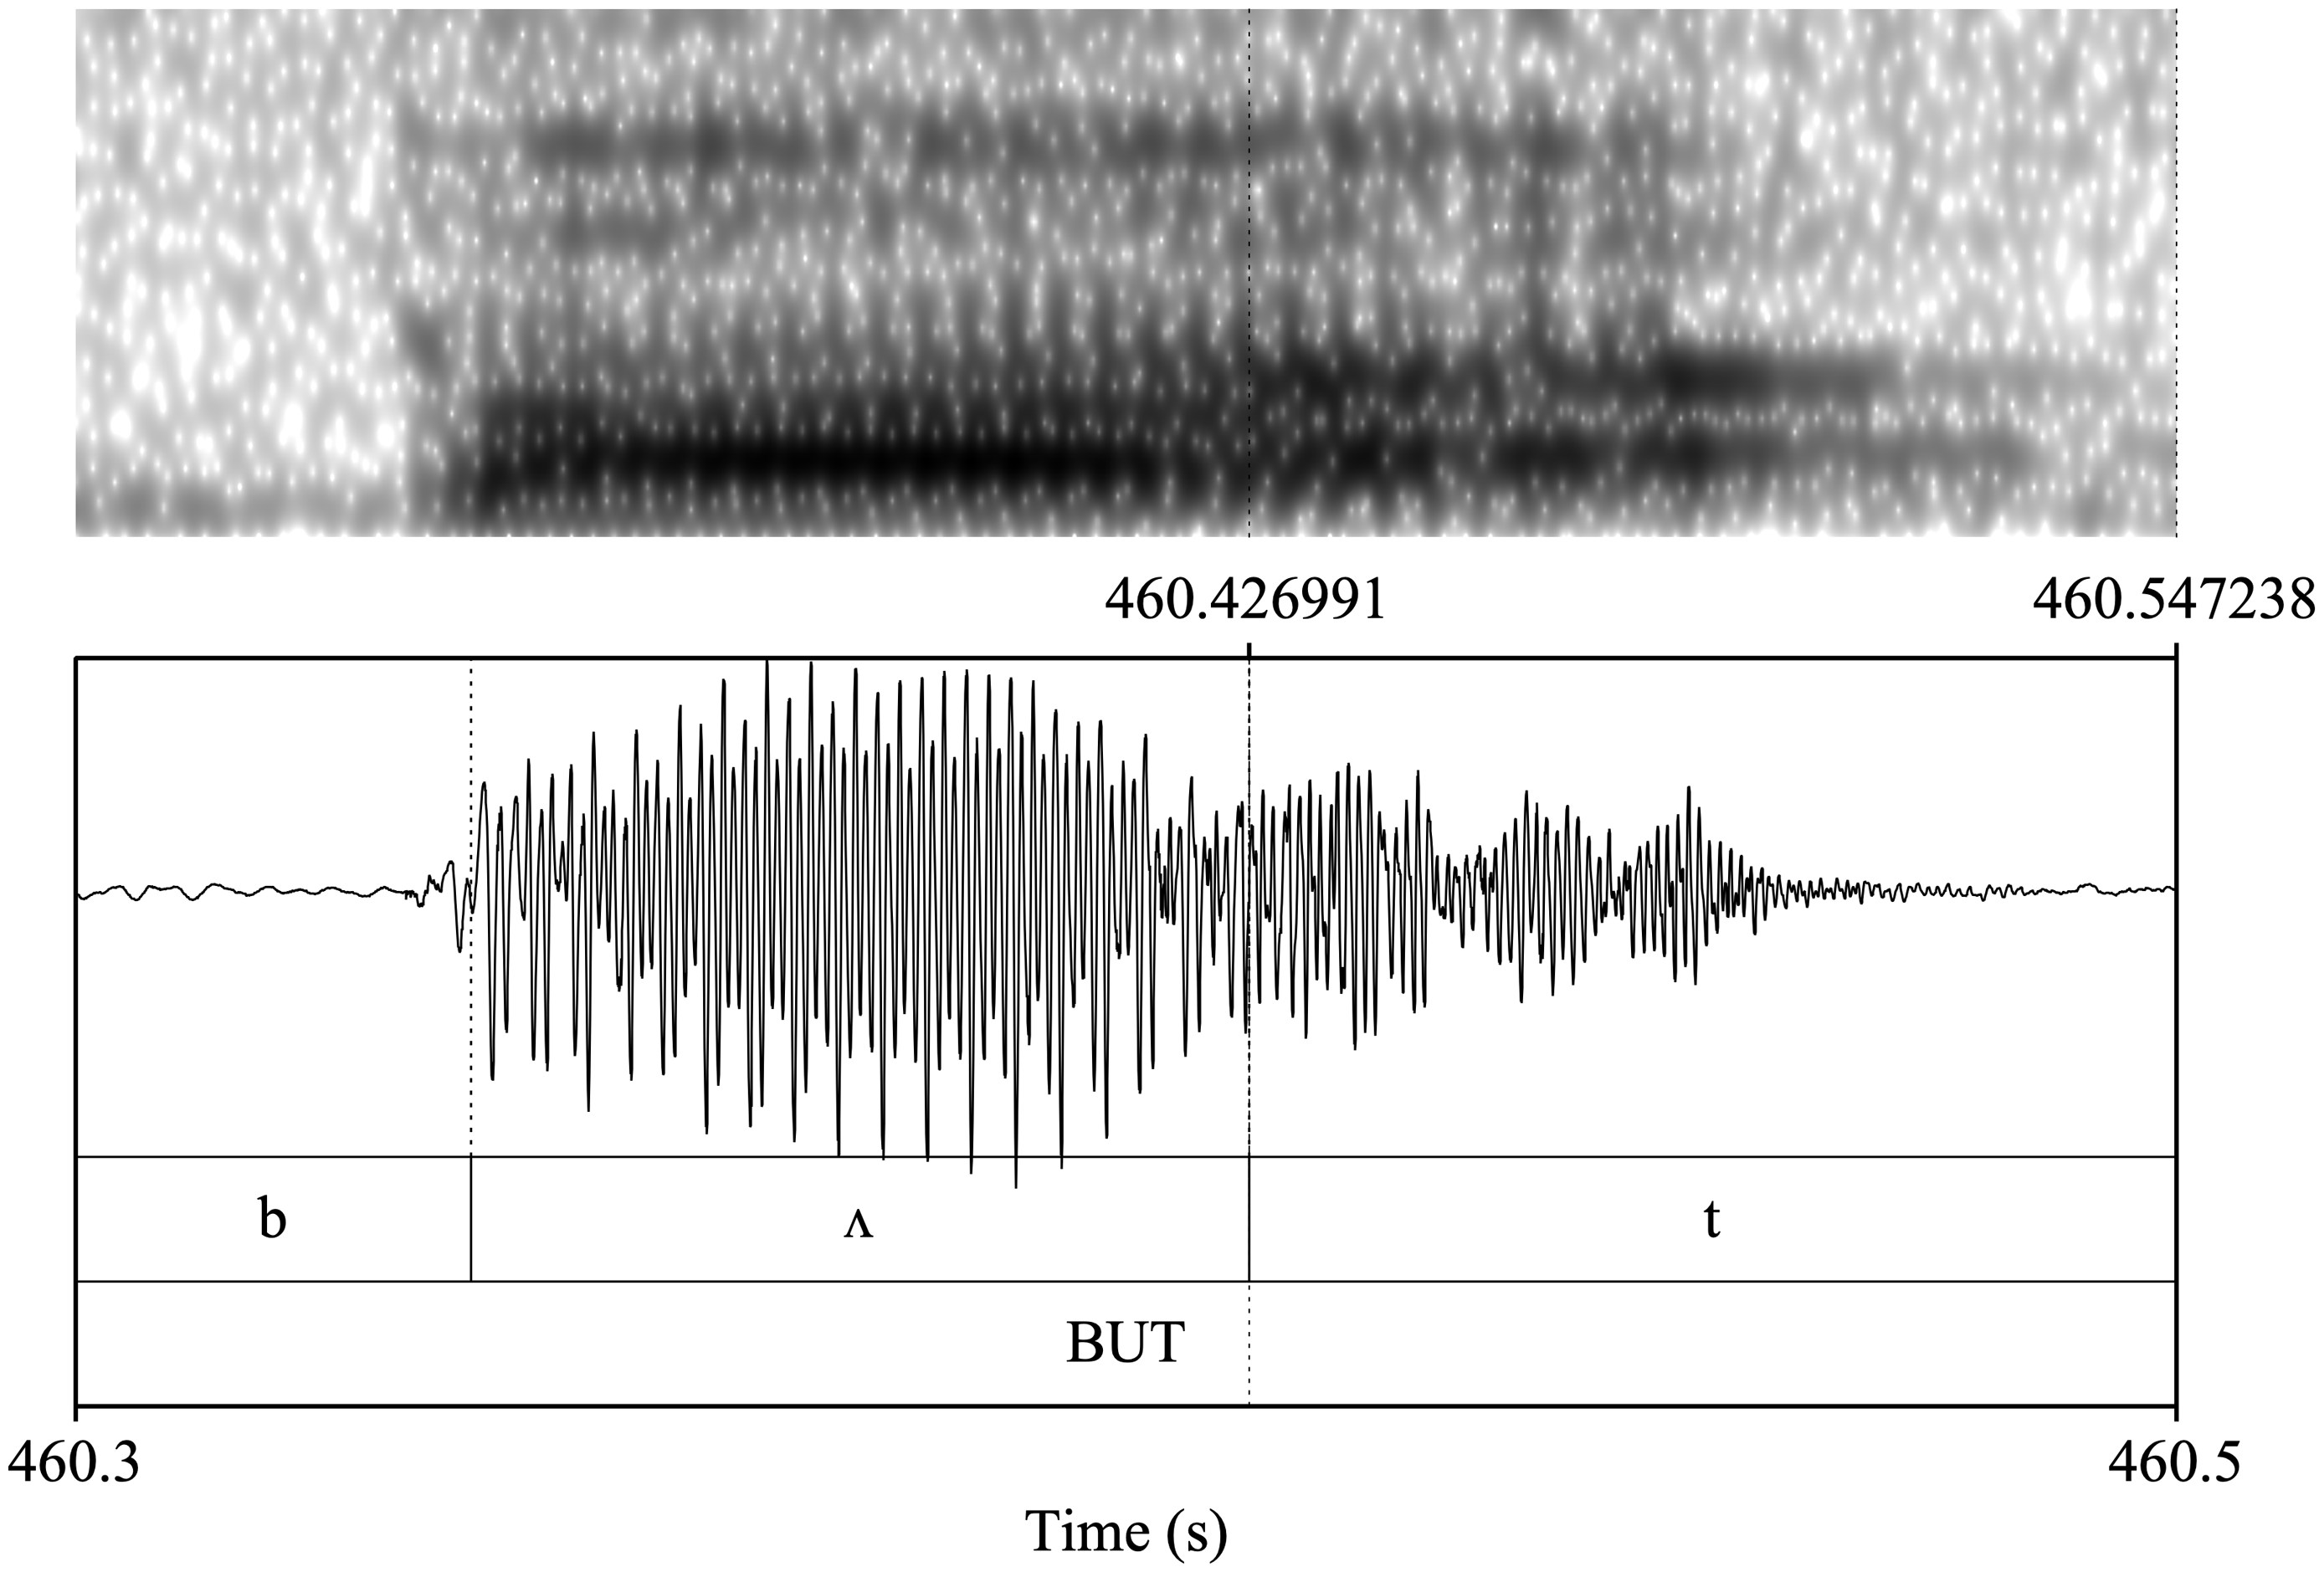
I mostly took a bottom-up approach in identifying certain consonantal features for analysis as characteristics of the English variety in Dearborn. As discussed in Section 2, my speakers in Dearborn provided commentary on a Dearborn variety of English that sounded “deeper” and “throaty,” and the consonantal features that caught my attention during the interviews were consistent with such commentary. For example, throughout the interviews, I noticed that some of my Dearborn participants tended to glottalize or fricate certain stop sounds in certain phonological environments. Such glottalization and frication of stop sounds are illustrated in Figures 1 and 2.
Waveform and spectrogram of word-final /t/ in the word but pronounced by speaker SEMI18 from Dearborn.
Waveform and spectrogram of word-medial /k/ in the word talking by speaker SEMI12 from Dearborn.

Figure 1 illustrates the glottalization of final /t/ in the word but by speaker SEMI18 through the constricted vocal fold closure (as opposed to full occlusion). The irregular glottal pulses on the preceding vowel point to the glottalization of the coda /t/ (Penney et al., Reference Penney, Cox, Miles and Palethorpe2018). This is consistent with Thomas’s (Reference Thomas2011) description of glottalized syllable-coda voiceless stops with their “exceptionally slow, glottal pulses” (2011:119) in the wideband spectrogram that “become more widely separated near the stop and are somewhat irregular in frequency” (2011:120). Similarly, focusing specifically on voiceless coda stops in American English, Huffman (Reference Huffman2005:335) considers “longer, often stronger, irregularly spaced glottal pulses on voiced portions of neighboring sounds” as evidence that the stop is glottalized.
Figure 2 illustrates the frication of the intervocalic /k/ in the word talking by speaker SEMI12. There is a clear lack of complete velar closure for the production of /k/ in the figure. Loakes & McDougall (Reference Loakes and McDougall2010) suggest that higher energy frication at the onset and offset of voiceless velar stop /k/ points to its realization as the velar fricative /x/. Thus, the visual analysis (in addition to the audio analysis) of speaker SEMI12’s pronunciation of the word talking suggests that the intervocalic /k/ in this word has been fricated and realized as /x/. Both the glottalization of word-final /t/ and the frication of intervocalic and final-word /k/ are consistent with my participants’ comments about the “throaty” and “deeper” phonological characteristics of the Dearborn English.
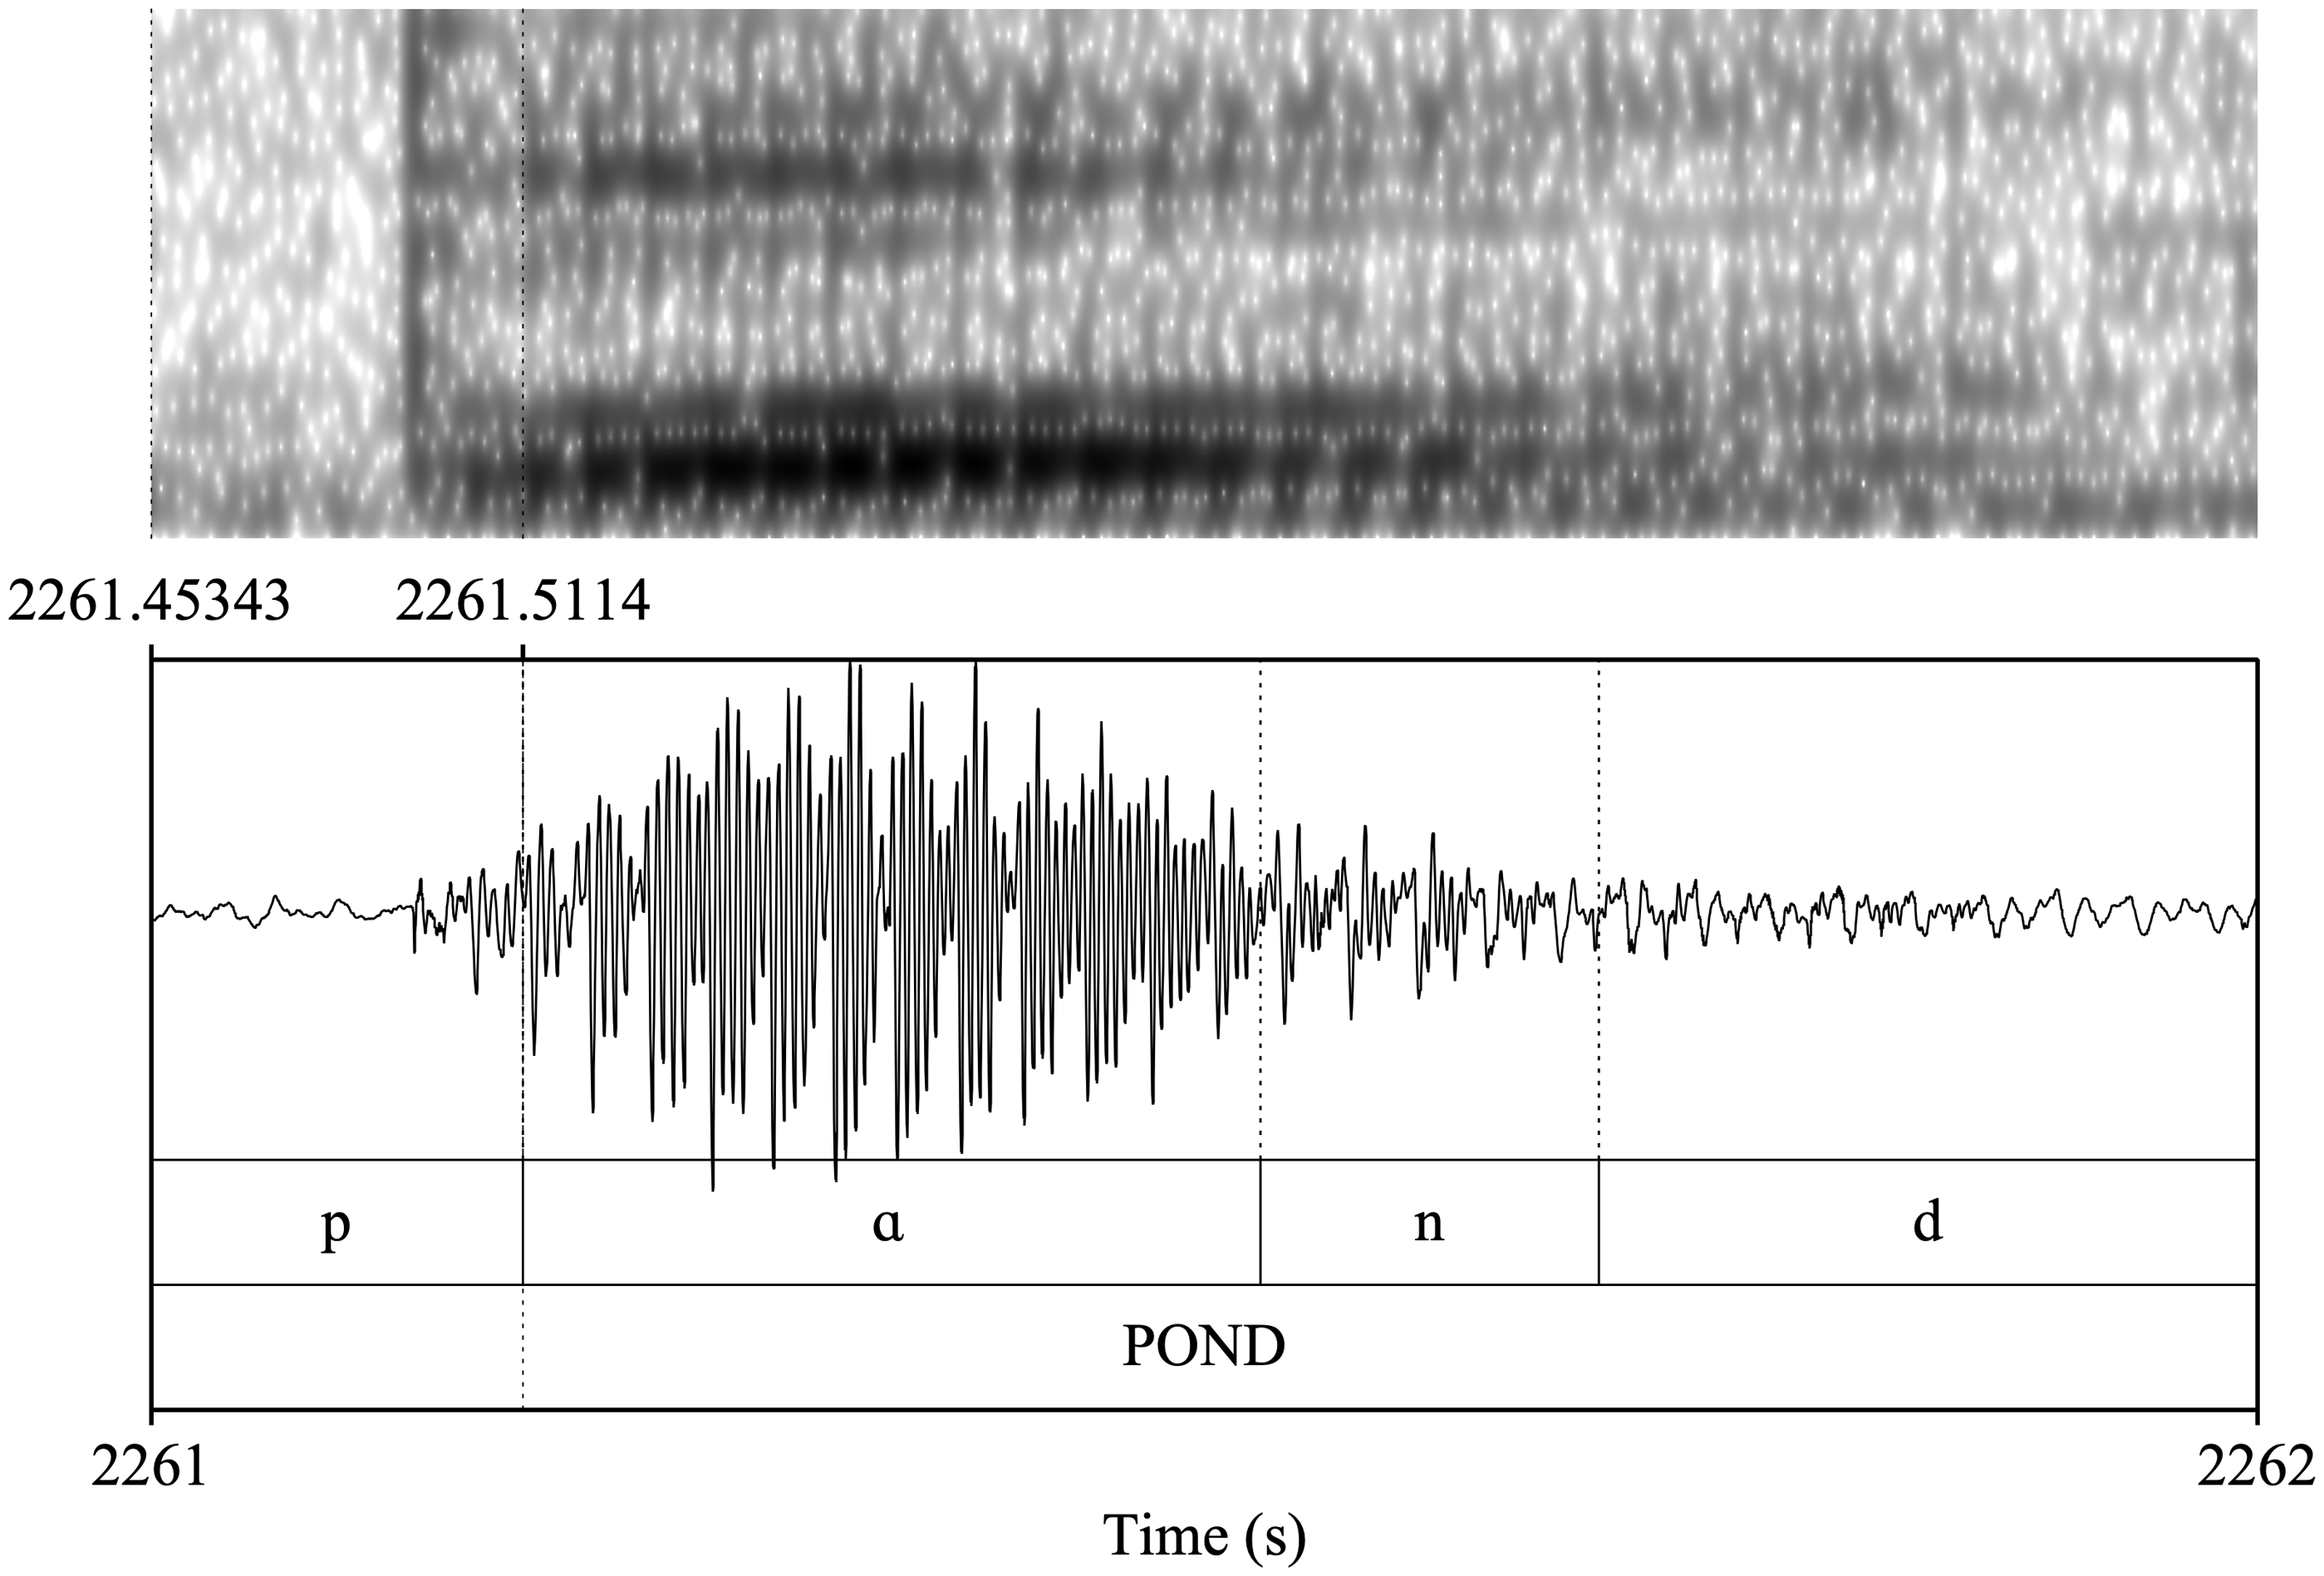
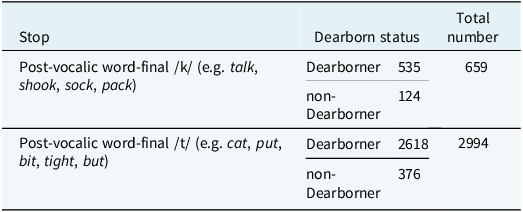
Another phonetic feature that caught my attention during the interviews, in addition to glottalization and frication of stop sounds, was the phonation of word-initial bilabial stop /p/ by some of the Dearborn speakers, which made it sound more like /b/. Figure 3, for example, illustrates the pronunciation of the word pond by speaker SEMI12. The phonation and the short duration between the release of the initial /p/ and the onset of glottal pulsing for the following vowel in the figure point to the similarity of this particular token of /p/ to its lenis counterpart. Thus, in the consonantal analysis of the present article, I focus on the glottalization and frication rates of stop sounds on the one hand, and voice onset time (VOT) distributions of stop sounds on the other. For the glottalization and frication analysis, I visually and auditorily classified all the postvocalic word-final /t/ and /k/ tokens that occurred in the reading passage context of the interviews into glottalized versus canonical (for the /t/ tokens) and fricated versus canonical (for the /k/ tokens) categories. Table 1 shows the number of all postvocalic word-final /t/ and /k/ extracted for analysis in this article. Of the 44 participants whose data is analyzed in this paper, 42 participants read the reading passage, and the /t/ and /k/ tokens presented in Table 1 were produced by those 42 participants (speaker SCWI02, a non-Dearborner, and SEMI06, a Dearborner, did not read the passage because we ran out of time).
Waveform and spectrogram of word-initial /p/ in the word pond pronounced by speaker SEMI12 from Dearborn.
Numbers and types of /t/ and /k/ tokens extracted from the reading passage context for glottalization and frication analysis
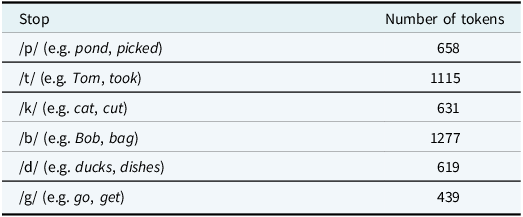
For the VOT analysis, I measured the VOTs of all prevocalic word-initial stops in the reading passage context of the interviews. I manually measured the duration between the release of the prevocalic word-initial stops and the onset of glottal pulsing in the following vowel in PRAAT (Boersma & Weenink, Reference Boersma and Weenink2018). Table 2 shows the total number of prevocalic word-initial stops analyzed in this paper, which were produced by the 42 participants who read the reading passage during the interviews.
Number of prevocalic word-initial stops extracted from the reading passage context for VOT analysis
3.2. Vowel extraction
Informed by the analysis of the consonantal features in the present study, I focus the vowel analysis on two groups of Dearborn speakers. The vowel analysis in the present article is an extension of my previous work on the vowel patterns of MENA Americans in the Upper Midwest; the reader can refer to Sheydaei (Reference Sheydaei2021) or Sheydaei (Reference Sheydaei2024) for a full description of the vowel analysis. In the vowel analysis in this paper, I focus on vowels extracted solely from the casual speech style. Only vowels in lexical-syntactic categories (e.g. nouns, verbs, adjectives, and adverbs) were extracted for analysis in this paper; in other words, functional-syntactic categories (e.g. determiners, auxiliaries, and coordinators) were excluded from vowel extraction because they are usually not stressed at the sentence level. At the word stress level, only the vowels with the primary stress were extracted for analysis. In terms of duration, only vowels longer than 59 milliseconds were selected for analysis. F1, F2, and F3 values were taken at 30% (head) and 70% (tail) of the duration of the vowel. I used a PRAAT (Boersma & Weenink, Reference Boersma and Weenink2018) script to mark the heads and tails of the target vowels; then, I went through each marked vowel manually to make sure the marking was done correctly: to make sure that the head and tail of the correct vowels had been marked, and to make sure that the first three formants were consistently tracked. Another PRAAT script was used to gather the F1, F2, and F3 values. As the primary focus of the vowel analysis in this paper is on Dearborners’ speech, Table 3 shows the number of different vowel tokens extracted from the casual speech style by Dearborn speakers only. I utilize Wells’ (Reference Wells1982:xviii-xix) vowel classes, with particular representations of the phonological environments and vowel subclasses.
Tokens of different vowel classes (or subclasses) extracted from the casual speech context by Dearborn speakers
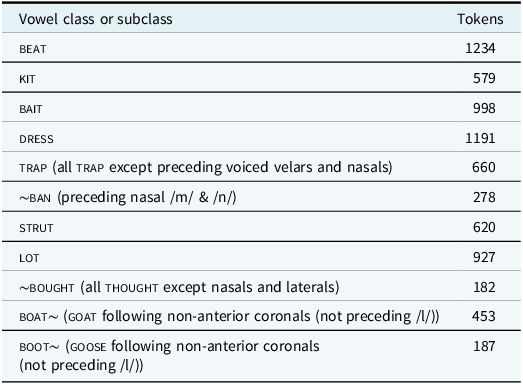
In this table and the graphs in Section 4.3, I specify the phonological environments of different vowel classes by using the symbol “~” to indicate the position of the vowel. When “~” precedes the target vowel, it means that the vowel is positioned before a certain consonant or group of consonants. For example, “~ban” means the trap vowel occurs before the nasal sound /m/ or /n/. On the other hand, when “~” follows the target vowel, it means the vowel is positioned after a certain consonant or group of consonants. For example, “boat~” means that the goat vowel occurs after non-anterior coronals. In the following section, I present the results of the present study.
4. Results
The analysis of the VOT distributions presents interesting findings with regard to internal differences among Dearborn speakers. This particular finding is meaningful for the analysis of other features—including the vowel patterns—in this article. As such, I will start this section by presenting the results from the analysis of VOT distributions.
4.1. VOT results
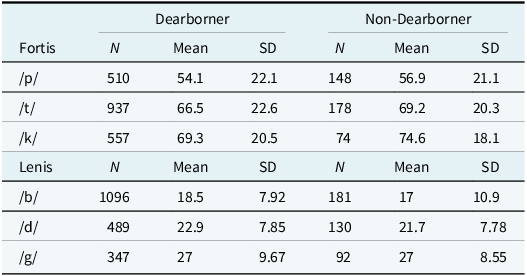
Table 4 shows the mean VOT and the standard deviations for the prevocalic word-initial stop sounds across Dearborn status and place of articulation. The mean plots in Figure 4 also illustrate the descriptive statistics visually by Dearborn status.
Mean VOT (ms) and standard deviations for prevocalic word-initial stops by Dearborn status and place of articulation
VOT mean plots for prevocalic word-initial stops across Dearborn status.
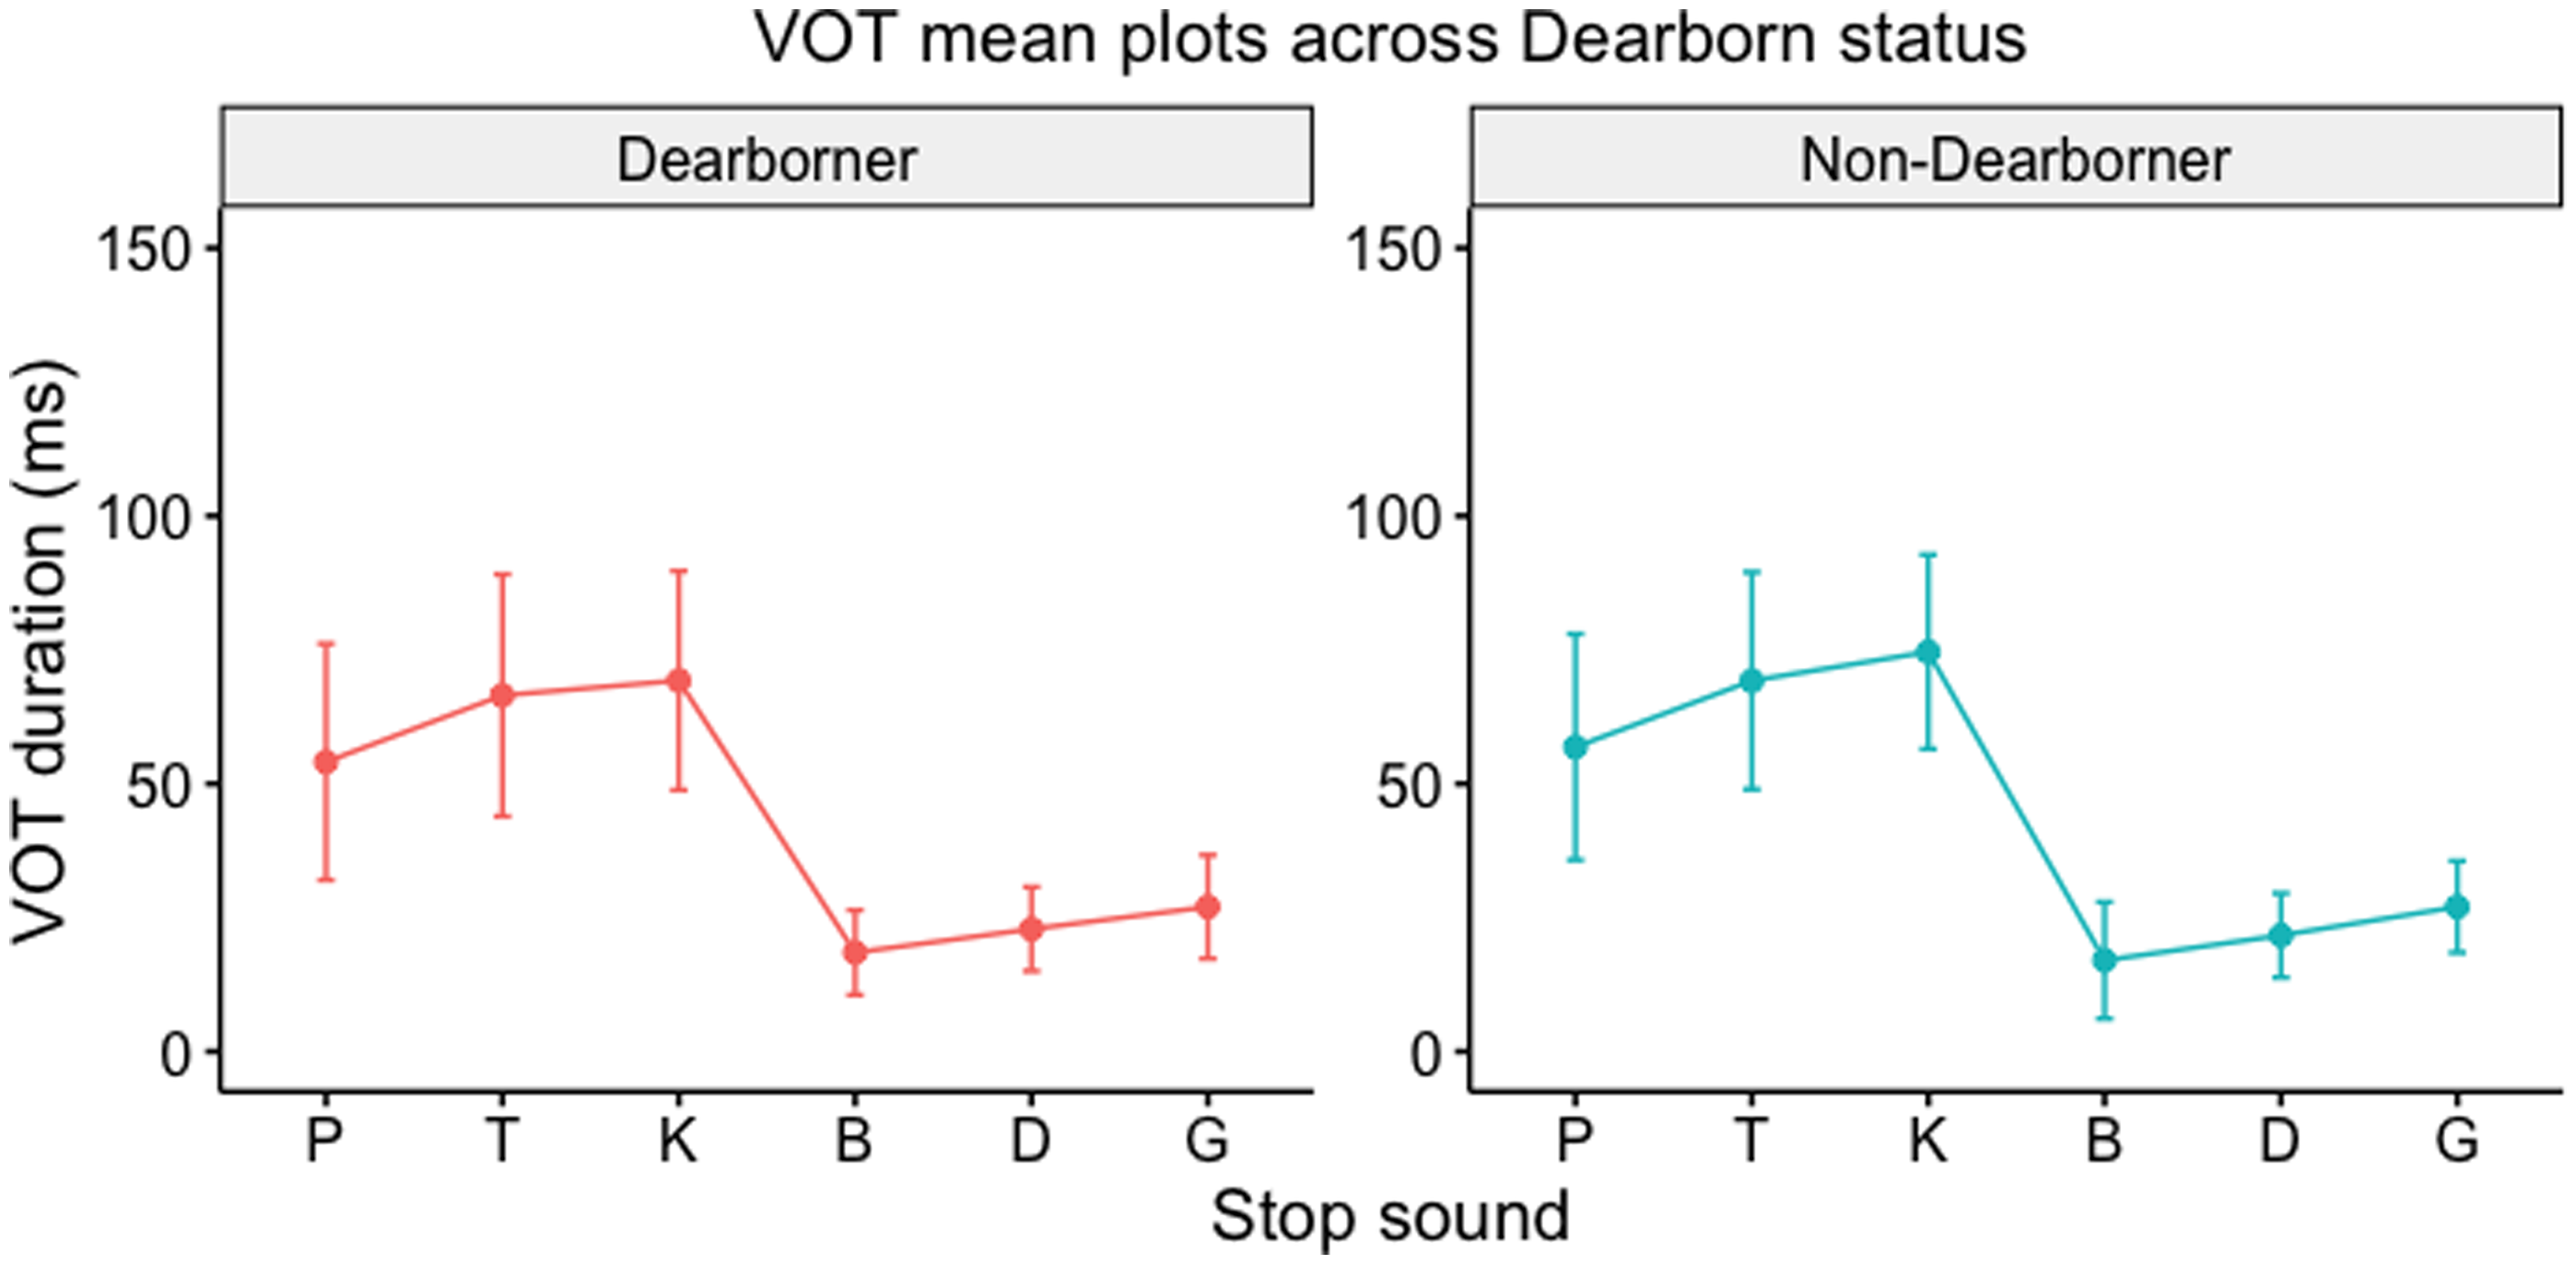
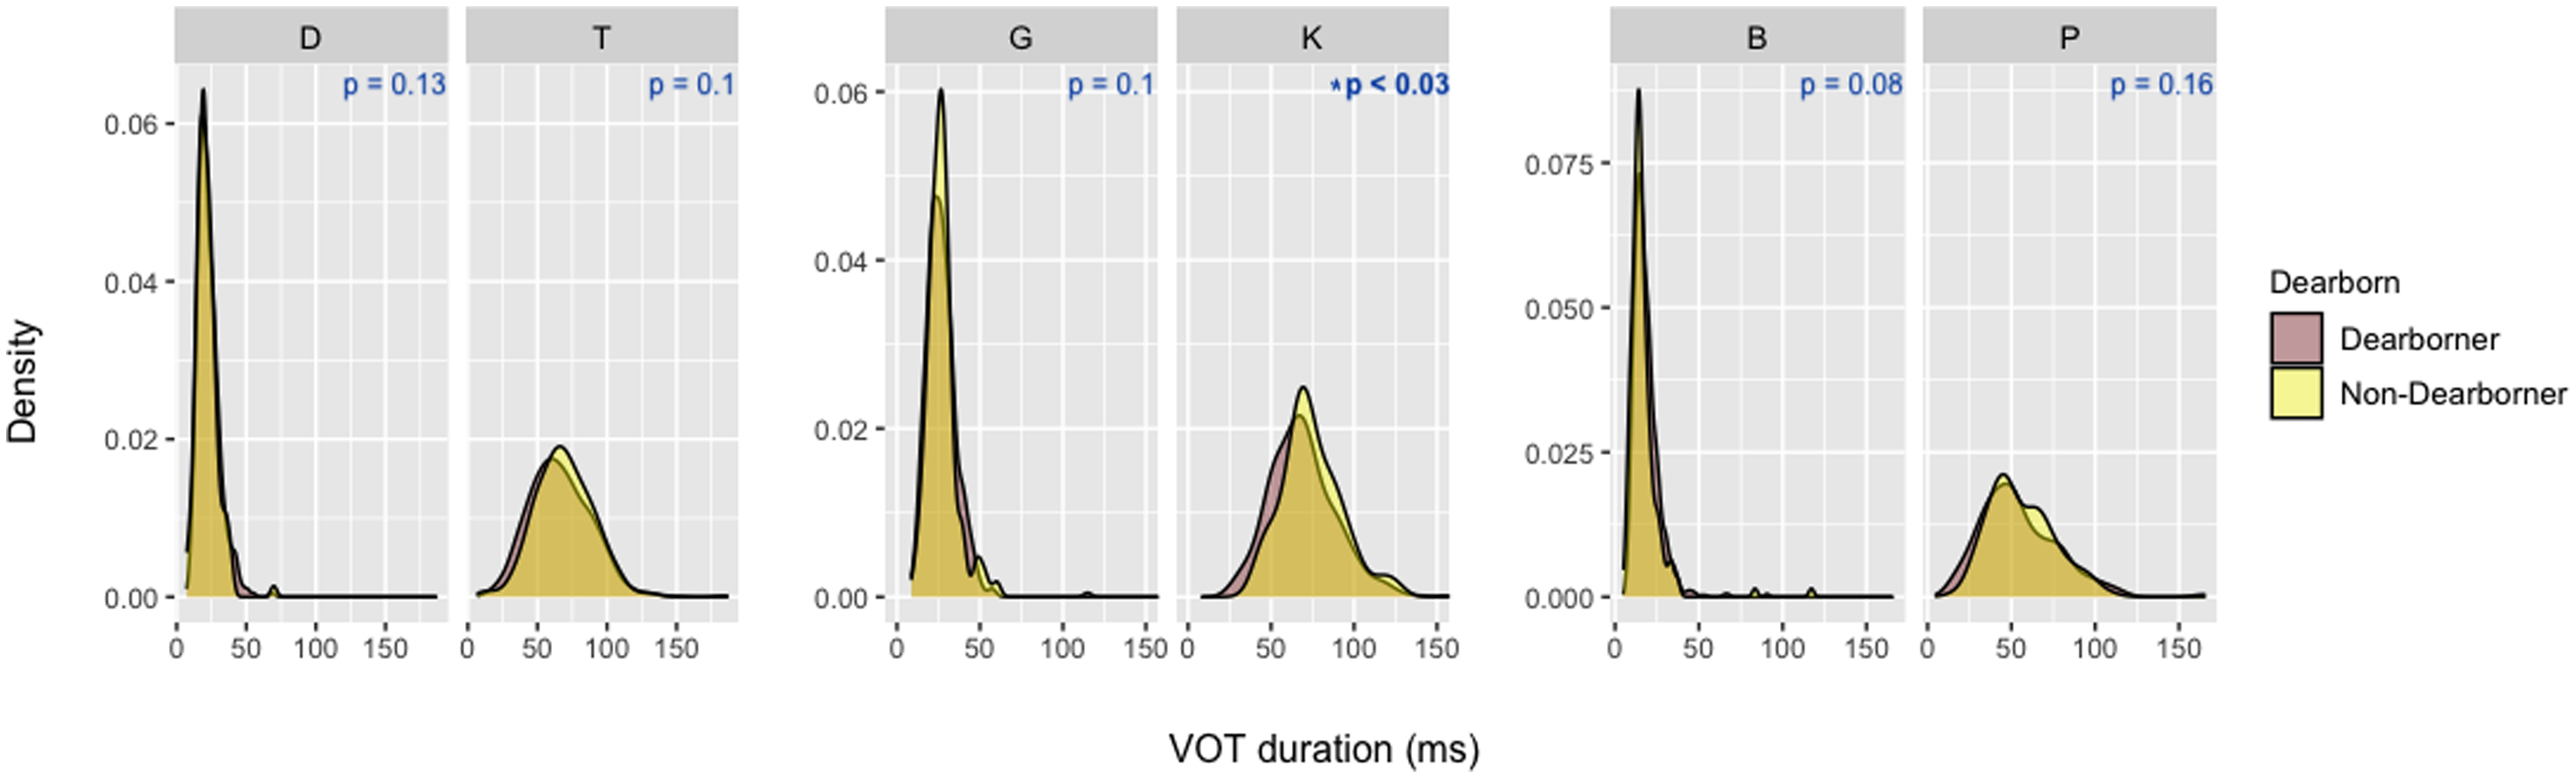
Figure 4 shows no noticeable differences between Dearborners and non-Dearborners in terms of mean VOTs. Multiple t-tests were run to see whether significant differences could be observed between the two groups of Dearborners and non-Dearborners; the results of six separate t-tests (for each stop consonant) showed no significant differences between Dearborners and non-Dearborners for VOT duration except for the fortis velar stop /k/ (p-values shown in Figure 5). Figure 5 provides density plots for better visualization of VOT distributions across Dearborn status for the three sets of coronal stops (/t/ and /d/), velar stops (/k/ and /g/), and bilabial stops (/p/ and /b/).
Distribution of VOTs for prevocalic word-initial coronal stops (left), velar stops (middle), and bilabial stops (right) across Dearborn status.
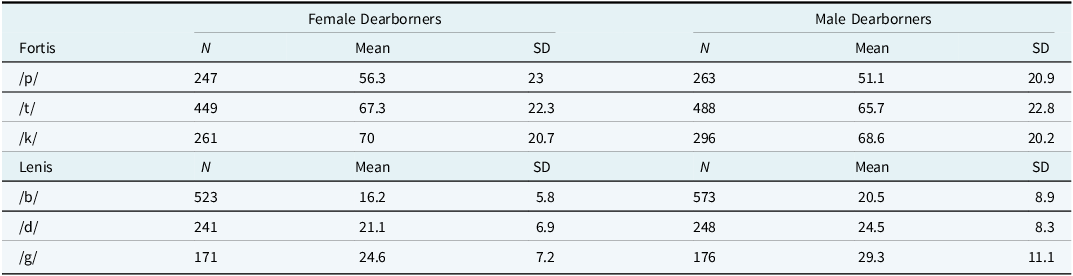
While, as indicated above, there are no significant differences between the VOT distributions of the two groups of speakers for most sets of the stop sounds, my observations of Dearborners’ speech and their own metalinguistic comments about Dearborn English made me explore this group further. Dearborners interviewed in this study described the English variety spoken in Dearborn as sounding “deeper” and more “throaty,” including more “slang,” and stereotypically associated with male Dearborners. Therefore, to further explore the VOT distributions in Figure 5, I divided the Dearborn group into groups of female Dearborners (n = 15: one of the female Dearborners did not read the reading passage during the interview because we ran out of time) and male Dearborners (n = 16). Table 5 shows the mean VOT and the standard deviations for the prevocalic word-initial stop sounds across binary genders among Dearborn speakers, and Figure 6 shows the distributions across binary genders for the three sets of coronal stops (/t/ and /d/), velar stops (/k/ and /g/), and bilabial stops (/p/ and /b/).
Mean VOT (ms) and standard deviations for prevocalic word-initial stops by binary gender and place of articulation
Distribution of VOTs for prevocalic word-initial coronal stops (left), velar stops (middle), and bilabial stops (right) across binary genders among Dearborn speakers.
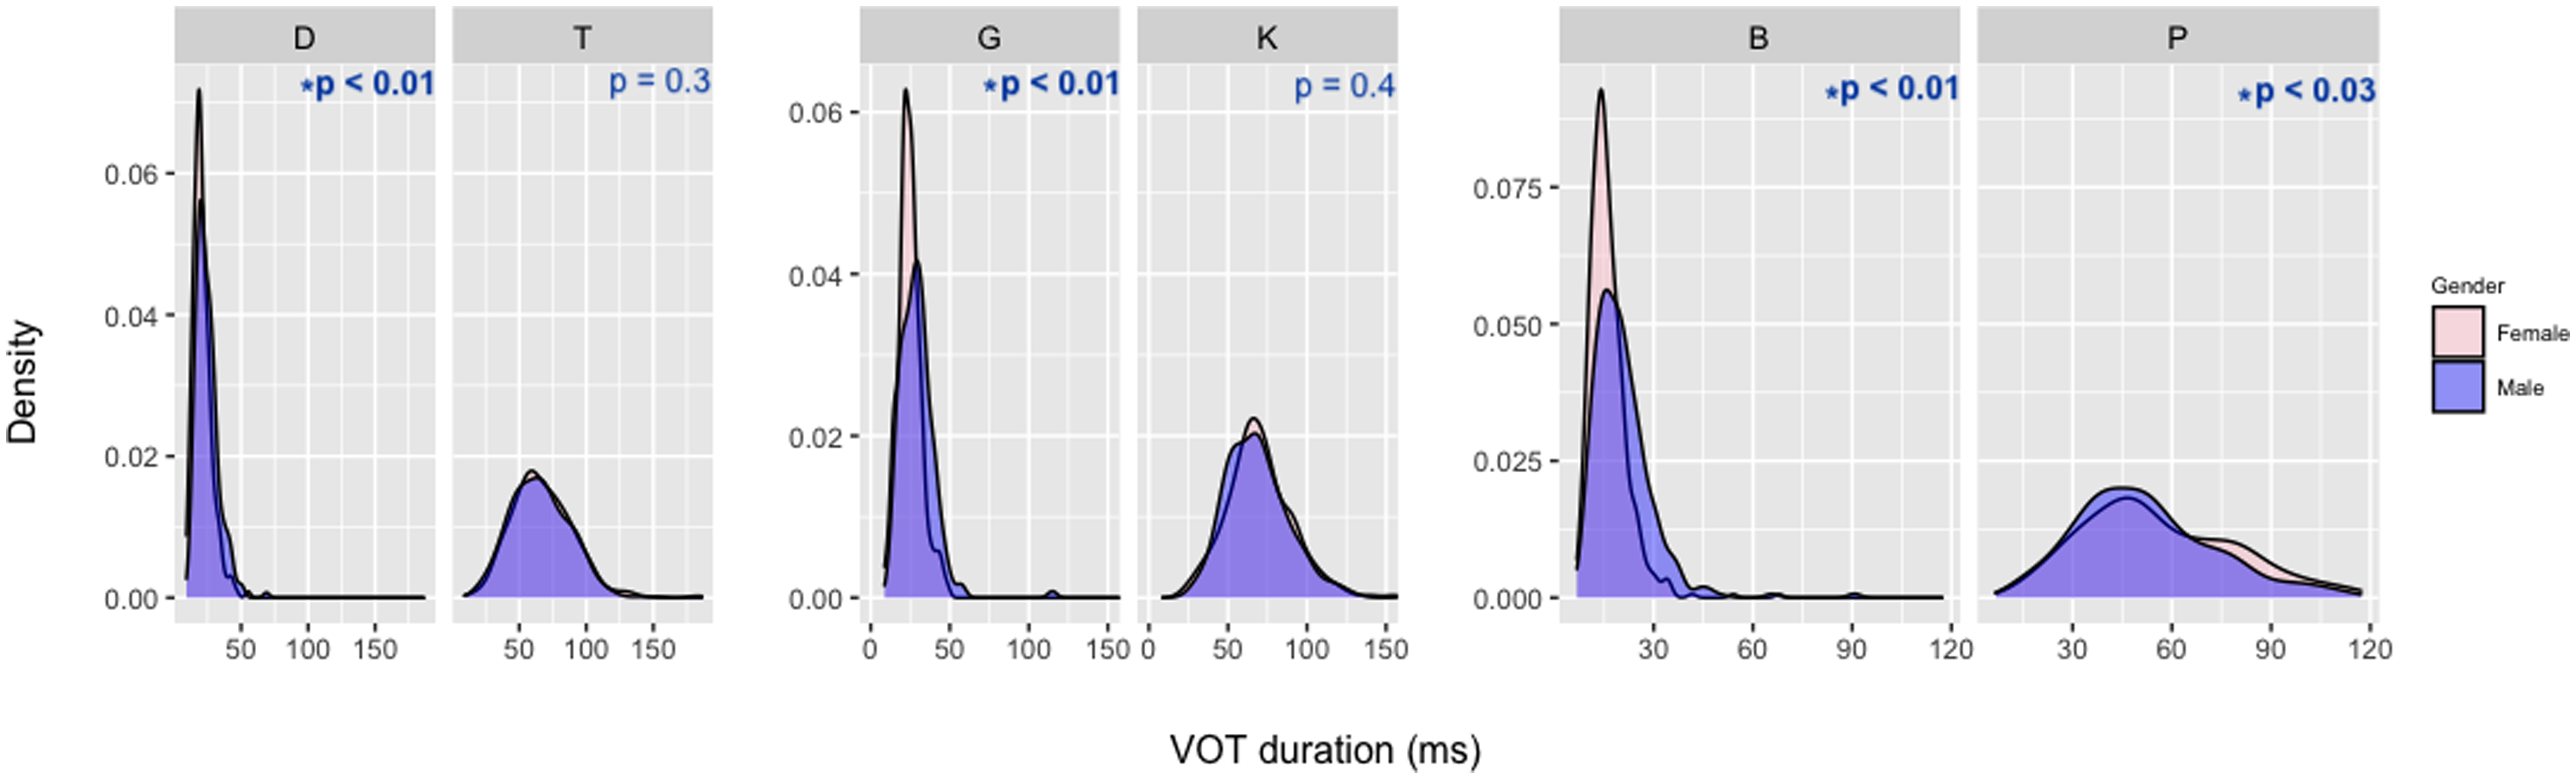
Multiple t-tests showed that while /d/ and /g/ are significantly different between the two groups of Dearborn speakers, both members of the bilabial set are significantly different between males and females. The VOT distribution graph in Figure 6 and mean VOT values in Table 5 both show that there is a convergence between /p/ and /b/ for male speakers; with regard to the velar and coronal sets of stops, there is also a convergence between the lenis and fortis members for male speakers, although the differences between the two groups’ VOT distributions for /k/ and /t/ are not statistically significant. In the Arabic consonantal repertoire, the bilabial lenis stop /b/ does not have a fortis counterpart, and the velar fortis stop /k/ does not have a lenis counterpart (Thelwall & Sa’Adeddin, Reference Thelwall and Sa’Adeddin1999);Footnote 3 as such, I argue that the convergence of the velar stops /k/ and /g/ and the bilabial stops /p/ and /t/, respectively, for male Dearborners could function as an ethno-local marker.
4.2. Glottalization and frication of stops
Figure 7 illustrates the frication rates of postvocalic word-final /k/ across Dearborn status (in terms of having been raised in Dearborn or not in Dearborn) and binary genders among Dearborn speakers. The figure clearly shows that frication rates are not different across Dearborn status. Pearson chi-squared tests also showed that while there is no significant difference between the Dearborn and non-Dearborn groups, i.e. χ2 (1, N = 42) = 2.5, p = 0.11, male Dearborners have a significantly higher rate of /k/ frication than their female counterparts, i.e. χ2 (1, N = 31) = 20.6, p < 0.01.
Frication of postvocalic word-final /k/ for Dearborners (N = 31) vs. non-Dearborners (N = 11) (left), and female Dearborners (N = 15) vs. male Dearborners (N = 16) (right).

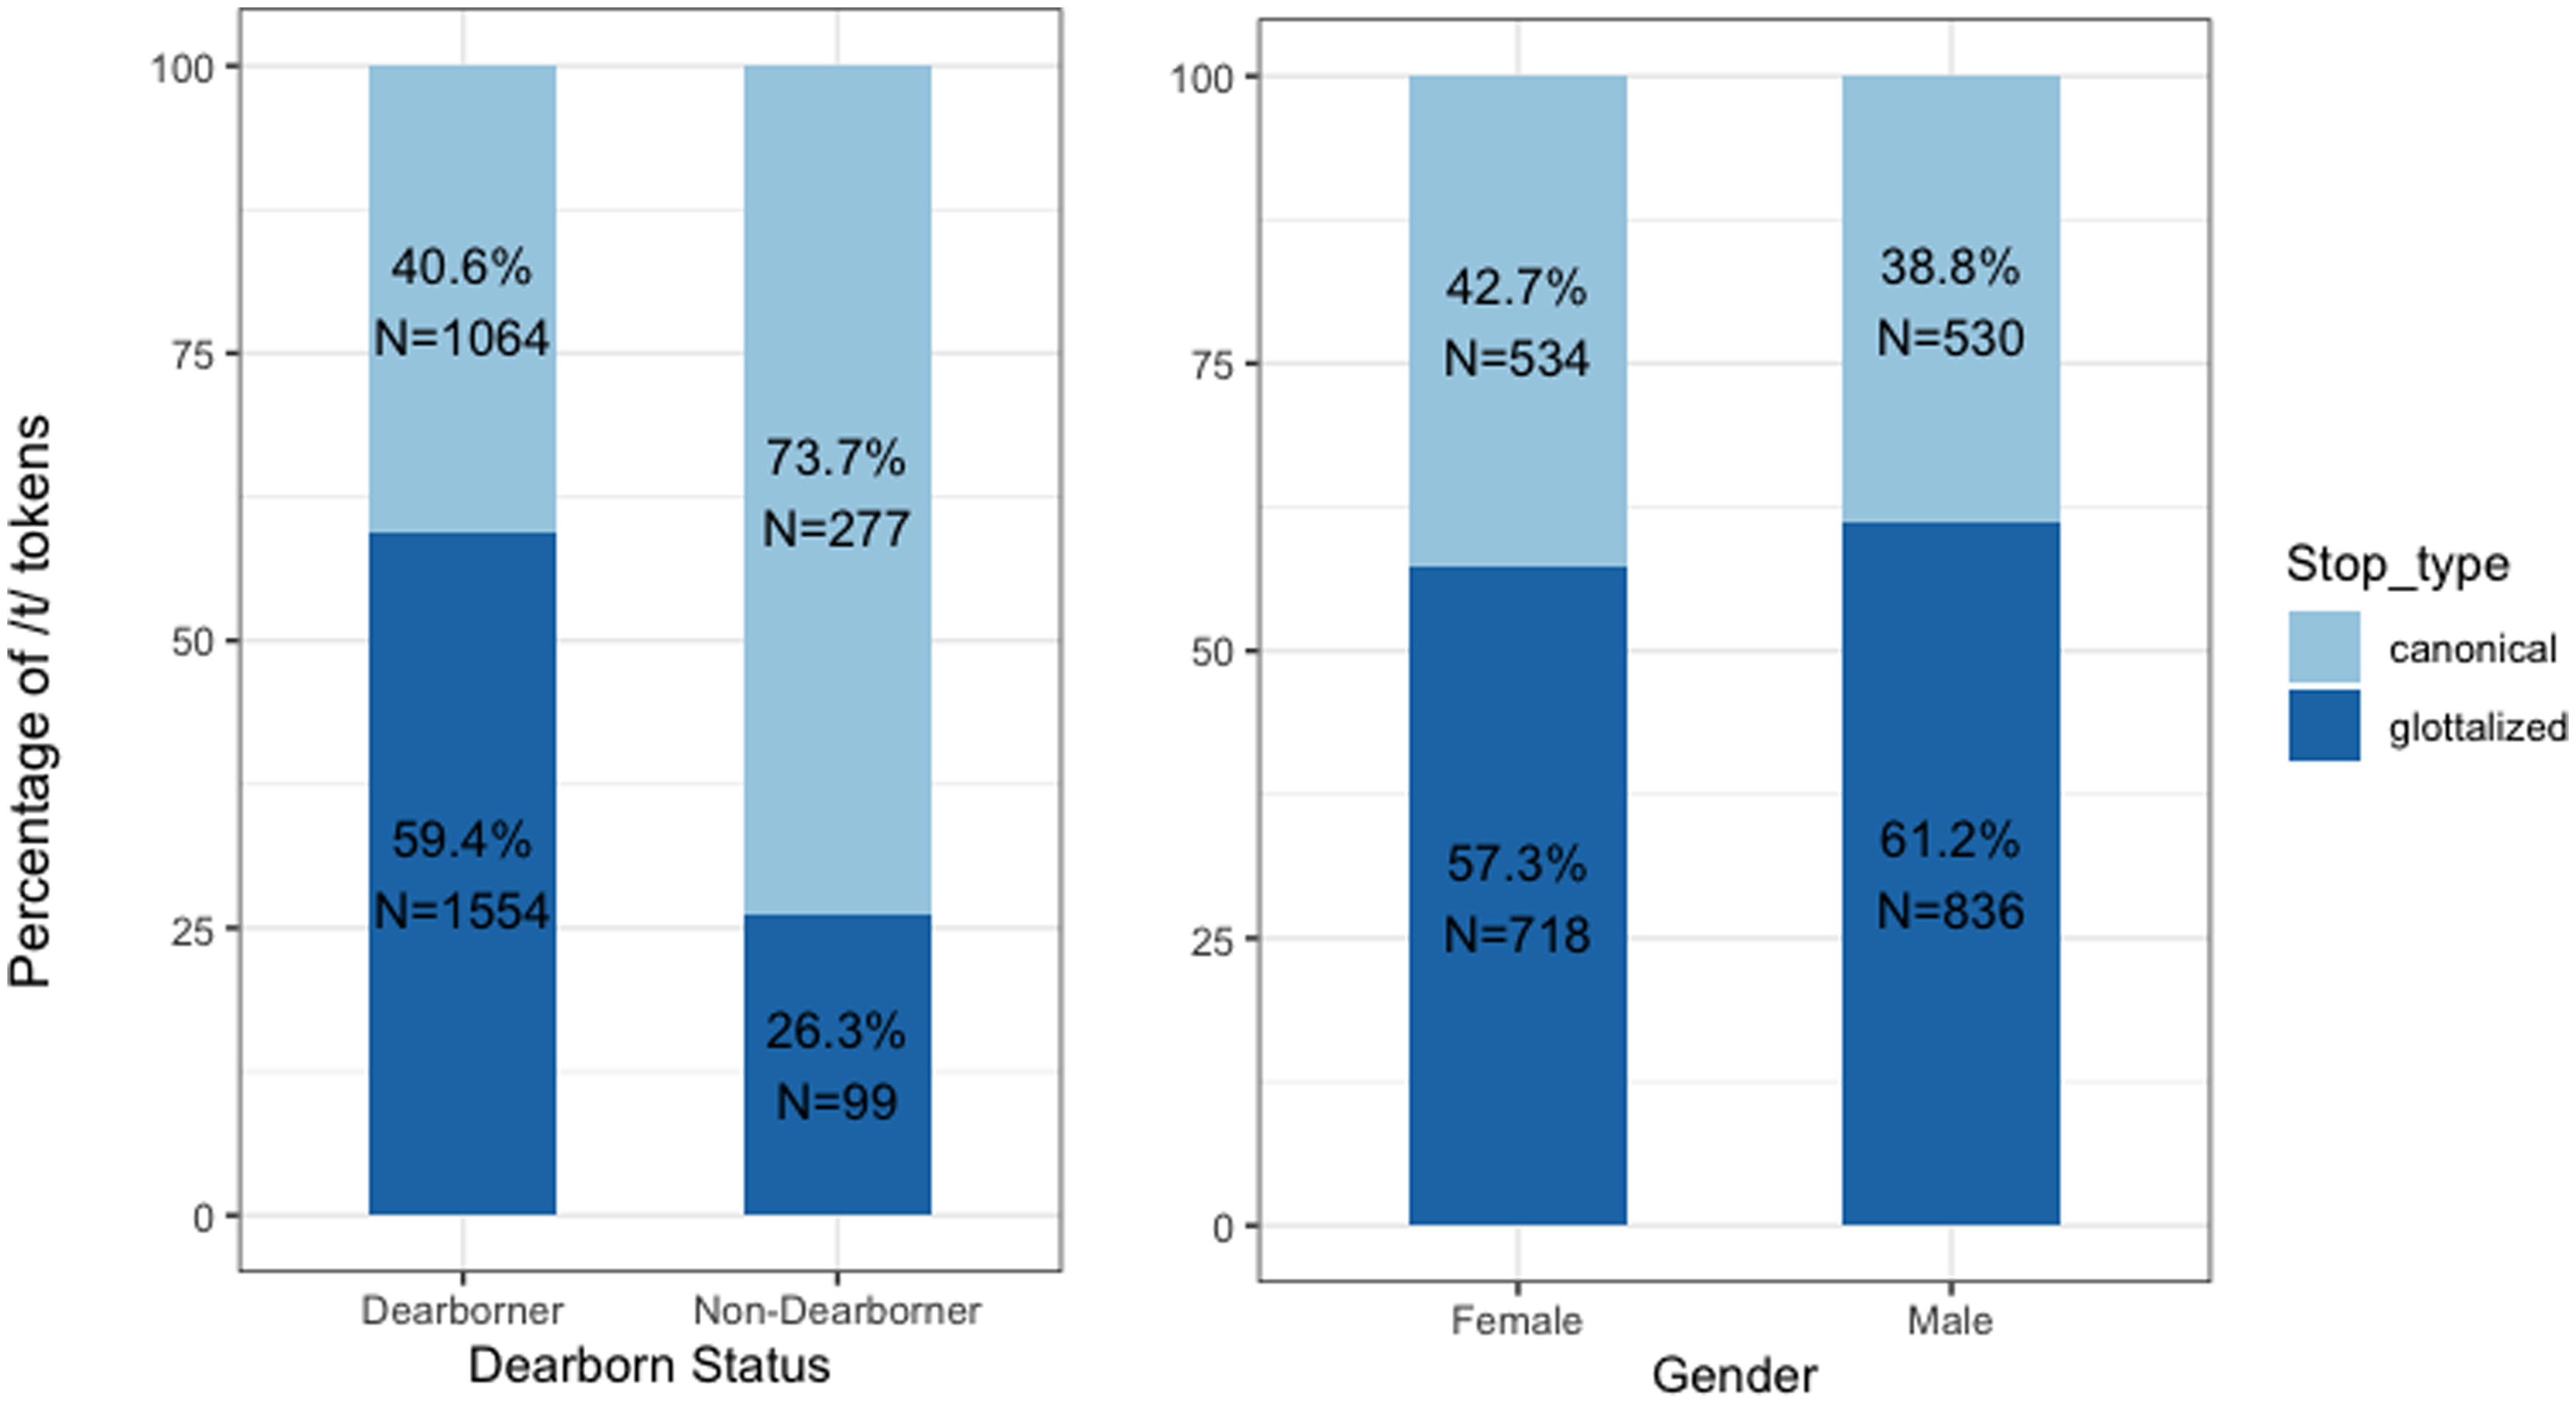
Figure 8 shows the rates of glottalization of postvocalic word-final /t/ across Dearborn status and binary genders among Dearborn speakers. The figure shows that Dearborners’ rate of glottalization of postvocalic word-final /t/ is more than twice as high as that for non-Dearborners; a Pearson chi-squared test also showed that Dearborners’ rate of /t/ glottalization is significantly higher than that of non-Dearborners, i.e. χ2 (1, N = 42) = 143.7, p < 0.001. Additionally, although rates of /t/ glottalization for female and male Dearborners are much closer, they are still significantly different, i.e. χ2 (1, N = 31) = 3.86, p < 0.05.
Glottalization of postvocalic word-final /t/ for Dearborners (N = 31) vs. non-Dearborners (N = 11) (left), and female Dearborners (N = 15) vs. male Dearborners (N = 16) (right).
So far, we have observed that higher rates of word-final /t/ glottalization and the convergence of the VOT for fortis and lenis members of the velar and bilabial stop sets can be local and ethnic markers for Dearborn speakers. In light of these findings, specifically with regard to differences between male and female Dearborners, I analyze the vowel patterns of these two groups of Dearborn speakers in the next section.
4.3. Vowel pattern results
As discussed in Section 2, in Sheydaei (Reference Sheydaei2024), I analyzed the vowel space of MENA Americans in the Upper Midwest as an aggregate group, that is, without separating Dearborners from non-Dearborners. That analysis showed that while the vowel pattern in the speech of MENA Americans in the Upper Midwest features certain NCS tendencies (such as dress and kit lowering and retraction), it avoids other NCS tendencies such lot fronting and trap raising and fronting (featuring the trap nasal split instead). Here, informed by the metacommentary of my Dearborn speakers and the findings from the consonantal analysis, I specifically focus on the vowel patterns of Dearborn speakers and the two sub-groups within the Dearborn group.
Figure 9 shows the vowel space of 32 Dearborn speakers and 12 non-Dearborn speakers in their casual speech contextual style. The figure shows the nasal split of trap, the retraction and lowering of dress, the fronting of boot~, and the convergence of low back vowels for both groups of Dearborner and non-Dearborner MENA Americans in the Upper Midwest. This pattern is consistent with the emerging translocal vowel pattern of the Low-Back-Merger Shift (LBMS) (Becker, Reference Becker and Becker2019) in which the merger of low back vowels “allows for considerable variation in instantiation” (Becker, Reference Becker and Becker2019:2) of other features. These features include the lowering and retraction of low and mid-high front vowels of trap, dress, and kit in the direction of the gap left by the rising and retraction of lot. Multiple studies in the Upper Midwest context have shown consistencies with the LBMS among different groups such as European Americans (Wagner et al., Reference Wagner, Alexander Mason, Pevan and Savage2016; Nesbitt & Mason, Reference Nesbitt and Mason2016; Zheng, Reference Zheng2018; Nesbitt, Reference Nesbitt2021) and Chinese Americans (Zheng, Reference Zheng2018) in south-central and southeastern Michigan. While Figure 9 shows that the vowel spaces of both Dearborner and non-Dearborner MENA Americans in the Upper Midwest are generally consistent with the LBMS, Dearborners show greater distinction between their low back vowels, the central feature of LBMS (and hence its name). ANOVA tests also showed that Dearborners’ lot is significantly different from their ~bought both in F1 (p < 0.02) and F2 (p < 0.01), whereas non-Dearborners’ low back vowels are not significantly different in F1 (p = 0.5) or F2 (p = 0.2). As such, Dearborners’ vowel space can alternatively be analyzed with reference to Preston’s (Reference Preston2014) analysis summarized above, in terms of the diffusion of NCS features and the resulting reformulated vowel system in which asymmetry is avoided and lot remains one of the point vowels. Informed by metalinguistic comments made by Dearborners who associated a Dearborn accent with masculinity and the analysis of consonantal features above, I compare the female Dearborners’ (n = 16) vowel space with that of male Dearborners (n = 16) in the casual speech context.
Casual speech vowel spaces for Dearborners and non-Dearborners.
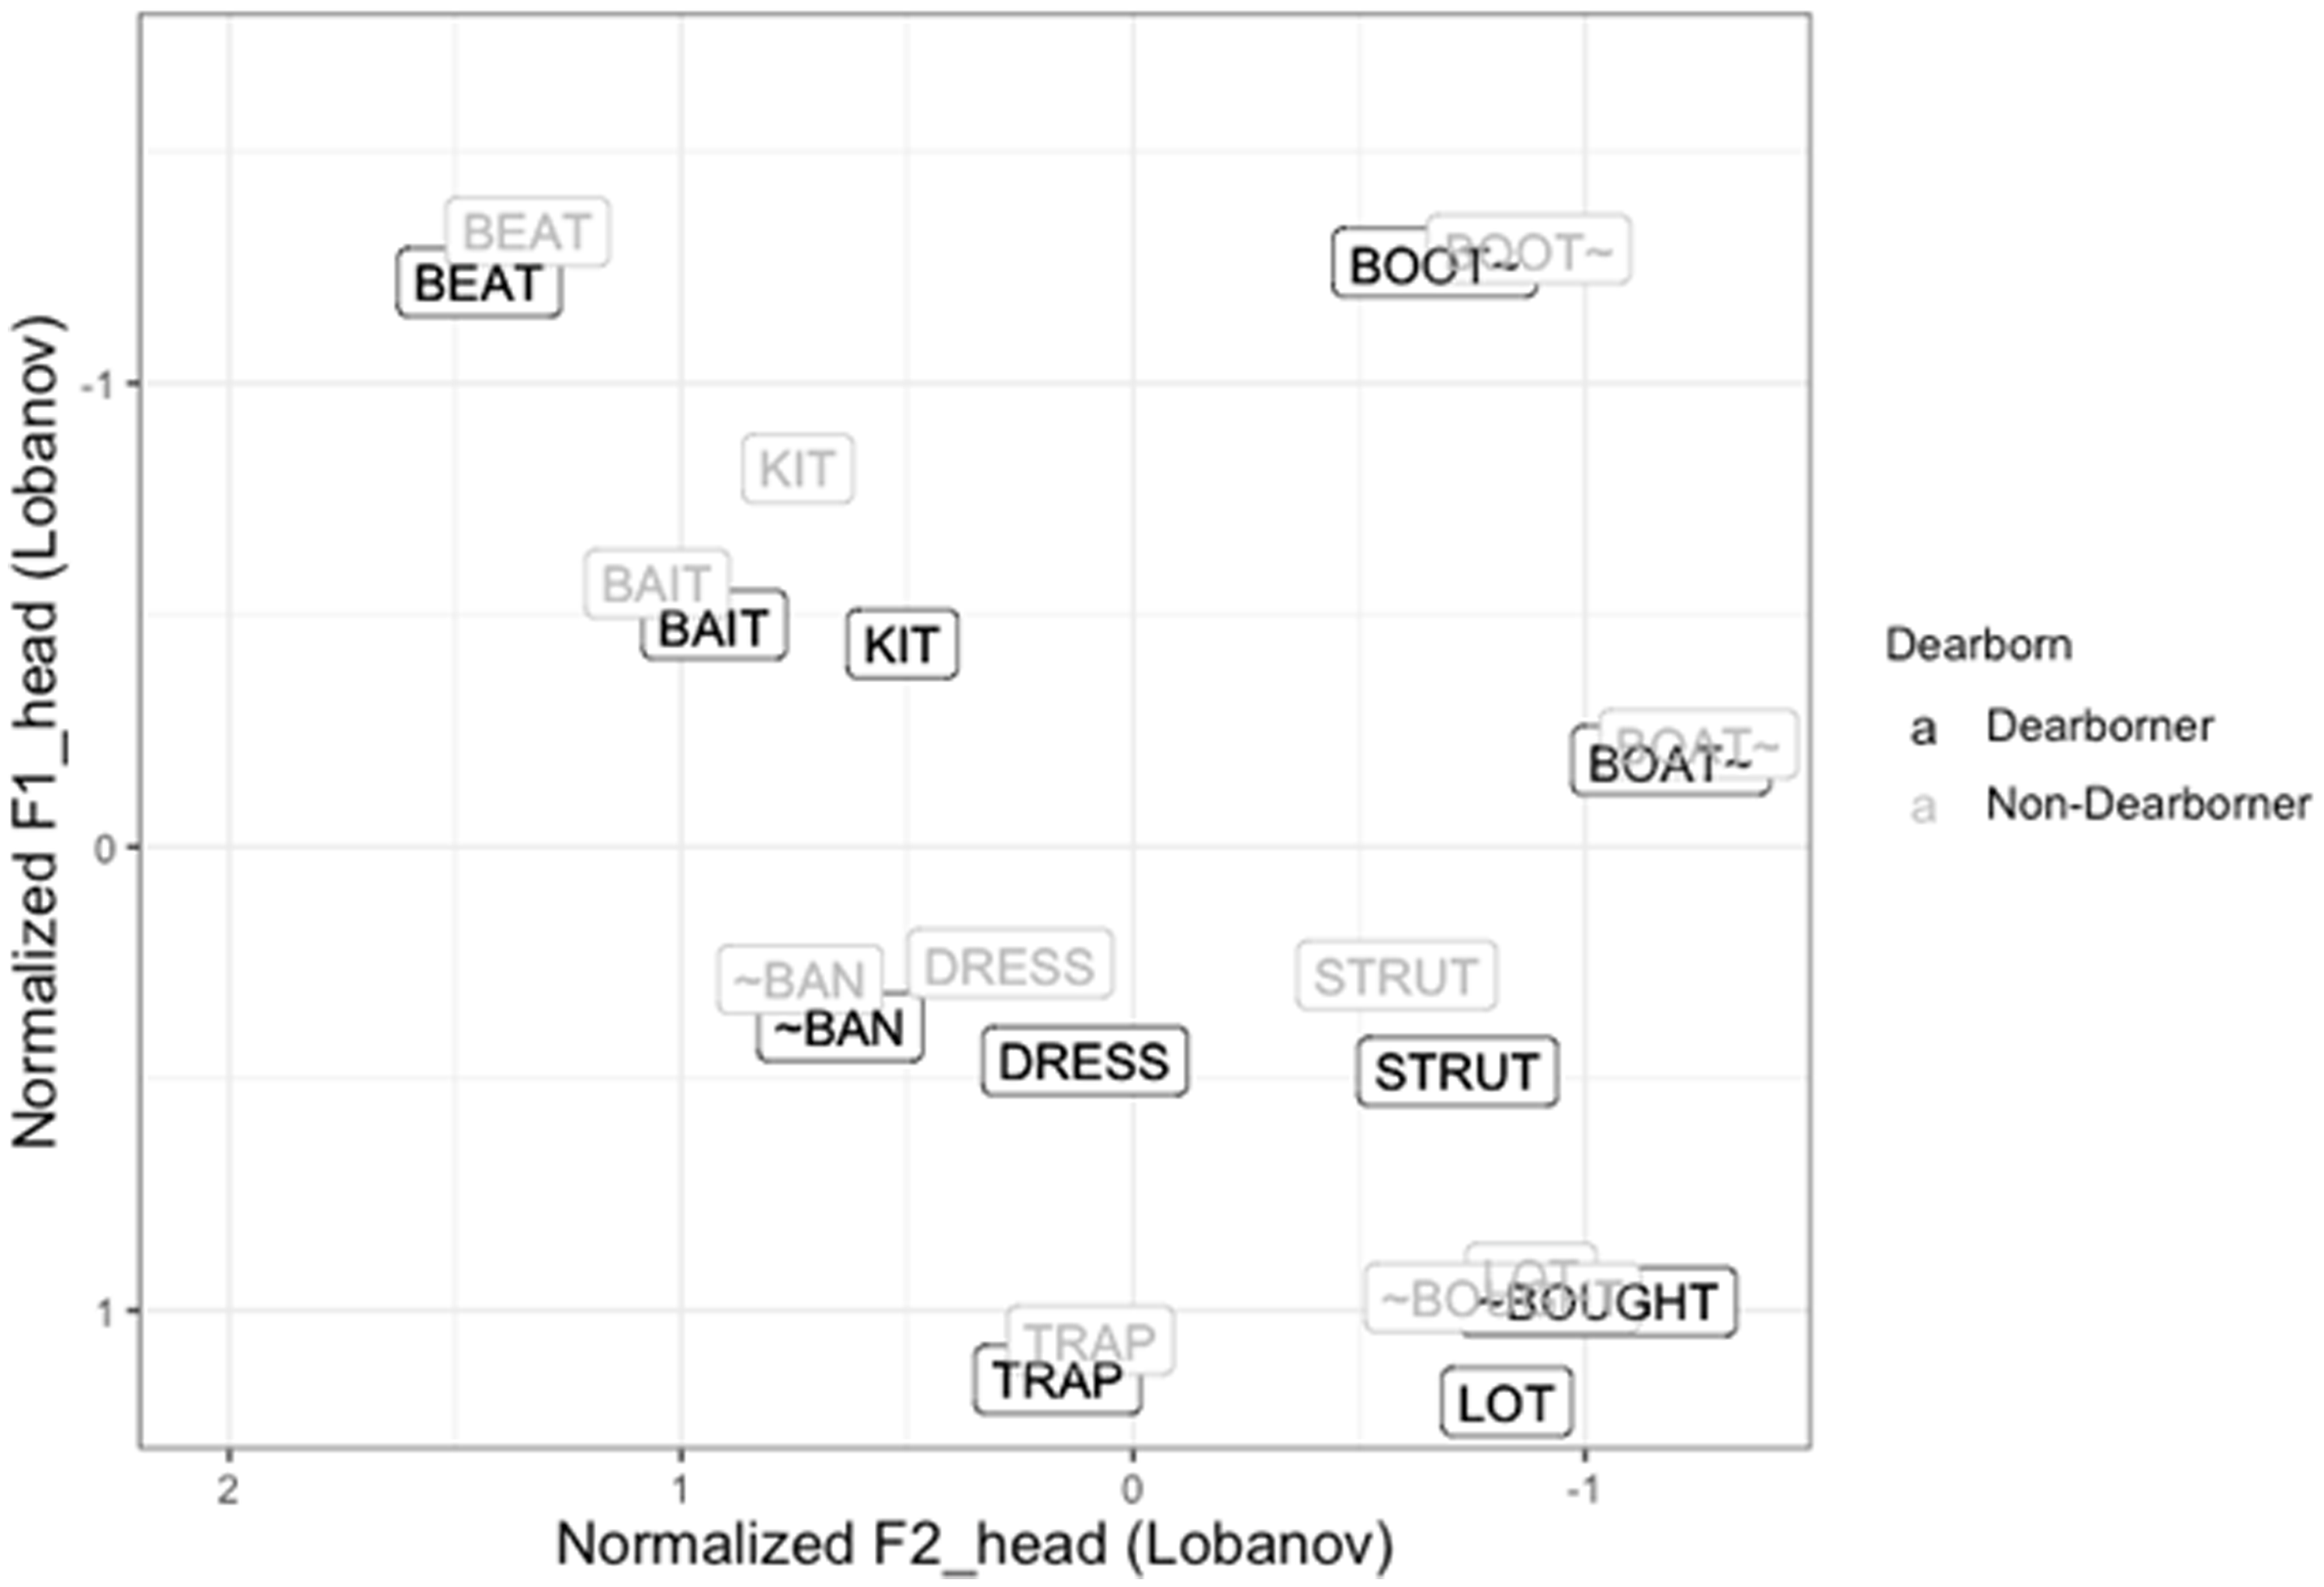
Figure 10 shows that while the vowel spaces of both groups of Dearborners are very similar, the vowel space of the male speakers does not show a trap nasal split. At the same time, the male speakers’ vowel space also reveals differences from two of the most advanced features of the NCS: the trap vowel class (including both pre-nasal and pre-oral) is neither raised nor fronted and lot is not fronted (although both dress and strut are retracted).Footnote 4 The close distribution of ~ban, trap, lot, and ~bought vowels in the male Dearborners’ vowel space can also suggest substrate influence from Arabic, which is usually described as a six-vowel system with tense/lax distinctions.Footnote 5 Another important difference between the two vowel spaces in Figure 10 is the Euclidean distances between the head and the tail of monophthongal vowels. It can be observed, generally, that male speakers’ vowels have shorter Euclidean distances. As such, I continue the analysis of vowels comparing the two groups of Dearborners by focusing first on the trap nasal split and low back vowels, then on select F1 and F2 comparisons, and finally on the Euclidean distances of certain vowels.
Dearborners’ vowel spaces across binary genders.
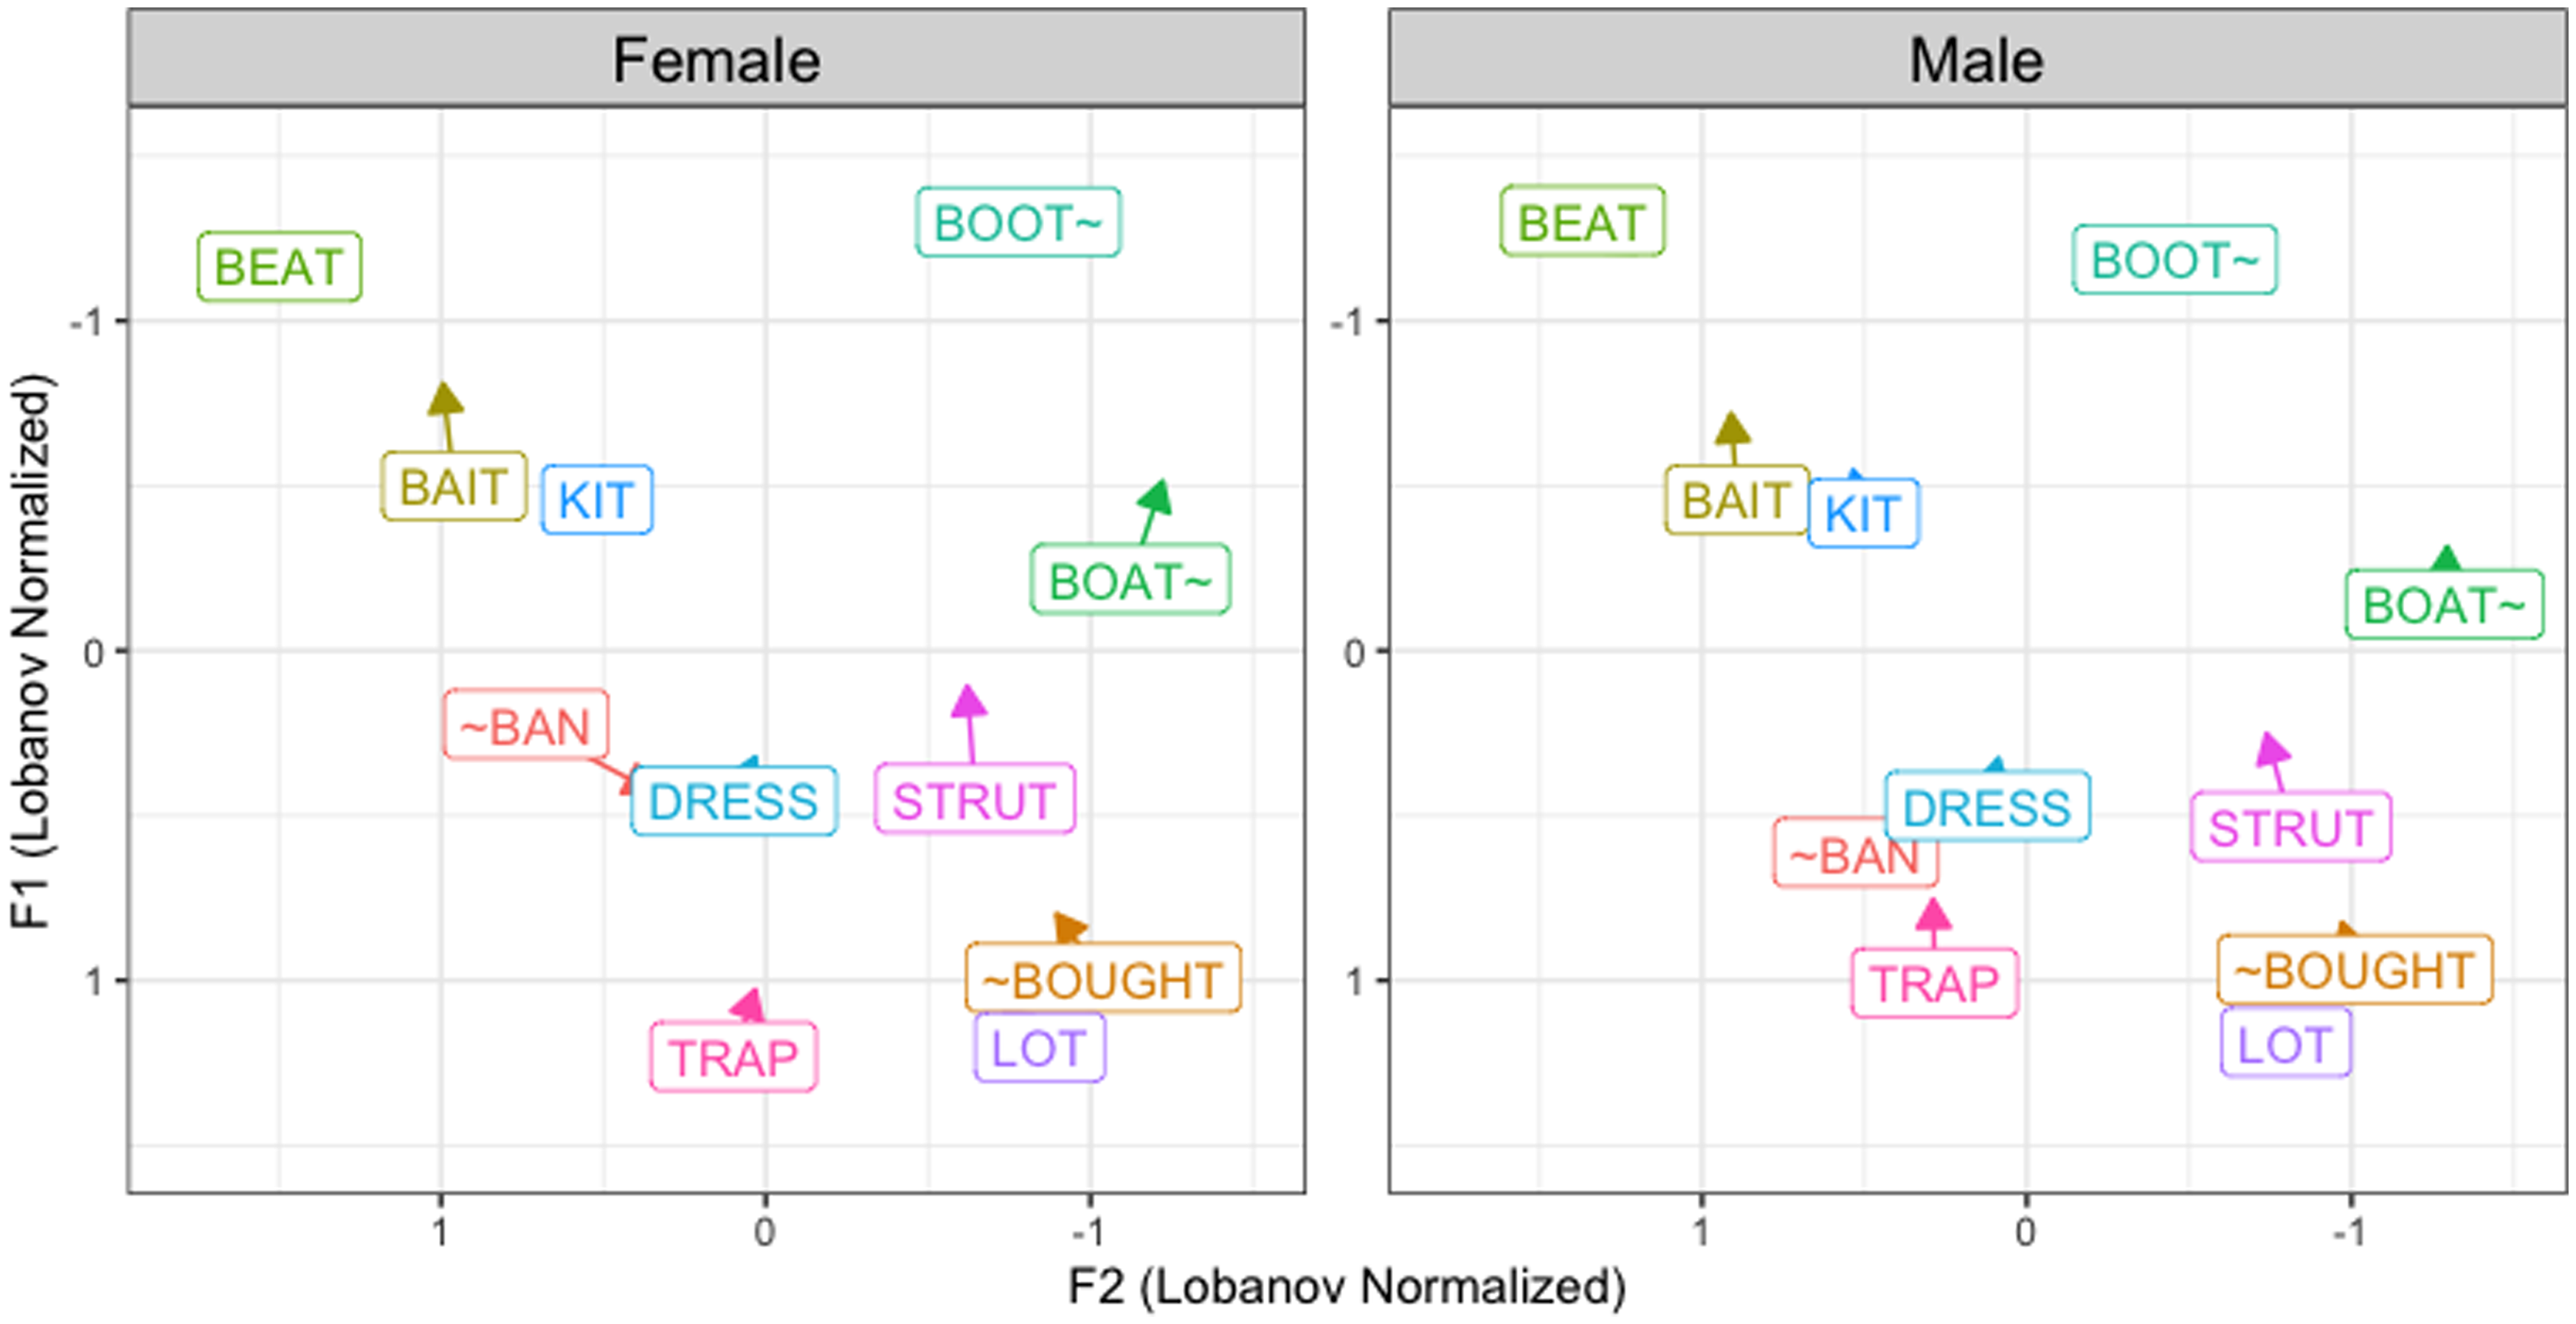
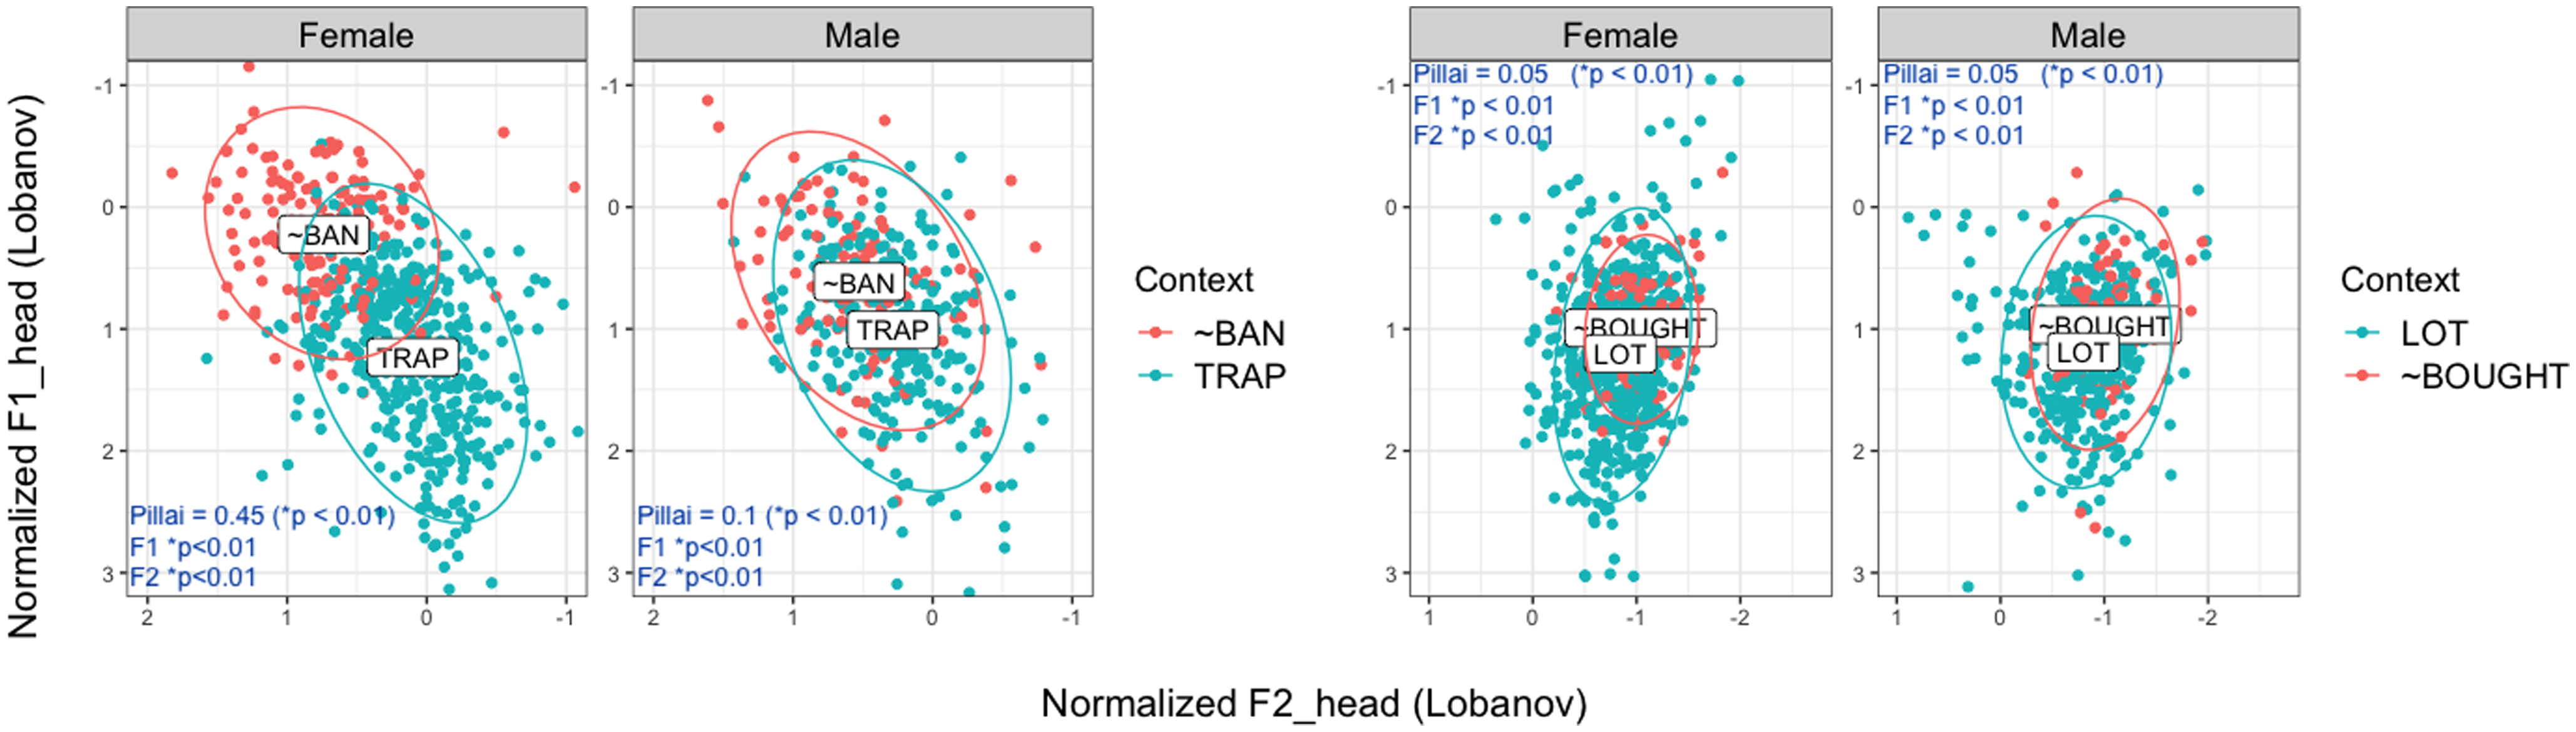
Figure 11 illustrates the distinction between the pre-nasal and pre-oral trap vowels (shown as “~ban” and “trap” in the figure) and the two low back vowels of lot and ~bought both in height (F1) and backness (F2) for both groups of Dearborners. The figure shows that although trap and ~ban are significantly different from each other both in F1 and F2 (according to t-test results) for both groups of Dearborners, the distance is bigger for female speakers. The Pillai score is much greater for females compared to male speakers; the Pillai score (Nycz & Hall-Lew, Reference Nycz and Hall-Lew2013) is a score from 0 to 1, where 0 indicates complete merger and 1 indicates complete separation. Figure 11 also shows that the low back vowels are converging for both groups, with Pillai scores of 0.05, while they are significantly different from each other both in F1 and F2—again, more consistent in this case with Preston’s (Reference Preston2014) analysis of avoiding asymmetry in a diffused vowel system than the LBMS pattern.
Comparison of pre-nasal and pre-oral trap subclasses (left) and low back vowels (right) in height (F1) and backness (F2) with ellipses alongside Pillai scores across binary genders among Dearborn speakers.
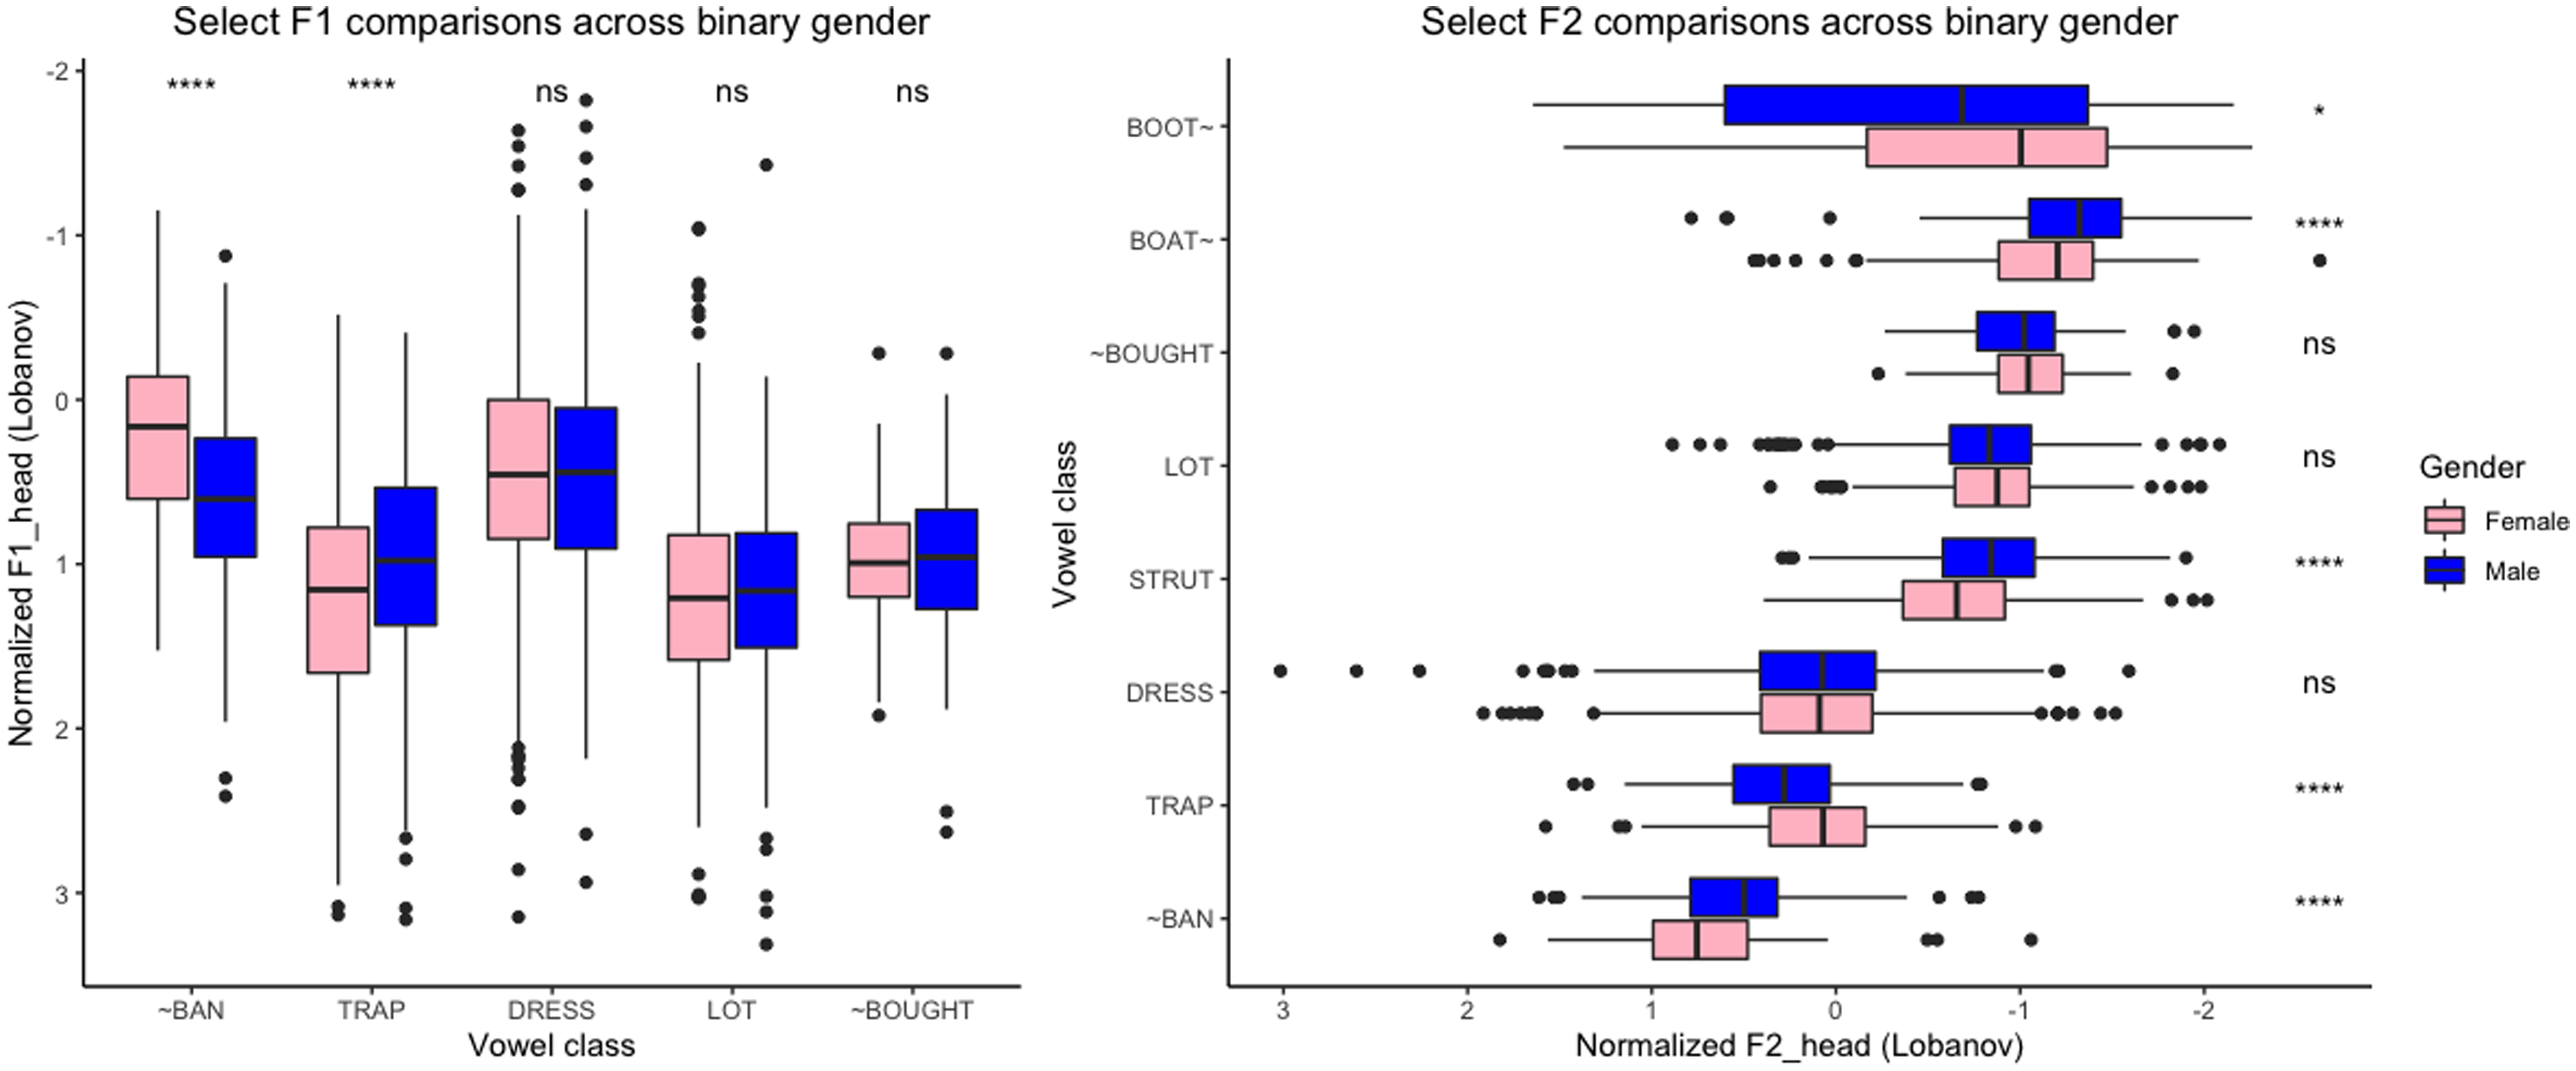
In Figure 12, I compare the height and backness of certain vowels, including the pre-nasal and pre-oral trap subclasses and the low back vowels, across binary genders among Dearborn speakers. The figure clearly shows that the pre-nasal trap subclass (“~ban”) is significantly more raised and fronted for female speakers compared to male speakers. The pre-oral trap subclass (“trap” in the figure) is also significantly more retracted and lowered for female speakers. Additionally, strut and boat~ are significantly more fronted for female speakers while boot~ is significantly more fronted for male speakers. In summary, these results indicate that while the speech of both groups shows convergence (but not merger) of low back vowels, female speakers are leading in the trap nasal split and strut and boat~ fronting, with male speakers slightly leading in boot~ fronting.
Select F1 (left: lower on the y-axis = lower in the mouth) and F2 (right: left on the x-axis = fronter in the mouth) across binary genders among Dearborn speakers alongside t-test p-values (****, 0.0001; *** < 0.001; ** < 0.01).
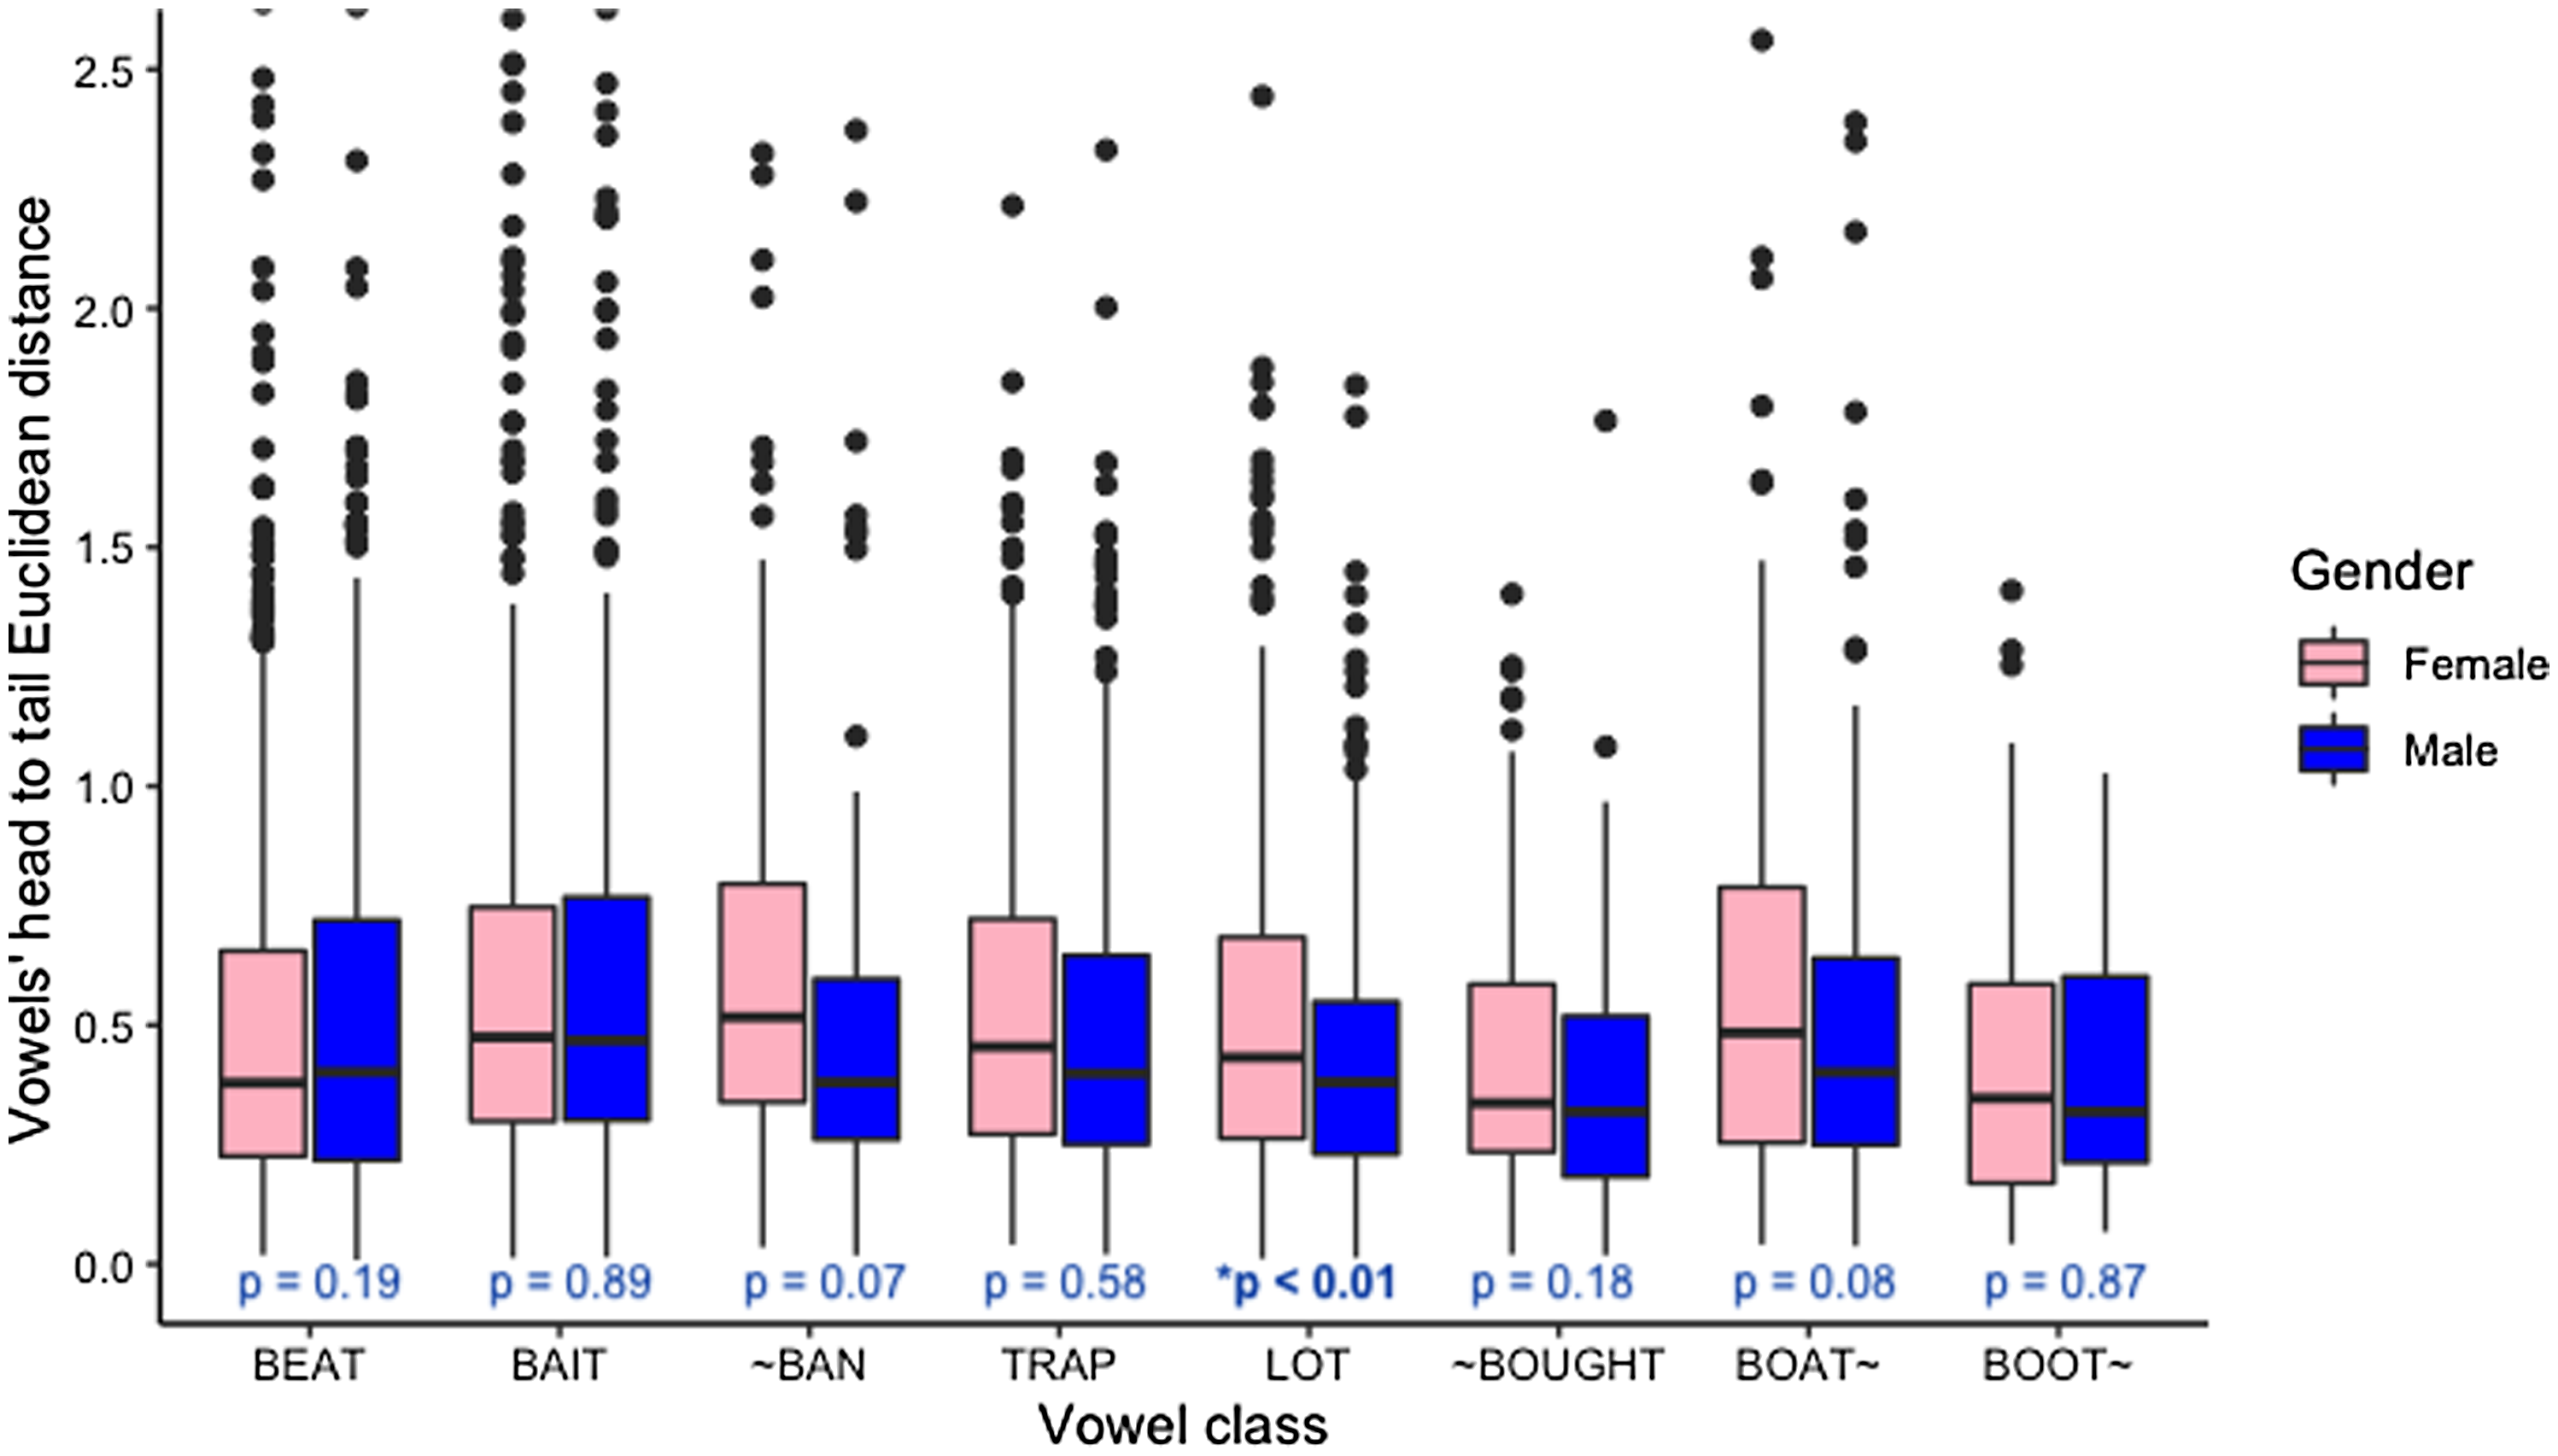
In Figure 13, I compare the Euclidean distances from head to tail of peripheral vowels, including low vowels of lot and trap (both pre-nasal and pre-oral subclasses shown as “~ban” and “trap” respectively in the figure), across binary genders among Dearborn speakers. The figure shows that male Dearborn speakers’ monophthongal peripheral vowels generally have shorter Euclidean distances compared to their female counterparts. Only for the beat vowel (male speakers’ mean = 0.61, female speakers’ mean = 0.55, with the difference not being significantly different) does the speech of male Dearborners show longer Euclidean distances. All other vowels have shorter Euclidean distances for male Dearborners compared to female Dearborners, although only for the lot vowel is the difference statistically significant, and the difference approaches significance for the ~ban and boat~ vowels. These results generally show that the male Dearborners’ monophthongs sound less diphthongal than those of female Dearborners.
Comparison of head to tail Euclidean distances for peripheral vowels including low vowels of lot and trap (both pre-oral and pre-nasal) across binary genders among Dearborn speakers, alongside p-values.
5. Discussion and conclusion
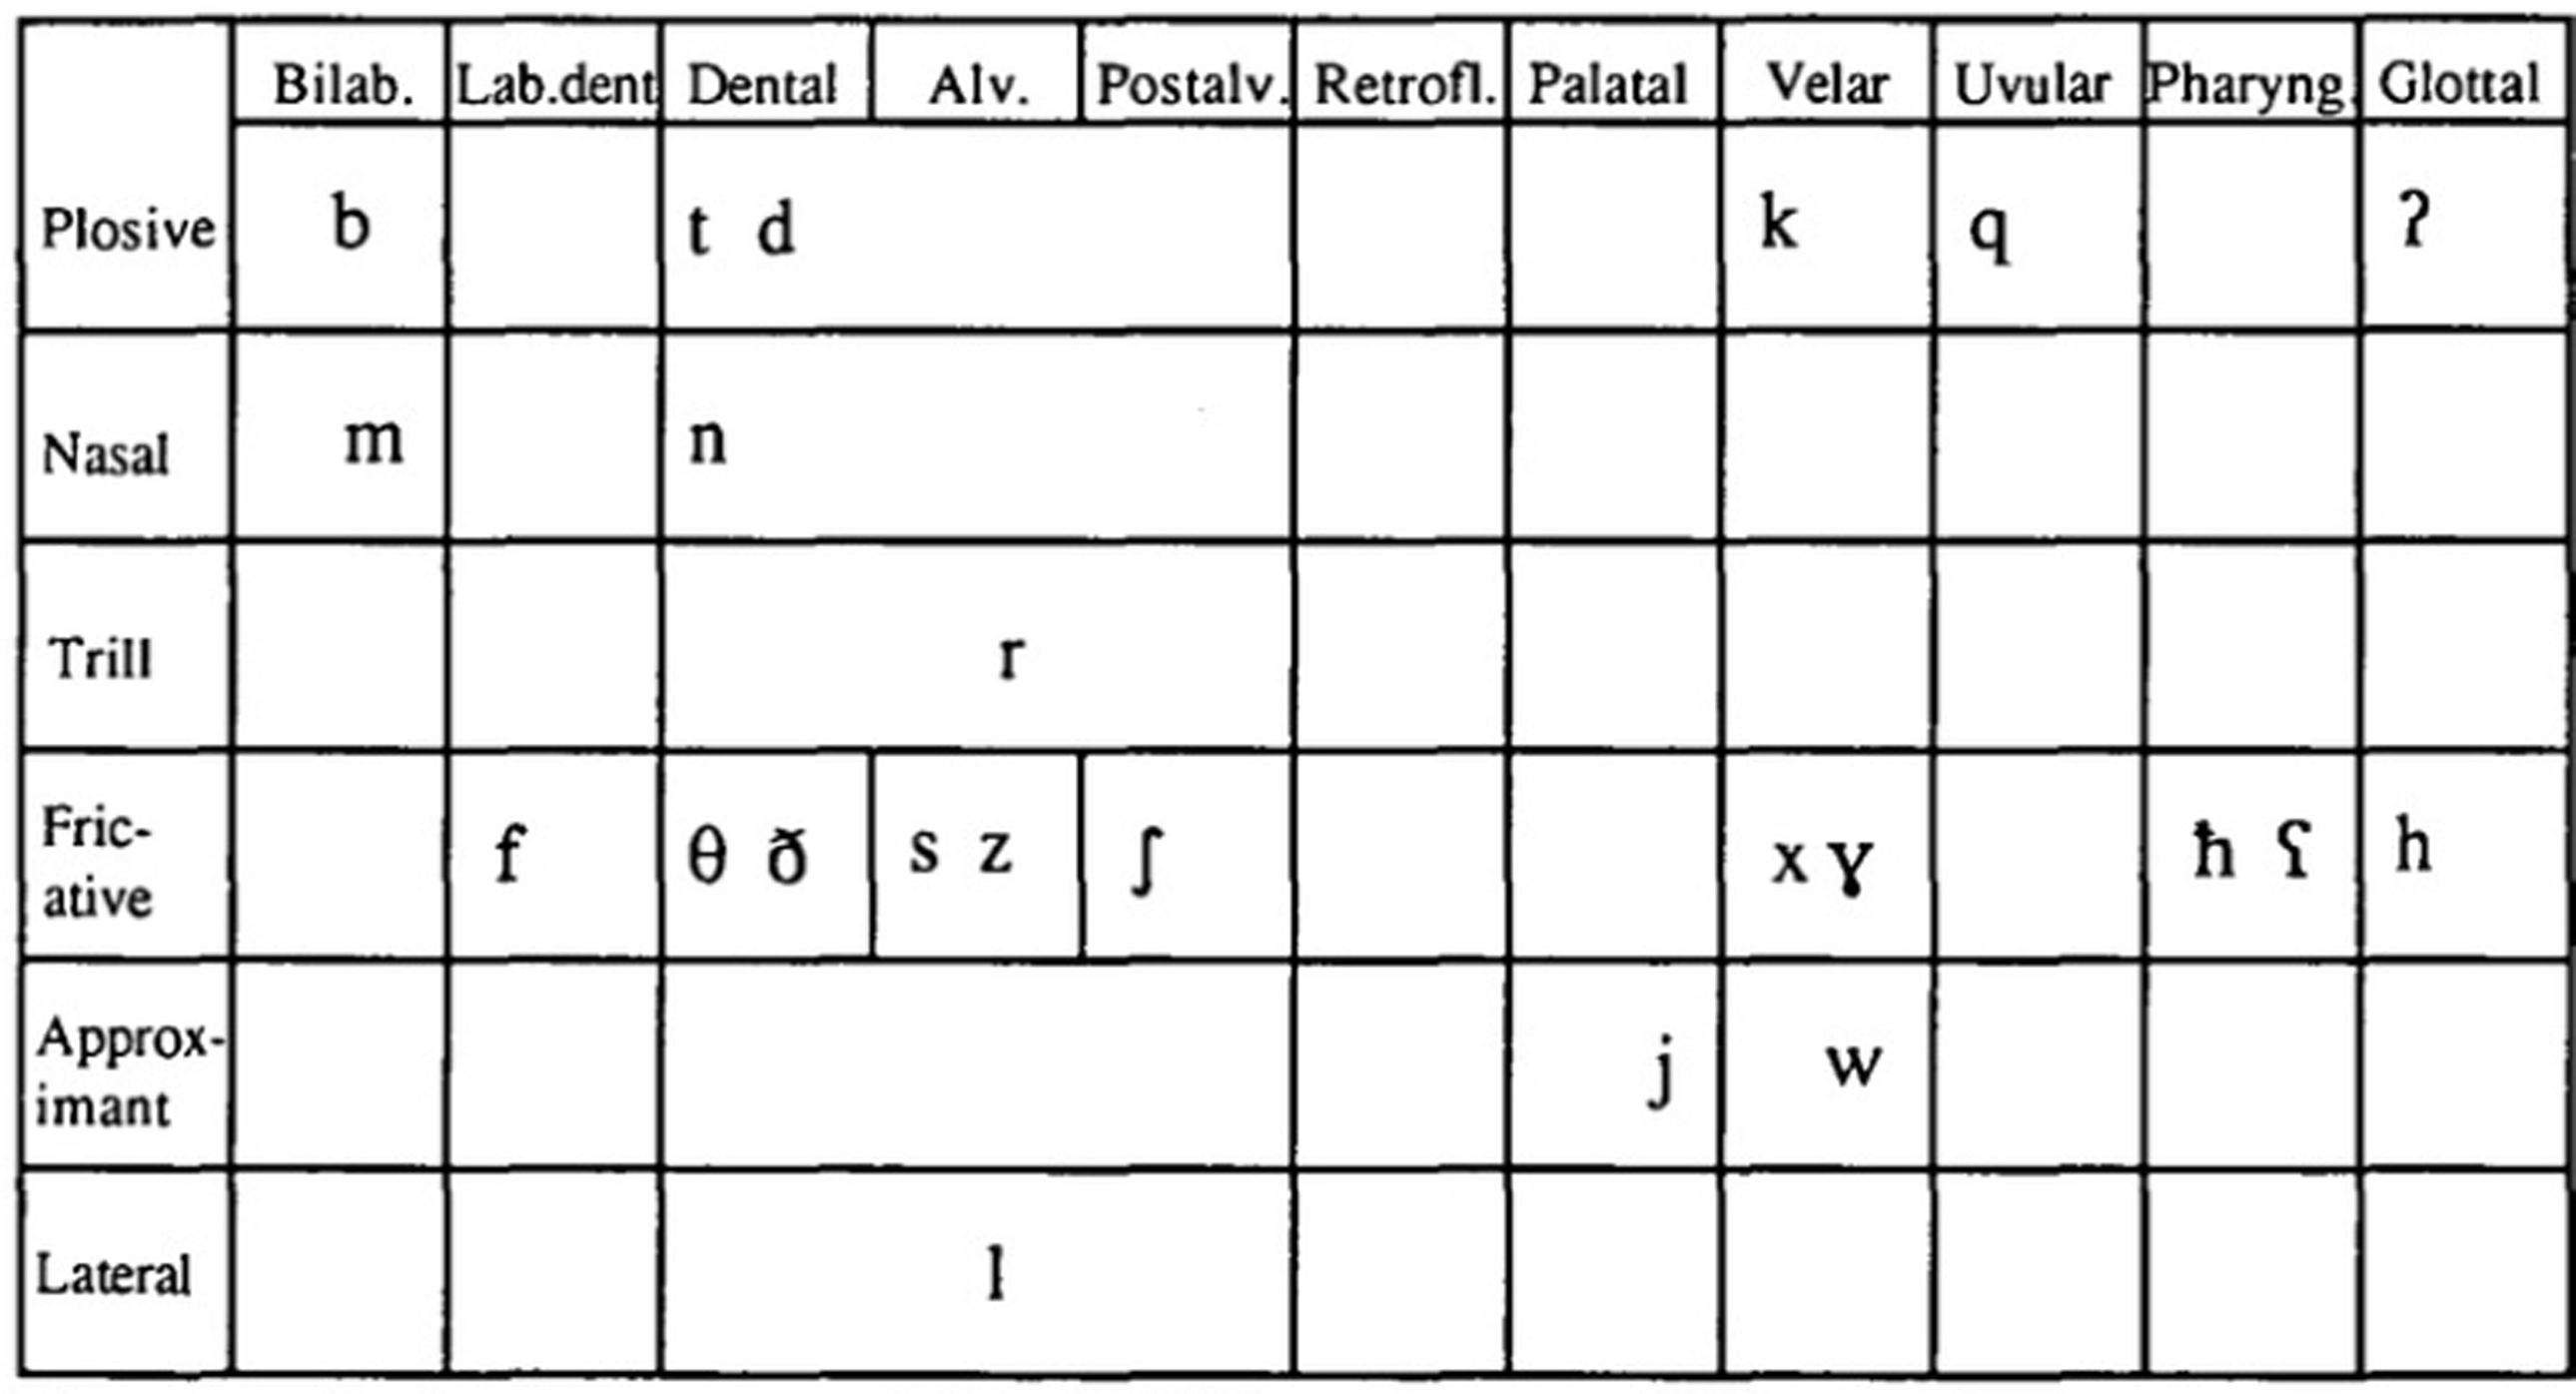
The present paper is a contribution to the emerging literature on the variety of US English spoken in Dearborn, MI. Regular contact among a community of speakers forms specific ways of speaking (Milroy, Reference Milroy1987), settlement patterns can explain formation of certain language varieties (Wolfram & Schilling, Reference Wolfram and Schilling2015:28), and close contact within a community and isolation from other communities can lead to the formation of distinct linguistic varieties (Harrington et al., Reference Harrington, Gubian, Stevens and Schiel2019). Anthropological work with the Arab Detroit community shows that MENA Americans in Dearborn are “highly visible” (Shryock & Lin, Reference Shryock, Chih Lin and Baker2009:58) compared to their counterparts in other parts of the region (such as Sterling Heights, MI, which is less than 30 miles away). This visibility is part of the community as a whole, and includes important community centers—such as the Arab Community Center for Economic and Social Services (ACCESS) and the Arab American National Museum—and the linguistic landscape of the community: a short drive down Warren Avenue in Dearborn features Arab markets and numerous storefronts with Arabic signs. This high visibility, which is the result of the settlement patterns by MENA Americans in the region (with a high concentration of Muslims in Dearborn and Christians in Sterling Heights, for example), can invite different linguistic behaviors on the part of community members. MENA Americans in general are an under-studied speech community; nevertheless, recent ethnographic evidence (Sheydaei, Reference Sheydaei2021) has shown that MENA Americans collectively do not consider themselves a linguistically visible speech community. MENA Americans of Dearborn, MI, however, described their American English variety as distinctive, with its own lexical and phonological features (Sheydaei, Reference Sheydaei2021). Informed by metalinguistic commentary by the speakers in this study, I took a bottom-up approach in identifying certain phonological features of Dearborn English. Glottalization and frication of postvocalic word-final /t/ and /k/, and short voice onset time (VOT) durations for prevocalic word-initial /p/ were the consonantal features that caught my attention during the Sociolinguistic Interviews. I started with the analysis of the VOT distributions because that analysis provided interesting findings that could inform the analysis of not only other consonantal features, but also vowel patterns. While VOT distributions were significantly different between Dearborn speakers and non-Dearborn speakers only for the /k/ sound, the metalinguistic commentary of the participants about the masculinity associations of Dearborn English indicated that there could be differences among Dearborn speakers in terms of speech patterns and their intersections with binary genders. Comparing the VOT distributions across the two groups of female and male Dearborners showed that male speakers had significantly shorter VOTs for the fortis stop /p/ and significantly longer VOTs for lenis stops /b/, /g/, and /d/ compared to female speakers. Although there are numerous dialects of Arabic, by referring to the consonantal repertoire of Al-Shaam (or Levant) dialect from Thelwall & Sa’Adeddin’s (Reference Thelwall and Sa’Adeddin1999) IPA illustration, I argue that the VOT distribution pattern of male Dearborners for the velar and bilabial stops could be an ethno-local marker.
Figure 14 shows that at least in the Al-Shaam dialect, the velar fortis stop does not have a lenis counterpart, and the bilabial lenis stop does not have a fortis counterpart. The VOT patterns of male Dearborners showed a convergence between the lenis and fortis members both in the velar and bilabial sets. I argue here that this convergence is an ethno-local marker for Dearborn speakers specifically and part of an ethnolinguistic repertoire for MENA Americans in general.
Arabic consonants, reproduced from Thelwall & Sa’Adeddin’s (Reference Thelwall and Sa’Adeddin1999) IPA illustration.
My analysis of /k/ frication and /t/ glottalization showed that while there were no significant differences in terms of /k/ frication between Dearborners and non-Dearborners, Dearborn speakers had a significantly higher rate of /t/ glottalization than non-Dearborn speakers. Within the Dearborn speaker group, male speakers had significantly higher rates of /k/ frication and /t/ glottalization than their female counterparts. The glottalization of oral stops is a well-documented form of lenition (e.g. Byrd, Reference Byrd1994; Eddington & Taylor, Reference Eddington and Taylor2009; Eddington & Channer, Reference Eddington and Channer2010; Eddington & Brown, Reference Eddington and Brown2020) which has recently received increasing attention as a feature of both local and ethnic varieties of American English; see e.g. Roberts (Reference Roberts2006) for /t/ glottalization in Vermont English, Farrington (Reference Farrington2020) for /d/ glottalization by DC African American Language speakers, and Holmstrom (Reference Holmstrom2021) for /t/ glottalization in Wisconsin English. In terms of the intersection of dialect regions in the USA and glottalized stops, Eddington & Taylor (Reference Eddington and Taylor2009:298) cite Robinson’s (Reference Robinson2009) assertion that /t/ glottalization is not “a feature of any US accent.” Similarly, in a more recent study, Eddington & Brown (Reference Eddington and Brown2020) found no specific regional distribution for prevocalic word-final /t/ glottalization; however, the results of a perceptual task in their study indicated that /t/ glottalization in this context can index covert prestige (i.e. less educated, less friendly, and younger). In terms of the social meaning of word-final alveolar stop glottalization, Farrington (Reference Farrington2020) also showed that glottal replaced stops were on the rise, led by young working-class female speakers of AAL in DC, focusing on word-final /d/ glottalization. Therefore, I argue that /t/ glottalization in the speech of Dearborn speakers is an ethno-local marker not in the traditional dialectology sense, but in the sense that the specific locality of Dearborn is intertwined with the “highly visible” zone 2 of the Arab Detroit community (Shryock & Lin, Reference Shryock, Chih Lin and Baker2009:58). And in terms of the social meaning of this particular phonetic feature of Dearborn English, I argue that the covert prestige that goes with /t/ glottalization is closely related to this high visibility in the particular local context of southeastern Michigan. In other words, /t/ glottalization could be a covert prestige marker for Dearborners who are a “highly visible” ethno-religious minority in southeastern Michigan. Consistent with the findings in the present study, recent sociolinguistic work in the Middle East has also shown associations between masculinity and higher rates of using covert prestige markers (see e.g. Habib, Reference Habib2010, Reference Habib2016).
The divide between the two groups of Dearborn speakers in terms of binary genders and its intersection with speech patterns also had interesting implications for the vowel analysis in the present paper. A host of recent studies shows that the NCS vowel features are receding in the Upper Midwest in favor of features more consistent with the LBMS (e.g. Driscoll & Lape, Reference Driscoll and Lape2015; D’Onofrio & Benheim, Reference D’Onofrio and Benheim2019; Nesbitt, Reference Nesbitt2018, Reference Nesbitt2021; Zheng, Reference Zheng2018; D’Onofrio, Reference D’Onofrio2021), and the present study showed that while the vowel pattern of Dearborners does not feature a complete merger of the low back vowels, it generally avoids certain NCS features such as lot fronting or the raising and fronting of trap. Male Dearborners’ vowel pattern, in particular, avoided trap raising and fronting and did not feature a strong nasal split of the trap vowel. Meanwhile, as mentioned above, although Dearborn speakers’ lot and ~bought were converging, they were still significantly different in both F1 and F2. Additionally, the Euclidean distances of male Dearborners’ vowels were generally shorter than those of female Dearborners’ vowels. Therefore, I argue that male Dearborners’ vowel pattern is neither consistent with the stereotypically local pattern of the NCS nor wholly consistent with the newly emerging pan-national pattern of the LBMS. Traditionally, the use of NCS features has been associated with white speakers in the Upper Midwest (e.g. D’Onofrio & Benheim, Reference D’Onofrio and Benheim2020). However, recent studies show that the NCS features are waning in the Upper Midwest in favor of features more consistent with the LBMS (e.g. Driscoll & Lape, Reference Driscoll and Lape2015; Wagner et al., Reference Wagner, Alexander Mason, Pevan and Savage2016; Nesbitt, Reference Nesbitt2018, Reference Nesbitt2021; Zheng, Reference Zheng2018), and some have attributed the reversal of NCS features to de-industrialization in the region (e.g. Nesbitt, Reference Nesbitt2021). Male Dearborners’ speech, however, shows that their vowel pattern is not wholly consistent with this newly emerging pattern in the general area. Substrate influence from the Arabic vowel system and Preston’s (Reference Preston2014) analysis of reformulating diffused NCS tendencies to avoid asymmetry could be alternative explanations for the male Dearborners’ vowel space reported in this study.
To summarize, the present study provided a preliminary analysis of the speech of Dearborn speakers in an attempt to document some of the features associated with the English variety spoken by Dearborners. VOT convergence for the lenis and fortis members of velar and bilabial stop sets, post-vocalic word-final /t/ glottalization, higher rates of postvocalic word-final /k/ frication, shorter vowel Euclidean distances, and vowel patterns consistent with neither the NCS nor the pan-national LBMS are some of the features of this variety. However, I do not argue here for the existence or emergence of an ethnolect in Dearborn; instead, I argue for the existence of an ethnolinguistic repertoire (Benor, Reference Benor2010; Burdin, Reference Burdin2020) that includes the consonantal and vowel features listed above. The reasoning behind this argument is the different linguistic behavior of male Dearborners and female Dearborners, and the Dearborners’ metalinguistic commentary about their codeswitching practices and the masculinity and slang associations with Dearborn English. Research on Dearborn English is very young and should be expanded in the future to further document the features of this ethnolinguistic repertoire. Future research can explore not only further consonantal and vowel features, but also prosodic features. Moreover, future work on Dearborn English can explore the speech of microcosms within the Dearborn community such as different sub-ethnic groups, different genders, and the LGBTQ+ community in Dearborn in terms of their use of features associated with the Dearborn ethnolinguistic repertoire.
Acknowledgments
Special thanks to Tom Purnell for his incredibly generous help with this project. I would also like to thank Jacee Cho, Eric Raimy, Joe Salmons, and attendees at the 2020, 2021, and 2022 annual meetings of the Linguistic Society of America. Also, many thanks to the editors of the Journal of Linguistic Geography and the anonymous reviewers whose insightful and inspiring comments significantly improved this work. Finally, I am most thankful to all the participants in this project for sharing their voices and stories with me. All errors are of course my own.
Competing interests
The author declares none.


 Open access