

FFQ may not be useful to detect weak associations between dietary intake and health outcomes( Reference Schatzkin, Subar and Moore 1 , Reference Bingham, Luben and Welch 2 ), since these associations are affected by errors in the exposure assessment. Despite their measurement errors, FFQ are commonly applied in epidemiology, as they are a feasible and cost-effective method. To correct intake–health associations for measurement error we need a correction factor which can be obtained from calibration or validation studies, i.e. the calibration factor or the validity coefficient, respectively( Reference Rosner, Willett and Spiegelman 3 , Reference Spiegelman, McDermott and Rosner 4 ). The calibration factor can be obtained via linear regression in which the regression of values from a superior method, e.g. a recovery biomarker or a 24 h recall (24hR), v. those of the FFQ is performed. Validation studies evaluate whether e.g. an FFQ measures what it intends to measure. The results can be quantified using a variety of measures, e.g. the mean difference to assess systematic over- or underestimation of intake and the validity coefficient to evaluate the ability to correctly rank individuals according to their intake. The validity coefficient is defined as the correlation between the observed intake and the true (unobservable) intake and can be estimated using the triad design( Reference Kaaks 5 ) with two reference methods, often a biomarker and 24hR or food record.
In general, to obtain valid estimates of the calibration factor or validity coefficient a superior reference method is required. A ‘gold standard’ is a reference method that perfectly measures true intake, is subject only to random error, and allows assessing absolute intakes of nutrients( Reference Jenab, Slimani and Bictash 6 ). If a gold standard biomarker is available, calibration to this biomarker is the preferred method to correct intake–health associations. However, in practice only doubly labelled water as a marker of energy intake, and recovery biomarkers including protein, K and Na in urine, qualify as a gold standard.
Alternatively, intakes estimated by FFQ can be compared with intakes based on 24hR, a so-called ‘alloyed’ (imperfect) gold standard. However, the assumption of independent errors does not hold for FFQ and 24hR or food records. Correlated errors between self-report instruments occur in the presence of person-specific bias, an error that is systematic within subjects but varies randomly between them. Furthermore, using the validity coefficient to correct, i.e. de-attenuate, biased intake–health associations is possible only under the assumption that intake-related bias, error that depends on the level of true intake, is absent. Kipnis et al.( Reference Kipnis, Subar and Midthune 7 ) showed both intake-related bias and strong correlations between the errors of FFQ and 24hR for protein and energy intakes in a US population.
In the present paper, we illustrate the impact of intake-related bias in FFQ and reference method (24hR), and of correlated errors between FFQ and reference method (24hR), on corrected intake–health associations. We compare four scenarios to correct these associations for errors in an FFQ estimating protein and K intakes in a Dutch population aged 45–65 years. As superior reference methods we used a duplicate recovery biomarker as a gold standard, two 24hR as an alloyed gold standard, or a combination of the two in a triad design.
Experimental methods
Participants
Participants (n 122) were healthy, aged 45–65 years, representing all educational levels and recruited by convenience sampling. They were able to read and speak the Dutch language, were not following a prescribed dietary therapy, were not pregnant or lactating, and were not enrolled in another study. We did not allow into the study those who were donating blood or plasma during or less than 4 weeks before the study, institutionalized persons or more than one member per household. Written informed consent was obtained from all participants.
The European Food Consumption Validation study
We used data from 24hR and biomarkers of the Dutch participants of the European Food Consumption Validation (EFCOVAL) study, which evaluated the validity of intakes from two non-consecutive standardized 24hR in five European centres( Reference Crispim, de Vries and Geelen 8 ). Detailed methods have been described before( Reference Crispim, de Vries and Geelen 8 , Reference Siebelink, Geelen and de Vries 9 ). We collected two 24hR, one by telephone and one face-to-face, with at least 1 month in between, using EPIC-Soft software( 10 , Reference Subar, Thompson and Smith 11 ). They covered all days of the week. Portion size estimation was done using household measures, weight/volume, standard units and portions, bread shapes and photographs. Energy and nutrient intakes were calculated using the Dutch food composition table( 12 ).
Urinary N and urinary K were estimated from two 24 h urine samples collected during the same days as the 24hR. Urine samples with p-aminobenzoic acid (PABA) recoveries <50 % were assumed incomplete and excluded from the data analysis. Specimens containing 50–85 % of PABA recovery had their urinary concentrations proportionally adjusted to 93 % of PABA recovery. Urinary protein was calculated as [6.25 × (urinary N/0.81)]( Reference Crispim, Geelen and Souverein 13 , Reference Slimani, Deharveng and Charrondiere 14 ) and urinary K was estimated by dividing the measured value by 0·77( Reference Slimani, Ferrari and Ocke 15 , Reference Bingham 16 ).
In addition to the EFCOVAL study protocol, the 122 Dutch participants filled out an FFQ at the end of the validation study period.
The study was conducted according to the guidelines laid down in the Declaration of Helsinki and all procedures were approved by the Medical Ethical Committee of Wageningen University.
The FFQ
The 180-item semi-quantitative FFQ was designed to assess intakes of energy, macronutrients, dietary fibre and selected vitamins during the past month( Reference Bingham and Cummings 17 ). The participants filled out the FFQ and sent it to the study centre. Trained dietitians checked whether it was filled out properly, and if necessary additional information about unusual or missing reports was obtained by telephone. The FFQ was developed by selecting foods from the Dutch National Food Consumption Survey( Reference Holbrook, Patterson and Bodner 18 ) which contributed >0·5 % to the intakes of total fat, fatty acids and cholesterol, and covered at least 90 % of energy intake. Furthermore, questions were added to enable assessment of dietary fibre and specific micronutrients. Also, foods were added to achieve face validity. Assessment of consumption frequency used seven categories ranging from ‘never’ to ‘six or seven days per week’. The questions were asked according to a nested approach( Reference Tasevska, Runswick and Bingham 19 ). Average daily nutrient intakes were calculated by multiplying frequency of consumption of food items by portion size and nutrient content per gram based on the 2006 Dutch food composition table( 12 ).
Calibration and de-attenuation
Intake–health associations can be completely or partly corrected for FFQ measurement error using a correction factor based on a calibration or de-attenuation approach. Calibration involves performing the regression of the superior reference method v. the FFQ and results in the calibration factor (i.e. the regression coefficient b RefQ)( Reference Rosner, Willett and Spiegelman 3 , Reference Spiegelman, McDermott and Rosner 4 ).
We use the following subscripts: M, mean of duplicate recovery biomarkers; Q, FFQ; R, mean of duplicate 24hR; T, subjects' unknown ‘true’ habitual intake; Ref, reference method.
We here define de-attenuation as correction of the association for random errors in the FFQ; while dependent on the reference method, also person-specific bias will be accounted for. The observed intake–health association can be de-attenuated using the square of the validity coefficient
 $$--><$>r_{{{\rm{QT}}}}^{2} $$$
and results in a corrected association under the assumption that intake-related bias is not present.
$$--><$>r_{{{\rm{QT}}}}^{2} $$$
and results in a corrected association under the assumption that intake-related bias is not present.
In the case that the association is quantified by a regression coefficient (b observed), the corrections to b true are, based on calibration or de-attenuation respectively, as follows:
 $${{b}_{{\rm{true}}}}\, = \,\frac{{{{b}_{{\rm{observed}}}}}}{{{{b}_{{\rm{RefQ}}}}}}\; \; {\rm{or}}\; \; {{b}_{{\rm{true}}}}\, = \,\frac{{{{b}_{{\rm{observed}}}}}}{{r_{{{\rm{QT}}}}^{{\rm{2}}} }}.\eqno\rm$$
In the case that the association is quantified by a relative risk (RR; or an odds ratio), the regression coefficients estimate ln(RR) and therefore:
 $${\rm{R}}{{{\rm{R}}}_{{\rm{true}}}}\, = \,{{({\rm{R}}{{{\rm{R}}}_{{\rm{observed}}}})}^{{\rm{1/}}{{b}_{{\rm Re}{\rm{fQ}}}}}} \; \; {\rm{or}}\; \; {\rm{R}}{{{\rm{R}}}_{{\rm{true}}}}\, = \,{{({\rm{R}}{{{\rm{R}}}_{{\rm{observed}}}})}^{{\rm{1/}}r_{{{\rm{QT}}}}^{{\rm{2}}} }} .\eqno\rm$$
In both cases a lower correction factor means a larger correction of the observed association.
In the present paper we compare estimates of b
RefQ or
 $$--><$>r_{{{\rm{QT}}}}^{{\rm{2}}} $$$
obtained from four scenarios to correct intake–health associations (Table 1). In this way we illustrate the impact of intake-related bias in FFQ and reference method (24hR), and correlated errors between FFQ and reference method (24hR), on intake–health associations. We now describe these four scenarios in terms of the errors that are corrected for.
$$--><$>r_{{{\rm{QT}}}}^{{\rm{2}}} $$$
obtained from four scenarios to correct intake–health associations (Table 1). In this way we illustrate the impact of intake-related bias in FFQ and reference method (24hR), and correlated errors between FFQ and reference method (24hR), on intake–health associations. We now describe these four scenarios in terms of the errors that are corrected for.
Overview of the calibration and de-attenuation scenarios, the formulas used to estimate the correction factors, and the errors still present in the intake–health association after correction for errors in an FFQ for protein and potassium intake

24hR, 24-h recall method.
Symbols: b
0, intercept of the regression equation; b
MQ, calibration factor from performing regression of mean of duplicate recovery biomarkers v. FFQ; b
RQ, calibration factor from performing regression of mean of duplicate 24hR v. FFQ; e, residual value; ICC, intra-class correlation coefficient; k, number of replicates; M, mean of duplicate recovery biomarkers; Q, FFQ; R, mean of duplicate 24hR; r
MQ, correlation between mean of duplicate biomarker measurements and FFQ; r
RQ, correlation between mean of 24hR and FFQ; r
MR, correlation between mean of duplicate biomarker measurements and mean of duplicate 24hR; r
MT, validity coefficient of mean of duplicate biomarker measurements; r
QT, validity coefficient of FFQ;
 $$--><$>\tf="Helv_O" s_ {\tf="Helv_R" b}^{{{\tf="Helv_R" 2}}} $$$
, between-subject variation;
$$--><$>\tf="Helv_O" s_ {\tf="Helv_R" b}^{{{\tf="Helv_R" 2}}} $$$
, between-subject variation;
 $$--><$>{\tf="Helv_O" s}_{\tf="Helv_R" w}^{{{\tf="Helv_R" 2}}} $$$
, within-subject variation; T, unknown ‘true’ habitual intake.
$$--><$>{\tf="Helv_O" s}_{\tf="Helv_R" w}^{{{\tf="Helv_R" 2}}} $$$
, within-subject variation; T, unknown ‘true’ habitual intake.
Scenario 1: Calibration to a gold standard reference method, i.e. (duplicate) recovery biomarker
The calibration factor (b MQ) from performing the regression of the mean of the duplicateFootnote * recovery biomarkers (M) v. the FFQ (Q) is estimated using the regression equation:
 $$M = {{b}_{\rm{0}}} + {{b}_{{\rm{MQ}}}}Q + {{e}_{\rm{M}}}.\eqno\rm$$
In this scenario, correlated errors between FFQ and reference method are assumed to be absent. The corrected intake–health association is assumed to be unbiased as both random error and intake-related bias in the FFQ are taken into account. The correction factors from the three following scenarios will be compared with the one from this scenario as it is assumed to be the best possible estimate.
Scenario 2: De-attenuation using
 $$--><$>{\bi r}_{{{\rm{\bf QT}}}}^{\bf 2} $$$
estimated by means of a gold standard reference method, i.e. duplicate recovery biomarker
$$--><$>{\bi r}_{{{\rm{\bf QT}}}}^{\bf 2} $$$
estimated by means of a gold standard reference method, i.e. duplicate recovery biomarker

The squared validity coefficient of the FFQ (r QT) can be estimated as follows:
 $$r_{{{\rm{QT}}}}^{{\rm{2}}} \, = \,\frac{{r_{{{\rm{MQ}}}}^{{\rm{2}}} }}{{r_{{{\rm{MT}}}}^{{\rm{2}}} }},\eqno\rm$$
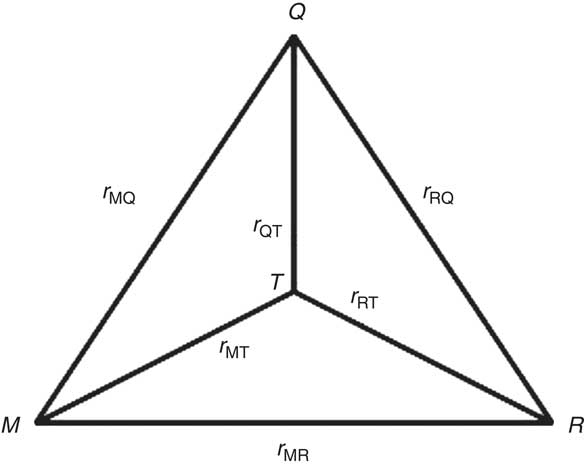
in which r MQ is the correlation between the mean of the duplicate biomarker measurements and the FFQ and r MT is the validity coefficient of the mean of the duplicate biomarker measurements (Fig. 1). Under the assumption of independent errors between the duplicate biomarker measurements( Reference Kaaks, Ferrari and Ciampi 20 ), the intra-class correlation coefficient (ICC) of the duplicate biomarker measurements provides an estimate of the squared validity coefficient:
 $$r_{{{\rm{MT}}}}^{{\rm{2}}} = {\rm{IC}}{{{\rm{C}}}_{\rm{M}}}\, = \,\frac{{s_{{{\rm{b,M}}}}^{{\rm{2}}} }}{{s_{{{\rm{b,M}}}}^{{\rm{2}}} \, + \,s_{{{\rm{w,M}}}}^{{\rm{2}}} /k}}.\eqno\rm$$
The within- (
 $$--><$>s_{{\rm{w}}}^{2} $$$
) and between-subject (
$$--><$>s_{{\rm{w}}}^{2} $$$
) and between-subject (
 $$--><$>s_{{\rm{b}}}^{2} $$$
) variation can be derived using ANOVA, with k = 2 as the mean of two biomarker measurements is used. Correlated errors between FFQ and biomarker are assumed to be absent and intake-related bias in the FFQ is not corrected when using this scenario.
$$--><$>s_{{\rm{b}}}^{2} $$$
) variation can be derived using ANOVA, with k = 2 as the mean of two biomarker measurements is used. Correlated errors between FFQ and biomarker are assumed to be absent and intake-related bias in the FFQ is not corrected when using this scenario.
Schematic representation of the triangular relationship of the correlation coefficients (r MQ, r RQ and r MR) between protein or potassium intake estimated by FFQ (Q), the mean of a duplicate 24 h recall (R) and the mean of a duplicate urinary nitrogen or potassium excretion (M), and the validity coefficients between true dietary intake (T) and the estimated intakes (r QT, r RT and r MT)
Scenario 3: De-attenuation using
$$--><$>{\bi r}_{{{\rm{\bf QT}}}}^{\bf 2} $$$
obtained by the method of triads with duplicate recovery biomarkersFootnote
†
and duplicate 24hR

The squared validity coefficient of the FFQ (
 $$--><$>r_{{{\rm{QT}}}}^{2} $$$
) can be estimated from the correlations between the FFQ, 24hR (R) and biomarker via the method of triads (Fig. 1)(
Reference Kaaks
5
,
Reference Ocke and Kaaks
21
):
$$--><$>r_{{{\rm{QT}}}}^{2} $$$
) can be estimated from the correlations between the FFQ, 24hR (R) and biomarker via the method of triads (Fig. 1)(
Reference Kaaks
5
,
Reference Ocke and Kaaks
21
):
 $$r_{{{\rm{QT}}}}^{{\rm{2}}} \, = \,({{r}_{{\rm{MQ}}}}\,\times {{r}_{{\rm{RQ}}}})/{{r}_{{\rm{MR}}}}.\eqno\rm$$
In this scenario, correlated errors between FFQ and 24hR inflate r RQ and thus r QT, while intake-related bias in the FFQ is not corrected.
Scenario 4: Calibration to a (duplicate) 24hR as an alloyed gold standard
The calibration factor from performing the regression of the mean of the duplicateFootnote * 24hR v. the FFQ is estimated using the regression equation:
 $$R\, = \,{{b}_{\rm{0}}}\, + \,{{b}_{{\rm{RQ}}}}Q\, + \,{{e}_{\rm{R}}}.\eqno\rm$$
In this scenario, intake-related bias in the FFQ is accounted for relative to the intake-related bias in the 24hR. However, correlated errors between FFQ and 24hR can be anticipated, leading to overestimation of b RQ and therefore insufficient correction of the intake–health association.
What now follows is the justification and evaluation of the scenarios based on measurement error models that describe the relationship between measured intakes as a function of the unknown true long-term intake T. The usual measurement error model for Q, applied in all four scenarios, is:
 $$--><$>Q = {{\alpha }_{{{{\rm{0}}}_{\rm{Q}}}}}\, + \,{{\alpha }_{{{{\rm{1}}}_{{\rm{QT}}}}}}T\, + \,q\, + \,{{{\epsilon}}_{\rm Q}}, $$$
with
$$--><$>Q = {{\alpha }_{{{{\rm{0}}}_{\rm{Q}}}}}\, + \,{{\alpha }_{{{{\rm{1}}}_{{\rm{QT}}}}}}T\, + \,q\, + \,{{{\epsilon}}_{\rm Q}}, $$$
with
 $$--><$>{{\alpha }_{{{{\rm{0}}}_{\rm{Q}}}}} $$$
indicating a systematic error which is ignored hereafter as the present paper focuses on assessing associations,
$$--><$>{{\alpha }_{{{{\rm{0}}}_{\rm{Q}}}}} $$$
indicating a systematic error which is ignored hereafter as the present paper focuses on assessing associations,
 $$--><$>{{\alpha }_{{{{\rm{1}}}_{{\rm{QT}}}}}} \ne {\rm{1}} $$$
indicating intake-related bias, and εQ being the truly random error in the assessment. The term q is the person-specific bias(
Reference Kipnis, Subar and Midthune
7
) that varies randomly between persons. This error is considered independent of random error in measurements of gold standard recovery markers or concentration markers, but it may introduce correlated errors between FFQ and 24hR as a reference.
$$--><$>{{\alpha }_{{{{\rm{1}}}_{{\rm{QT}}}}}} \ne {\rm{1}} $$$
indicating intake-related bias, and εQ being the truly random error in the assessment. The term q is the person-specific bias(
Reference Kipnis, Subar and Midthune
7
) that varies randomly between persons. This error is considered independent of random error in measurements of gold standard recovery markers or concentration markers, but it may introduce correlated errors between FFQ and 24hR as a reference.
For protein and K, we assume that the recovery markers urinary N and urinary K can be used as gold standard references. The measurement error model for M is: M = T + ε
M, with symbols defined similarly as before. This measurement error model was used in scenarios 1 and 2. If a reference method fulfils the requirements of a gold standard, it can be derived that
 $$--><$>{{b}_{{\rm{RefQ}}}}\, = \,r_{{{\rm{QT}}}}^{{\rm{2}}} /{{\alpha }_{{{{\rm{1}}}_{{\rm{QT}}}}}} $$$
, illustrating that de-attenuation and calibration yield the same result only if the FFQ is free of intake-related bias (
$$--><$>{{b}_{{\rm{RefQ}}}}\, = \,r_{{{\rm{QT}}}}^{{\rm{2}}} /{{\alpha }_{{{{\rm{1}}}_{{\rm{QT}}}}}} $$$
, illustrating that de-attenuation and calibration yield the same result only if the FFQ is free of intake-related bias (
 $$--><$>{{\alpha }_{{{{\rm{1}}}_{{\rm{QT}}}}}} = {\rm{1}} $$$
). This latter also holds when the triad method (scenario 3) is applied to estimate
$$--><$>{{\alpha }_{{{{\rm{1}}}_{{\rm{QT}}}}}} = {\rm{1}} $$$
). This latter also holds when the triad method (scenario 3) is applied to estimate
 $$--><$>r_{{{\rm{QT}}}}^{{\rm{2}}} $$$
even when using concentration markers. This is true because when using the triad method the measurement error model for M can be relaxed to
$$--><$>r_{{{\rm{QT}}}}^{{\rm{2}}} $$$
even when using concentration markers. This is true because when using the triad method the measurement error model for M can be relaxed to
 $$--><$>M = {{\alpha }_{{{{\rm{0}}}_{\rm{M}}}}} + {{\alpha }_{{{{\rm{1}}}_{{\rm{MT}}}}}}T\, + \,m\, + \,{{{\epsilon}}_{\rm M}} $$$
, although correlated errors between FFQ and 24hR will distort the estimate of
$$--><$>M = {{\alpha }_{{{{\rm{0}}}_{\rm{M}}}}} + {{\alpha }_{{{{\rm{1}}}_{{\rm{MT}}}}}}T\, + \,m\, + \,{{{\epsilon}}_{\rm M}} $$$
, although correlated errors between FFQ and 24hR will distort the estimate of
 $$--><$>r_{{{\rm{QT}}}}^{{\rm{2}}} $$$
.
$$--><$>r_{{{\rm{QT}}}}^{{\rm{2}}} $$$
.
In the case that the 24hR is used as a reference in the triad, a measurement error model similar to Q is assumed:
 $$--><$>R = {{\alpha }_{{{{\rm{0}}}_{\rm{R}}}}} + {{\alpha }_{{{{\rm{1}}}_{{\rm{RT}}}}}}T\, + \,r\, + \,{{{\epsilon}}_{\rm{R}}} $$$
, with symbols similar as before (scenario 3). However, if a 24hR is used as reference method in a calibration approach, a simplified model is often used (scenario 4), as it is assumed that
$$--><$>R = {{\alpha }_{{{{\rm{0}}}_{\rm{R}}}}} + {{\alpha }_{{{{\rm{1}}}_{{\rm{RT}}}}}}T\, + \,r\, + \,{{{\epsilon}}_{\rm{R}}} $$$
, with symbols similar as before (scenario 3). However, if a 24hR is used as reference method in a calibration approach, a simplified model is often used (scenario 4), as it is assumed that
 $$--><$>{{\alpha }_{{{{\rm{0}}}_{\rm{R}}}}} = {\rm{0}} $$$
and also that there is no intake-related bias in the 24hR (
$$--><$>{{\alpha }_{{{{\rm{0}}}_{\rm{R}}}}} = {\rm{0}} $$$
and also that there is no intake-related bias in the 24hR (
 $$--><$>{{\alpha }_{{{{\rm{1}}}_{{\rm{RT}}}}}} = {\rm{1}} $$$
). The measurement error model then becomes:
$$--><$>{{\alpha }_{{{{\rm{1}}}_{{\rm{RT}}}}}} = {\rm{1}} $$$
). The measurement error model then becomes:
 $$--><$>R\, = \,T + r + {{{\epsilon}}_{\rm{R}}} $$$
. As uncorrelated errors between methods, and no intake-related bias in 24hR, are not realistic in dietary assessment, model assumptions are violated and biases will still be present when such estimates are used for calibration of intake–health associations.
$$--><$>R\, = \,T + r + {{{\epsilon}}_{\rm{R}}} $$$
. As uncorrelated errors between methods, and no intake-related bias in 24hR, are not realistic in dietary assessment, model assumptions are violated and biases will still be present when such estimates are used for calibration of intake–health associations.
Data analyses
Adjustment for gender was done by the residual method. The 95 % confidence intervals of the validity coefficients have been estimated using bootstrap sampling with 1000 replicates using R version 2·12·2. The other analyses were performed using the SAS statistical software package version 9·2.
Results
We excluded five participants with missing urine(s) and therefore our final sample consisted of fifty-nine men and fifty-eight women with a mean age of 57·4 (sd 4·3) and 55·2 (sd 5·5) years and a mean BMI of 26·5 (sd 3·8) and 25·7 (sd 5·0) kg/m2, respectively. Seven men and two women were current smokers and twelve men and fourteen women had a low educational level.
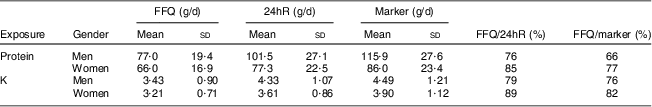
For men and women, mean protein intake was highest when based on N excretion (115·9 and 86·0 g/d, respectively) and lowest when based on the FFQ (77·0 and 66·0 g/d, respectively), with 24hR estimates in between (101·5 and 77·3 g/d, respectively; Table 2). Also for K, mean intakes were highest when based on K excretion (4·49 and 3·90 g/d, respectively) and lowest when based on the FFQ (3·43 and 3·21 g/d, respectively), with estimates based on 24hR in between (4·33 and 3·61 g/d, respectively) both in men and women.
Mean (sd) intake of protein and potassium by FFQ and 24hR, protein and potassium excretion, and the proportion of intake by the FFQ as compared with reference method in Dutch men (n 59) and women (n 58) aged 45–65 years
24hR, 24-h recall method.
The best estimates of the correction factor for protein and K from the FFQ were the calibration factors 0·44 (95 % CI 0·19, 0·69) and 0·57 (95 % CI 0·32, 0·81) based on calibration to duplicate urinary N and urinary K excretion, respectively (scenario 1, Table 3). Figure 2 illustrates the implications of the different correction factors on an intake–health association and shows the true, observed and corrected RR based on the three imperfect scenarios. We assumed scenario 1 to result in a fictitious ‘true RR’ of 2·0 for both protein and K intake and an unspecified health outcome. The corresponding observed RR, without any correction for measurement error of the FFQ, would have been 1·4 (i.e. 2·00·44209; based on the formula
 $$--><$>{\rm RR_{true} = (RR_{observed})^{1/{{\it b}_{{\rm{RefQ}}}} $$$
and the unrounded correction factor) for protein and 1·5 (i.e. 2·00·56706) for K.
$$--><$>{\rm RR_{true} = (RR_{observed})^{1/{{\it b}_{{\rm{RefQ}}}} $$$
and the unrounded correction factor) for protein and 1·5 (i.e. 2·00·56706) for K.
Correction factors (and 95 % confidence intervals) for protein and potassium intakes from the FFQ resulting from four different calibration and de-attenuation scenariosFootnote *

24hR, 24-h recall method.
* Intakes from FFQ, 24hR and biomarker measurements were adjusted for gender, using the residual method.
Visualization of the fictitious true relative risk (RR) of 2·0 (scenario 1), the observed RR, and the corrected RR based on the three imperfect scenarios (2–4). ![]() , true RR, after calibration to duplicate recovery biomarker (scenario 1);
, true RR, after calibration to duplicate recovery biomarker (scenario 1); ![]() , observed RR, without any correction;
, observed RR, without any correction;
![]() , RR after de-attenuation using duplicate recovery biomarker (scenario 2);
, RR after de-attenuation using duplicate recovery biomarker (scenario 2); ![]() , RR after de-attenuation using duplicate recovery biomarker and 24 h recall method (24hR) (triad, scenario 3);
, RR after de-attenuation using duplicate recovery biomarker and 24 h recall method (24hR) (triad, scenario 3); ![]() , RR after calibration to duplicate 24hR (scenario 4)
, RR after calibration to duplicate 24hR (scenario 4)
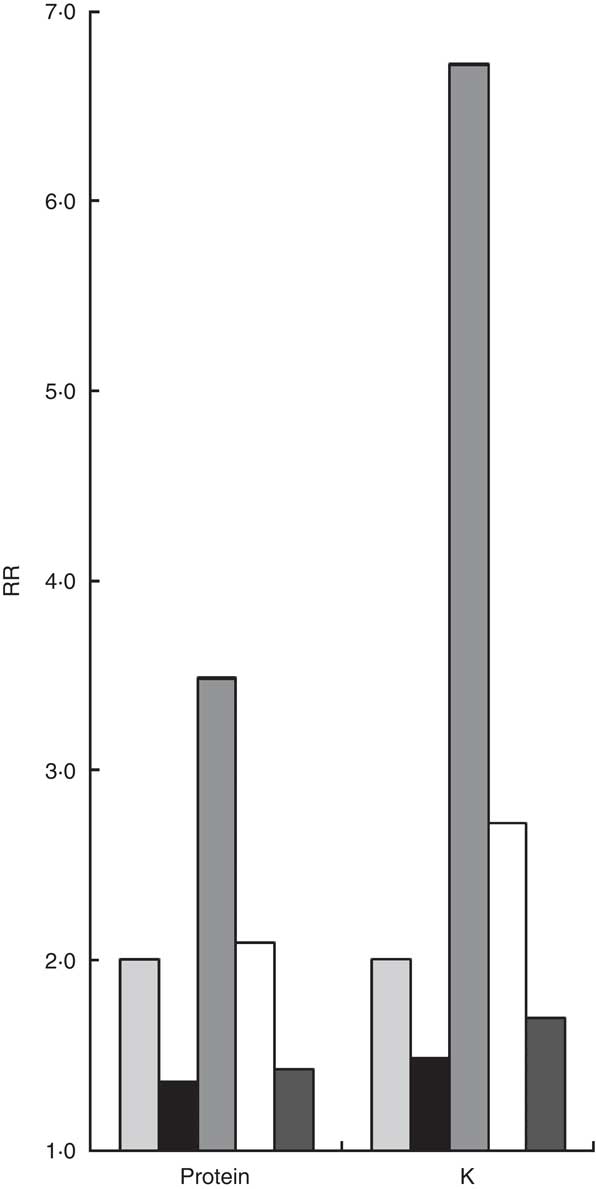
Using a validity coefficient estimated by the duplicate biomarker (de-attenuation, scenario 2) would overcorrect the observed RR to 3·5 (i.e. 1·358571/0.24580 based on the formula
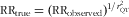 $$--><$>{\rm RR_{true} = (RR_{observed})^{1/{\it r}^2_{QT}}} $$$
, the unrounded observed RR and the unrounded correction factor) for protein and 6·7 (i.e. 1·481501/0.20630) for K. For protein the correction factor (i.e. squared validity coefficient) was 0·25 (95 % CI 0·03, 0·33). Thus, the intake-related bias for protein intake as quantified by
$$--><$>{\rm RR_{true} = (RR_{observed})^{1/{\it r}^2_{QT}}} $$$
, the unrounded observed RR and the unrounded correction factor) for protein and 6·7 (i.e. 1·481501/0.20630) for K. For protein the correction factor (i.e. squared validity coefficient) was 0·25 (95 % CI 0·03, 0·33). Thus, the intake-related bias for protein intake as quantified by
 $$--><$> {{b}_{{\rm{QT}}}} = r_{{{\rm{QT}}}}^{{\rm{2}}} /{{b}_{{\rm{MQ}}}} = {\rm{0}} \cdot {\rm{25/0}} \cdot {\rm{44 = 0}} \cdot {\rm{57}} $$$
is close to half its reference value of 1. For K this scenario would result in a correction factor of 0·21 (95 % CI 0·07, 0·35). Thus, the intake-related bias for K intake as quantified by
$$--><$> {{b}_{{\rm{QT}}}} = r_{{{\rm{QT}}}}^{{\rm{2}}} /{{b}_{{\rm{MQ}}}} = {\rm{0}} \cdot {\rm{25/0}} \cdot {\rm{44 = 0}} \cdot {\rm{57}} $$$
is close to half its reference value of 1. For K this scenario would result in a correction factor of 0·21 (95 % CI 0·07, 0·35). Thus, the intake-related bias for K intake as quantified by
 $$--><$> {{b}_{{\rm{QT}}}} = r_{{{\rm{QT}}}}^{{\rm{2}}} /{{b}_{{\rm{MQ}}}} = {\rm{0}} \cdot {\rm{21/0}} \cdot {\rm{57 = 0}} \cdot {\rm{37}} $$$
is less than half its reference value of 1.
$$--><$> {{b}_{{\rm{QT}}}} = r_{{{\rm{QT}}}}^{{\rm{2}}} /{{b}_{{\rm{MQ}}}} = {\rm{0}} \cdot {\rm{21/0}} \cdot {\rm{57 = 0}} \cdot {\rm{37}} $$$
is less than half its reference value of 1.
Using a triad approach with both the mean of the duplicate urinary N excretions and the mean of the duplicate 24hR (scenario 3) would nearly perfectly adjust the observed RR to 2·1 (i.e. 1·358571/0.41570) for protein and slightly overcorrect to 2·7 (i.e. 1·481501/0.89260) for K. Thus, although the correlated errors in the FFQ and 24hR have inflated
 $$--><$> r_{{{\rm{QT}}}}^{{\rm{2}}} $$$
and thus r
RQ by 68 % (0·42/0·25 = 1·68), this is in the data of the current population apparently compensated for by not accounting for the intake-related bias in the FFQ and resulted in a correction factor (i.e. squared validity coefficient) of 0·42 (95 % CI 0·17, 0·63) for protein. For K the triad approach resulted in a correction factor of 0·39 (95 % CI 0·20, 0·59). This implies that the correlated errors in FFQ and 24hR have inflated
$$--><$> r_{{{\rm{QT}}}}^{{\rm{2}}} $$$
and thus r
RQ by 68 % (0·42/0·25 = 1·68), this is in the data of the current population apparently compensated for by not accounting for the intake-related bias in the FFQ and resulted in a correction factor (i.e. squared validity coefficient) of 0·42 (95 % CI 0·17, 0·63) for protein. For K the triad approach resulted in a correction factor of 0·39 (95 % CI 0·20, 0·59). This implies that the correlated errors in FFQ and 24hR have inflated
 $$--><$> r_{{{\rm{QT}}}}^{{\rm{2}}} $$$
and thus r
RQ by 86 % (0·39/0·21 = 1·86).
$$--><$> r_{{{\rm{QT}}}}^{{\rm{2}}} $$$
and thus r
RQ by 86 % (0·39/0·21 = 1·86).
Calibration to duplicate 24hR (scenario 4) led to the least effective correction of all scenarios and would not affect the observed RR of 1·4 (i.e. 1·358571/0.86555) for protein and slightly adjust it to 1·7 (i.e. 1·481501/0.74184) for K. The correction factor (i.e. calibration factor) was 0·87 (95 % CI 0·67, 1·06) for protein and 0·74 (95 % CI 0·57, 0·92) for K. Apparently, the presence of correlated errors and intake-related bias in the 24hR together inflates the correction factor 2-fold (0·87/0·44 = 1·98) for protein and 1·3-fold (0·74/0·57 = 1·30) for K.
Discussion
FFQ measurement error may seriously obscure intake–health associations both for protein and K in this Dutch adult population. This is a problem that is sometimes neglected by researchers, although the impact on the observed association can be comparable to that of e.g. confounding. This error can be accounted for by regression calibration using a gold standard recovery biomarker (scenario 1). Alternatively, using a validity coefficient estimated by duplicate biomarkers (scenario 2) does not materially differ from scenario 1, but it neglects the presence of intake-related bias and we illustrated that this resulted in substantial overcorrection for both protein and K. Using a triad approach with biomarker and 24hR (scenario 3) suffers from correlated errors between FFQ and 24hR and also is not able to correct for intake-related bias. Apparently, in the data of the current population this approach resulted in a nearly perfect correction factor for protein, but for K some overcorrection took place. Calibration to duplicate 24hR (scenario 4) led to only a minimal correction, caused by correlated errors between FFQ and 24hR and intake-related bias in the 24hR.
The Dutch sample of the EFCOVAL study provided standardized data on protein and K intakes from FFQ, two 24hR and two 24 h urine samples. Unfortunately the small sample size resulted in imprecise estimates of the correction factors and limited us in the possibility to conclude on differences between scenarios, between protein and K, and between men and women. Furthermore, it is important to reflect on the model assumptions underlying these analyses. It can be questioned whether a duplicate recovery biomarker (urinary N and urinary K) is indeed a gold standard reference method for the usual intake of protein and K. It is assumed that errors in replicates, not too close in time, are independent( Reference Kaaks, Ferrari and Ciampi 20 ). However, correlated errors between replicates of recovery markers may have biased the correction factor in scenario 2. Furthermore, both linear regression calibration and the triad method assume a linear relationship between observed and true intakes. This assumption is reasonable when the intake range is limited but it may be debatable if it is very large, or if foods have different reporting characteristics and also differ with respect to their contribution to nutrient intake. If this linearity assumption is not fulfilled, de-attenuation using a validity coefficient may be incomplete and linear regression calibration may also not suffice.
Another limitation of our assessment is the lack of adjustment for energy intake. In the Observing Protein and Energy Nutrition (OPEN) study, energy-adjusted protein was less affected by measurement error compared with absolute protein intake( Reference Kipnis, Subar and Midthune 7 ), although measurement error still remained an issue. In the absence of a biomarker estimate for energy intake, we unfortunately were not able to assess if this was also the case using this specific FFQ in a European population. As energy adjustment is applied in the majority of epidemiological analyses on intake and health, this would have been preferred. We previously showed good agreement between reported and actual energy intakes for ranking individuals using this FFQ( Reference Bingham and Cummings 17 ). However, as individual-level intakes were found to be inaccurate, results may be affected in an unknown direction if nutrients are corrected for energy intakes reported by FFQ.
Besides our study, both European( Reference Kipnis, Midthune and Freedman 22 ) and American( Reference Kipnis, Subar and Midthune 7 ) data have been published on the validity of FFQ-based protein intake. In addition, the American OPEN study showed results for energy intake and protein density and we presented results on K intake. Altogether, it can be concluded that FFQ measurement error has a severe impact on estimates of dietary intake and it is underestimated when 24hR are used as the reference method for evaluation. However, data on other populations (e.g. younger, obese) and other nutrients are lacking. Still, it is likely that correlated errors between FFQ and 24hR also impair measurement error correction for other (micro) nutrients. This can be expected to have important implications for nutritional epidemiology. Unfortunately, for these nutrients no recovery biomarkers are available that can serve as a gold standard reference. The estimated correction factors, however, depend not only on the characteristics of the instruments used, but also on the heterogeneity of population intake. Because day-to-day variation is low for energy and protein intake as compared with other nutrients, it has been postulated that FFQ may perform better for nutrients with more heterogeneous intakes( Reference Plummer and Kaaks 23 ).
In practice, when the aim is to quantify the strength of an association, both random and systematic errors, including person-specific and intake-related bias, should be taken into account. Calibration should be used to correct for measurement error, preferably using a gold standard reference method. If not available, a superior alloyed gold standard method, e.g. 24hR, can be used, in which case an incomplete correction can be expected. Alternatively, if substantial intake-related bias in the FFQ is suspected, part of it can be removed by correction for covariables (like age, BMI, etc.) that contribute to the intake-related bias as well as to errors that are common to both FFQ and 24hR. In our assessment, we only took into account the effect of measurement error on associations between intake and health. If interest would also be in a correct estimate of mean population intake, it would become important to correct the shift of the intake distribution caused by systematic errors using calibration. In Table 2 it can be seen that also for that purpose the 24hR as reference method underestimates the systematic error in the mean intake as compared with the gold standard reference. We can add that if the research aim is to compare results between studies or populations, calibration to a reference method that performs similarly in different populations, e.g. a 24hR, is preferred. Even if this method does not fulfil all criteria for a valid reference method, comparability between the associations obtained from different populations will be improved. As this is relevant to generalizability of study results, this is an important argument to add evaluation studies to large epidemiological studies, even with an alloyed gold standard( Reference Slimani, Bingham and Runswick 24 ). Finally, it is important to mention that calibration works best for continuous exposure variables that are consumed frequently by most of the population; for infrequently consumed foods and nutrients, more complex measurement error models are needed with at least two replicates of the reference method( Reference Kipnis, Midthune and Buckman 25 , Reference Tooze, Midthune and Dodd 26 ).
Conclusion
In conclusion, FFQ measurement error complicates the assessment of intake–health associations, as illustrated for protein and K in a selected (i.e. non-obese) Dutch adult population. Calibration to a gold standard reference method is the preferred approach to correct the strength of intake–health associations for errors in an FFQ. In the current population, substantial intake-related bias in both FFQ and 24hR and correlated errors between the two limit the possibility to use the validity coefficient as correction factor and the 24hR as reference method. However, although using the 24hR as an alloyed gold standard reference method in regression calibration removes only part of the errors, it may result in better intake–health associations than relying on the FFQ and not correcting at all and it improves comparability between studies.
Acknowledgements
Sources of funding: This work was supported by European Community funding under the Sixth Framework Programme for the EFCOVAL project (FOOD-CT-2006-022895). This document reflects only the authors’ views and the European Community is not liable for any use that may be made of the information contained herein. The European Community had no role in the design, analysis or writing of this article. Conflicts of interest: All authors declare no conflicts of interest. Authors contributions: A.G., J.H.M.d.V. and P.v.t.V. designed the research; A.G. and J.H.M.d.V. conducted the research; A.G. and O.W.S. analysed the data; A.G., M.C.B. and P.v.t.V. wrote the paper; A.G. and P.v.t.V. had primary responsibility for final content. All authors read and approved the final manuscript. Acknowledgements: The authors thank Saskia Meijboom for the development and processing of the FFQ and Paul Hulshof for the coordination of the biomarker collection and measurement.


