


Introduction
Predatory drill holes on marine shelled invertebrates are direct indicators of predator–prey interactions in marine environments, and they potentially document different aspects of these interactions in marine ecosystems (e.g., Kitchell Reference Kitchell, Nitecki and Kitchell1986; Kowalewski Reference Kowalewski2002; Kelley and Hansen Reference Kelley, Hansen, Kelley, Kowalewski and Hansen2003; Klompmaker et al. Reference Klompmaker, Kelley, Chattopadhyay, Clements, Huntley and Kowalewski2019). The high preservation potential of drill holes allows the tracing back of the evolution of drilling behavior in Earth's history and testing of evolutionary hypotheses such as the Mesozoic marine revolution or escalation (Vermeij Reference Vermeij1977, Reference Vermeij1987). Predation is one of the selective agents in nature and is regarded as a strong evolutionary driver (Vermeij Reference Vermeij1987). Drilling predation is a common reason for mortality in Recent benthic mollusks (e.g., Vermeij Reference Vermeij1980; Chiba and Arai Reference Chiba and Arai2014; Gordillo et al. Reference Gordillo, Malvé, Morán and Boretto2020), but the intensity of this type of predatory interaction differs spatially (Visaggi and Kelley Reference Visaggi and Kelley2015) and temporally (Kelley and Hansen Reference Kelley and Hansen2006).
In the fossil record, the producers of drill holes are difficult to identify because the drilling organisms are rarely preserved with the drill hole in situ. Generally, the identity of drilling predators in the fossil record is interpreted by comparing the drilling traces with their modern equivalents and by comparison with organisms that produce similar traces. Drill holes on hard substrates can be produced by domicile-seeking organisms, parasites, and predators (Wilson Reference Wilson and Miller2007; Klompmaker et al. Reference Klompmaker, Kelley, Chattopadhyay, Clements, Huntley and Kowalewski2019). Small drill holes on hard shells are produced by nematodes (0.2 mm in diameter on oysters), flatworms (0.1 mm in diameter on foraminifers), bryozoans (0.1 mm on calcareous substrates), and foraminifers (Pohowsky Reference Pohowsky1978; Bromley Reference Bromley1981; Kabat Reference Kabat1990; Walker et al. Reference Walker, Hancock and Bowser2017). Acrothoracid barnacles also produce drill holes on hard substrates, but their drill holes are easily recognized by their compressed ovate shape (Baird et al. Reference Baird, Brett and Tomlinson1990). Large drill holes (0.2–5 mm in diameter) on Recent hard shells are produced mostly by gastropods but also by octopods (Bromley Reference Bromley1981; Kabat Reference Kabat1990; Klompmaker et al. Reference Klompmaker, Kelley, Chattopadhyay, Clements, Huntley and Kowalewski2019). Octopods drill on epifaunal organisms; their drill holes can be identified by the characteristic teardrop shape of the drill hole and by the position of the holes on a molluscan prey (Bromley Reference Bromley1981; Klompmaker et al. Reference Klompmaker, Kelley, Chattopadhyay, Clements, Huntley and Kowalewski2019). Octopods drill epifaunal molluscan prey on sites where the adductor muscle is located and inject venom through the hole to relax the muscles (Cortez et al. Reference Cortez, Castro and Guerra1998; Klompmaker and Kittle Reference Klompmaker and Kittle2021). The oldest drill holes that are attributable to Octopodoidea are from the Cretaceous (Klompmaker and Landman Reference Klompmaker and Landman2021). Among gastropods, Capulidae live parasitically on epifaunal bivalves and echinoids, but their drill holes can be recognized by the attachment scar they produce around the drill hole (Matsukuma Reference Matsukuma1978; Breton et al. Reference Breton, Wisshak, Néraudeau and Morel2017). There are several living gastropod groups making predatory or parasitic drill holes on their shelled prey (Klompmaker et al. Reference Klompmaker, Kelley, Chattopadhyay, Clements, Huntley and Kowalewski2019; Nützel Reference Nützel, Baets and Huntley2021); however, the majority of the predatory drill holes in Recent marine environments are made by Naticidae and Muricidae. Generally, naticids prey on infaunal organisms and produce parabolic drill holes with the larger diameter on the external shell surface (ichnospecies Oichnus paraboloides Bromley, Reference Bromley1981), while muricids prey largely on epifaunal taxa and produce straight-sided drill holes (Oichnus simplex Bromley, Reference Bromley1981), but there are exceptions (Kelley and Hansen Reference Kelley, Hansen, Kelley, Kowalewski and Hansen2003). These two groups are unique among gastropods in having an accessory boring organ. They drill by chemical dissolution with the enzymes secreted by the accessory boring organ and mechanical abrasion by rasping with the radula (Carriker Reference Carriker1981; Carriker and Gruber Reference Carriker and Gruber1999; Büchner-Miranda et al. Reference Büchner-Miranda, Salas-Yanquin, Averbuj, Navarro, Cubillos, Matos, Zabala and Chaparro2021). The fossil record of the living drilling gastropod groups does not extend back further than the Cretaceous (Klompmaker et al. Reference Klompmaker, Kelley, Chattopadhyay, Clements, Huntley and Kowalewski2019). The oldest occurrence of the family Naticidae has been considered to be from the Early Cretaceous (Kase and Ishikawa Reference Kase and Ishikawa2003; Klompmaker et al. Reference Klompmaker, Nützel and Kaim2016). Naticids recently reported from the Upper Jurassic of Kutch, India (Das et al. Reference Das, Mondal, Saha, Bardhan and Saha2019) are now considered as Miocene in age (Fürsich et al. Reference Fürsich, Bhosale, Alberti and Pandey2023). During the Paleozoic, the gastropod family Platyceratidae produced drill holes and lived as an epifaunal parasite on blastoids, crinoids, and brachiopods (Baumiller et al. Reference Baumiller, Leighton and Thompson1999; Baumiller and Gahn Reference Baumiller and Gahn2002; Thomka and Brett Reference Thomka, Brett, Baets and Huntley2021). Platyceratids are considered to have become extinct at the end-Permian mass extinction, but some members might have persisted into the Triassic (Bandel Reference Bandel1992; Tracey et al. Reference Tracey, Todd, Erwin and Benton1993).
Although there is a substantial amount of drill-hole record from the Cretaceous onward (Huntley and Kowalewski Reference Huntley and Kowalewski2007; Rojas et al. Reference Rojas, Portell and Kowalewski2017), the record is quite scarce in the Triassic (i.e., Fürsich and Jablonski Reference Fürsich and Jablonski1984; Newton et al. Reference Newton, Whalen, Thompson, Prins and Delalla1987; McRoberts and Blodgett Reference McRoberts and Blodgett2000; Klompmaker et al. Reference Klompmaker, Nützel and Kaim2016; Tackett and Tintori Reference Tackett and Tintori2019) and in the Jurassic (i.e., Sohl Reference Sohl1969; Bromley Reference Bromley1981; Harper et al. Reference Harper, Forsythe and Palmer1998; Kowalewski et al. Reference Kowalewski, Dulai and Fürsich1998; Harper and Wharton Reference Harper and Wharton2000; Aberhan et al. Reference Aberhan, Scholz and Schubert2011; Bardhan et al. Reference Bardhan, Chattopadhyay, Mondal, Das, Mallick, Roy and Chanda2012; Karapunar et al. Reference Karapunar, Werner, Fürsich and Nützel2020a,Reference Karapunar, Werner, Fürsich and Nützelb; Saha et al. Reference Saha, Paul, Mondal, Bardhan, Das, Saha and Sarkar2021; see also Fürsich et al. Reference Fürsich, Bhosale, Alberti and Pandey2023). Different hypotheses have been proposed to explain the rarity of drill holes in the Mesozoic fossil record: low diversity of drilling organisms (Kowalewski et al. Reference Kowalewski, Dulai and Fürsich1998; Huntley and Kowalewski Reference Huntley and Kowalewski2007), low sampling intensity and poor preservation (Huntley and Kowalewski Reference Huntley and Kowalewski2007), and taphonomic bias (Harper et al. Reference Harper, Forsythe and Palmer1998). Because of this scarcity, the evolution of drilling behavior in the early Mesozoic, phylogenetic relationships of early Mesozoic drilling organisms to Paleozoic and Cenozoic drilling organisms, and the effects of drilling predation on prey populations during the early Mesozoic are not yet well understood.
There are many quantitative studies on drill holes from the Cenozoic and Recent that analyze site-selective behavior (i.e., attacking certain shell regions of the prey taxon) and size-selective behavior of drilling predators using traditional statistical methods (e.g., Kitchell Reference Kitchell, Nitecki and Kitchell1986; Kowalewski Reference Kowalewski2002; Kelley and Hansen Reference Kelley, Hansen, Kelley, Kowalewski and Hansen2003). Recently, Rojas et al. (Reference Rojas, Dietl, Kowalewski, Portell, Hendy and Blackburn2020) developed the spatial point pattern analysis of traces (SPPAT) to analyze spatial distribution of drill holes and other traces with distance-based statistical methods, which allows investigation of the drill holes without loss of position information. In contrast to the studies on Cenozoic and Recent drill holes, quantitative analyses with drill holes to infer behavioral pattern of the drill-hole producers (e.g., site selectivity, size selectivity, prey selectivity) from the early Mesozoic (Early Triassic–Middle Jurassic) are scarce. There is only one quantitative study from the Triassic (Forel et al. Reference Forel, Bergue and Maranhão2022) and two quantitative studies of drill holes from the Lower Jurassic analyzing behavioral patterns of drill-hole producers. Harper et al. (Reference Harper, Forsythe and Palmer1998) mentioned predatory drill holes on several taxa from different localities and showed that the drill holes on astartid bivalve shells from the lower Pliensbachian (Tragophylloceras ibex Zone) of the United Kingdom were nonrandomly distributed, indicating a site-selective behavior. Karapunar et al. (Reference Karapunar, Werner, Fürsich and Nützel2020a) reported predatory drill holes in 81% of the articulated specimens (56 out of 69 specimens) of the chemosymbiotic bivalve Eothyasira antiqua and in one astartid specimen from the upper Pliensbachian Amaltheenton Formation (Pleuroceras spinatum Zone) from southern Germany. They showed a nonrandom distribution of drill holes (site selectivity) and strong prey selectivity. Drill holes from the Amaltheenton Formation from northern Germany were first mentioned by Aberhan et al. (Reference Aberhan, Scholz and Schubert2011) in a taxonomic study on the bivalve fauna. The authors reported a high predatory pressure (5 out of 19 Gresslya intermedia specimens were bored) but did not provide quantitative analyses with regard to site-selective, size-selective, or prey-selective behavior of the predator.
Here we document a considerably high number of drill holes in bivalves in comparison to previous reports from the Early Jurassic. The drilled specimens belong to taxa with different life habits and come from two argillaceous formations of the Pliensbachian of northwestern Germany (Capricornumergel and Amaltheenton Formations). The main aim of the paper is to analyze the drill holes to infer the behavioral pattern of the drill-hole producer (site selectivity, improvement in site-selective behavior with age, size selectivity, prey selectivity) during a geological time interval when the drilling of shelled taxa was a rare phenomenon. Additionally, taphonomic features and ichnofossils on some bivalve specimens are discussed in the context of a possible relation with the origin of the drill holes and compared with similar occurrences in the Pliensbachian of southern Germany.
Material and Methods
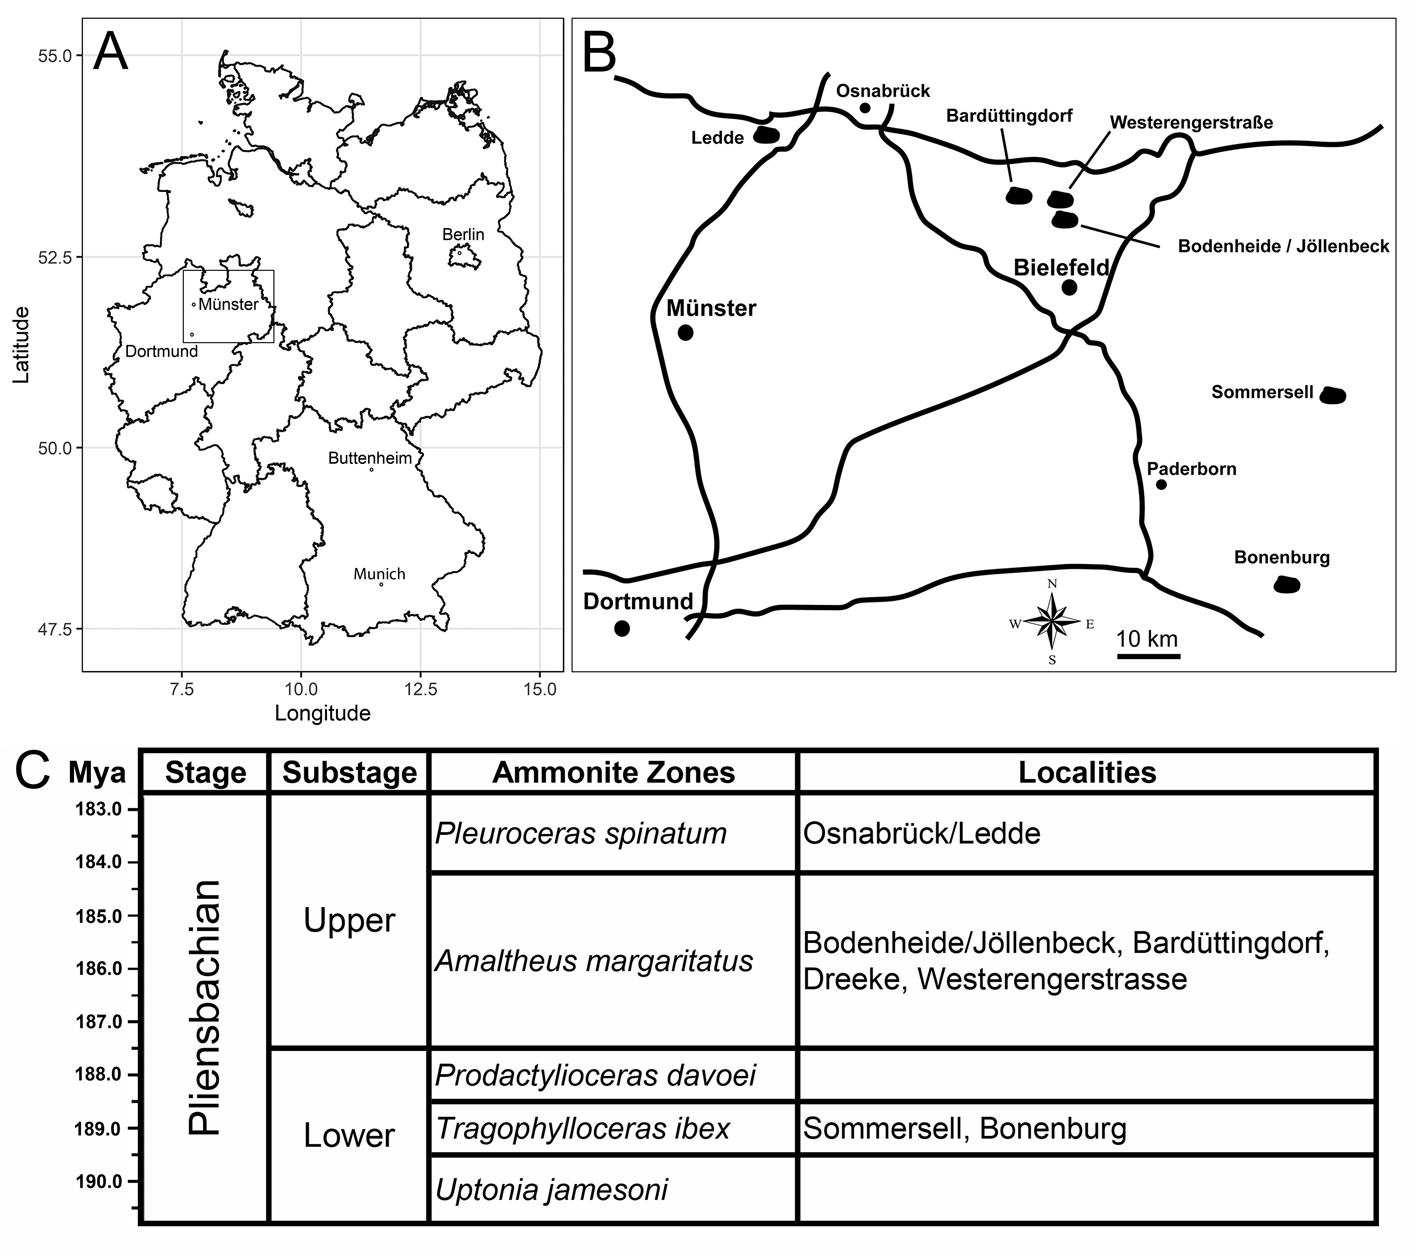
The studied bivalve specimens come from several Pliensbachian (Lower Jurassic) clay pits of Nordrhein-Westfalen (northwestern Germany) that expose silty clays with intercalated clay-ironstone concretions and reworked horizons of the Tragophylloceras ibex Zone (lower Pliensbachian) of the Capricornumergel Formation and/or the upper Pliensbachian (Amaltheus margaritatus Zone or Pleuroceras spinatum Zone) of the Amaltheenton Formation. A detailed description of the localities and ages of the outcrops are given by Schubert (Reference Schubert2006, Reference Schubert2010, Reference Schubert2013) and provided in Appendix S1 and shown in Figure 1. The GPS points of the localities where the drilled specimens were found are as follows: Bonenburg (51°33′46.1″N, 9°02′17.9″E), Sommersell (51°49′45.3″N, 9°10′12.0″E), Bodenheide/Jöllenbeck (52°05′43.1″N, 8°34′18.7″E), Westerengerstrasse I (52°06′47.3″N, 8°30′44.7″E), Westerengerstrasse II (52°06′49.1″N, 8°31′06.3″E), Bardüttingdorf (52°07′38.5″N, 8°24′24.3″E), Dreeke Bielefeld (52°05′08.2″N, 8°29′32.9″E), and Osnabrück/Ledde (52°15′04.0″N, 7°51′13.7″E). Almost all drilled specimens were collected from unlithified clay deposits, and a single drilled specimen comes from clay-ironstone concretions (Modiolus imbricatus, SNSB-BSPG 2021 XX 1). All drilled specimens have their original three-dimensional shapes due to the presence of lithified internal molds and were not compacted, unlike the thin-shelled taxa (e.g., Parainoceramya) without lithified internal molds. Some of the studied (undrilled) bivalves stem from shell beds deposited in reworked horizons during short interruptions of sedimentation (indicated by shell accumulations). Reworking of these layers is inferred from the presence of epifaunal trace fossils on concretions (e.g., gastropod rasping; B.K., W.W., and S. Sch., personal observation) and epifaunal worm tubes on calcareous concretions (Jäger and Schubert Reference Jäger and Schubert2008). The bivalves and bivalve-bearing concretions were collected from the surface along with other macrofossils (especially ammonites) mainly by the authors T.R., M.B., S. Sch., S. Sim., and M.L. over the last decades. The specimens were not collected quantitatively. Therefore, exact drill-hole frequencies cannot be provided, but some estimates based on the studied material are given in the “Results.”
A, Map of Germany, with state boundaries. B, Sketch map of the studied localities in northwestern Germany. C, Stratigraphic chart of the Pliensbachian and the corresponding ammonite biozonations of the studied localities.
All bivalve specimens found in the studied localities were examined. The complete list of the bivalve species found in the studied localities and their life habits are given in Appendix S3. A total of 44 drilled bivalve specimens were found, 34 specimens from the upper Pliensbachian (A. margaritatus Zone or P. spinatum Zone) and 10 specimens from the lower Pliensbachian (T. ibex Zone). In the statistical analyses, only 33 Gresslya intermedia specimens from the upper Pliensbachian (30 from the A. margaritatus Zone and 3 from the P. spinatum Zone) were used. All G. intermedia specimens used in the analyses are either articulated valves or preserved as internal molds of articulated valves. The specimens were measured with a digital caliper. The drill holes were measured under a microscope with the digital caliper. In the specimens with preserved shell, the outer diameter of the drill hole was measured. In the specimens without preserved shell (internal molds), the circular impression on the internal mold was measured. All measurements are given in Appendix S2.
To evaluate the spatial distribution of drill holes on G. intermedia shells (a total of 38 drill holes on 33 specimens), we used SPPAT (Rojas et al. Reference Rojas, Dietl, Kowalewski, Portell, Hendy and Blackburn2020). Point pattern analyses have been used previously to evaluate univariate and bivariate spatial distributions of body fossils preserved in situ (Mitchell et al. Reference Mitchell, Harris, Kenchington, Vixseboxse, Roberts, Clark, Dennis, Liu and Wilby2019). However, the SPPAT combines spatial statistics with landmark-based morphometrics to quantify site-selectivity patterns in drilling predation. SPPAT uses distance-based statistics (e.g., K-function, L-function, and pair-correlation function [PCF]), which describes how the normalized density of drilling traces changes as a function of distance on the prey shell. Spatial distribution of traces on shells are classified as random (complete spatial randomness [CSR]), aggregated (individual traces are placed together into clusters), segregated (individual traces are placed farther apart than they would be under CSR), or some combination of these patterns. In this approach, the K-function is transformed to a straight line using the L-function to facilitate visual assessment of the graphical output (Baddeley et al. Reference Baddeley, Rubak and Turner2016; Rojas et al. Reference Rojas, Dietl, Kowalewski, Portell, Hendy and Blackburn2020). Because the SPPAT approach used herein was originally described through a case study of drilling predation on bivalve prey (Rojas et al. Reference Rojas, Dietl, Kowalewski, Portell, Hendy and Blackburn2020), its protocol for morphometric-based estimation of drill-hole location, as well as the interpretation of kernel density maps, hotspot maps, and graphical outputs from distance-based statistics for hypothesis testing (i.e., L-function and PCF) are transferred directly to our study of G. intermedia. A detailed description of SPPAT is provided in the R code used for the analysis. The R code and the data are provided in the Supplementary Material.
Drill-hole size is used as a proxy to estimate predator size (Kitchell et al. Reference Kitchell, Boggs, Kitchell and Rice1981; Kelley Reference Kelley1988; Kelley and Hansen Reference Kelley, Hansen, Kelley, Kowalewski and Hansen2003; Klompmaker et al. Reference Klompmaker, Kowalewski, Huntley and Finnegan2017). To test whether large predators show more stereotyped site selection (i.e., greater aggregation of drill holes), the drill holes were divided into two size categories. The drill holes smaller than the median diameter of drill holes (1.76 mm) were assigned to the small size category (16 drill holes), and the drill holes equal to or larger than the median value were assigned to the large size category (20 drill holes). The SPPAT was repeated for the two size classes. Two drill holes with indeterminate diameter were discarded from this analysis.
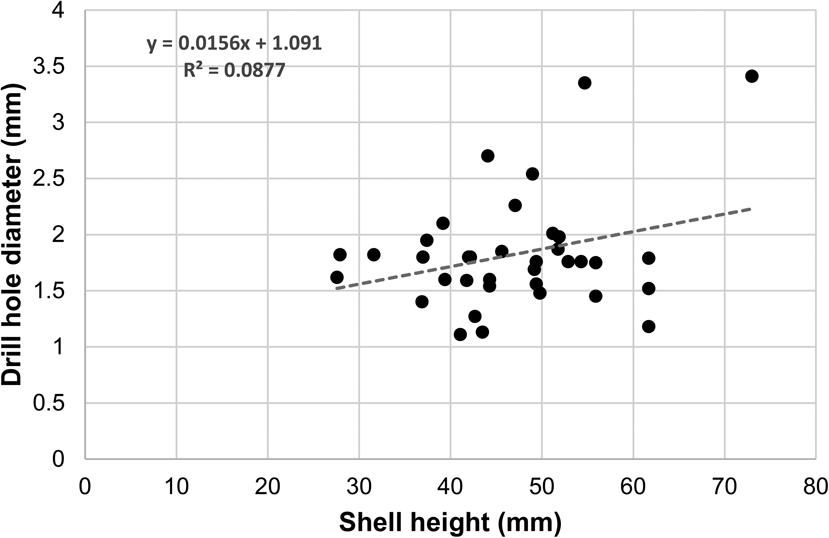
To evaluate whether larger predators prefer larger prey, the Spearman's rank correlation method was applied to test whether drill-hole size (a proxy for predator size) was correlated with shell height (prey size). The ordinary least-squares method was used in regression analysis.
For comparison, we reexamined Eothyasira antiqua (Münster in Goldfuss, Reference Goldfuss1841) and Gresslya intermedia (Tate, Reference Tate, Tate and Blake1876) specimens from the upper Pliensbachian Amaltheenton Formation at Buttenheim, southern Germany, for trace fossils other than drill holes to explore whether there is any trace fossil associated with drill holes. These specimens were already part of previous studies (Karapunar et al. Reference Karapunar, Werner, Fürsich and Nützel2020a, Reference Karapunar, Werner, Fürsich and Nützelb) but not in the context of coprolite and burrowing traces observed in the bivalves of northern Germany.
The specimens of the present study are deposited in the Naturkunde-Museum Bielefeld (NAMU) and the Bayerische Staatssammlung für Paläontologie und Geologie (SNSB-BSPG) in Munich. Additional material with the inventory number abbreviations SJSR, SBDD, SOLG, SWESII (coll. S. Sch.) will later be stored in a public collection in Nordrhein-Westfalen.
The specimens were covered with ammonium chloride before photography, unless stated otherwise.
Results
Drill holes were found on the shells of seven bivalve taxa, ranging from the Tragophylloceras ibex Zone to the Pleuroceras spinatum Zone of the Pliensbachian from several localities (Figs. 2–4). There are remarkable differences with regard to mode of life, diversity, and composition of target species between the lower and the upper Pliensbachian occurrences. Drilled bivalves from the T. ibex Zone (lower Pliensbachian) are the semi-infaunal Modiolus cf. scalprum (J. Sowerby, Reference Sowerby1821) and Modiolus cf. imbricatus (J. Sowerby, Reference Sowerby1818), the epifaunal Gervillia? cf. olifex Quenstedt, Reference Quenstedt1856, and the deep infaunal species Pholadomya ambigua (J. Sowerby, Reference Sowerby1818), Pleuromya costata (Young and Bird, Reference Young and Bird1828) and Gresslya intermedia (Tate, Reference Tate, Tate and Blake1876). In contrast, in the Amaltheus margaritatus Zone and P. spinatum Zone (upper Pliensbachian), drill holes are restricted to the deep infaunal species Pachymya (Arcomya) arcacea (Seebach, Reference Seebach1864) and G. intermedia, although epifaunal and shallow infaunal taxa are present in the upper Pliensbachian deposits in the studied localities (Schubert Reference Schubert2007, Reference Schubert2010; Aberhan et al. Reference Aberhan, Scholz and Schubert2011; Appendix S3).
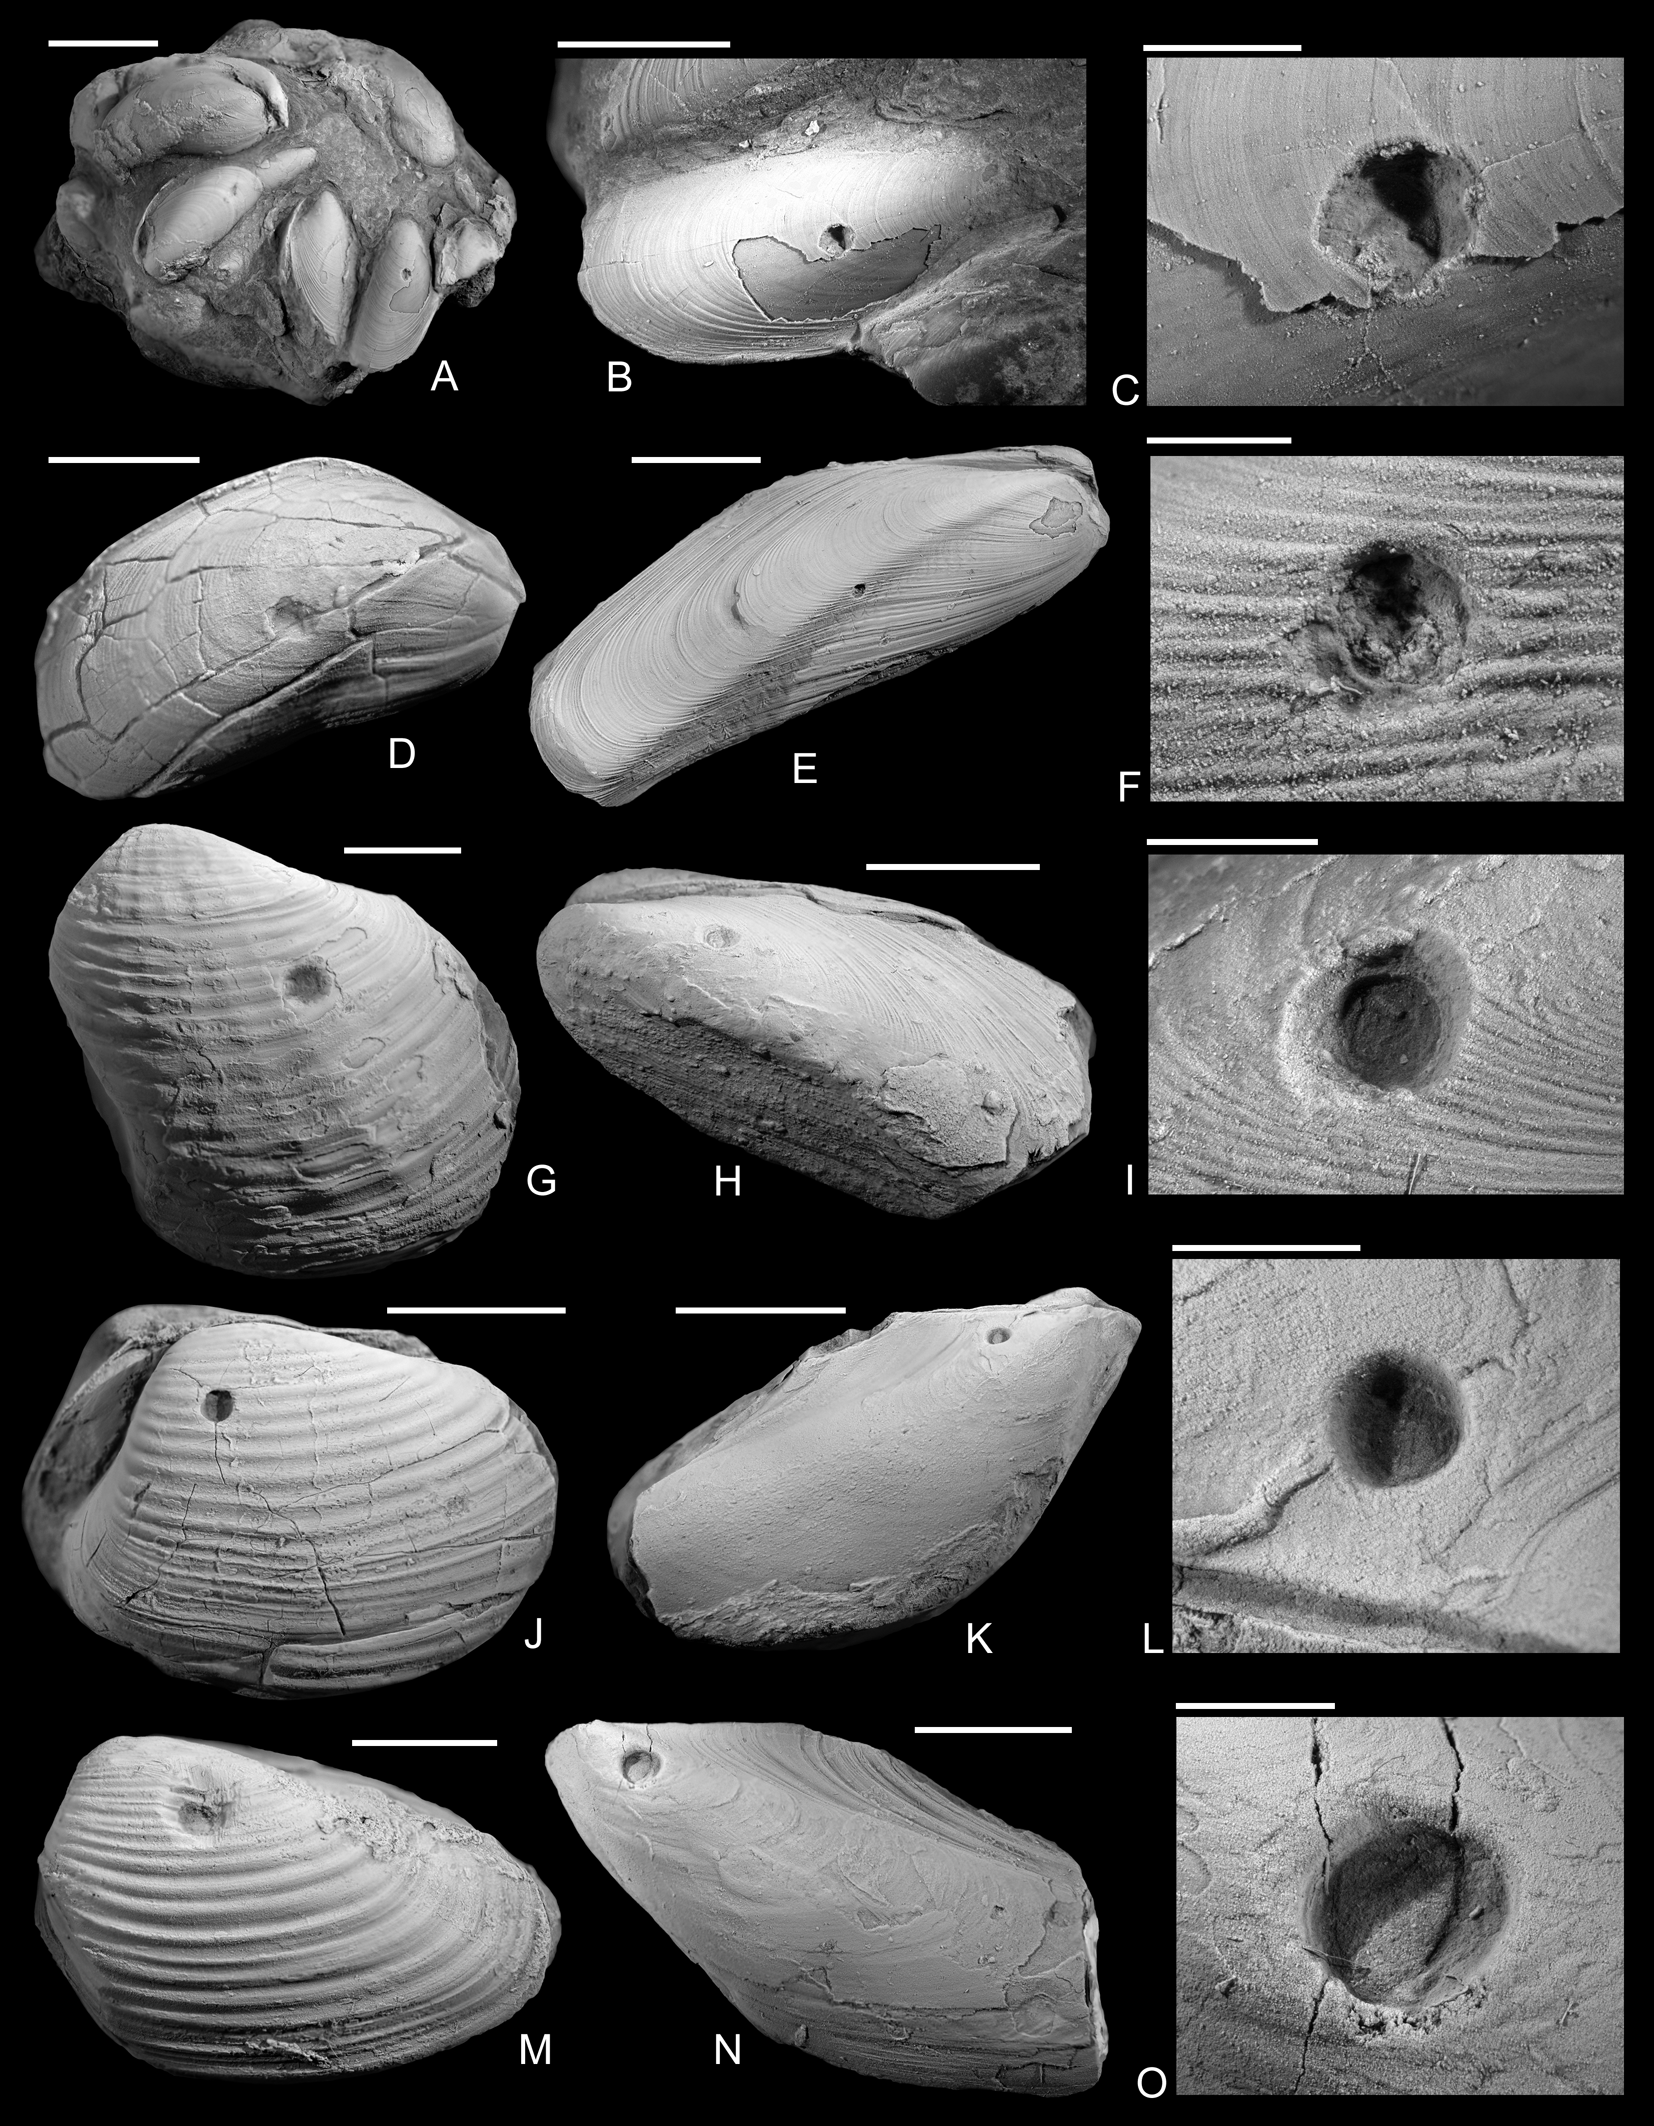
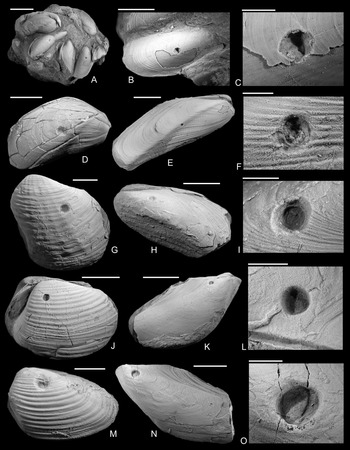
Drilled shells from the lower Pliensbachian (Tragophylloceras ibex Zone) of northern Germany. A–C, Modiolus imbricatus (J. Sowerby, Reference Sowerby1818), SNSB-BSPG 2021 XX 1. B, Detail of A, showing the drilled specimen. C, Detail of B. D, Modiolus imbricatus (J. Sowerby, Reference Sowerby1818), namu ES/jl-11463. E, F, Modiolus cf. scalprum (J. Sowerby, Reference Sowerby1821), namu ES/jl-11467. F, Detail of E. G, Pholadomya ambigua (J. Sowerby, Reference Sowerby1818), namu ES/jl-11466. H, I, Modiolus cf. scalprum (J. Sowerby, Reference Sowerby1821), namu ES/jl-11462. I, Detail of H. J, Pleuromya costata (Young and Bird, Reference Young and Bird1828), namu ES/jl-11464. K, L, Gervillia? cf. olifex Quenstedt, Reference Quenstedt1856, namu ES/jl-11460. L, Detail of K. M, Pleuromya costata (Young and Bird, Reference Young and Bird1828), namu ES/jl-11465. N, O. Gervillia? cf. olifex Quenstedt, Reference Quenstedt1856, namu ES/jl-11461. O, Detail of N. Scale bars, 1 mm (C, F); 2 mm (I, L, O); 5 mm (B, D); 10 mm (A, E, G, H, J, K, M, N).
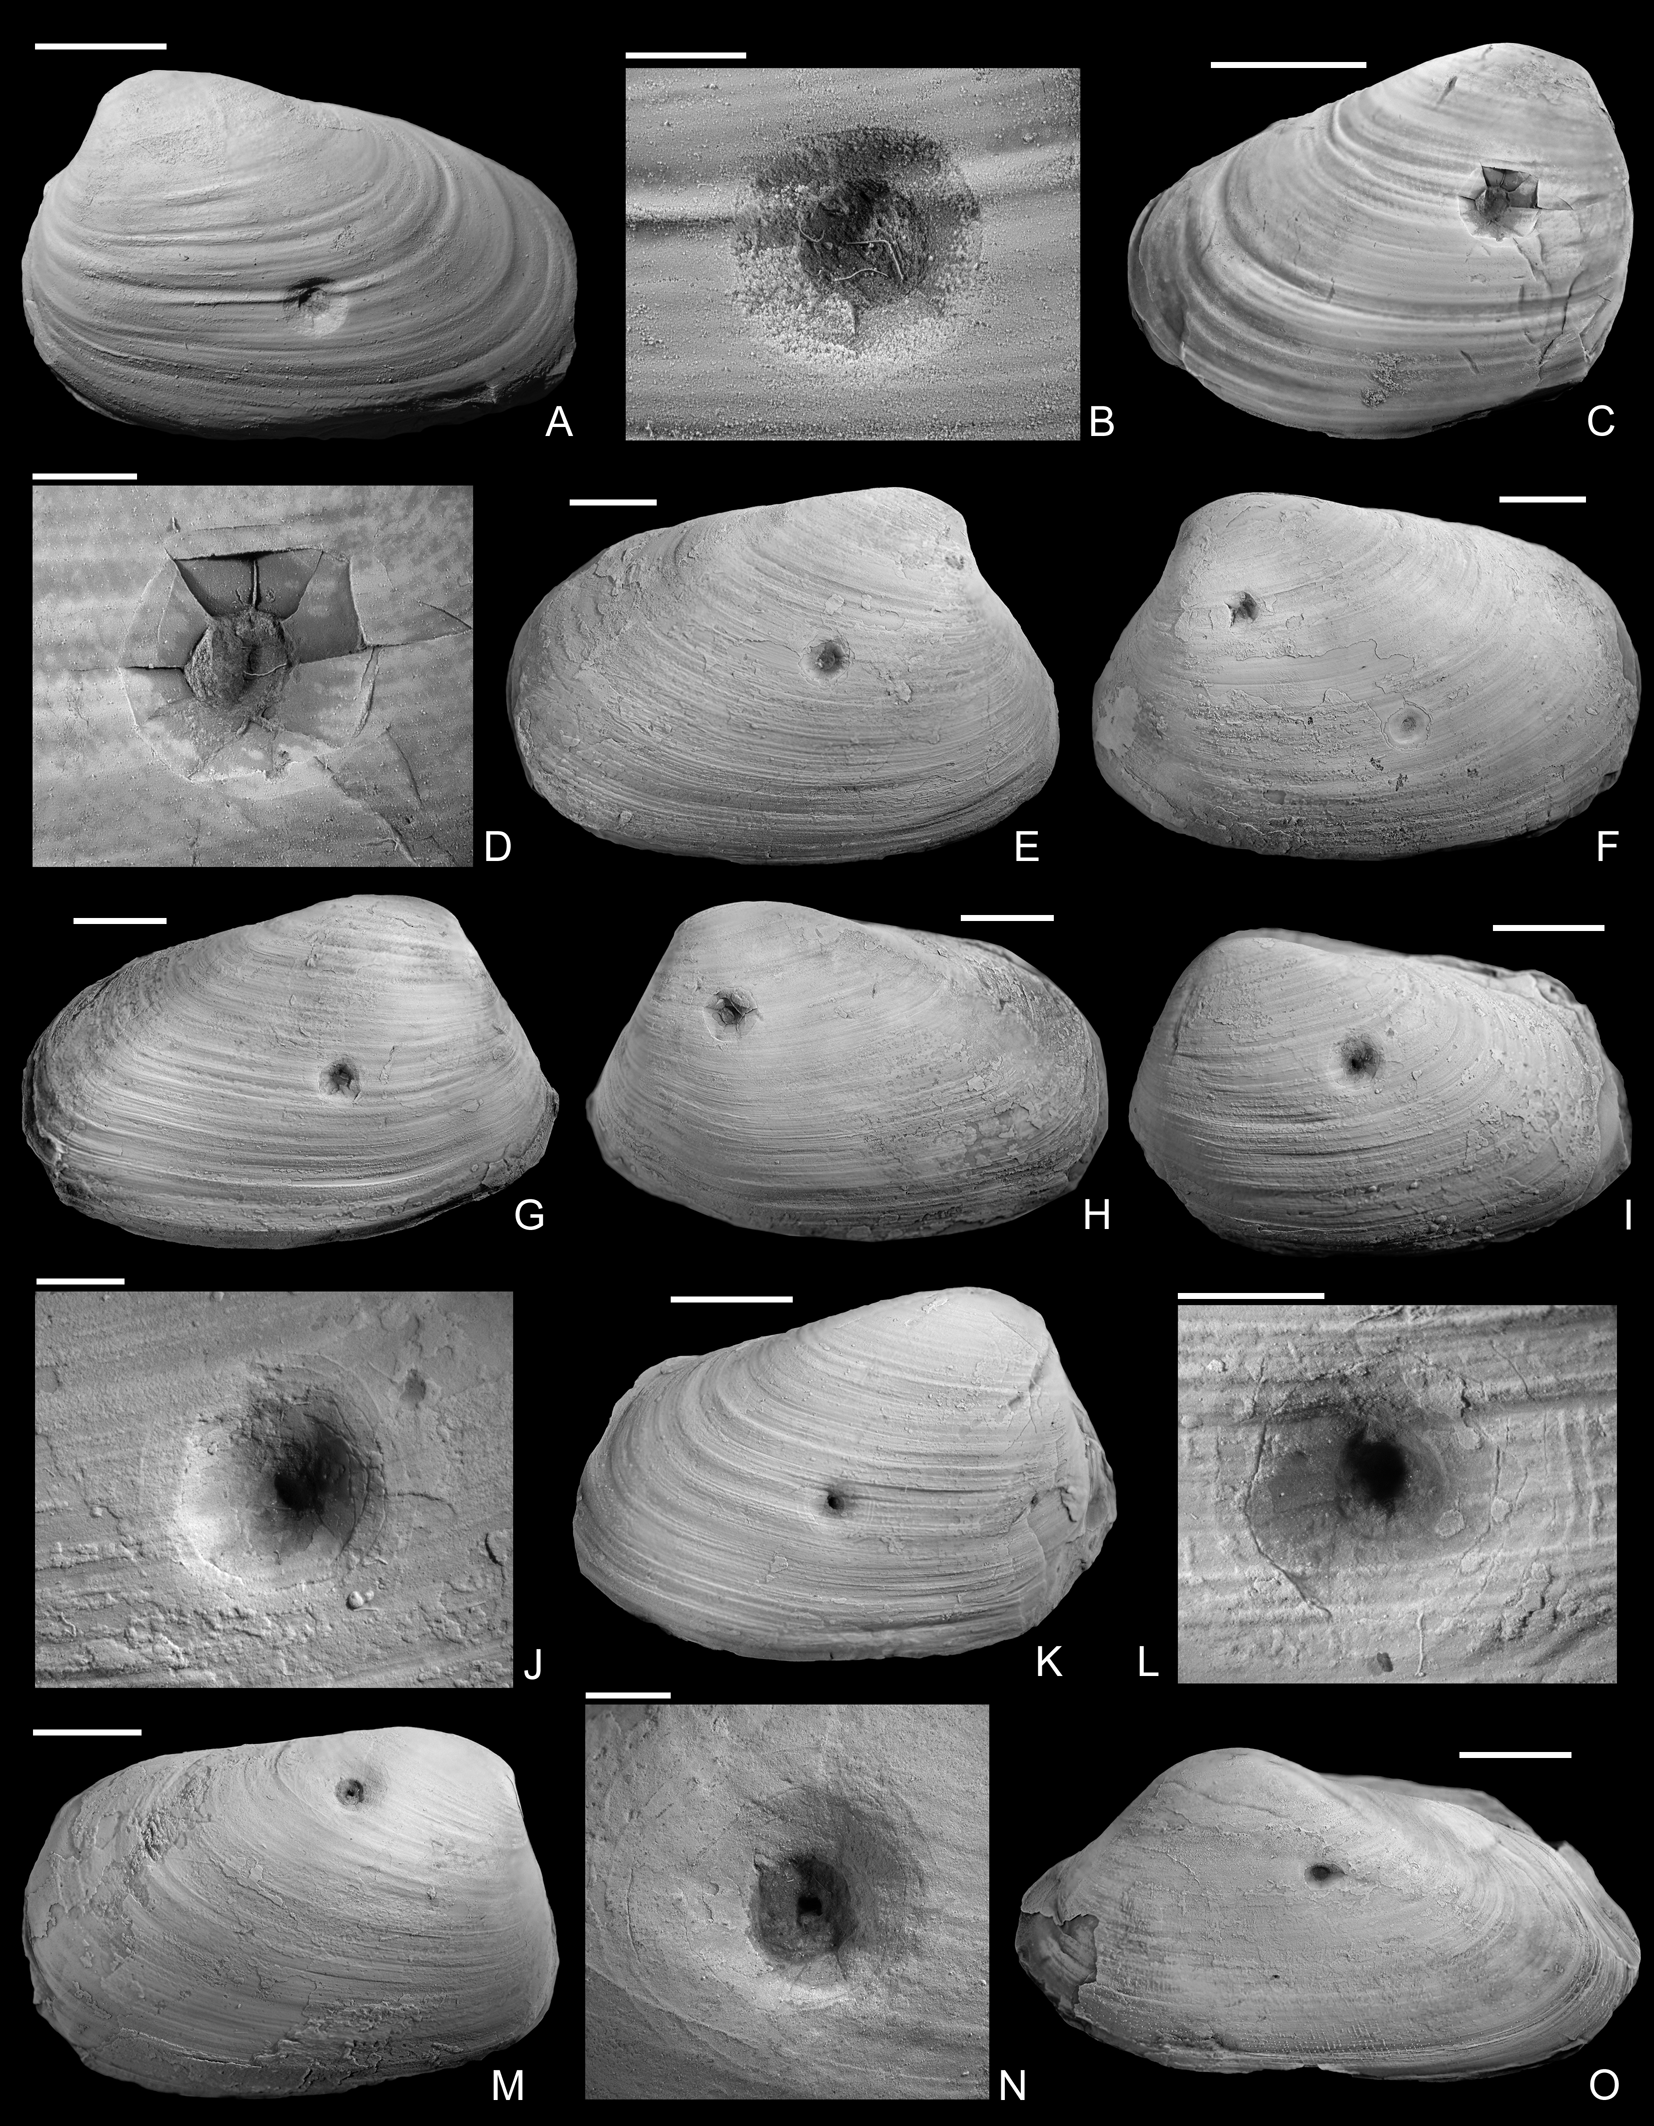
Drilled shells from the upper Pliensbachian (Amaltheus margaritatus Zone) of northern Germany. A, B, Gresslya intermedia (Tate, Reference Tate, Tate and Blake1876), internal mold, namu ES/jl-11443. B, Detail of A. C, D, Gresslya intermedia (Tate, Reference Tate, Tate and Blake1876), internal mold, namu ES/jl-11470. D, Detail of C. E, F, Gresslya intermedia (Tate, Reference Tate, Tate and Blake1876), specimen with three drill holes, namu ES/jl-11468. F, Left valve view, showing two drill holes. G, H, Gresslya intermedia (Tate, Reference Tate, Tate and Blake1876), namu ES/jl-11475. I–L, Gresslya intermedia (Tate, Reference Tate, Tate and Blake1876), SBDD 851. J, Detail of I. L, Detail of K. M, N, Gresslya intermedia (Tate, Reference Tate, Tate and Blake1876), SJSR 850. N, Detail of M. O, Pachymya (Arcomya) arcacea (Seebach, Reference Seebach1864), namu ES/jl-11444. Scale bars, 2 mm (B, D, J, L, N); 10 mm (A, C, E–I, K, M, O).
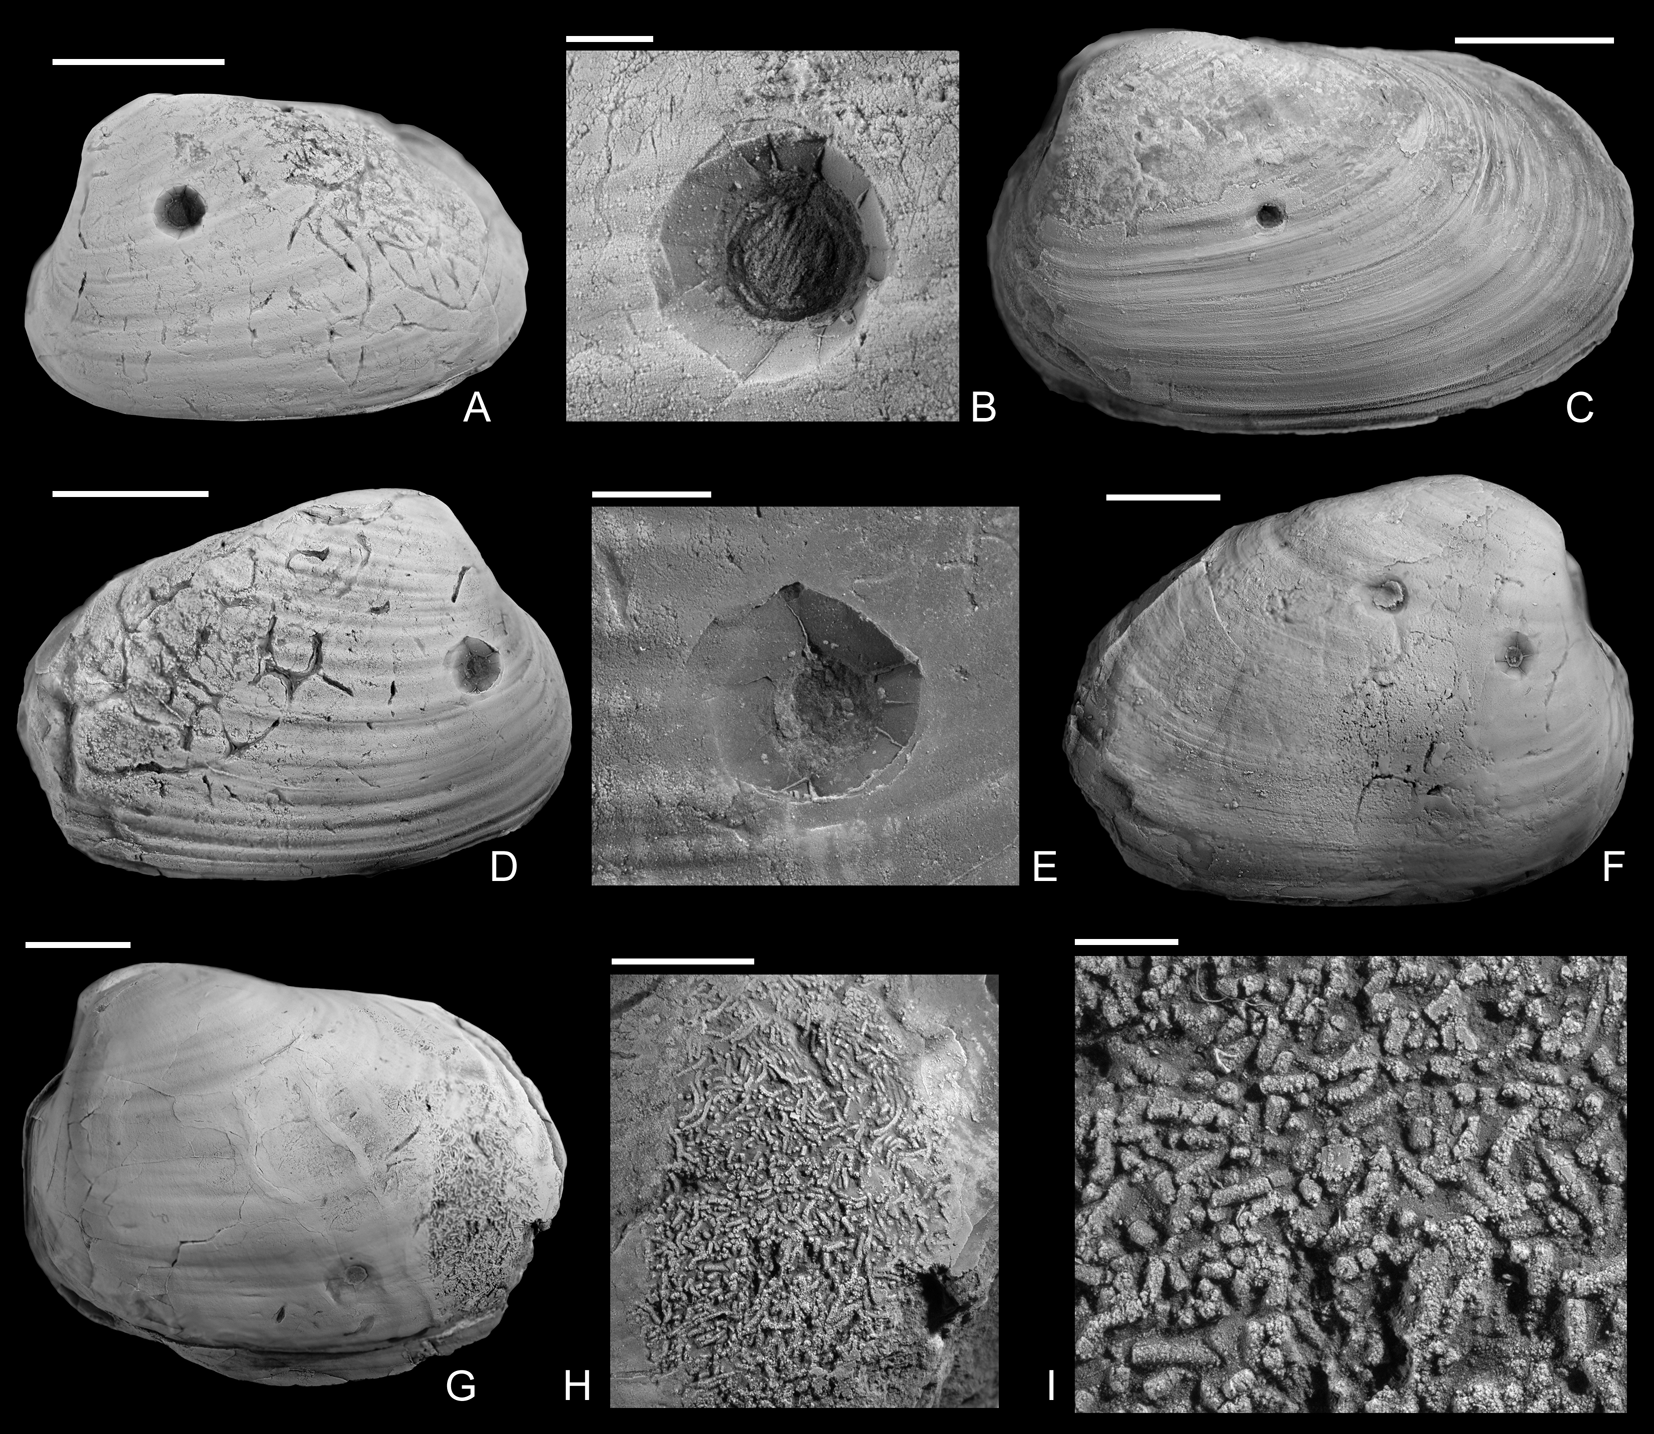
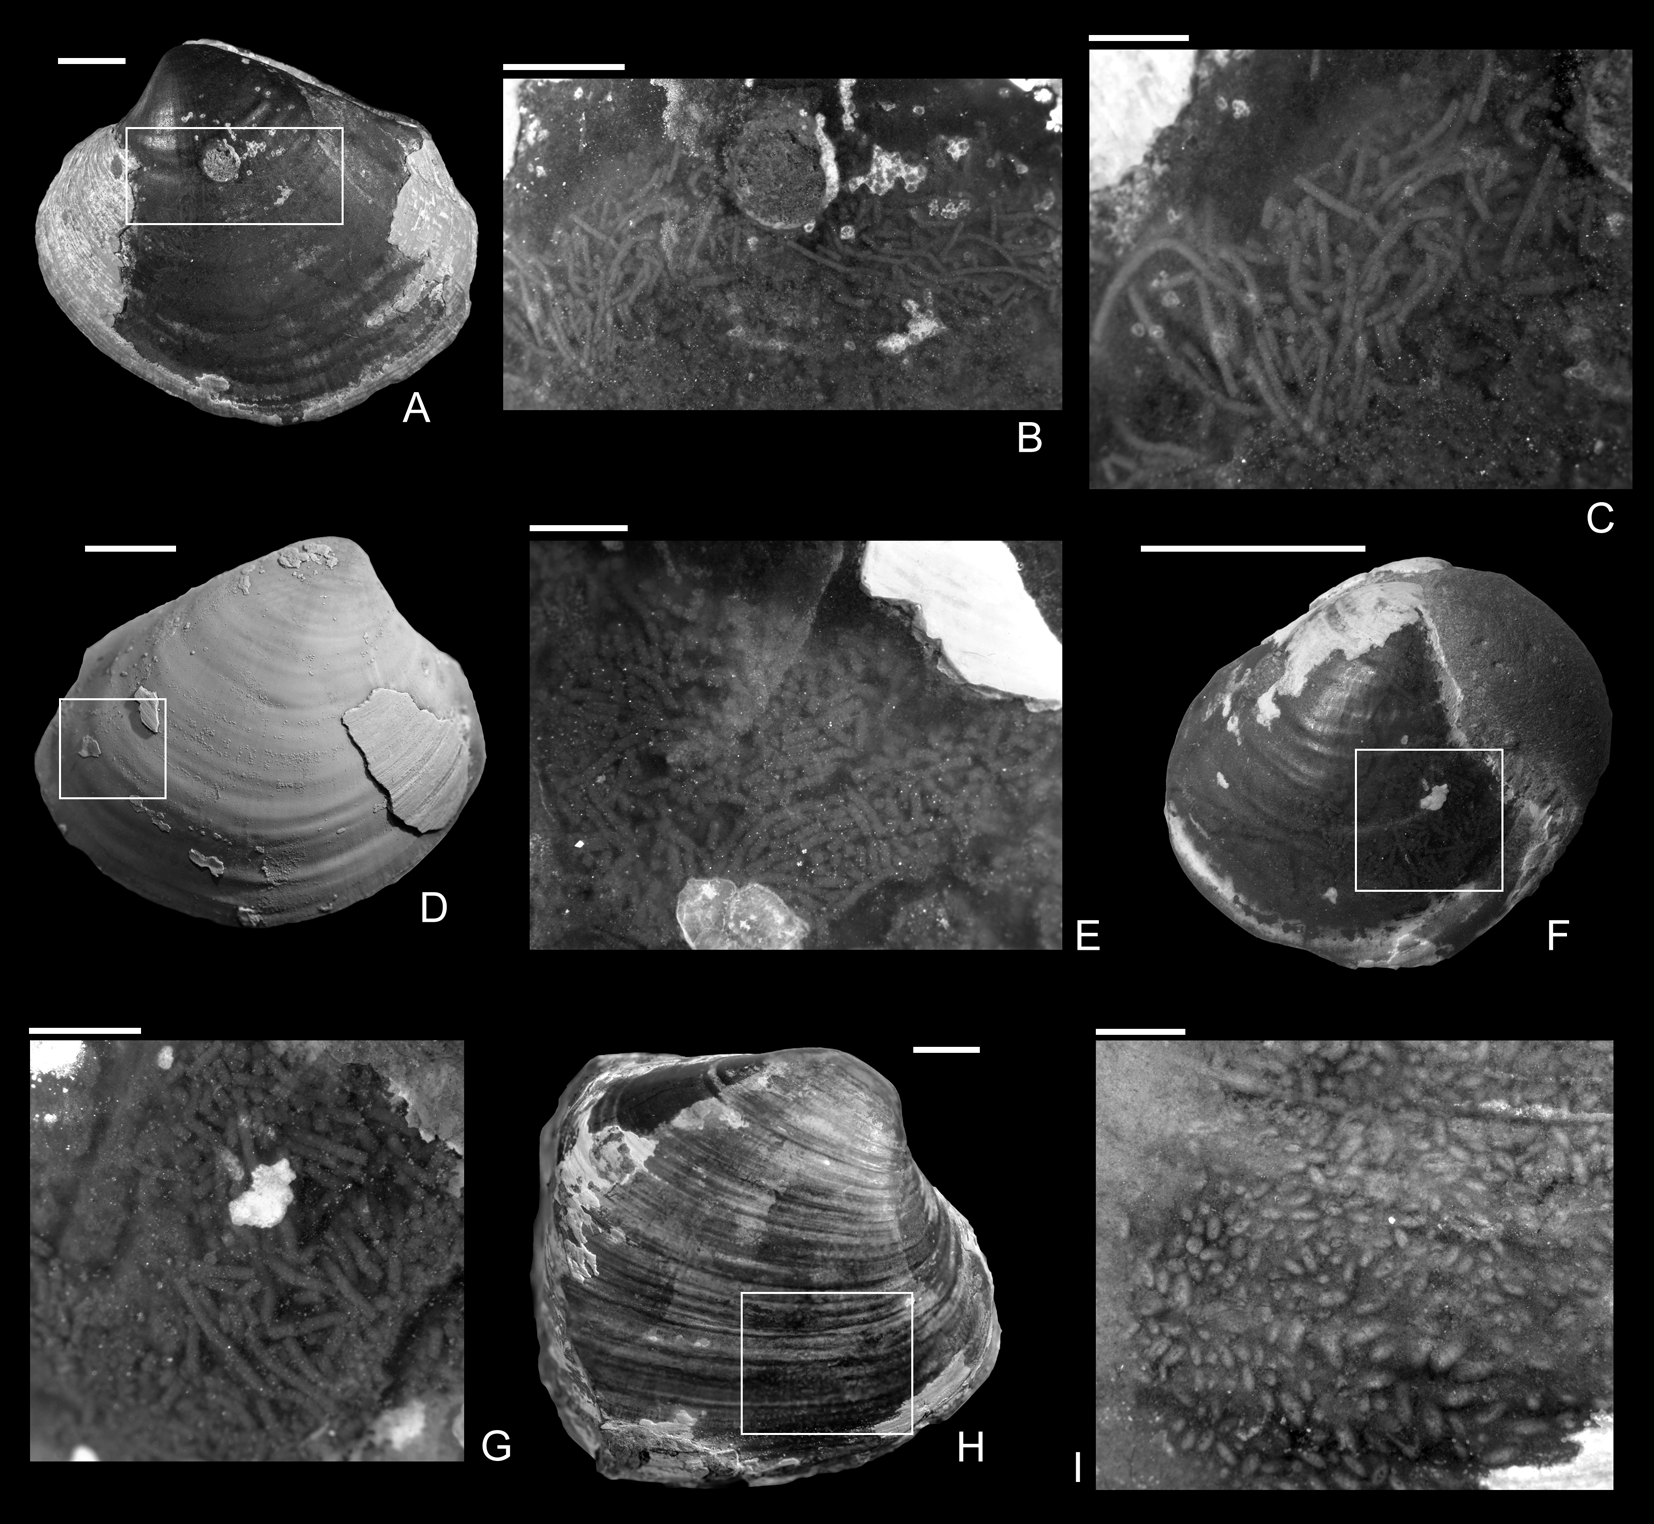
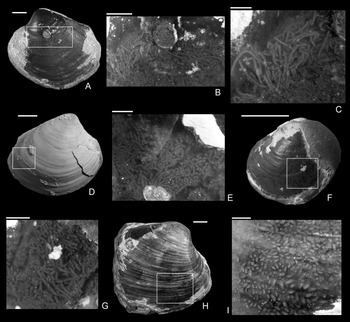
Drilled Gresslya intermedia (Tate, Reference Tate, Tate and Blake1876) from the upper Pliensbachian (Amaltheus margaritatus Zone) of northern Germany. A, B, Internal mold with Arachnostega, namu ES/jl-11471. B, Detail of A. C, namu ES/jl-11447. D, E, Internal mold with Arachnostega, namu ES/jl-11445. E, Detail of D. F, Two drill holes and Arachnostega, namu ES/jl-11446. G–I, Internal mold with rodlike coprolites, namu ES/jl-11448. G, Left valve view, showing the drill hole and coprolites. H, Detail of G. I, Detail of H. Scale bars, 1 mm (B, I); 2 mm (E); 5 mm (H); 10 mm (A, C, D, F, G).
Assemblage frequency (Kowalewski Reference Kowalewski2002) of bivalves collected from the lower Pliensbachian at the same locality (Bonenburg) is estimated to be 2.5% (2 drilled of 80 bivalve specimens). Estimates for the ratio between drilled and non-drilled specimens (lower taxon frequency; Kowalewski Reference Kowalewski2002) within the species G. intermedia varies between 20% and 50% among the upper Pliensbachian localities, with the lowest estimated drilling frequency at Jöllenbeck (20%) and an estimated peak frequency at the localities Grube am Wald (Ledde) and Westerengerstrasse II (40–50%).
The shape of the drill holes is circular, with outer diameter (i.e., diameter of the drill hole measured on the external shell surface) slightly larger than the inner one (i.e., diameter of the drill hole on the internal shell surface) (Figs. 2–4). Therefore, the drill holes are assigned to the ichnotaxon Oichnus paraboloides Bromley, Reference Bromley1981. All drill holes are perpendicular to the valve surface, and they were produced by penetration from the external surface inward, as suggested by the larger outer diameter of the drill holes. Among 33 drilled specimens, three Gresslya specimens exhibit two drill holes on their valves (e.g., Fig. 3G,H), and one Gresslya specimen exhibits three drill holes on its valves (Fig. 3E,F). Among these four specimens with multiple drill holes, one specimen has both holes on the same valve, and three specimens have holes on both valves. All drill holes are complete (the valve is entirely perforated). The outer diameter of the drill holes ranges from 0.9 to 3.4 mm with a median value of 1.76 mm (Appendix S2). The drilled shells of the thin-shelled deep infaunal taxa (Gresslya, Pholadomya, Pleuromya, Arcomya) show a circular collapsed zone around the drill hole with a diameter ranging from 2.32 to 8.45 mm (Figs. 3,4). In some specimens preserved as internal molds, burrowing traces were found (Figs. 3C, 4A,D,F). These traces are assigned to Arachnostega gastrochaenae Bertling, Reference Bertling1992. Additionally, rodlike coprolites were found in the posterior region of one Gresslya specimen (Lü 05, Fig. 4G,I). Similar rodlike structures were found in some of the drilled Eothyasira specimens from southern Germany (Fig. 5A–G).
Coprolites preserved in the internal molds from the upper Pliensbachian (Pleuroceras spinatum Zone) of Buttenheim, southern Germany. A–C, Eothyasira antiqua (Münster in Goldfuss, Reference Goldfuss1841) with a drill hole and rodlike coprolites, SNSB-BSPG 2011 XI 624. B, Detail of A. C, Detail of B. D, E, Eothyasira antiqua (Münster in Goldfuss, Reference Goldfuss1841) with a drill hole (on left valve) and rodlike coprolites, SNSB-BSPG 2011 XI 625. D, Right valve view. E, Detail of D. F, G, Eothyasira antiqua (Münster in Goldfuss, Reference Goldfuss1841), with a drill hole and rodlike coprolites, SNSB-BSPG 2011 XI 545. G, Detail of F. H, I, Gresslya intermedia (Tate, Reference Tate, Tate and Blake1876), without a drill hole but with coprolites (Coprulus isp.), SNSB-BSPG 2011 XI 776. I, Detail of H. Images in A–C, E–I were taken without ammonium chloride. Scale bars, 1 mm (C, E, G); 2 mm (B, I); 5 mm (A, D, F, H).
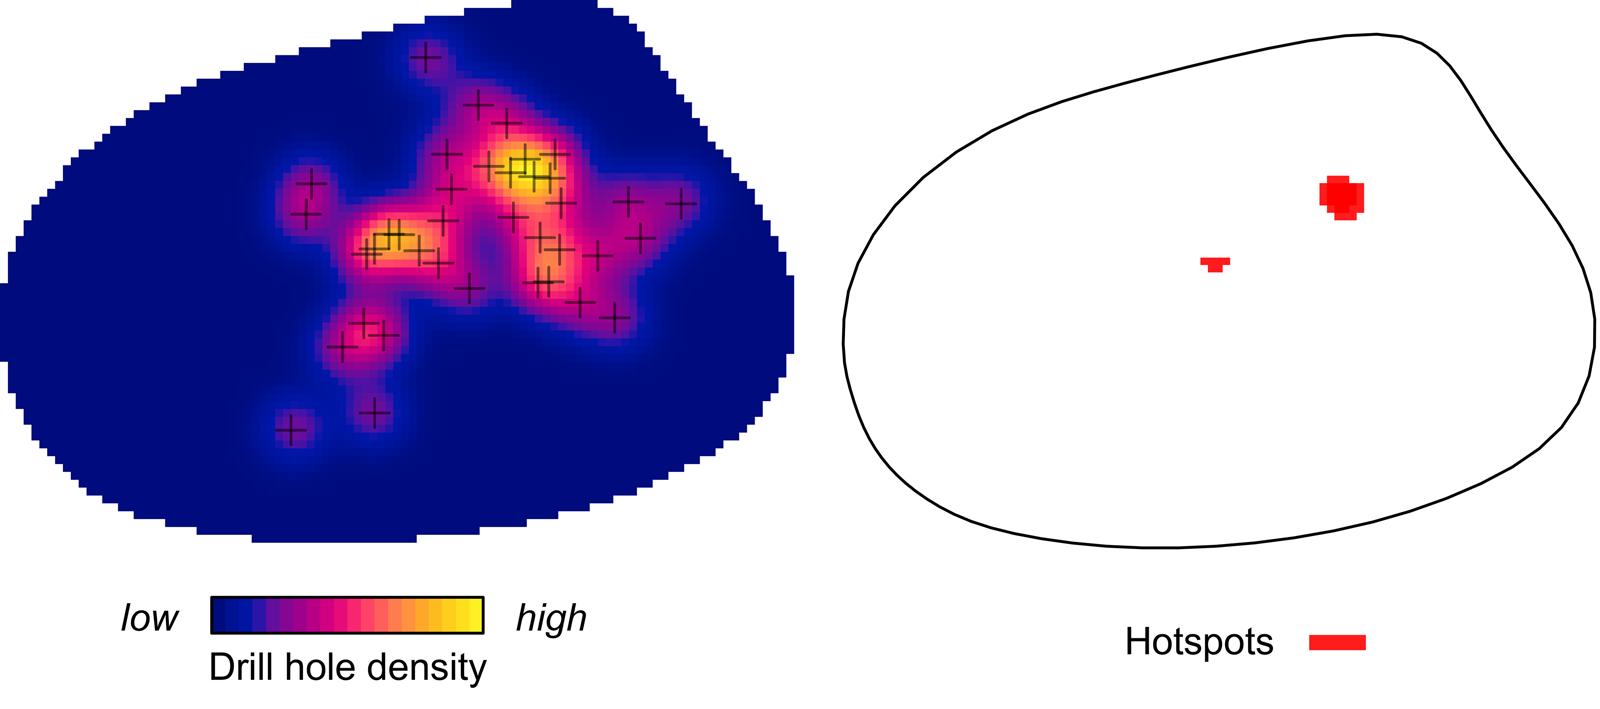
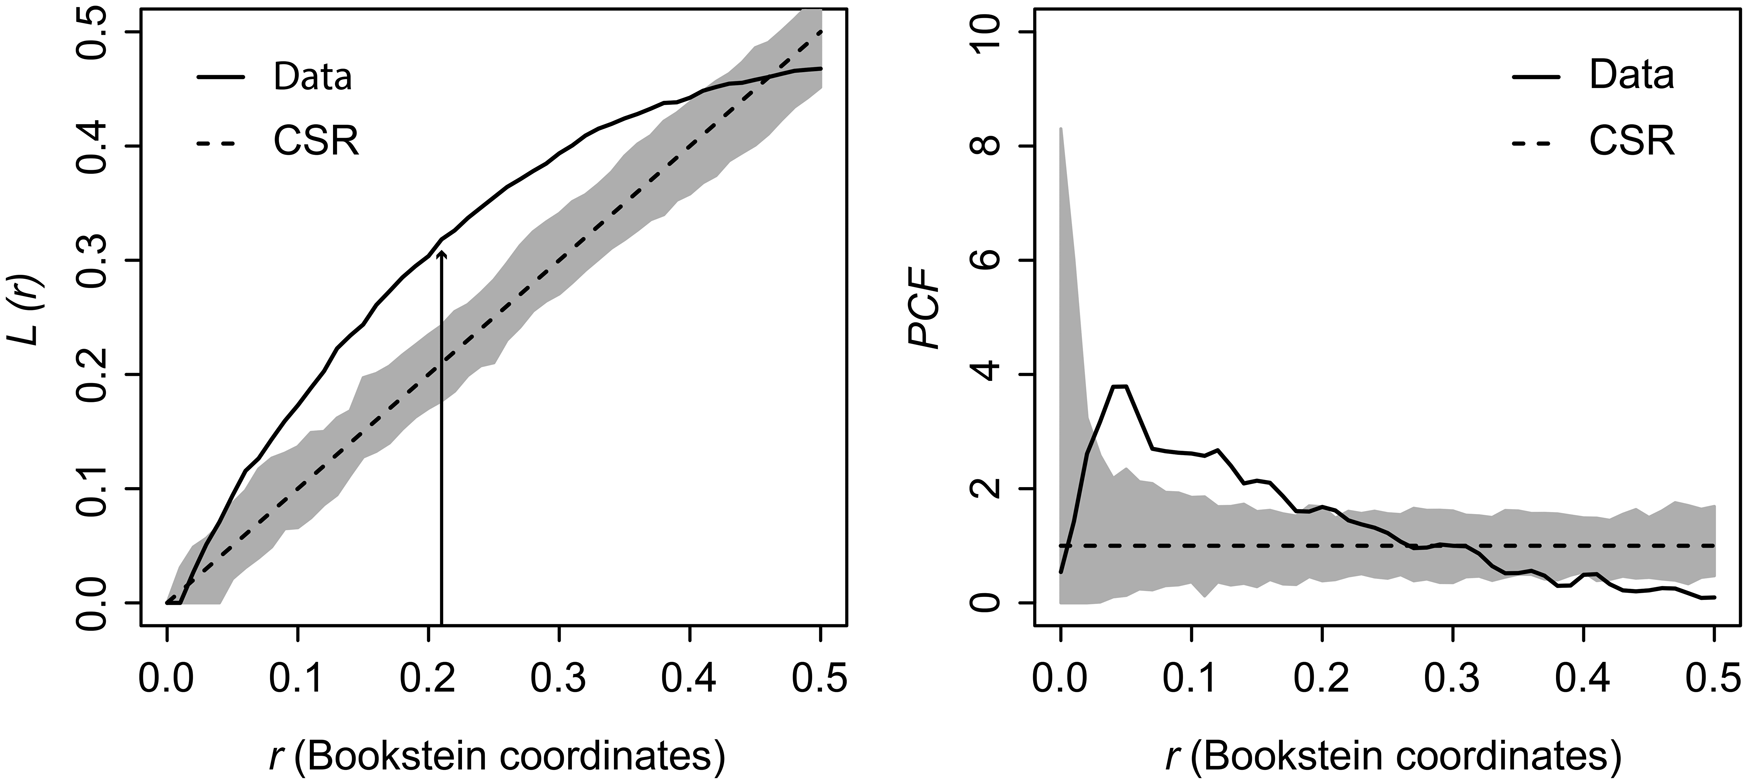
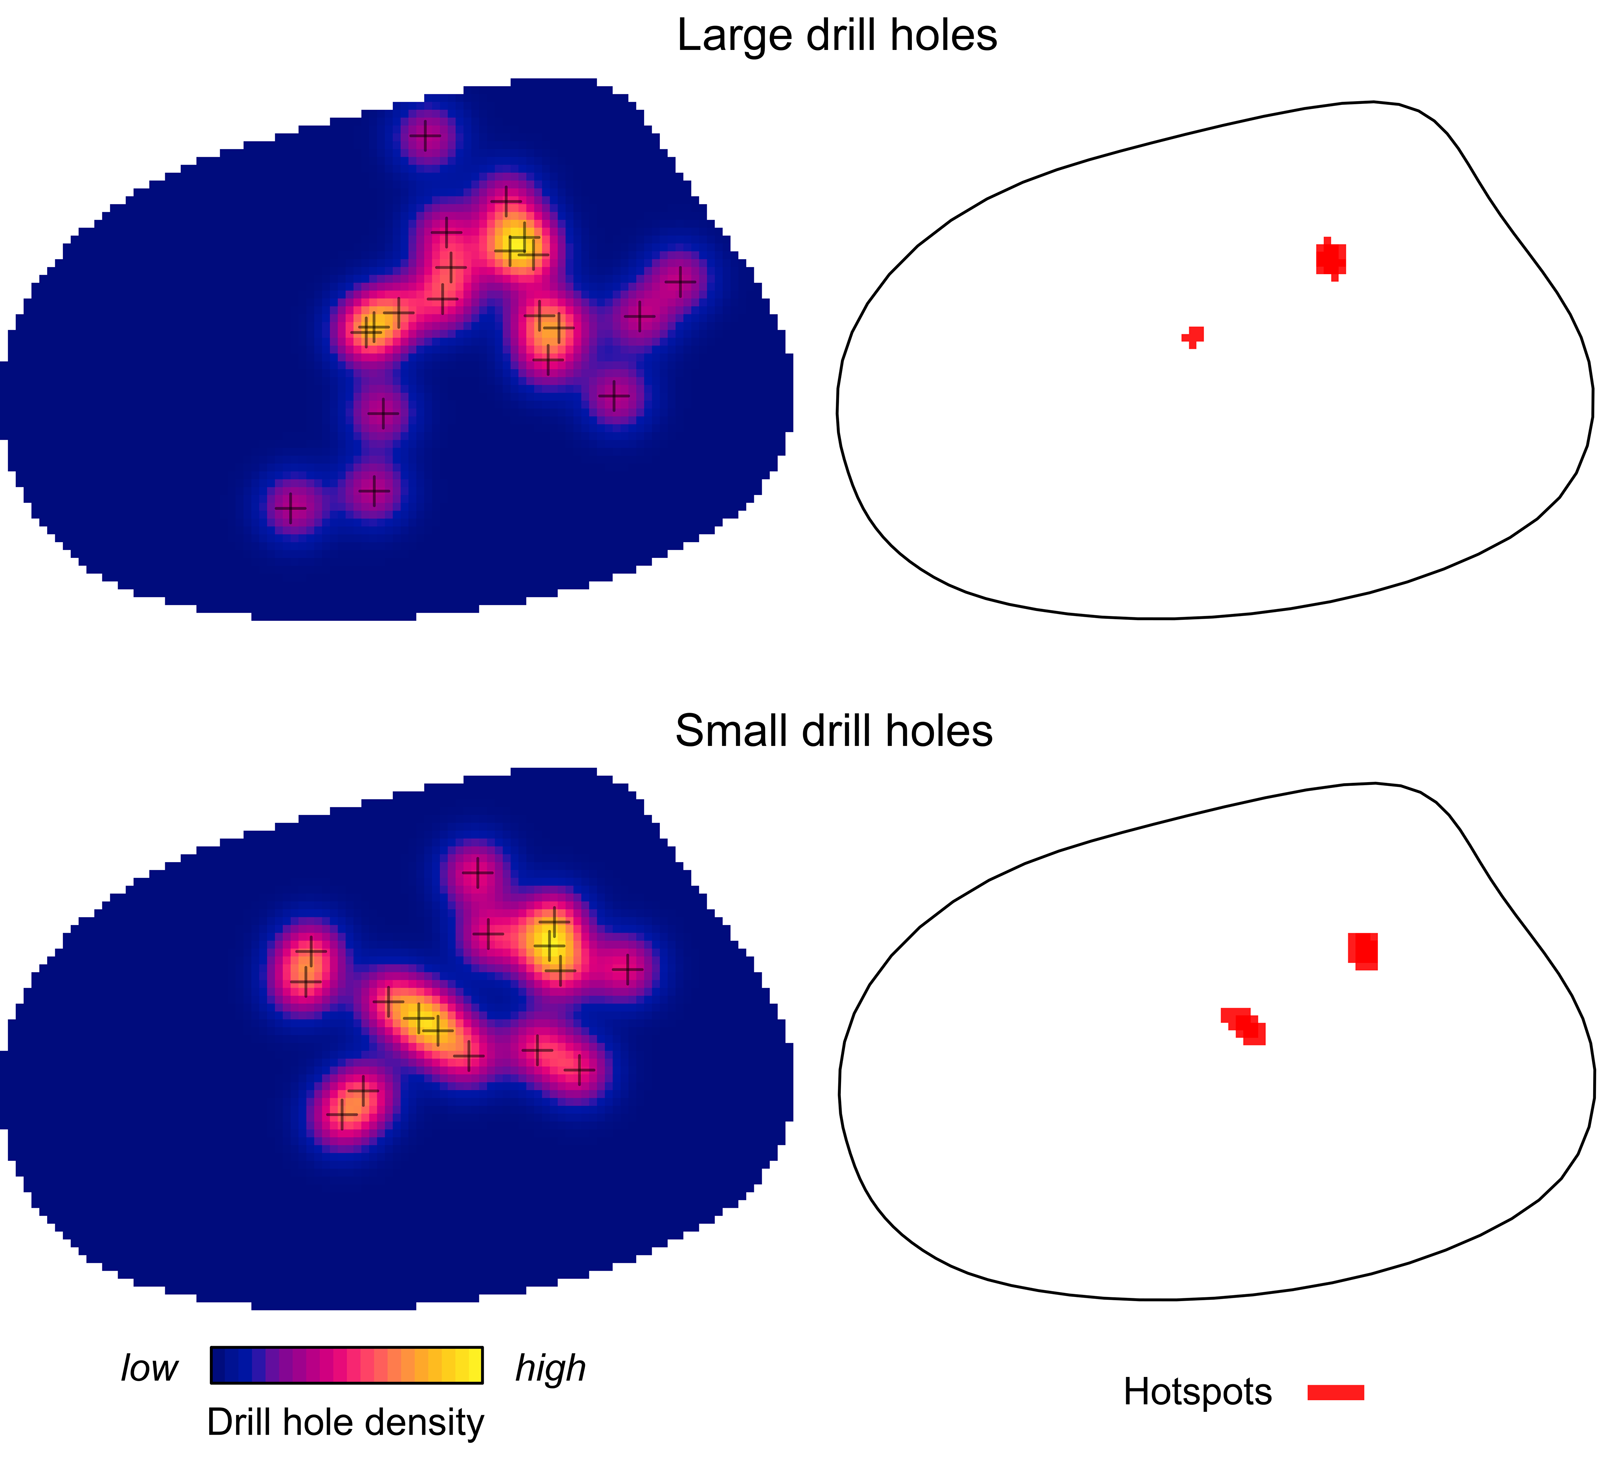
Kernel density mapping shows that areas with higher concentrations of drill holes on G. intermedia are located around the central region of its shell (Fig. 6). Hotspot analysis indicates that two locations account for the highest 10% of kernel estimated values, located close to each other at the central shell region (Fig. 6). The graphical output of the L-function and PCF indicates a significant aggregated pattern of drilling traces across a range of distances on the shell of G. intermedia (Fig. 7) (Diggle-Cressie-Loosmore-Ford test of CSR (goodness-of-fit): u = 0.0008; p << 0.01). The maximum clustering distance is 0.21 Bookstein shape units. Despite observing two hotspots of drilling traces on the prey shell, the L-function does not support a segregated pattern, whereas the PCF indicates only a marginally significant segregated pattern, that is, pairs of traces located at large distances from each other (>0.4 Bookstein shape units) are not farther apart than expected under CSR (Fig. 7). A similar spatial pattern in the distribution of drilling traces on the prey shell also emerges when the point pattern is divided into two subpatterns according to drill-hole size (Figs. 8, 9).
Kernel density and hotspot maps of drill holes on Gresslya intermedia specimens from the upper Pliensbachian. Exact locations of 38 drill holes are denoted with crosses.
Graphical output from the distance-based statistics estimated on Gresslya intermedia specimens from the upper Pliensbachian. L-function and pair-correlation function (PCF). Straight curve (Data) is based on observed data function, dashed line (CSR) is complete spatial randomness function. The dark gray area is the simulation envelope for 999 Monte Carlo simulations of CSR. Black arrow indicates the point of maximum clustering distance (MCD).
Kernel density and hotspot maps of drill holes on Gresslya intermedia specimens for two drill-hole size categories. Exact locations of the large and small drill holes are denoted with crosses.
Graphical output from the distance-based statistics estimated on large and small Gresslya intermedia specimens. L-function and pair-correlation function (PCF). Straight curve (Data) is based on observed data function, dashed line (CSR) is complete spatial randomness function. The dark gray area is the simulation envelope for 999 Monte Carlo simulations of CSR. Black arrow indicates the point of maximum clustering distance (MCD).

Although weak and not statistically significant, there is a positive relationship between the drill-hole diameter (indicator of predator size) and the size of the prey (Spearman's rank correlation: drill-hole diameter vs. shell height, r s = 0.14, p = 0.42; drill-hole diameter vs. shell length, r s = 0.05, p = 0.76; Fig. 10), which might suggest that larger predators tend to target larger prey. On the one hand, the correlation is not as strong as the ones found in Recent assemblages (e.g., Kitchell et al. Reference Kitchell, Boggs, Kitchell and Rice1981; Aristov and Varfolomeeva Reference Aristov and Varfolomeeva2019) and in Cenozoic assemblages (e.g., Kitchell Reference Kitchell, Nitecki and Kitchell1986; Kelley Reference Kelley1988; Kelley and Hansen Reference Kelley, Hansen, Kelley, Kowalewski and Hansen2003 and references therein). On the other hand, the presence of a positive relationship between drill-hole diameter and prey size differs from that of Harper et al. (Reference Harper, Forsythe and Palmer1998), who found no association between drill-hole diameter and prey size in the Pliensbachian of the United Kingdom.
Scatter plot of drill-hole diameter versus shell height. The dashed line represents the linear regression line.
Discussion
Predatory or Parasitic Origin of Drill Holes
Drill holes in fossil shells and other hard substrates from the Lower Jurassic may have had different origins and served different purposes. For example, domichnia were previously reported from the Lower Jurassic, made by bivalves on epifaunal bivalves (Gastrochaenolites; Bassi et al. Reference Bassi, Posenato, Nebelsick, Owada, Domenicali and Iryu2017) and by acrothoracid barnacles on hard substrates (Rogerella) from the Amaltheenton Formation (Keupp and Schweigert Reference Keupp and Schweigert2021). The drill-hole characteristics in the studied specimens—the shape of the drill holes (Oichnus paraboloides), the presence of boreholes on shells of infaunal taxa, and the concentration of holes on certain sites (site selectivity)—do not support their interpretation as domichnia. Additionally, the concentration of drill holes on certain taxa (prey selectivity), the number of holes on each shell (maximum of three), and the absence of continuation of drill holes to the other valve cannot be explained by a producer of domichnia. Parasites may show host or site selectivity, but no parasite producing a large drill hole (0.9–3.4 mm in the present material) on infaunal bivalves has been recorded in Earth's history. Furthermore, it is not certain that a host–parasite relationship can be maintained for a prolonged interval between a deep infaunal bivalve and a large parasite (suggested by the large diameter of the drill hole), because the stability of position in clay sediments is vital for infaunal soft-bottom bivalves. A long-term attachment of a large and heavy parasite would disturb the balance of the bivalve within the soft sediment, and the bivalve would not keep the orientation of its shell and siphon, which is vital for infaunal bivalves for food and oxygen uptake. Drill holes on Recent infaunal bivalves in this size range are produced by predators and mostly by naticid gastropods, which show prey, size, and site selectivity (e.g., Kitchell et al. Reference Kitchell, Boggs, Kitchell and Rice1981; Kelley and Hansen Reference Kelley, Hansen, Kelley, Kowalewski and Hansen2003). As outlined above, no Recent drilling gastropod groups or extinct platyceratid gastropods have been reported from the Lower Jurassic, and particularly from the Amaltheenton Formation (cf. Nützel and Kiessling Reference Nützel and Kiessling1997; Gründel and Nützel Reference Gründel and Nützel1998, Reference Gründel and Nützel2015; Gründel Reference Gründel2007; Schubert et al. Reference Schubert, Gründel and Nützel2008; Nützel and Gründel Reference Nützel and Gründel2015). The drill-hole characteristics (shape, number, aggregation on certain area) and the ecology and identity of the prey are very similar to the predatory drilling interaction between Recent gastropods (especially of naticids) and bivalves (see Klompmaker et al. [2019] for characteristics of predatory drill holes). Therefore, we assume that the drill holes were produced most likely by a predatory gastropod. Given the fact that the drilling habit has evolved independently several times in gastropods (Klompmaker et al. Reference Klompmaker, Kelley, Chattopadhyay, Clements, Huntley and Kowalewski2019: table 2), and at least one drilling gastropod became extinct in the evolutionary history of gastropods (Platyceratidae; Tracey et al. Reference Tracey, Todd, Erwin and Benton1993), it is well possible that the drill holes presented here were produced by a representative of an extinct gastropod group.
Previously, Karapunar et al. (Reference Karapunar, Werner, Fürsich and Nützel2020a) used drill-hole diameter as a proxy for size of a potential gastropod predator from the Amaltheenton Formation in southern Germany and discussed the possible identity of the gastropod predator in that size range. They concluded that the most likely candidate is Hayamia reticulata (Münster in Goldfuss, 1844), which occurs in the same horizons with the drilled specimens from that locality. Hayamia reticulata was preliminarily classified as Neritimorpha but might instead belong to Vetigastropoda or Caenogastropoda (Nützel and Gründel Reference Nützel and Gründel2015). This species was also reported from one of the studied Pliensbachian localities of northern Germany (Jöllenbeck) and from the Pliensbachian of the United Kingdom (Schubert et al. Reference Schubert, Gründel and Nützel2008; Nützel and Gründel Reference Nützel and Gründel2015). As there is no additional evidence for an alternative candidate, we also regard H. reticulata as the most likely producer of the drill holes found in northern Germany. A possible phylogenetic relationship between the drill-hole producers from the Triassic (e.g., Klompmaker et al. Reference Klompmaker, Nützel and Kaim2016) and the Lower Jurassic cannot be proposed, because the identity of the drill-hole producer from the Triassic occurrences is also not known with certainty. Hence, how many times the drilling habit evolved in the early Mesozoic cannot be assessed. The presence of naticid-like drill holes long before the origination of Naticidae (e.g., Ausich and Gurrola Reference Ausich and Gurrola1979; Hoffmeister et al. Reference Hoffmeister, Kowalewski, Baumiller and Bambach2004; Klompmaker et al. Reference Klompmaker, Nützel and Kaim2016; Karapunar et al. Reference Karapunar, Werner, Fürsich and Nützel2020a; this study) or muricid-like drill holes long before the origination of Muricidae (Harper et al. Reference Harper, Forsythe and Palmer1998) corroborates that drilling predation evolved several times in different gastropod groups during Earth's history. The presence of the same drill-hole shapes in the fossil record long before the appearance of modern drilling taxa (e.g., Naticidae and Muricidae) in the fossil record also shows that the shapes of the drill holes are convergent, and identification of the drill-hole producer in the fossil record based solely on drill-hole shape might be erroneous (e.g., interpreting O. paraboloides to be made only by Naticidae).
Behavior of the Predator
Prey Selectivity
There is a remarkable difference in the species composition and diversity of the drilled taxa between the Capricornumergel Formation of the lower Pliensbachian and the Amaltheenton Formation of the upper Pliensbachian. While the drill holes were found in epifaunal, semi-infaunal, and infaunal taxa in the older deposits, they are present only in deep infaunal taxa and almost exclusively in Gresslya in the younger deposits, although semi-infaunal and epifaunal taxa existed throughout the Pliensbachian (Appendix S3). At first glance, this could indicate a presence of different predators specialized on epifaunal and infaunal bivalves. If the epifaunal bivalve Gervillia? and the infaunal bivalves were targeted by different predators, this could indicate the extinction of the epifaunal predator at the end of the early Pliensbachian while the infaunal predator persisted through the late Pliensbachian. However, shape and size of the drill holes (O. paraboloides) are identical in both upper and lower Pliensbachian formations. Furthermore, all specimens were found in similar lithologies (unlithified clay deposits and rarely from clay-ironstone concretions), and upper and lower Pliensbachian formations share similar benthic faunal compositions (Appendix S3), indicating widely similar environmental conditions in both formations (see also Hoffmann Reference Hoffmann1982; Schubert Reference Schubert2007). Therefore, a reasonable interpretation is that the same predator was responsible for the drill holes in the lower and the upper Pliensbachian occurrences in the studied localities. Although all drilled bivalve species occur throughout the Pliensbachian interval in this region, including some of the studied localities (cf. Schubert Reference Schubert2007, Reference Schubert2010; Aberhan et al. Reference Aberhan, Scholz and Schubert2011; Appendix S3), there is a shift in the mode of life of the targeted bivalves between the lower and the upper Pliensbachian. The difference in the life mode of the targeted bivalves may be due to short-term changes in the environmental conditions favoring semi-infaunal and epifaunal taxa in the early Pliensbachian (e.g., slightly firmer substrate) and exclusively infaunal taxa (e.g., distinct soft-bottom conditions) during the late Pliensbachian, and hence prey availability might have played a role. The apparent absence of drill holes in the epifaunal bivalves from the upper Pliensbachian might be due to the scarcity of epifaunal taxa in upper Pliensbachian deposits. However, the fact that the drilled epifaunal and semi-infaunal species of the lower Pliensbachian still occur in the upper Pliensbachian Amaltheenton Formation (cf. Aberhan et al. Reference Aberhan, Scholz and Schubert2011; Appendix S3) indicates a more selective behavior of the predator favoring infaunal taxa as prey. It remains questionable if the here-assumed change in selection of prey taxa is due to a general behavioral change of the predator (e.g., less effort and cost), better protection from nektonic or epifaunal predators when drilling on infaunal prey, or competition with other predators (see “Comparison with the Predator from the Pliensbachian of Southern Germany”).
Site Selectivity
Because of the low number of specimens, the drill-hole sites in the epifaunal and semi-infaunal species of the Tragophylloceras ibex Zone cannot be quantitatively analyzed. The drill holes in Modiolus are located in the mid-part of the shell, either near the anteroposterior ridge (Fig. 1B,D,E) or slightly above that ridge (Fig. 1E). In Gervillia?, they are positioned near the anteroventral ridge in the region of the umbo. With respect to the semi-infaunal life habit of Modiolus (Stanley Reference Stanley1970) and the epifaunal to semi-infaunal life habit of Gervillia? (Muster Reference Muster1995; Ros Franch et al. Reference Ros-Franch, Márquez-Aliaga and Damborenea2014), the drill-hole sites are close to the substrate, suggesting that the predator might have attacked the prey from within the sediment. The drill holes in the Modiolus specimens are located in the central part of the shells. This region might be preferred because the most nutritious organs are located in that region (e.g., Hughes and Dunkin Reference Hughes and Dunkin1984). The drilled site in Gervillia? is near the umbo, which represents the most inflated part of the shell and might yield a large portion of the soft tissue, but it is also a relatively thick shell region, which would increase the drilling time and the energy spent for drilling. Unlike the targeted infaunal taxa with slow motility (Gresslya, Pleuromya, Pholadomya; Ros Franch et al. Reference Ros-Franch, Márquez-Aliaga and Damborenea2014), these byssate taxa (Modiolus, Gervillia?) might have been easier to prey on because they were not motile. However, longer drilling time (due to drilling a thicker shell) and being partially exposed in the substrate (when preying on semi-infaunal taxa) might expose the epifaunal driller to danger from epifaunal predators or impose a greater energy cost if disturbed during drilling (see further discussion below).
Concerning the infaunal species Gresslya intermedia from the upper Pliensbachian (Amaltheus margaritatus Zone and Pleuroceras spinatum Zone), SPPAT shows a concentration of drill holes on the central shell region. In contrast with a previous study of predation by naticid gastropods on bivalve prey (Rojas et al. Reference Rojas, Hendy and Dietl2015, Reference Rojas, Dietl, Kowalewski, Portell, Hendy and Blackburn2020), distance-based statistics do not support segregated patterns. The central shell region in Gresslya represents the region with more inflation and also the region where most soft tissues (gonads, stomach) were probably located, while the posterior region was mostly filled with the siphon. The Recent muricid species Nucella lapillus drills on sites where more nutritious and more easily digestible parts are located, instead of a site where it can drill faster (Hughes and Dunkin Reference Hughes and Dunkin1984). The energy gain per unit time is also important for prey selection in muricids (Averbuj et al. Reference Averbuj, Büchner-Miranda, Salas-Yanquin, Navarro, Pardo, Matos, Pechenik and Chaparro2021). The muricid N. lapillus can reach all soft tissues with its proboscis irrespective of where it drills (Hughes and Dunkin Reference Hughes and Dunkin1984), but it is not clear if the Amaltheenton predator had such a long proboscis and could reach all soft body parts (see also discussion below). Naticids also show site selection and drill in the umbonal or central shell regions of the bivalve prey (Harper and Kelley Reference Harper and Kelley2012). However, the location of drill holes might also be related to the anatomy of naticids (Calvet Reference Calvet1992). Taking these examples from the Recent into account, the site selectivity of the Amaltheenton predator on infaunal bivalves was likely related to energy gain per unit time. The degree to which the soft anatomy of the predator played a role in site selectivity is not known.
If there is an improvement in site selectivity through the life span of individuals of the predator species, drill holes produced by older (larger) predators might show a more distinct site selectivity compared with the drill holes made by younger predators (e.g., Hughes and Dunkin Reference Hughes and Dunkin1984: table 2), or younger and older individuals of a predator species might select different sites on shells for drilling (e.g., Rojas et al. Reference Rojas, Hendy and Dietl2015: fig. 3B,C). Similar aggregated patterns in the distribution of drill holes on G. intermedia are observed when the underlying drilling data are divided into small and large size classes according to the drill-hole diameter (Figs. 8, 9). SPPAT suggests that there was no significant difference in site-selective behavior between the younger and older predators (inferred by drill-hole size).
The deep infaunal bivalves such as G. intermedia, Pleuromya costata, and Pholadomya ambigua have slightly gaping posterior ends (cf. Karapunar et al. Reference Karapunar, Werner, Fürsich and Nützel2020b). Some Recent predatory gastropods are able to use this posterior gape to reach the soft tissue of their prey (e.g., muricids on gaping bivalves [Kent Reference Kent1981]; naticids on Ensis and Solen [Frey et al. Reference Frey, Howard and Hong1986]) instead of spending energy for drilling. However, this procedure requires a long proboscis in the case of muricids. The high incidence of drill holes on G. intermedia might indicate that the Lower Jurassic predator did not have such long proboscis or the ability to reach the soft body through the gape and needed to drill the central part of the shell to reach the nutritious soft parts of its prey.
Modern experiments and field observations indicate that drilling and consumption can take hours to days for Recent predators (Kitchell et al. Reference Kitchell, Boggs, Kitchell and Rice1981; Averbuj et al. Reference Averbuj, Büchner-Miranda, Salas-Yanquin, Navarro, Pardo, Matos, Pechenik and Chaparro2021). Given the thin shell of Gresslya, drilling time might not have lasted days. However, keeping the prey stable while drilling is important for the predator to be able to complete drilling. When a gastropod is disturbed during drilling, it cannot reoccupy the previously unfinished drill hole and starts drilling anew (Kitchell et al. Reference Kitchell, Boggs, Kitchell and Rice1981). If a predator encounters any disturbance, a drilling attempt might become unsuccessful and might result in incomplete drill holes (e.g., Klompmaker et al. Reference Klompmaker, Nützel and Kaim2016). Being stationary, attached to the substrate with their byssus, the drilled epifaunal bivalve taxa probably could not disturb the predator during drilling. However, drilling on epifauna might bring other dangers, such as disturbance by other predators. All studied drill holes on preserved shell material are complete, which suggests that all predators were successful. However, the absence of original shell material in several specimens lowers the probability of detecting incomplete drill holes, if any, because incomplete drill holes do not leave any impression on internal molds. Recent naticids wrap their prey with their foot to immobilize the prey (Visaggi et al. Reference Visaggi, Dietl and Kelley2013). There is no gastropod from the Amaltheenton Formation known to have a soft body potentially large enough to wrap a Gresslya specimen completely. On the other hand, the predator may have profited from pustules to attach the prey firmly. Pustules on the external shell surface are a common feature of the drilled deep infaunal taxa (e.g., Gresslya, Pholadomya, Pleuromya, Arcomya; Karapunar et al. Reference Karapunar, Werner, Fürsich and Nützel2020b). The function of pustules is thought to be to increase the friction on shell surface to keep the shell stable within the sediment (Checa and Harper Reference Checa and Harper2010). The pustules might have helped predators to grip the prey.
Comparison with the Predator from the Pliensbachian of Southern Germany
Despite the differences in stratigraphic age there are some reasons to assume that the predator from the Pliensbachian of northern Germany is identical to the predator recorded from the upper Pliensbachian of southern Germany (Karapunar et al. Reference Karapunar, Werner, Fürsich and Nützel2020a). The common features in both regions are the drill-hole shape, an infaunal life habit of most drilled prey at least in the upper Pliensbachian, and the generally similar argillaceous soft substrate. The lateral continuation of the same stratigraphic unit (the Amaltheenton Formation) further suggests uninterrupted connection of the same environment in the northern and southern settings, at least during the late Pliensbachian. One argument against the assumption of the same identity is the difference in the range of drill-hole diameters in both settings (0.9–3.4 mm, median 1.76 mm in Gresslya [this study]; 0.7–2.9 mm, median 1.4 mm in Eothyasira [Karapunar et al. Reference Karapunar, Werner, Fürsich and Nützel2020a]; the median drill-hole sizes are significantly different, Kruskal-Wallis test, H = 18.34, p < 0.05). This difference might indicate different predators in the two settings. However, the size difference might have been caused by the different size–frequency distributions of populations of the same species in different settings (see below). The specimens from both regions (southern and northern Germany) exhibit completely perforated holes and occasionally multiple holes. Among the drilled Eothyasira specimens, 14% exhibit two drill holes either on the same valve or on both valves (Karapunar et al. Reference Karapunar, Werner, Fürsich and Nützel2020a). In the case of Gresslya specimens from the studied localities, 13% exhibit multiple drill holes. Three Gresslya specimens exhibit two drill holes, and one specimen exhibits three drill holes, again either on the same or on both valves. The diameters of the multiple drill holes on Gresslya differ, which suggests that the holes were produced by different individuals, a pattern also inferred from the drilled Eothyasira from southern Germany. Karapunar et al. (Reference Karapunar, Werner, Fürsich and Nützel2020a) previously concluded that the predator from the Amaltheenton Formation from southern Germany was prey selective, because the drill holes were found only in two bivalve taxa and almost exclusively on the chemosymbiotic deep infaunal bivalve Eothyasira antiqua. According to Karapunar et al. (Reference Karapunar, Werner, Fürsich and Nützel2020a) the predator was selecting Eothyasira because of its large size compared with other infaunal taxa (e.g., nuculanids). Gresslya is one of the largest species in the Amaltheenton Formation and occurred in both northern and southern settings but is rarer in the south. The reason for the strong selection of Gresslya as prey in the studied occurrences from the upper Pliensbachian of northern Germany could be the large size but also the thin shell. Indeed, the thin shells of deep infaunal bivalves are explained by the reduction of predation on deep infauna (Stanley Reference Stanley1988), but the Amaltheenton predator seemingly explored this previously unoccupied niche. Both the large size and thin shell favor benefit in the cost–benefit ratio (Kitchell et al. Reference Kitchell, Boggs, Kitchell and Rice1981).
Assuming that the drill holes were produced by the same predator taxon in the upper Pliensbachian of southern and northern Germany, it is remarkable that this predator preyed exclusively on Gresslya in northern Germany (A. margaritatus Zone and P. spinatum Zone) while it preyed exclusively on Eothyasira in southern Germany (the P. spinatum Zone). Karapunar et al. (Reference Karapunar, Werner, Fürsich and Nützel2020a) discussed that large prey size was an important factor in prey selection for the predator in the southern Germany but also questioned why other large infaunal taxa (e.g., Gresslya, Pholadomya, Pleuromya, Arcomya) lack drill holes in southern Germany if prey size was the primary factor in prey selection. These large infaunal taxa are very rare in the southern setting (Karapunar et al. Reference Karapunar, Werner, Fürsich and Nützel2020b). Similarly, Eothyasira, the taxon exclusively drilled in southern Germany, is absent in northern Germany. Thus, prey availability based on general species presence and minor differences in environmental conditions might have played a role in prey selectivity along with size. It is notable that the predator in southern Germany did not drill any epifaunal taxon, although epifaunal species were diverse and abundant (Karapunar et al. Reference Karapunar, Werner, Fürsich and Nützel2020b). One shared feature between the drilled infaunal taxa from northern Germany (Gresslya, Pholadomya, Pleuromya, Arcomya) and Eothyasira is the presence of tiny pustules on the shell (Karapunar et al. Reference Karapunar, Werner, Fürsich and Nützel2020a: fig. 7E; Karapunar et al. Reference Karapunar, Werner, Fürsich and Nützel2020b: plate 18, fig. 6, plate 19, figs. 2,5). Whether the predator recognized the prey based on these pustules might be speculative, but they could have helped the predator to tightly grip the shell (see “Site Selectivity”). Recent predators use chemical cues in locating their prey: scent trails, and vibrations created by the prey (Croll Reference Croll1983; Hughes Reference Hughes1985). Similar tracking methods can be assumed to have been employed by the predator in the Lower Jurassic.
The individuals belonging to the same bivalve taxa are larger in the older sediments of the Amaltheenton Formation in northern Germany than the individuals from younger sediments of the Amaltheenton Formation in southern Germany (Aberhan et al. Reference Aberhan, Scholz and Schubert2011; Karapunar et al. Reference Karapunar, Werner, Fürsich and Nützel2020b; B.K. and W.W., personal observation). Even the species endemic to southern Germany are small compared with the widely distributed co-occurring species from the same genus (Karapunar et al. Reference Karapunar, Werner, Fürsich and Nützel2021). Smaller size can be an adaptation to finer sediment grain size, less oxygen availability (Fürsich et al. Reference Fürsich, Karapunar, Werner and Nützel2020), and higher temperature (Piazza et al. Reference Piazza, Duarte, Renaudie and Aberhan2019, Reference Piazza, Ullmann and Aberhan2020). The size difference suggests that the Amaltheenton environment at northern settings was more oxygenated, the substrate had larger grain size, and the fauna had less physiological stress. Higher species diversity of bivalves in southern settings indicates more favorable conditions, but the recorded diversity might be also biased by the excessive sampling effort (Karapunar et al. Reference Karapunar, Werner, Fürsich and Nützel2020b). Presence of Arachnostega in the northern Amaltheenton (see also “Taphonomic Features of the Drilled Specimens”) might indicate a relatively colder climate (cf. Vinn et al. Reference Vinn, Wilson, Zatoń and Toom2014). Not only the size of bivalves, but also the median size and upper size range of the drill holes are larger in the north, suggesting that a larger size was also attained by the predator.
As already mentioned above for the localities in northern Germany, there is a remarkable change from drilled epifaunal, semi-infaunal, and infaunal species in the lower Pliensbachian T. ibex Zone to exclusively infaunal (mostly deep infaunal) drilled species in the upper Pliensbachian. This feature seems to be confirmed by the exclusive presence of drill holes in infaunal species in the upper Pliensbachian of southern Germany. As the concerned epifaunal and semi-infaunal bivalve species are recorded through the whole Pliensbachian, this change can be best explained by a change in prey selection by the assumed gastropod predator through time. The focus on infaunal prey in the upper Pliensbachian reflects a more specialized adaptation of the predator.
Drilling is a slow process and makes the predator itself vulnerable to predation (Vermeij Reference Vermeij1987: pp. 167–173). It is interesting that the early Mesozoic drillers attacked largely infaunal taxa (e.g., Harper et al. Reference Harper, Forsythe and Palmer1998; Klompmaker et al. Reference Klompmaker, Nützel and Kaim2016; Karapunar et al. Reference Karapunar, Werner, Fürsich and Nützel2020a; this study). This is in contrast to the Paleozoic drilling organisms, which were epifaunal parasites (e.g., platyceratid gastropods; Baumiller and Gahn Reference Baumiller and Gahn2002; Thomka and Brett Reference Thomka, Brett, Baets and Huntley2021) or epifaunal predators (e.g., Ausich and Gurrola Reference Ausich and Gurrola1979; Hoffmeister et al. Reference Hoffmeister, Kowalewski, Baumiller and Bambach2004). The increase in infaunalization of bivalves through the Norian (Late Triassic) was explained by the proliferation of durophagous predators (Tackett and Bottjer Reference Tackett and Bottjer2012). Similarly, the low frequency of drill holes in the Late Triassic was explained by the prevalence of durophagous predators (Tackett and Tintori Reference Tackett and Tintori2019). The Jurassic also shows an increase in infaunalization, which is suggested by the increase in the number of boring ichnogenera and ichnoguilds (Wilson Reference Wilson and Miller2007; Buatois et al. Reference Buatois, Mángano, Desai, Carmona, Burns, Meek and Eglington2022). This increase in infaunalization is in part considered to be a response to an increase in predation pressure (Wilson Reference Wilson and Miller2007), but an unequivocal link between the predation and infaunalization in the early Mesozoic has not yet been established (Buatois et al. Reference Buatois, Mángano, Desai, Carmona, Burns, Meek and Eglington2022). If infaunalization was caused by an increase in predation from the Late Triassic to Early Jurassic, the occupation of infaunal environment by the drilling organisms at this time might also have been caused by the durophagous predation, which may have imposed predation pressure on the drillers as well.
There can be a latitudinal gradient in predation, either increasing toward the equator (Kelley and Hansen Reference Kelley and Hansen2007; Visaggi and Kelley Reference Visaggi and Kelley2015) or poleward (Vermeij et al. Reference Vermeij, Dudley and Zipser1989). Considering that the drill-hole data from the Pliensbachian are scarce and diachronic, comparison of the drill-hole record of three localities (20.4% of astartids from the T. ibex Zone in Blockley, southwest England [Harper et al. Reference Harper, Forsythe and Palmer1998]; estimated as 2.5% of total bivalve specimens from the T. ibex Zone and 20–50% of Gresslya specimens from the A. margaritatus Zone of northern Germany [this study]; 0.8% of total bivalve specimens; 81% of Eothyasira specimens from the P. spinatum Zone of southern Germany [Karapunar et al. Reference Karapunar, Werner, Fürsich and Nützel2020a]) suggests an increase in within-species drilling frequency from northern to southern and from older to younger strata. The observed pattern might have been created by specialization in prey selectivity rather than being linked to the latitudinal gradient. However, the data are not reliable enough to draw far-reaching conclusions.
Taphonomic Features of the Drilled Specimens
A remarkable feature is the presence of a collapsed zone around the drill holes in thin-shelled infaunal taxa (Gresslya, Pholadomya, Pleuromya, Arcomya). One might assume that the predator was responsible for this collapse. However, in that case, the broken parts would not be preserved in situ because of the sediment infill into the shell after drilling was complete. The collapsed zones are obviously postmortem deformations of the shell when the shells were already filled with sediments. The sediments most likely entered the shell through the narrow posterior gape and the drill hole (suggested by articulated preservation of the shells). The drill hole weakened the area around the hole against stress load imposed by burial and compaction, most likely creating such collapses (cf. Roy et al. Reference Roy, Miller and LaBarbera1994).
Apart from the drill holes, burrowing traces (Arachnostega gastrochaenae) are found on internal molds (Figs. 3C, 4A,D,F). Arachnostega is interpreted as feeding traces produced by polychaetes (Bertling Reference Bertling1992) and is recorded from the Ordovician onward (Toom et al. Reference Toom, Vinn and Hints2019). Previously, Brunthansová and Kraft (Reference Bruthansová and Kraft2003) found Arachnostega together with coprolites and concluded that the coprolites and Arachnostega were produced by the same organism; however, they might be produced by different organisms (Toom et al. Reference Toom, Vinn, Isakar, Madison and Hints2020). Among the studied specimens, one drilled Gresslya specimen has Arachnostega and rodlike coprolite fossils with a diameter of 0.16 mm (Fig. 4G–I). Similar rodlike structures (0.12 mm in diameter), which we interpret as coprolites, were found in some of the drilled Eothyasira specimens from southern Germany (Fig. 5A–G). However, no burrowing traces (Arachnostega) in Eothyasira specimens were found. Among the Gresslya specimens from southern Germany (all are non-drilled), rounded rather than rodlike coprolites were found in one specimen (Fig. 5H,I) and assigned herein to Coprulus isp. (see Knaust Reference Knaust2020). As previously suggested by Brunthansová and Kraft (Reference Bruthansová and Kraft2003), Arachnostega and coprolites might have been produced by animals that used empty shells as a domicile. Arachnostega was found in internal molds of gaping bivalves (e.g., Gresslya) irrespective of the presence or absence of the drill holes. The producers of the burrowing traces and coprolites might have entered the shell either through the drill hole after the predator emptied the shell or through the posterior gape after the death of the bivalve.
One conspicuous feature is the preservation of some drill holes in the Amaltheenton environment. These drill holes were preserved on the internal molds as circular pits. The same preservation was reported by Karapunar et al. (Reference Karapunar, Werner, Fürsich and Nützel2020a, Reference Karapunar, Werner, Fürsich and Nützelb) in Eothyasira from slightly younger sediments of the Pliensbachian Amaltheenton Formation. As previously discussed by Karapunar et al. (Reference Karapunar, Werner, Fürsich and Nützel2020a), the drill holes were obviously not produced after the formation of the internal molds. This unique taphonomic feature seems to have improved the preservation potential of the drill holes.
Implications for Drilling Predation Patterns in the Early Mesozoic
The present study and the previously published data (Karapunar et al. Reference Karapunar, Werner, Fürsich and Nützel2020a) suggest that the drilling predator in the Amaltheenton Formation was highly specialized (prey, size, and site selective). The low incidence of predation in the Amaltheenton environment can be partially explained by the high specialization of the predator (i.e., strict prey selection in terms of prey's life habit and identity), which limits the number of drill holes to the abundance of the target prey group rather than the abundance of predator. However, the scarcity of the drill-hole record is a global phenomenon in the early Mesozoic (Huntley and Kowalewski Reference Huntley and Kowalewski2007). The scarcity of drill holes in the Jurassic was previously hypothesized to be caused by bias in aragonite preservation (Harper et al. Reference Harper, Forsythe and Palmer1998); that is, the absence of drill holes was due to loss of aragonitic shell material. The nature of preservation (i.e., the preservation of drill holes on internal molds even in the absence of the original shell), the low assemblage frequency, and the low within-species drilling frequency (lower taxon frequency) in the Amaltheenton Formation (0.8% of total bivalve specimens; 81% of the Eothyasira specimens in southern Germany; Karapunar et al. Reference Karapunar, Werner, Fürsich and Nützel2020a) argue against this claim. Although the original aragonite is preserved, the drilling percentage in the mollusk-dominated St. Cassian assemblages (Carnian, Triassic) is also low (1.7% out of 119 specimens; Klompmaker et al. Reference Klompmaker, Nützel and Kaim2016) compared with the younger reports of drilling percentages from the Cretaceous onward (Tackett and Tintori Reference Tackett and Tintori2019).
The Mesozoic Era started with the biggest extinction of life on Earth (Payne and Clapham Reference Payne and Clapham2012), and the first half of the era experienced several subsequent extinction events (Carnian pluvial event, Late Triassic [Dal Corso et al. Reference Dal Corso, Bernardi, Sun, Song, Seyfullah, Preto, Gianolla, Ruffell, Kustatscher, Roghi, Merico, Hohn, Schmidt, Marzoli, Newton, Wignall and Benton2020]; end-Triassic [Kiessling et al. Reference Kiessling, Aberhan, Brenneis and Wagner2007]; early Toarcian [Little and Benton Reference Little and Benton1995]) in contrast to the relatively more stable second half. These extinctions affected both the diversity of potential prey (e.g., bivalves) and potential drilling predators (e.g., gastropods). Predators, which were already rare, might have been wiped out repeatedly during these extinction events, and hence their expansion might have been hampered. In the Lower Jurassic, the drill-hole record is patchily present in the Hettangian, Sinemurian, and Pliensbachian until it was interrupted at the Pliensbachian–Toarcian extinction event. The drilling record reappeared in the Bajocian–Bathonian (Kowalewski et al. Reference Kowalewski, Dulai and Fürsich1998 with supplementary material; Harper et al. Reference Harper, Forsythe and Palmer1998) and increased from the Late Jurassic onward (Tackett and Tintori Reference Tackett and Tintori2019; Saha et al. Reference Saha, Paul, Mondal, Bardhan, Das, Saha and Sarkar2021). Similar to the drilling interactions (both parasitic and predatory ones; Huntley and Kowalewski Reference Huntley and Kowalewski2007), parasitic interactions also decreased in the late Paleozoic and early Mesozoic (De Baets et al. Reference De Baets, Huntley, Scarponi, Klompmaker and Skawina2021). The decline in parasitic interactions is explained by the decline in parasite diversity and biodiversity in general. A high incidence of drill holes in the early Mesozoic (e.g., Carnian [Klompmaker et al. Reference Klompmaker, Nützel and Kaim2016]; Pliensbachian [Harper et al. Reference Harper, Forsythe and Palmer1998; Karapunar et al. Reference Karapunar, Werner, Fürsich and Nützel2020a; this study]) coincides with the peaks in diversity of potential predators (Triassic gastropods; Karapunar and Nützel Reference Karapunar and Nützel2021: figs. 92–94, 97) and prey taxa (Triassic bivalves [McRoberts Reference McRoberts2001]; Early Jurassic bivalves [Aberhan and Fürsich Reference Aberhan and Fürsich2000]). The low drilling intensity in the Triassic and Early Jurassic can be best explained by the rarity (low diversity) of predators, as previously proposed (Kowalewski et al. Reference Kowalewski, Dulai and Fürsich1998; Huntley and Kowalewski Reference Huntley and Kowalewski2007). Our findings suggest that the predator in the soft-bottom Amaltheenton environment was highly specialized, focusing exclusively on a single prey taxon (prey selectivity), which was Gresslya in the northern settings and Eothyasira in the southern settings. In addition to a low diversity of predators, such specializations might have caused the rarity of drill holes and resulted in extinction of drill-hole producers.
Acknowledgments
S.-L. Hilpert (Sülfeld, Germany) is acknowledged for donating her specimen for the current study. M. Keiter (Naturkunde Museum Bielefeld) is thanked for inventorying. P. Kelley, the two anonymous reviewers, and the editors J. Crampton and J. Huntley are acknowledged for their critical comments, which considerably improved the article. P. Kelley is further acknowledged for her editorial comments. Open access funding provided by the Ludwig Maximilian University of Munich.
Declaration of Competing Interests
The authors declare no competing interests.
Data Availability Statement
Data available from the Dryad Digital Repository (Supplementary material and Appendix): https://doi.org/10.5061/dryad.gxd2547qs.


 Open access