


1. Introduction
Granular segregation occurs routinely whenever a mixture of non-identical grains is sheared. This segregation generates a small relative motion between grains of different size, density or shape, which over time causes demixing and a spatially inhomogeneous composition of the granular material. The process of segregation is of fundamental importance in both industrial granular flows, where it hinders uniform mixing of bulk solids (see e.g. Fan et al. Reference Fan, Schlick, Umbanhowar, Ottino and Lueptow2014), and in natural granular avalanches, where the segregation of large boulders to the front and sides of the flow prevents lateral spreading but promotes flow instabilities and a longer runout (Johnson et al. Reference Johnson, Kokelaar, Iverson, Logan, LaHusen and Gray2012).
Segregation occurs through various mechanisms, and across a wide range of parameter regimes, in shear flows (Savage & Lun Reference Savage and Lun1988), vibrated systems (Ahmad & Smalley Reference Ahmad and Smalley1973) and quasi-static granular flows (Chassagne et al. Reference Chassagne, Maurin, Chauchat, Gray and Frey2020), and in both mixtures of many types of grains and systems that are monodisperse apart from a single large ‘intruder’ (e.g. van der Vaart et al. Reference van der Vaart, van Schrojenstein Lantman, Weinhart, Luding, Ancey and Thornton2018; Jing et al. Reference Jing, Ottino, Lueptow and Umbanhowar2020). This paper focuses on granular flows in the inertial regime – that is, dense, liquid-like flows in which grain fluctuations are generated by shear, and where the rheology is independent of the inter-grain coefficient of restitution (Forterre & Pouliquen Reference Forterre and Pouliquen2008). While not applicable to dilute, vibrated or quasi-statically deforming granular systems, this inertial regime encompasses a wide range of dense granular flows (GDR-MiDi 2004). In particular, it includes dense free-surface granular flows, which are particularly efficient at segregating and separating grains of different species (Savage & Lun Reference Savage and Lun1988), and cause pronounced segregation in hoppers (Baxter et al. Reference Baxter, Tüzün, Heyes, Hayati and Fredlund1998), rotating drums (Gray & Hutter Reference Gray and Hutter1997; Hill & Tan Reference Hill and Tan2014) and natural granular avalanches.
Even within the inertial regime, the micro-mechanical origins of segregation are still subject to debate; there is not yet a general theory that can predict the rate of segregation (that is, the speed at which different grain species percolate through one another) given the flow conditions and the properties of the grains. Nonetheless, continuum descriptions have been successful in describing the qualitative behaviour of segregating flows, and are able to make quantitative predictions when parameters are suitably chosen for a given flow configuration. Many such models are expressed in the framework of mixture theory (e.g. Gray & Thornton Reference Gray and Thornton2005; Marks, Rognon & Einav Reference Marks, Rognon and Einav2012; Fan et al. Reference Fan, Schlick, Umbanhowar, Ottino and Lueptow2014; Hill & Tan Reference Hill and Tan2014; Tunuguntla, Bokhove & Thornton Reference Tunuguntla, Bokhove and Thornton2014). In these theories, each species of grain  $i$ is modelled as a separate fluid constituent with its own species fraction $\phi _i$, grain diameter $d_i$, intrinsic density $\rho _i^{*}$, extrinsic density $\rho _i = \phi _i \rho _i^{*}$ and velocity $\boldsymbol {u}_i$. The set of fractions $\{\phi _i\}$ represent the fractions of the solid material belonging to each species, with $0\leqslant \phi _i \leqslant 1$ and $\sum _i \phi _i = 1$. Bulk flow quantities, such as the bulk velocity $\boldsymbol {u} = \sum _i \phi _i \boldsymbol {u}_i$, are defined as a volume-weighted average of the constituent properties (e.g. Gray & Thornton Reference Gray and Thornton2005).
Within these mixture theory models, each species obeys a mass balance equation
 \begin{equation} \frac{\partial \rho_i }{\partial t} + \boldsymbol{\nabla} \boldsymbol{\cdot} (\rho_i \boldsymbol{u}_i) = 0. \end{equation}
The flux  $\rho _i \boldsymbol {u}_i$ is assumed be the result of an equilibrium of three forces acting on the $i$th species (Gray & Chugunov Reference Gray and Chugunov2006). This force balance takes the form
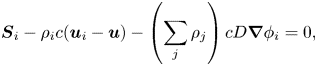 \begin{equation} \boldsymbol{S}_i - \rho_i c (\boldsymbol{u}_{i} - \boldsymbol{u}) - \left(\sum_j \rho_j \right) c D \boldsymbol{\nabla} \phi_i = 0, \end{equation}
where the first term,  $\boldsymbol {S}_i$, is a driving segregation force per unit volume and the second term is an inter-species drag force (assumed linear in the segregation velocity $\boldsymbol {u}_{si} :=\boldsymbol {u}_i-\boldsymbol {u}$) with coefficient $c$, which opposes the relative motion between different granular species. The final term is an effective force arising from a diffusion with diffusivity $D$ (which is assumed to be normal, or Fickian).
In inertial granular flows, the segregation force  $\boldsymbol {S}_i$ and the segregation velocity $\boldsymbol {u}_{si}$ that results from it are generated by spatial gradients in the flow. Analysis from kinetic theory (Larcher & Jenkins Reference Larcher and Jenkins2015) and discrete element simulations (Staron & Phillips Reference Staron and Phillips2015) suggest that gravity-induced hydrostatic gradients of pressure $p$ (as in Gray & Thornton Reference Gray and Thornton2005) and gradients of granular temperature $T$ or kinetic stress (Hill & Tan Reference Hill and Tan2014) can all contribute to the driving segregation force $\boldsymbol {S}_i$, as can gradients of shear stress (Guillard, Forterre & Pouliquen Reference Guillard, Forterre and Pouliquen2016), although the relative importance of these contributions is difficult to assess (Staron & Phillips Reference Staron and Phillips2015).
The segregation velocity can also depend on the local value of flow properties, through the drag force. In regions of uniform  $\phi _i$, where the diffusive flux is zero, the force balance (1.2) implies that the segregation velocity is simply a balance of the segregation and drag forces,
 \begin{equation} \boldsymbol{u}_{si} = \boldsymbol{u}_i-\boldsymbol{u} = \frac{\boldsymbol{S}_i}{\rho_i c} = \frac{\boldsymbol{S}_i(\boldsymbol{\nabla} p, \boldsymbol{\nabla} T, \ldots, \dot\gamma, p, \{\phi_i\}, \ldots)}{\rho_i c(\dot{\gamma}, p, \{\phi_i\},\ldots)}. \end{equation}
Across multiple studies, the segregation velocity is observed to be approximately linear in the local shear rate  $\dot {\gamma }$ (Marks et al. Reference Marks, Rognon and Einav2012; Fan et al. Reference Fan, Schlick, Umbanhowar, Ottino and Lueptow2014; Larcher & Jenkins Reference Larcher and Jenkins2015) and a decreasing function of the pressure $p$ (Golick & Daniels Reference Golick and Daniels2009; Fry et al. Reference Fry, Umbanhowar, Ottino and Lueptow2018; Duan et al. Reference Duan, Umbanhowar, Ottino and Lueptow2020), although the precise form of these dependencies, and the mechanisms leading to them, are still uncertain.
In particular, it has not been shown whether dependencies of the segregation velocity on the local flow properties (such as  $\dot {\gamma }$, $p$) come about through variation with these properties of the driving force $\boldsymbol {S}_i$, the drag coefficient $c$ or both of these mechanisms.
In this paper we isolate the process of inter-species drag, and study it separately from the driving segregation force  $\boldsymbol {S}_i$. In doing so, we completely characterise the drag coefficient $c$ and its dependence on local flow properties for dense inertial flows of monodisperse and size-bidisperse grains, and provide a model that explains the scaling of these dependencies. In the absence of spatial gradients (a uniform flow) the driving segregation force $\boldsymbol {S}_i$ is zero. Consequently, measurements of this force in experiments or discrete element simulations require the system to be spatially inhomogeneous. The inter-species drag, on the other hand, is not driven by gradients, and so can be studied in a spatially uniform flow, as we do here.
We measure the drag coefficient  $c$ and characterise its dependence on the flow using discrete element method (DEM) simulations of grains in a gravity-free, steady, spatially uniform shear flow. The grains are partitioned into two distinct groups, one ‘rising’ species and one ‘falling’ species. In absence of gravity or spatial gradients, no segregating forces arise between these two species. Instead, we apply a small positive or negative ‘buoyancy’ force, respectively, to grains of each species. This force causes the grain species to percolate through each other at a rate controlled purely by the applied buoyancy force and the drag. By tracking the both the average and fluctuating motion of individual grains, we measure both this percolation velocity, and the diffusivity $D$, as a function of the local flow parameters. This drag-controlled percolation process is very similar to that occurring during the segregation of two different granular species, but is driven here by an imposed buoyancy force that allows a spatially uniform flow, rather than by the segregation force $\boldsymbol {S}_i$ that results from spatial gradients.
The spatially inhomogeneous flows typically required to study granular segregation mean that dimensional analysis can only be applied globally to the entire system, and cannot be used to determine the local relationship between segregation velocity and flow properties that is usually desired. In contrast, because the system studied here is uniform, dimensional analysis can be used to considerably simplify the study of how the drag and diffusion depend on the local flow properties such as shear rate and pressure. With a combination of dimensional analysis and discrete element simulations, we are able to validate the form of the drag and diffusion terms in (1.2) and fully characterise  $c$ and $D$.
$D$.
In § 2 we describe the DEM simulations and the complete set of parameters used. In § 3 we reduce these parameters to the underlying dimensionless groups, and use our simulations to evaluate the dependence of the drag and diffusion on each of these. We initially consider monodisperse grains, and show that the drag coefficient  $c$ scales with the granular inertial number $I$ to the power $-7/4$. We explain the origin of this scaling with a model that relates segregation velocity to the grain velocity fluctuations. We then demonstrate that this scaling also holds when a size ratio is introduced between the two species. We also show that the non-dimensional diffusivity is weakly dependent on $I$. In § 4, we discuss how these findings inform models of granular segregation, and note that the variation of the drag with shear rate and pressure is able to account for much of the previously observed dependence of segregation rates on these quantities in free-surface flows. Finally we conclude in § 5.
2. DEM modelling
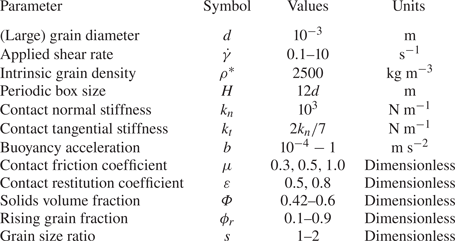
We perform discrete element simulations to characterise the inter-species drag using the open-source software MercuryDPM (Weinhart Reference Weinhart2020). The simulations involve twelve parameters (table 1), but, as we will show, for monodisperse inertial granular flows these reduce to just two dimensionless groups that describe the percolation of the two species. Grains are simulated as spheres of intrinsic density  $\rho ^{*}$ and diameter $d$. In bidisperse mixtures the grain diameters are $d$ and $d/s$, where $s$ is the grain size ratio. The grains satisfy Newton's laws of motion and interact via contact forces when they overlap one another. We use the common linear spring-dashpot contact force model (Cundall & Strack Reference Cundall and Strack1979), with the magnitude of the normal and tangential forces acting on contacting grains being
 \begin{equation} F_n ={-}k_n\delta_n - \eta_n\dot{\delta}_n \quad \text{and} \quad F_t = \min\left({-}k_t\delta_t,\ \mu F_n\right), \end{equation}
respectively, where  $\delta _{n,t}$ are the normal and tangential overlaps between the grains, $k_{n,t}$ are the normal and tangential spring stiffness, $\eta _n$ is the normal dissipation and $\mu$ is the coefficient of sliding friction between two grains. The normal dissipation is set by specifying a coefficient of restitution $\varepsilon$ between two colliding grains. The grain stiffness chosen is sufficiently large that the flows are in the inertial regime, typical of dense granular avalanches, where results are independent of both stiffness parameters $k_n$ and $k_t$ (Silbert et al. Reference Silbert, Ertaş, Grest, Halsey, Levine and Plimpton2001; Chialvo, Sun & Sundaresan Reference Chialvo, Sun and Sundaresan2012).
Parameters used in the discrete element simulations. The first three parameters define the non-dimensionalisation and, in the inertial regime studied, the results are independent of the subsequent three. The final six parameters therefore govern the macroscopic system behaviour.
The grains are simulated in a three-dimensional domain with periodic boundary conditions in  $x$ and $y$, and Lees Edwards boundary conditions (Lees & Edwards Reference Lees and Edwards1972) imposing a uniform simple shear with shear rate $\dot {\gamma }$ in the
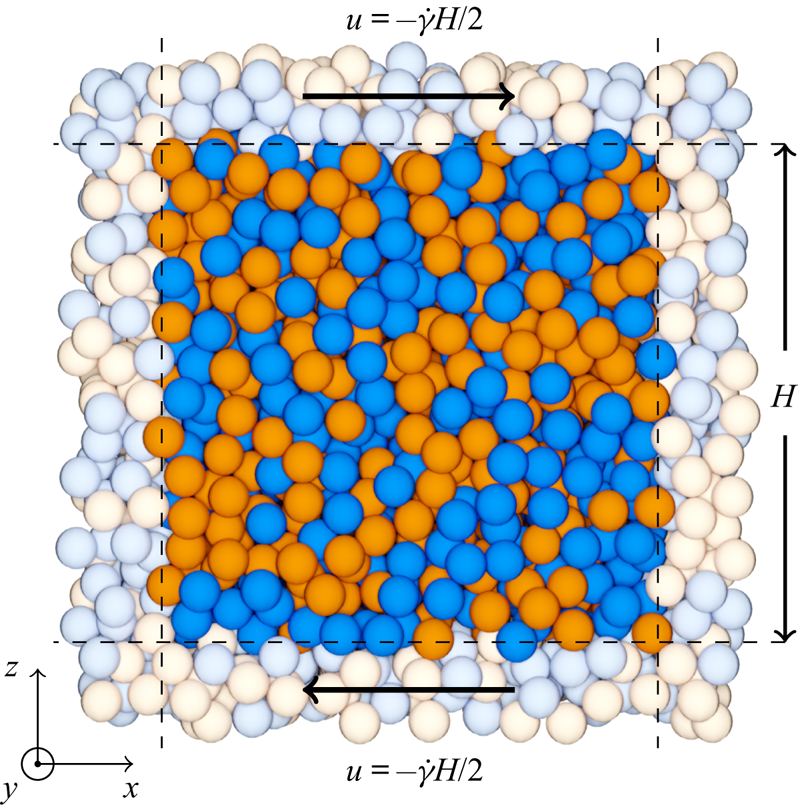
  $xz$ plane (figure 1). No gravitational force is imposed. The periodic domain has side length $H = 12d$; we have verified that our results are insensitive to this choice of $H$. By varying the number of large and small grains in the box $N_l$ and $N_s$, the solids volume fraction $\varPhi = {\rm \pi}d^{3}(N_l + N_s/s^{3})/(6 H^{3})$ can be specified. The grains are initially placed at random positions and velocities within the domain, and the system is allowed to evolve to a uniform statistically steady state.
Cross-section of the three-dimensional Lees Edwards shear cell, with one periodic unit highlighted. The rising species of grains is coloured blue and falling species coloured orange.
To induce percolation in the shear cell, the grains are assigned to rising and falling species, with the fraction of grains in the rising species denoted by  $\phi _r$ and the fraction in the falling species by $\phi _f=1-\phi _r$. An acceleration $b_i$ is applied in the $z$ direction to each grain of species $i$, where $i=r,f$. Introducing a parameter $b$ that sets the relative acceleration between two species ( $b_r-b_f = 2b$) and requiring that the total force applied to the system is zero ( $\rho _r b_r + \rho _f b_f=0$), we obtain $b_i = \pm 2b(1-\phi _i)$. The total force per unit volume applied to a species is then
 \begin{equation} \boldsymbol{S}_{i} = \rho_{i} b_i \boldsymbol{\hat{z}} ={\pm} 2b \rho^{*}\phi_i (1-\phi_{i})\boldsymbol{\hat{z}}, \quad i = r,f. \end{equation}
The applied buoyancy force causes the two species to percolate through one another at a velocity  $\boldsymbol {u}_{pi} = w_{pi}\boldsymbol {\hat {z}}$. When the volume of rising and falling grains are equal ( $\phi _r=\phi _f=0.5$) the applied force reduces to $\boldsymbol {S}_{i} = \pm b \rho _{i}\boldsymbol {\hat {z}}.$ We choose to measure the percolation velocity of the (larger) rising grains $w_{pr}$, but have verified that, as expected, $\phi _r w_{pr}+\phi _f w_{pf} = 0.$
3. Dimensional analysis and simulation results
We initially consider monodisperse grains, generalising to size-bidisperse mixtures in § 3.3. In a uniform shear flow of identical spherical grains, there are just three dimensional parameters: the grain diameter  $d$, the intrinsic grain density $\rho ^{*}$ and the applied shear rate $\dot {\gamma }$, from which no dimensionless group can be formed. In addition, there are three dimensionless parameters: the solids volume fraction $\varPhi$, and friction and restitution coefficients of the contact law, $\mu$ and $\varepsilon$, respectively. Dimensional analysis then requires that the pressure $p$ in such a granular shear flow is given by
 \begin{equation} p = \rho^{*} d^{2} \dot{\gamma}^{2} \mathcal{F}(\varPhi, \mu, \varepsilon), \end{equation}
for some dimensionless function  $\mathcal {F}$. Our addition of a buoyancy force to this system introduces an additional dimensionless parameter,
 \begin{equation} B = \frac{b_r}{d \dot{\gamma}^{2}}, \end{equation}
which can be interpreted as the square of the ratio of the time taken for a grain to move over its own diameter due to the buoyancy force,  $(d/b_r)^{1/2}$, to the shear time scale $1/\dot {\gamma }$. Assigning each grain to one of two species also introduces a new dimensionless parameter, $\phi _r$, the fraction of grains in the rising species. Accordingly, the pressure and percolation velocity in the shear cell are given by
 \begin{equation} p = \rho^{*} d^{2} \dot{\gamma}^{2} \mathcal{F}(\varPhi,B,\phi_r,\mu,\varepsilon) \quad \text{and} \quad w_{pr} = d \dot{\gamma}\mathcal{G}(\varPhi,B,\phi_r,\mu,\varepsilon), \end{equation}
for unknown functions  $\mathcal {F}$ and $\mathcal {G}$. In the remainder of this section, we will use the DEM simulations to completely characterise the dependence of $\mathcal {F}$ and $\mathcal {G}$ on their parameters.
3.1. Effect of the buoyancy force
To examine the effect the buoyancy force has on the shear cell, we measure the pressure and percolation velocity in the shear cell at a range of dimensionless buoyancies  $B$ and solids volume fractions $\varPhi$. The percolation velocity is measured by tracking the mean distance moved by each grain through the steady state simulation time. The pressure is measured by coarse graining the contact and kinetic stresses between grains (using the method of Weinhart, Luding & Thornton Reference Weinhart, Luding and Thornton2013) to find a continuum pressure field, which is then spatially and temporally averaged.
We find that the percolation velocity  $w_{pr}$ is linear in the dimensionless buoyancy force $B$ (figure 2a), which is consistent with the assumption of a linear inter-species drag in (1.2). Measurements of the percolation velocity collapse across a range of volume fractions when the non-dimensional percolation speed $w_{pr}/(d \dot {\gamma })$ is plotted against
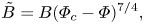 \begin{equation} \tilde{B}= B (\varPhi_c - \varPhi)^{7/4}, \end{equation}
where  $\varPhi _c$ is a critical volume fraction. The definition of $\varPhi _c$ and the origin of the scaling power $7/4$ are discussed below. The collapse of the percolation velocity in (figure 2a) is clearest when $10^{-3} \leqslant \tilde {B} \leqslant 0.02$. Over the time scale of our simulations, the condition $\tilde {B} \geqslant 10^{-3}$ means that the percolation displaces grains by a much greater distance than random fluctuations (evidenced by the red bars on figure 2a). When $\tilde {B} \lesssim 0.02$ the measured pressure in the simulation, plotted in figure 2(b), is very similar to its value when there is no applied force, $\tilde {B} =0$, indicating that the buoyancy force is not significantly modifying the underlying shear flow. This is the appropriate regime for segregation in inertial granular flows, where segregation processes are typically much weaker than the underlying shear flow, and all further simulations presented therefore use buoyancy strengths which satisfy $10^{-3} \leqslant \tilde {B} \leqslant 10^{-2}$.
Collapse of (a) dimensionless percolation velocity and (b) the dimensionless scaled pressure, against scaled dimensionless buoyancy  $\tilde {B} = B(\varPhi _c - \varPhi )^{7/4}$, with $\phi _r=0.5$, $\mu = 0.5$ and $\varepsilon = 0.8$. Red bars in (a) show the standard deviation of ${\sim }9000$ consecutive measurements of $w_{pr}/(d\dot {\gamma })$; white symbols show the mean of these measurements.
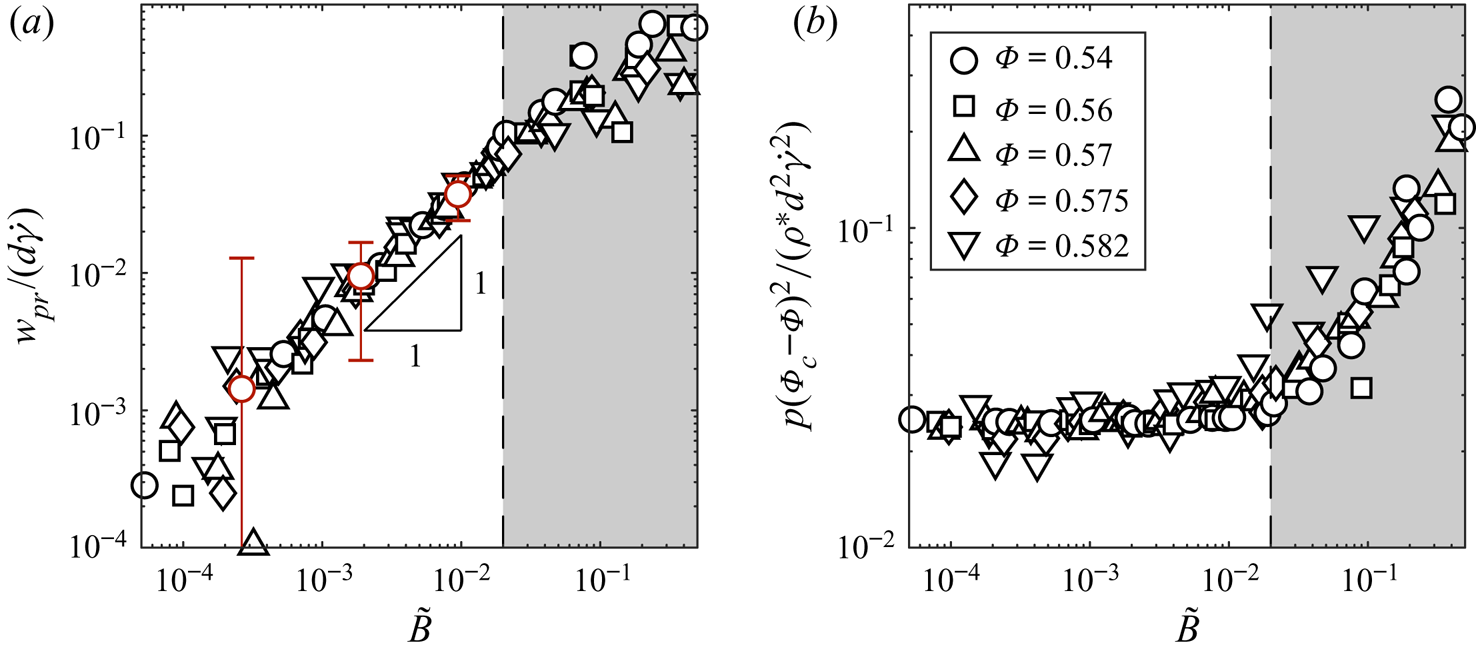
Since the pressure is unaffected by the imposed buoyancy force when  $\tilde {B} \lesssim 0.02$, our observations of the pressure in this regime match the behaviour previously reported in non-segregating inertial granular flows (da Cruz et al. Reference da Cruz, Emam, Prochnow, Roux and Chevoir2005; Chialvo et al. Reference Chialvo, Sun and Sundaresan2012). Namely, the measured pressure scales with the volume fraction $\varPhi$ according to
 \begin{equation} p \sim \frac{\rho^{*} \dot{\gamma}^{2} d^{2}}{(\varPhi - \varPhi_c(\mu))^{2}}, \end{equation}
consistent with (3.3a), where  $\varPhi _c$ is a critical packing fraction that depends only on the grain friction coefficient $\mu$. Equivalently, the inertial number
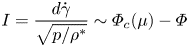 \begin{equation} I = \frac{d \dot{\gamma}}{\sqrt{p/\rho^{*}}} \sim \varPhi_c(\mu) - \varPhi \end{equation}
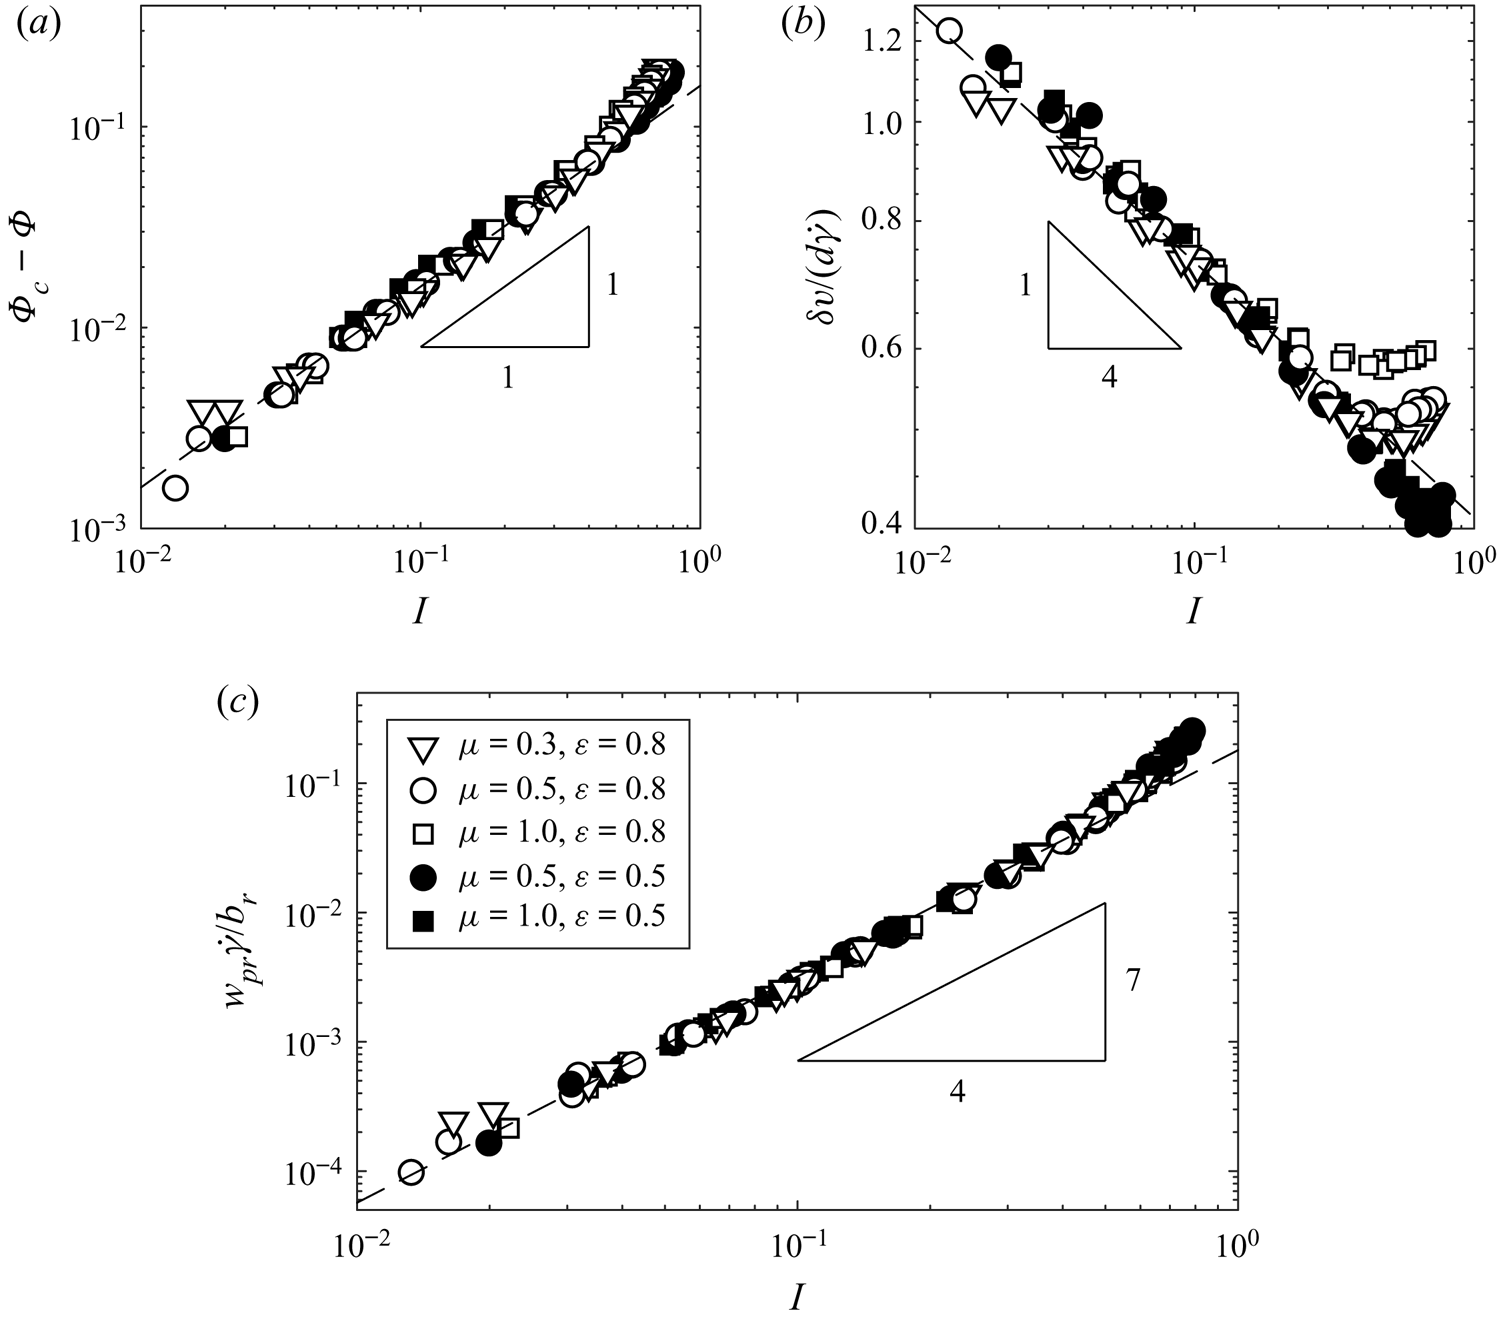
is a function of  $\varPhi$, as verified in the numerical simulations (figure 3a). This relationship allows the inertial number $I$, a dimensionless group involving a simulation output $p$, to be used as a proxy for a dimensionless input parameter of the system, $\varPhi$, which varies only slightly in dense granular flows (GDR-MiDi 2004). Eliminating $\varPhi$ in this manner makes explicit the relationship between percolation velocity and the flow properties $p$ and $\dot {\gamma }$, which, particularly in free-surface granular flows, are easier to infer experimentally than the volume fraction $\varPhi$.
Collapse over inertial number, grain friction and restitution coefficient of (a) distance from critical packing fraction, (b) magnitude of velocity fluctuations and (c) non-dimensionalised percolation velocity. The fraction of rising grains is  $\phi _r=1/2$, and the grains are monodisperse, $s=1$.
3.2. Percolation velocity and drag coefficient
Having confirmed that the percolation velocity  $w_{pr}$ is linear in $B$ (figure 2a), and that the inertial number $I$ can substitute for the volume fraction $\varPhi$ (figure 3a), our expression for the percolation velocity (3.3b) reduces to
 \begin{equation} w_{pr} = \frac{b_r}{\dot{\gamma}}\mathcal{G}(I,\phi_r,\mu,\varepsilon). \end{equation}
We reaffirm the linearity in  $B$ and examine the dependence of $w_{pr}$ on the remaining parameters in (3.7) by performing the shear cell simulations using five different combinations of friction and restitution coefficients, and over a range of shear rates, buoyancy strengths and solids volume fractions, which give a wide range of inertial numbers. As illustrated in figure 3(c), the percolation velocity collapses extremely well against the inertial number for all $B$,
$B$,  $\mu$, $\epsilon$, and exhibits a clear power-law scaling with $I$, for $I \lesssim 0.5$, reducing (3.7) to
 \begin{equation} w_{pr} = \frac{b_r}{\dot{\gamma}} \mathcal{G}(\phi_r)I^{1.74\pm 0.11} \approx \frac{b_r}{\dot{\gamma}} \mathcal{G}(\phi_r) I^{7/4}. \end{equation}
The rising grain fraction  $\phi _r$ has no discernible effect on the percolation velocity (figure 4), meaning that $\mathcal {G}(\phi _r)$ is a constant, with a value $\kappa = 0.17 \pm 0.03$ measured directly from the simulations. Through (1.3), this provides an expression for the drag coefficient
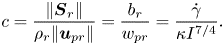 \begin{equation} c = \frac{\|\boldsymbol{S}_r\|}{\rho_r \|\boldsymbol{u}_{pr}\|} = \frac{b_r}{w_{pr}} = \frac{\dot{\gamma}}{\kappa I^{7/4}}.\end{equation}
Dependence of percolation velocity on rising grain fraction. Symbol shapes indicate volume fractions  $\varPhi \in [0.54, 0.582]$ as in figure 2; $\mu =0.5$, $\varepsilon =0.8$, $s=1$.

To understand the origin of the observed power law  $c \sim I^{-1.74}$ and the closeness of its exponent to $-7/4$, we consider a model of hard grains interacting through instantaneous pairwise collisions. This approach extends that of Bagnold (Reference Bagnold1954), who reasoned that granular pressure arose from the momentum transfer occurring at these instantaneous collisions. Although the assumption of pairwise collisions does not necessarily hold for dense flows with low inertial numbers, we find that the scalings for the drag coefficient obtained from this approach (like the scalings for the pressure deduced by Bagnold Reference Bagnold1954) remain valid well into this dense regime.
Each grain collides with another at rate characterised by the mean free time  ${t_{{mf}}}$. Denoting the typical relative velocity between colliding grains as $\Delta V$, the impulse exerted at each collision scales as the grain mass multiplied by the velocity difference $\rho ^{*} d^{3} \Delta V$. Collisions occur at a rate of $1/{t_{{mf}}}$ and thus each grain exerts a force of $\rho ^{*} d^{3} \Delta V / {t_{{mf}}}$. In dense flow, the number of grains per unit area scales as $1/d^{2}$, so the pressure in the shear cell scales as
 \begin{equation} p \sim \frac{\rho^{*} d \Delta V}{{t_{{mf}}}}. \end{equation}
 We suppose that the collision velocity  $\Delta V$ is set by the fluctuation velocity of the grains $\delta v$ (that is, the square root of granular temperature $T^{1/2}$, as in Goldhirsch Reference Goldhirsch2008), rather than the bulk shear rate. The fluctuation velocity is a further output of the system so, from dimensional analysis, it must take the form
 \begin{equation} \delta v = d \dot{\gamma}\mathcal{H}(I,B,\phi_r,\mu,\varepsilon), \end{equation}
for some function  $\mathcal {H}$. As shown in figure 3b, the velocity fluctuations in our simulations collapse, following a power-law scaling with the inertial number, $\delta v/( d \dot {\gamma } ) \sim I^{-1/4}$ for $I \lesssim 0.5$, but becoming dependent on grain contact properties at higher inertial numbers, which is in accordance with the modified kinetic theory predictions of Chialvo & Sundaresan (Reference Chialvo and Sundaresan2013). Substituting this scaling into (3.10), and rearranging for the mean free time then gives
 \begin{equation} {t_{{mf}}} \sim \frac{d^{2} \dot{\gamma}}{p/\rho^{*}} I^{{-}1/4} =\frac{1}{\dot{\gamma}} I^{7/4}. \end{equation}
Finally, under the applied acceleration  $b_r$, a rising grain in free space for the time ${t_{{mf}}}$ between each collision gains an additional displacement $b_r {t_{{mf}}}^{2}/2$ in the direction of the applied acceleration, giving a percolation velocity
 \begin{equation} w_{pr} \sim \frac{b_r {t_{{mf}}}^{2}}{{t_{{mf}}}} \sim \frac{b_r}{\dot{\gamma}} I^{7/4}. \end{equation}
This scaling prediction for the percolation velocity has precisely the form (3.8) inferred from the numerical simulation results (figure 3c) in the dense granular flow regime  $I \lesssim 0.5$.
3.3. Effect of varying grain sizes
Granular segregation is often driven by a size difference between grains. In order to test the validity of the drag law (3.13) for size-bidisperse grains, we perform the shear cell simulations using different grain sizes for the rising and falling grains. Due to the absence of any spatial gradients, the size difference between the two species does not result in segregating forces and, as before, the relative motion of the two species is driven entirely by the applied buoyancy force.
Bidispersity introduces a new dimensionless parameter, the grain size ratio,  $s = d_r/d_f$, where $d_{r,f}$ are the diameters of the rising and falling grains respectively. We examine mixtures where the difference between grain sizes is modest, between $s=1$ (monodisperse grains) and $s = 2$.
To account for the different grain sizes, we modify the definition of the inertial number to be in terms of a volume-weighted mean grain diameter (Tripathi & Khakhar Reference Tripathi and Khakhar2011)
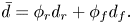 \begin{equation} \bar{d} = \phi_r d_r + \phi_f d_f. \end{equation}
This definition of average diameter (3.14) is chosen because, out of the various definitions studied by Gu, Ozel & Sundaresan (Reference Gu, Ozel and Sundaresan2016), it gives the closest agreement between the rheology of the bidisperse mixture and the rheology of a monodisperse flow of grain size  $\bar {d}$. The inertial number is then defined as
 \begin{equation} I = \frac{\bar{d}\dot{\gamma}}{\sqrt{p/\rho^{*}}}, \end{equation}
which reduces to the monodisperse definition (3.6) when  $s=1$.
Size-bidisperse grains are able to pack more densely than monodisperse grains, meaning that the critical packing fraction becomes dependent on the size ratio and mixture composition for the bidisperse grains,  $\varPhi _c = \varPhi _c(\mu ,s,\phi _r)$ (Desmond & Weeks Reference Desmond and Weeks2014). This function can be measured numerically as the solids volume fraction at which $I \to 0$; our measurements are given in table 2. Evaluating $\varPhi _c$ in this way, the inertial number for bidisperse grains (3.15) then collapses onto exactly the same linear relationship with volume fraction (3.6) as was observed for monodisperse grains (figure 5a). This collapse, which is expected from the results of Gu et al. (Reference Gu, Ozel and Sundaresan2016), demonstrates that the modified inertial number (3.15) is dependent only on $\varPhi _c-\varPhi$, for the grain size ratios used here. Consequently, as with monodisperse grains, $I$ can substitute for $\varPhi$ as a dimensionless parameter of the bidisperse system.


Critical packing fraction as a function of grain size ratio  $s$ for equal volume mixtures of bidisperse grains, with friction coefficient $\mu = 0.5$.
The percolation velocity of the grains is then found to observe the same  $I^{7/4}$ scaling with inertial number (3.8) as monodisperse grains (figure 5b), when $I \lesssim 0.2$. For the larger particle size ratios studied, deviation of the measured percolation velocity from the $I^{7/4}$ scaling occurs when $I \gtrsim 0.2$, reflecting the nonlinearity in the relationship between $I$ and the underlying dimensionless parameter $\varPhi$ that we observe for these relatively rapid bidisperse flows (figure 5a).
The drag coefficient  $\kappa$ now varies slightly for different grain size ratios (figure 6), and may depend also on $\phi _r$ when $s\neq 1$. As expected, as $s \rightarrow 1$ we recover the same drag coefficient as for the monodisperse case, which is independent of $\phi _r$ (figure 4). When $\phi _r=1/2$, the system with grain size ratio $s$ is equivalent to that with size ratio $1/s$, and consequently, the drag coefficient $\kappa$ must be an even function of $\log (s)$. For small grain size ratios ( $|s-1|\ll 1$) the change in $\kappa$ from its monodisperse value is therefore very small, of order $(s-1)^{2}$, which is consistent with the measurements in figure 6. At larger size ratios the grains percolate more quickly under the same applied force, indicating a weakening of the drag as the grain size ratio increases.


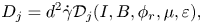
3.4. Diffusion
The final contribution to the motion of a granular species in the force balance (1.2) is the diffusion. Although the uniform conditions of our shear cell mean that there is no net diffusive flux, diffusive processes are still active due to the fluctuating motion of grains. In the case of Fickian diffusion, the diffusivity  $D_{j}$ in a coordinate direction $j$ is related to the motion of the grains through the relationship $\langle (\Delta x_j)^{2} \rangle = 2D_{j} t,$ where $\langle (\Delta x_j)^{2} \rangle$ is the mean squared displacement in the $j$th direction acquired by a grain in a time $t$. Dimensional analysis requires that each component of the diffusivity tensor takes the form
 \begin{equation} D_{j}=d^{2} \dot{\gamma} \mathcal{D}_j(I,B,\phi_r,\mu,\varepsilon), \end{equation}
for some dimensionless functions  $\mathcal {D}_j$. Like the drag coefficient, the diffusivity is non-zero even in absence of a segregation force, and we do not observe any dependence of $D_{j}$ on the buoyancy strength $B$ or the fraction of rising grains $\phi _r$ for the values of $\tilde {B}$ used in this paper. The dependence of $D_{j}$ on shear rate and grain size has been observed numerically (Campbell Reference Campbell1997) and experimentally (Utter & Behringer Reference Utter and Behringer2004). However, the dependence of $D_{j}$ on inertial number has not yet been the subject of detailed study. We measure the mean squared displacement of the grains in our simulations in the $y$ direction, perpendicular to both the shearing and segregating flows (figure 7a), and in the $z$ direction, aligned with the segregation (figure 7b). When measuring the mean squared displacement in the $z$ direction, the mean segregating motion is first subtracted off of the motion of each grain.
Measurements of the diffusivity in the (a)  $y$- and (b) $z$-directions against inertial number. Symbol shapes and colours indicate contact-law parameters, as in figure 3, and red dashed lines show the empirical fitted curves (3.17) and (3.18). Insets: mean squared displacement against dimensionless time. $\phi _r =1/2$.
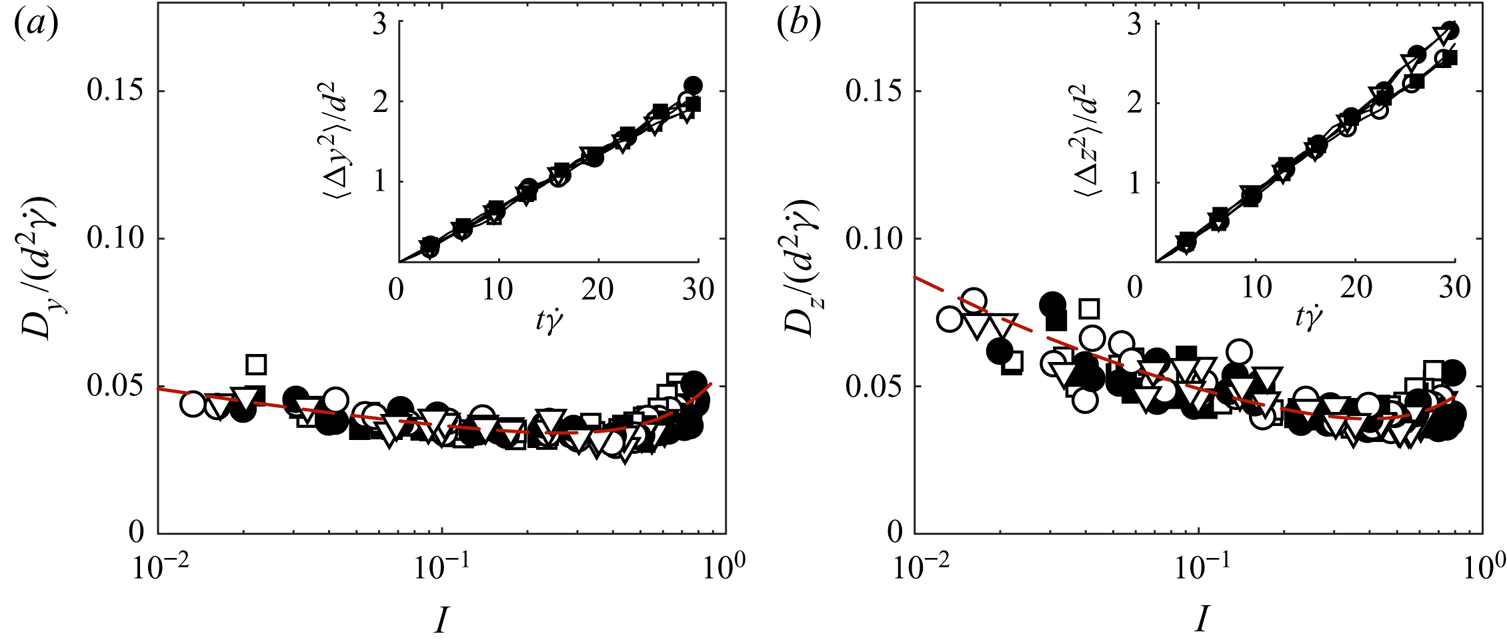
We find that both  $\langle \Delta y^{2} \rangle$ and $\langle \Delta z^{2} \rangle$ increase linearly with dimensionless time (figure 7, insets), which validates the Fickian diffusion term in (1.2) and allows us to plot the diffusion coefficient as a function of inertial number (figure 7). We observe a small anisotropy in the diffusion with $D_z > D_y$. The measured diffusivities show only a weak dependence on inertial number, although, as observed by Campbell (Reference Campbell1997), the diffusivity increases for $I \gtrsim 0.5$, outside the dense inertial flow regime. Over the range $0.01 \lesssim I \lesssim 0.8$, the measured diffusion coefficients are well approximated by the empirical functions
 \begin{gather} D_{y}/(d^{2} \dot{\gamma}) = \mathcal{D}_y = 0.027 I^{{-}0.13} + 0.03 I^{2} \approx 0.04, \end{gather}
 \begin{gather}D_{z}/(d^{2} \dot{\gamma}) = \mathcal{D}_z = 0.0275 I^{{-}0.25}+ 0.0275 I^{2} \approx 0.05, \end{gather}
as plotted on figure 7. Over the range of  $I$ considered, $\mathcal {D}_{z} \approx 0.05$ is almost constant, consistent with values found by Bridgwater (Reference Bridgwater1980) and Savage & Dai (Reference Savage and Dai1993) using experiments and simulations, respectively. The diffusion coefficient $\mathcal {D}_{z} \approx 0.05$ is also consistent with the values found by Cai et al. (Reference Cai, Xiao, Zheng and Zhao2019) for size-bidisperse grains. Using the volume-weighted mean grain diameter $\bar {d}$ (3.14) in place of $d$, they find that the average diffusion coefficient is constant up to grain size ratios of $s=3$. Tripathi & Khakhar (Reference Tripathi and Khakhar2013) demonstrate similarly that this coefficient maintains the same value in density-bidisperse mixtures, up to a density ratio of 3.
4. Implications for segregation in free-surface flows
We now return to models for granular segregation, and examine the implications of our drag and diffusion scalings (3.9), (3.17), (3.18) for segregation of bidisperse grains in a free-surface flow. We consider the configuration of a shear flow  $\boldsymbol {u} = u(z)\hat {\boldsymbol {x}}$, uniform in $x$, with segregation acting in the $z$ direction perpendicular to the flow, such that $\boldsymbol {S}_i = S_i \hat {\boldsymbol {z}}$, and $\boldsymbol {u}_{si} = w_{i}\hat {\boldsymbol {z}}$. This configuration is widely seen in segregation experiments, both in shear cells and free-surface flows. The uniaxial shear flow locally resembles the uniform simple shear used in the previous section, but allows pressure and shear rate to vary in $z$, providing the spatial gradients needed to drive segregation. For simplicity, we here consider that all grains are of the same intrinsic density $\rho ^{*}$ but of varying sizes.
Under these conditions, the force balance (1.2) can be solved for the flux of the  $i$th species
 \begin{equation} \phi_i w_{i} = \frac{S_i}{\rho^{*} c} - D_z \frac{\partial \phi_i}{\partial z}.\end{equation}
Since the local dependence of  $c$ and $D_z$ have been determined using the shear cell simulations, the segregating force $S_i$ is the only unmeasured quantity remaining in this equation. Substituting the flux (4.1) into the $z$ component of the mass balance (1.1), expanding the coefficients $c$ and $D_z$ using (3.9) and (3.18), and writing the inertial number explicitly gives the equation describing the segregation of the $i$th species,
 \begin{equation} \frac{\partial \phi_i}{\partial t} + \frac{\partial }{\partial z} \left[ \kappa\frac{ \dot{\gamma}^{3/4} \bar{d}^{\,7/4} }{(p^{7/8}/\rho^{*7/8})} \frac{S_i}{\rho^{*}} - \mathcal{D}_z \bar{d}^{\,2} \dot{\gamma} \frac{\partial \phi_i}{\partial z} \right] = 0. \end{equation}
The first term within the square brackets is the segregation flux term  $S_i/\rho ^{*} c$. This flux remains completely general, as we have not specified the driving segregation force $S_i$ or its dependence on any of the flow variables. However, by comparing our expression for segregation flux to measurements of this flux and its scaling with $\dot {\gamma }$ and $p$, previously obtained through experiments or DEM simulations, we are able to suggest the dependence of the driving segregation force $S_i$ on these parameters. We focus on a single flow configuration, namely dense free-surface granular flows, for which there have been a number of studies measuring the segregation rate.
Several authors (e.g. May et al. Reference May, Golick, Phillips, Shearer and Daniels2010; Marks et al. Reference Marks, Rognon and Einav2012; Fan et al. Reference Fan, Schlick, Umbanhowar, Ottino and Lueptow2014) propose that in free-surface flows the segregation flux is linear in shear rate  $\dot {\gamma }$, based on measurements from experiments or discrete element simulations. Marks et al. (Reference Marks, Rognon and Einav2012) attribute this linear dependence on $\dot {\gamma }$ to the segregation force $S_i$ alone, and suppose the drag coefficient $c$ is constant. From (4.2), our measurements of $c$ indicate that the dependence of drag on shear rate accounts for a scaling of the segregation flux as $\dot {\gamma }^{3/4}$, suggesting that the remaining dependence may be accounted for by relatively weak variation of the segregation force as $S_i \sim \dot {\gamma }^{1/4}$.
The segregation flux is observed to decrease with increasing pressure (e.g. Golick & Daniels Reference Golick and Daniels2009; Fry et al. Reference Fry, Umbanhowar, Ottino and Lueptow2018), with recent measurements suggesting that the segregation flux that scales approximately as  $p^{-1}$ (Duan et al. Reference Duan, Umbanhowar, Ottino and Lueptow2020; Barker et al. Reference Barker, Rauter, Maguire, Johnson and Gray2021). This is very close to the scaling $p^{-7/8}$ that we predict due to the dependence of just the drag on pressure, suggesting again that the driving segregation force $S_i$ depends only very weakly on pressure ( $S_i \sim p ^{-1/8}$) in these flows.
This inference that the driving segregation force  $S_i$ is nearly independent of $\dot {\gamma }$ and $p$ in free-surface flows is consistent with previous research. In steady free-surface flows, the (hydrostatic) pressure gradient is approximately constant due to the constant gravitational acceleration and near-constant grain volume fraction, resulting in a driving segregation force that is nearly independent of shear rate and pressure (Gray & Thornton Reference Gray and Thornton2005). Guillard et al. (Reference Guillard, Forterre and Pouliquen2016) report that this constant gravitational force is the largest driver of segregation in steady dense free-surface flows on an incline. The segregation force $S_i$ also depends on the gradient of granular temperature, which might be expected to depend on $\dot {\gamma }$ and $p$. However, Larcher & Jenkins (Reference Larcher and Jenkins2015) show that the specific granular temperature distribution established in an equilibrium dense free-surface granular flow results in the driving force for kinetic-stress segregation scaling the same way as the gravitational segregation force. Thus, the near-constant driving segregation force that we deduce for free-surface flows is consistent with either segregation mechanism.
Typically, granular segregation rates have been inferred from experiments and discrete element simulations by measuring the changing packing fractions  $\phi _i$ either in a simple uniaxial flow that is time dependent (e.g. Tunuguntla et al. Reference Tunuguntla, Bokhove and Thornton2014) or in a heap flow in which the flow field is steady, but non-uniaxial and varying in two spatial dimensions (e.g. Fan et al. Reference Fan, Schlick, Umbanhowar, Ottino and Lueptow2014). It can be difficult or computationally expensive to relate the segregation rates measured to the flow conditions ( $\dot {\gamma }$, $p$,
$p$,  $\boldsymbol {\nabla } T$ etc.), either because feedback of the changing flow composition on the rheology means that underlying flow evolves in time with the segregation (Kowalski & McElwaine Reference Kowalski and McElwaine2013), or because a large simulation domain is required to resolve a flow field that varies in two dimensions (Schlick et al. Reference Schlick, Fan, Isner, Umbanhowar, Ottino and Lueptow2015). The characterisation of diffusion in (3.18) provides an alternative means of determining the driving segregation force $\boldsymbol {S}_i$ from uniaxial shear flows that are steady and vary in only one spatial dimension. In a shear flow, the no-flux boundary conditions applied to the surface and base of a flow imply that the segregation flux (4.1) is zero throughout the flow (Gray & Chugunov Reference Gray and Chugunov2006). Consequently, (4.2) reduces to a one-dimensional balance between segregation and diffusion,
 \begin{equation} S_i = \frac{\mathcal{D}_z}{\kappa} \left(\rho^{*} \bar{d}^{\,2} \dot{\gamma}^{2} p^{7} \right)^{1/8} \frac{\partial \phi_i}{\partial z}. \end{equation}
In discrete element simulations, such a statistically steady state, that varies in only one spatial dimension, allows the quantities  $p$,
$p$,  $\dot {\gamma }$ and $\partial \phi _i/\partial z$ to be measured to high precision, given sufficient simulation time, providing an accurate way to measure the driving segregation force.
5. Conclusions
We have made use of a steady uniform shear flow to study the drag force and diffusivity, which form a central part of mixture theory segregation models. Using discrete element simulations and dimensional analysis, the dependence of each of these on local flow properties has been found. In particular, for dense flows in the inertial regime, the coefficient of drag follows a power law in the inertial number with  $c \sim \dot {\gamma } I^{-7/4}$, and we offer a simple model which provides an explanation for this scaling.
Our model highlights the role that velocity fluctuations have in setting the inter-species drag. Gradients in the grain fluctuation velocity or granular temperature are known to act as a driving force for segregation (Hill & Tan Reference Hill and Tan2014; Staron & Phillips Reference Staron and Phillips2015); we show here that fluctuations also play a role in setting the speed of segregation through the drag force. Such fluctuations act to fluidise the flow, and consequently play an important role in the rheology (Kim & Kamrin Reference Kim and Kamrin2020), as well as the segregation of granular materials.
The approach used in this paper, namely studying the inter-species drag separately from the driving segregation forces, has several advantages over the approach of measuring the overall segregation flux in a non-uniform segregating flow. Since drag can be studied in a uniform environment, dimensional analysis can be used to constrain its parametric dependence, which in dense inertial flows reduces to a power-law scaling of a single dimensionless parameter  $I$. Uniform environments also allow parameters to be measured in discrete element simulations with modest computational cost, resulting in very little scatter in the measured segregation velocity (figure 3c) and the consequent ability to constrain precise scaling relationships such as (3.8).
Such improvements in the characterisation of segregation are much needed, since while segregation of polydisperse spheres of a modest range of sizes has been described (e.g. Marks et al. Reference Marks, Rognon and Einav2012; Schlick et al. Reference Schlick, Isner, Freireich, Fan, Umbanhowar, Ottino and Lueptow2016), modelling the segregation of highly polydisperse flows (with grain diameters ranging over several orders of magnitude) that occur in nature and industry remains a significant challenge. A wide range of grain sizes may result in complex demixing instabilities (Gray & Ancey Reference Gray and Ancey2011), and permits additional segregation mechanisms such as spontaneous percolation (Wilkinson & Edwards Reference Wilkinson and Edwards1982), in addition to the shear-rate-dependent segregation discussed in this paper. Description of the grain size and density distributions introduces several additional non-dimensional parameters into the problem, but the methods proposed here extend naturally to allow characterisation of the drag in these complex polydisperse mixtures.
Declaration of interest
The authors report no conflict of interest.


 Open access