


Schizophrenia
Multiple studies have found evidence of a cross-sectional association between psychotic illnesses and visual impairment, but the direction of association is unclear.Reference Viertiö, Laitinen, Perälä, Saarni, Koskinen and Lönnqvist1–Reference Shoham, Eskinazi, Hayes, Lewis, Theodorsson and Cooper4 Schizophrenia causes marked detriment to quality of life and life expectancy.Reference Hjorthøj, Stürup, McGrath and Nordentoft5,Reference Fleischhacker, Arango, Arteel, Barnes, Carpenter and Duckworth6 Existing treatments do not ameliorate these effects,Reference Trubetskoy, Pardiñas, Qi, Panagiotaropoulou, Awasthi and Bigdeli7 and prevention would be preferable because of the considerable distress and social, mental and cognitive harms experienced.
Myopia/poor distance acuity
Myopia, or short-sightedness, is a type of refractive error. It is the most common cause of distance visual impairment globally, alongside cataracts.8 It occurs when light entering the eye falls short of the retina, creating blurred images at distance (poorer visual acuity).9 Prevalence is increasing, and myopia is predicted to affect 50% of the global population by 2050.Reference Mountjoy, Davies, Plotnikov, Smith, Rodriguez and Williams10 In some populations in East Asia, 80–90% of school-leavers are already affected.Reference Morgan, Ohno-Matsui and Saw11 Myopia can usually be corrected by visual aids, but this typically relies on the initiative of individuals to seek optical care, which is often only available privately.9
Visual impairment and psychosis
A meta-analysis of cross-sectional studies investigating the association between visual acuity impairment and psychosis, which cannot elucidate the direction of effect, found an association (odds ratio 1.76, 95% CI 1.34–2.31) in studies classing visual acuity impairment of any cause and psychosis (odds ratio 1.85, 95% CI 1.17–2.92) as the exposure.Reference Shoham, Eskinazi, Hayes, Lewis, Theodorsson and Cooper4
Several studies have considered whether visual impairment could be a causal risk factor for psychosis.Reference Hayes, Picot, Osborn, Lewis, Dalman and Lundin12 Theoretical rationale for this is described in the Protection against Schizophrenia (PaSZ) model.Reference Landgraf and Osterheider13 This model highlights the absence of reported cases of a person with congenital cortical blindness developing schizophrenia. It proposes that congenitally blind individuals are protected from aberrant visual input – a risk factor for schizophrenia.Reference Landgraf and Osterheider13 It has been noted that cognitive alterations, such as improved working memory, which enable congenitally blind people to perceive the world without vision are the reverse of typical deficits in schizophrenia, perhaps creating a buffering effect.Reference Silverstein, Wang and Keane14 Conversely, individuals who lose vision but lack these adaptations might have elevated risk because of a reliance on visual input to process surroundings.Reference Silverstein, Wang and Keane14 Two large longitudinal studies of children and young adults found that myopia is associated with future psychosis.Reference Hayes, Picot, Osborn, Lewis, Dalman and Lundin12,Reference Shoham, Hayes, Cooper and Lewis15
Conversely, psychotic illnesses could be a causal risk factor for visual impairment. Affected individuals may experience ocular side-effects from antipsychotic medications and are at increased risk of comorbidities that impair eyesight.Reference Viertiö, Laitinen, Perälä, Saarni, Koskinen and Lönnqvist1,Reference Osborn, Hardoon, Omar, Holt, King and Larsen16,Reference Richa and Yazbek17 They may also spend more time indoors, a risk factor for myopia.Reference Rose, Morgan, Ip, Kifley, Huynh and Smith18 N-methyl-D-aspartate (NDMA) receptor dysfunction has also been implicated in both impaired visual acuity and schizophrenia.Reference Brandt, Oberwahrenbrock, Mikolajczak, Zimmermann, Prüss and Paul19,Reference Singh, Poterba, Curtis, Akil, Al Eissa and Barchas20 Several cross-sectional studies have reported higher rates of myopia and lower self-reported recent optician attendance in people with schizophrenia and other psychotic illnesses than in the general population.Reference Viertiö, Laitinen, Perälä, Saarni, Koskinen and Lönnqvist1,Reference Zheng, Tang, Correll, Ungvari, Chiu and Xiang21–Reference Smith, Pantelis, McGrath, Tangas and Copolov23 To our knowledge, this association has not previously been explored in longitudinal studies.
A third possible explanation for the association between visual impairment and psychosis is that these conditions share an underlying neurological vulnerability, or that there is confounding by other variables such as socioeconomic status and general health. The possibility of shared neurological vulnerability is supported by functional and imaging studies showing retinal changes in people with psychotic illnesses and their offspring.Reference Silverstein, Fradkin and Demmin24–Reference Moreau, Marc, Maziade, Alexandra and Mérette26
Mendelian randomisation
Identifying the nature of the association could aid prevention or treatment of either condition. Observational cohort studies are subject to unmeasured and residual confounding, and cannot completely exclude reverse causation. Mendelian randomisation aims to measure causal relationships by minimising the effects of confounding and reverse causation.Reference Mountjoy, Davies, Plotnikov, Smith, Rodriguez and Williams10 It uses genetic variants as proxy exposures to simulate a randomised design, since genetic variants were randomly allocated at conception.Reference Davies, Holmes and Davey Smith27 Assumptions of Mendelian randomisation methodology include relevance (that genetic variants associate with the exposure), independence (that they share no common cause with outcome) and exclusion restriction (that they influence the outcome exclusively via the exposure).Reference Davies, Holmes and Davey Smith27 We aimed to conduct the first Mendelian randomisation study to test the hypotheses that poorer distance visual acuity is a causal risk factor for schizophrenia, and schizophrenia is a causal risk factor for poorer distance visual acuity.
Method
We followed the Strengthening the Reporting of Observational Studies in Epidemiology using Mendelian Randomization (STROBE-MR) guidelines when reporting results.28 No individual-level data was used in this study; therefore participant consent was not required.
We used summary statistics (published effect sizes and standard errors from genome-wide association studies (GWAS)) to conduct bidirectional, two-sample Mendelian randomisation. Two-sample Mendelian randomisation allows for the largest samples to be employed in finding genetic instruments, regardless of whether the instruments’ association with the outcome was measured in the same sample, increasing power.Reference Burgess and Thompson29
We ran a comparison analysis using dental caries in place of poor distance acuity where an association was found, to assess neglect of healthcare as a possible mechanism.
Samples used in schizophrenia GWAS
Psychiatric Genomics Consortium
The Psychiatric Genomics Consortium (PGC) is a consortium of case–control studies aimed at identifying genetic variants associated with psychiatric disorders.Reference Trubetskoy, Pardiñas, Qi, Panagiotaropoulou, Awasthi and Bigdeli7 The data-set comprises 90 studies, including 67 390 schizophrenia cases and 94 015 controls, of which 80% had European ancestry (N = 129 124).Reference Trubetskoy, Pardiñas, Qi, Panagiotaropoulou, Awasthi and Bigdeli7 Across samples, cases could be defined as follows: diagnosis of schizophrenia, schizoaffective disorder or schizophrenia spectrum disorder determined through consensus between psychiatrists; validated diagnostic interview; structured assessment; review of medical records or a combination of these.Reference Trubetskoy, Pardiñas, Qi, Panagiotaropoulou, Awasthi and Bigdeli7 Analysed separately were 22 778 schizophrenia cases and 35 362 controls of East Asian ancestry (N = 58 140).Reference Lam, Chen, Li, Martin, Bryois and Ma30
Samples used in myopia, refractive error and visual acuity GWAS
UK Biobank
Between 2006 and 2010, over 500 000 UK residents aged 40–60 years were recruited to the UK Biobank cohort.Reference Sudlow, Gallacher, Allen, Beral, Burton and Danesh31 Further details are available.32 A range of health variables are assessed by questionnaires, examination and blood sampling in this ongoing, longitudinal study. Strength of lens required for correction of refractive error, or spherical equivalent, is measured in dioptres. Myopia status was determined either by spherical equivalent measured by autorefractor, or inferred using a questionnaire and other data: age, gender, age of first spectacle or contact lens wear, and year of birth.Reference Hysi, Choquet, Khawaja, Wojciechowski, Tedja and Yin33 A total of 102 117 participants had both measured refractive error and genotyping.Reference Hysi, Choquet, Khawaja, Wojciechowski, Tedja and Yin33 An additional 108 956 cases and 70 941 controls had inferred myopia status.Reference Hysi, Choquet, Khawaja, Wojciechowski, Tedja and Yin33 Myopia status was meta-analysed,Reference Hysi, Choquet, Khawaja, Wojciechowski, Tedja and Yin33 and contributed to our poor distance acuity exposure instrument.
We also used UK Biobank summary statistics for the phenotype of continuous visual acuity. At baseline assessment, 116 011 participants had their habitual visual acuity measured, using their usual corrective aids.Reference Cumberland, Bao, Hysi, Foster, Hammond and Rahi34 Of these, 90 214 had European ancestry and 923 had East Asian ancestry. This generated a right eye logarithm of minimal angle of resolution (logMAR) score, with negative numbers indicating ‘better than normal’ and positive numbers indicating ‘worse than normal’ distance vision.Reference Cumberland, Bao, Hysi, Foster, Hammond and Rahi34 Scores ranged from −0.66 to +1.35.35 Phenome-wide association scans were performed using the PHEnome Scan ANalysis Tool (PHESANT), to find single nucleotide polymorphisms (SNPs) associated with a wide variety of traits in a hypothesis-free manner.Reference Millard, Davies, Gaunt, Davey Smith and Tilling36,37 We chose habitual right eye logMAR score because it incorporated correction of myopia (e.g. glasses), and non-receipt of corrective aids is a possible mechanism by which schizophrenia could cause poorer acuity.
We used the summary statistics for dental caries in the UK Biobank,Reference Millard, Davies, Gaunt, Davey Smith and Tilling36 established by ICD-10 diagnosis from healthcare records.38 There were 3646 cases and 416 885 controls with European ancestry (N = 420 531).
In a post hoc analysis, we also used binary myopia correction status, determined by reporting that glasses or contact lenses were needed mainly for short-sightedness,39 which yielded 33 358 cases and 386 580 controls of European ancestry (N = 419 938).
23andme
23andme is a private company offering genotyping. Consenting customers were asked the following questions: ‘Have you ever been diagnosed by a doctor with near-sightedness (near objects are clear, far objects are blurry)?’ and ‘Are you near-sighted (near objects are clear, far objects are blurry)?’; and with the same descriptor, ‘What vision problems do you have?’ and ‘Prior to your LASIK eye surgery, what vision problems did you have?’. These questions identified 106 086 probable myopia cases and 85 757 controls used in subsequent meta-analysis (N = 191 841).Reference Hysi, Choquet, Khawaja, Wojciechowski, Tedja and Yin33
Consortium of Refractive Error and Myopia
The Consortium of Refractive Error and Myopia (CREAM), designed to further knowledge of genetics of myopia and refractive error, comprised 34 079 participants aged ≥25 years who did not have major ocular conditions that could alter refractive error.Reference Hysi, Choquet, Khawaja, Wojciechowski, Tedja and Yin33 All had refractive error measured and an average between the two eyes taken.Reference Fan, Guo, Tideman, Williams, Yazar and Hosseini40 Methods specific to each study within CREAM are described elsewhere.Reference Tedja, Wojciechowski, Hysi, Eriksson, Furlotte and Verhoeven41 Linear regression was used to identify SNPs associated with spherical equivalent.Reference Hysi, Choquet, Khawaja, Wojciechowski, Tedja and Yin33
The Genetic Epidemiology Research in Adult Health and Aging Cohort
The Genetic Epidemiology Research in Adult Health and Aging Cohort (GERA) cohort has been described in detail elsewhere.Reference Banda, Kvale, Hoffmann, Hesselson, Ranatunga and Tang42 It is part of the Kaiser Permanente Research Program on Genes, Environment, and Health, and includes 34 998 adults who had spherical equivalent measured at least once between 2008 and 2014. Mean spherical equivalent from both eyes at first documented assessment was used in meta-analysis.Reference Hysi, Choquet, Khawaja, Wojciechowski, Tedja and Yin33 Linear regression was used to determine SNPs associated with spherical equivalent.Reference Hysi, Choquet, Khawaja, Wojciechowski, Tedja and Yin33
The above binary poor distance acuity status samples were combined in a meta-analysis with a Z-score method (N = 542 932).Reference Hysi, Choquet, Khawaja, Wojciechowski, Tedja and Yin33
Meta-analysis of severe myopia in East Asian and South-East Asian ancestry participants
Meguro and colleagues performed a GWAS meta-analysis of 2549 patients with severe myopia and 11 547 healthy controls of East and South-East Asian ancestry, to identify SNPs associated with high (severe) myopia, which is expected to yield more genetic variants than milder forms.Reference Meguro, Yamane, Takeuchi, Miyake, Fan and Zhao43 The studies variably defined high myopia as spherical equivalent in at least one eye of ≤−5.0, ≤−6.0 or ≤−9.0 dioptres, or having an axial length >26 mm. Controls without myopia were defined as spherical equivalent ≥−0.50 or ≥−1.0 dioptres in both eyes. Formal ophthalmic examination determined phenotypes.
Instrument selection
All of our analyses used summary data. The PGC Schizophrenia Working group have identified 270 independent genetic loci across ancestries associated with schizophrenia as a binary phenotype with genome-wide significance.Reference Trubetskoy, Pardiñas, Qi, Panagiotaropoulou, Awasthi and Bigdeli7 Around 60–80% of phenotype variance in schizophrenia can be attributed to genetic factors,Reference Trubetskoy, Pardiñas, Qi, Panagiotaropoulou, Awasthi and Bigdeli7 and these genetic variants are estimated to account for 24% of this heritability.Reference Trubetskoy, Pardiñas, Qi, Panagiotaropoulou, Awasthi and Bigdeli7 Fine-mapping has increased the credibility of many loci as containing causal genes, and genes preferentially expressed in brain tissues showed enriched associations.Reference Trubetskoy, Pardiñas, Qi, Panagiotaropoulou, Awasthi and Bigdeli7
Across 542 934 individuals from the UK Biobank, 23andme, the GERA cohort and CREAM consortium, 449 genetic loci associated with myopia with genome-wide significance (P < 5 × 10⁻⁸) have been identified through meta-analysis.Reference Hysi, Choquet, Khawaja, Wojciechowski, Tedja and Yin33 These analyses were restricted to participants of European ancestry. Refractive error has a heritability of 60–80%,Reference Tedja, Haarman, Meester-Smoor, Kaprio, Mackey and Guggenheim44 and collectively, these SNPs are estimated to explain 18.4% of this heritability.Reference Hysi, Choquet, Khawaja, Wojciechowski, Tedja and Yin33 The majority are in regions with known, plausible biological pathways to myopia and in genes preferentially expressed in ocular tissues.Reference Hysi, Choquet, Khawaja, Wojciechowski, Tedja and Yin33
In the meta-analysis of East Asian and South-East Asian ancestry participants, nine genetic loci were discovered to be associated with high myopia with genome-wide significance.Reference Meguro, Yamane, Takeuchi, Miyake, Fan and Zhao43
Where necessary, we calculated beta-values and standard errors for SNP associations with poor distance acuity from the meta-analysis Z-scores, using formulae in a supplement.
We applied the following criteria to identify instrument SNPs for each exposure: association with exposure in relevant ancestry sample at significance level P < 5 × 10⁻⁸; minor allele frequency (MAF) >0.005; imputation accuracy (only available for schizophrenia instruments) info score >0.7 and not in linkage disequilibrium with another instrument SNP (defined as correlation >0.2). We removed palindromic SNPs with MAF > 0.42 by using the TwoSampleMR package in R software (version 4.3.0 for Windows; Posit, Boston, MA, USA; https://posit.co/), because of potential uncertainty about which was the effect allele.Reference Hemani, Tilling and Davey Smith45,Reference Hemani, Zheng, Elsworth, Wade, Haberland and Baird46
When selecting SNPs associated with habitual logMAR score from the UK Biobank as instruments, we used the more lenient threshold of P < 5 × 10⁻⁵ because the number of variants associated at genome-wide significance was insufficient, and the same criteria for SNP selection otherwise.
Mendelian randomisation analysis
We used instrumental SNPs identified as associated with the exposure in discovery samples as proxies for the exposure, and tested their associations with the outcome in the outcome sample, pooling these associations to create an overall effect estimate of the exposure on the outcome.
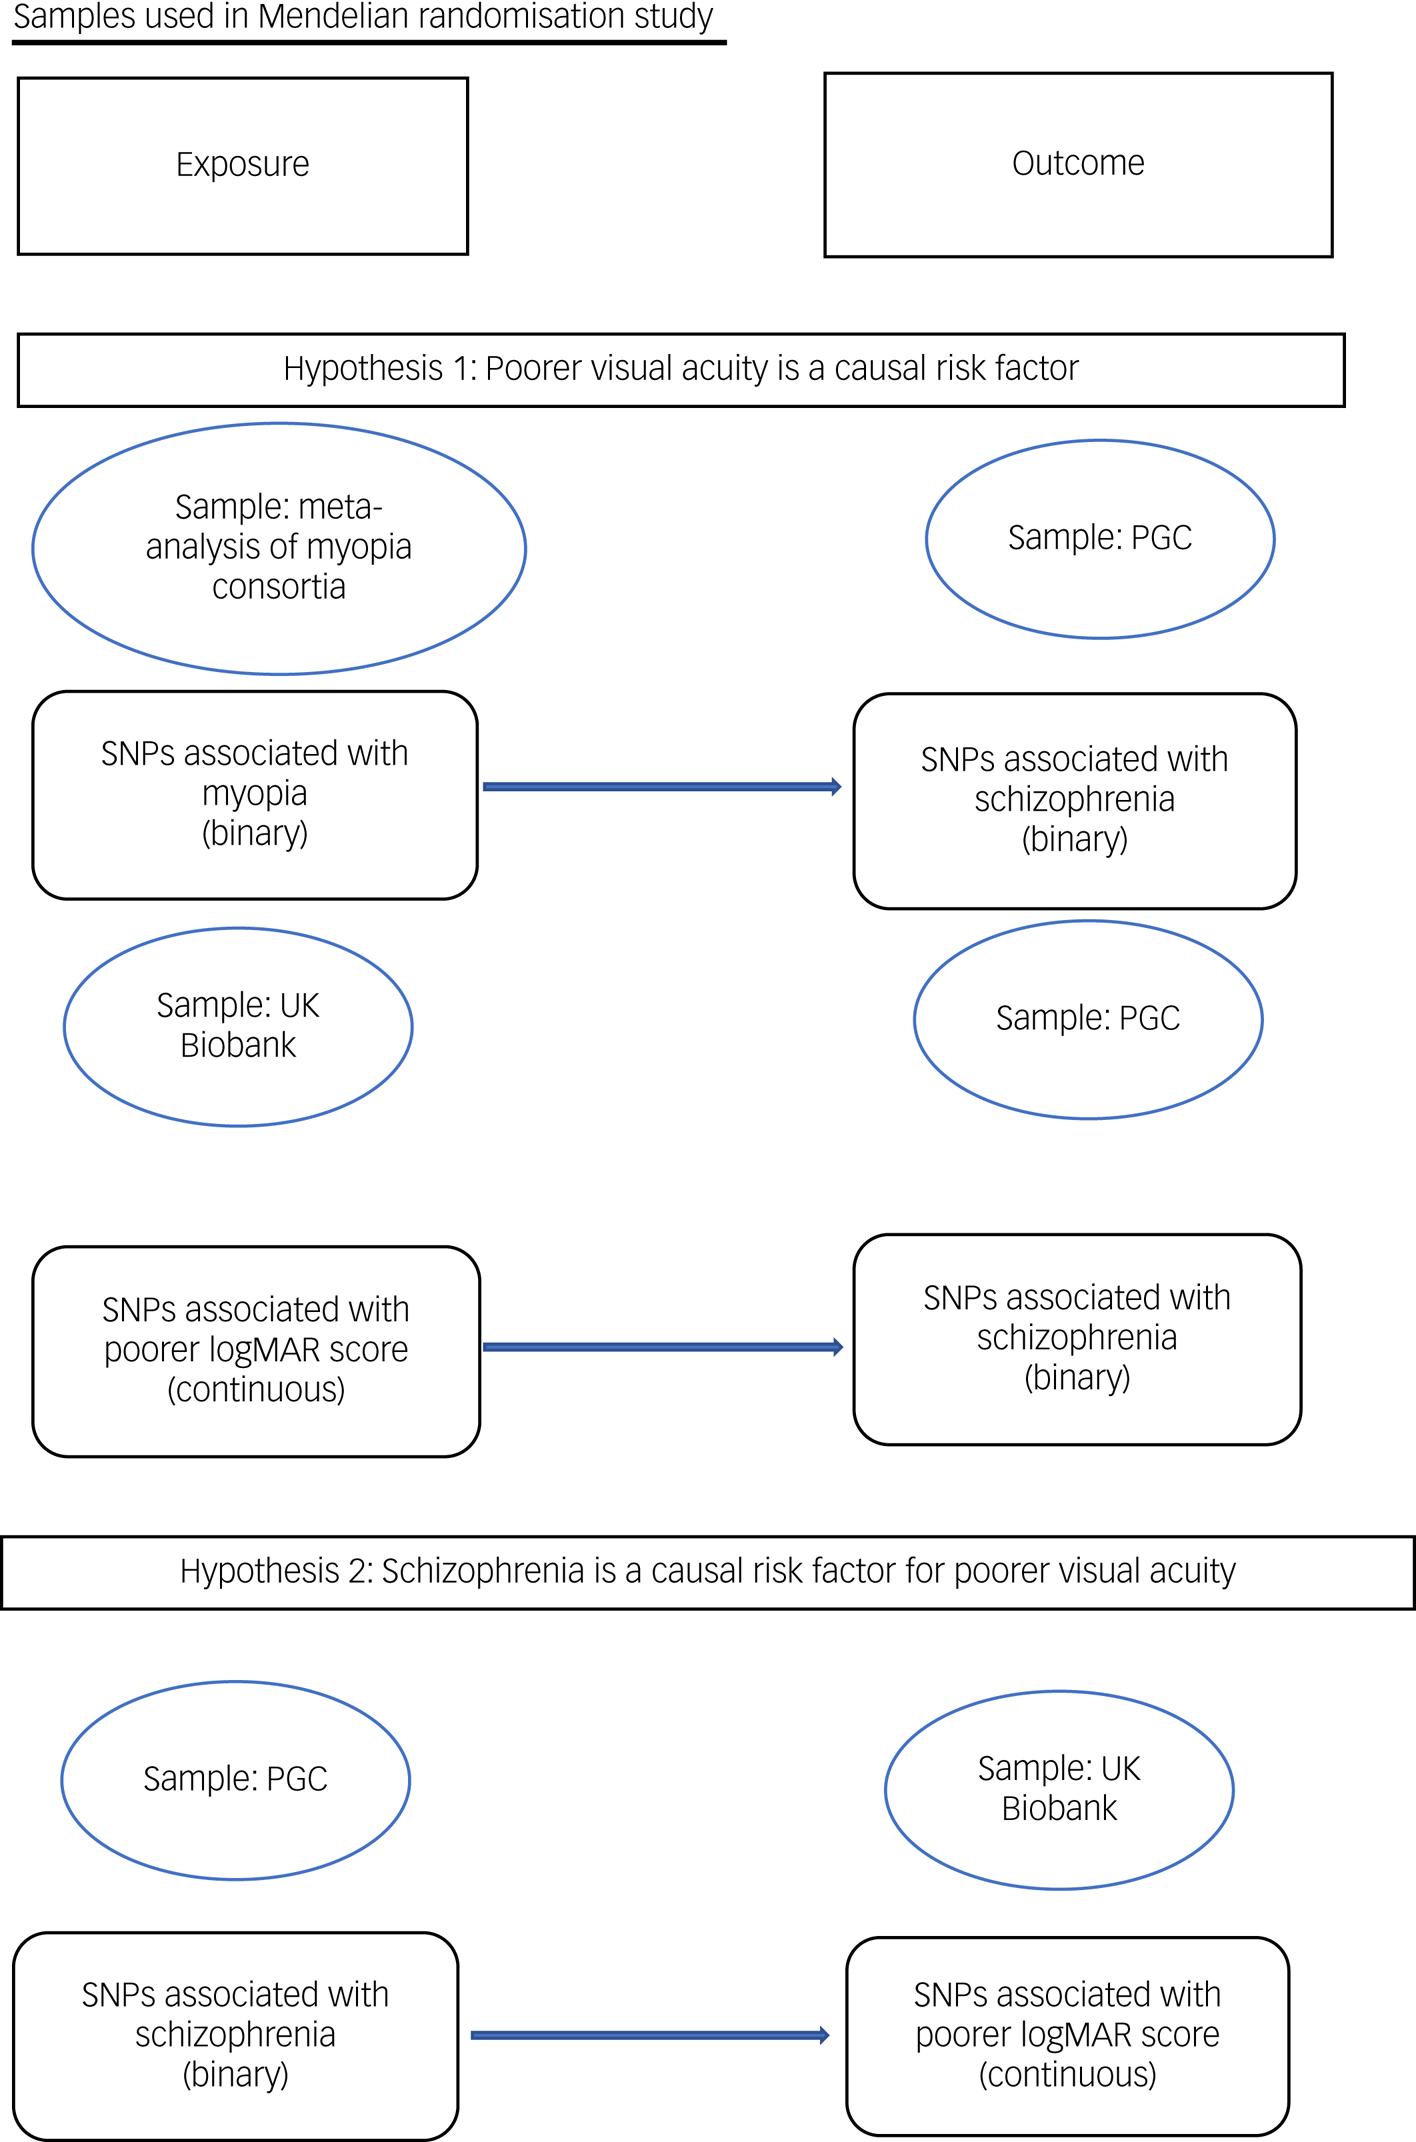
To test hypothesis 1 (that poor distance acuity is a causal risk factor for schizophrenia), we used SNPs identified in the meta-analysis of poor distance acuity samples as instrumental exposures, and tested their association with schizophrenia in the PGC from summary statistics. We also used SNPs associated with poorer habitual logMAR score measured at a distance of 4 m from the UK Biobank as instrumental exposures.47 To test hypothesis 2 (schizophrenia is a causal risk factor for poorer visual acuity), we used SNPs identified as associated with schizophrenia in the PGC as instrumental exposures, and tested their associations with poorer logMAR score in the UK Biobank (Fig. 1).
Samples used in Mendelian randomisation study. logMAR, logarithm of minimal angle of resolution; PGC, Psychiatric Genomics Consortium; SNP, single nucleotide polymorphism.
For our primary analyses, we used samples with European ancestry, as it was the group in which most relevant SNPs have been identified. Using statistics from homogenous ancestry groups reduces the chances of confounding by population structure and use of invalid instruments in Mendelian randomisation.Reference Davies, Holmes and Davey Smith27,Reference Huang, Sallah, Dunca, Trivedi, Hunt and Hodgson48 We analysed data from samples with East Asian ancestry to test whether findings are consistent in other ancestry groups. No published schizophrenia GWAS that was sufficiently large was available for any other ancestry group.
We used the package TwoSampleMR to run analyses, using R version 4.0.3.Reference Hemani, Tilling and Davey Smith45,Reference Hemani, Zheng, Elsworth, Wade, Haberland and Baird46,49 Our primary analyses used the inverse variance-weighted (IVW) method, which pools SNP effect estimates weighted for the inverse variance of the ratio estimate.Reference Burgess, Butterworth and Thompson50 Where the outcome was binary (poor distance acuity or schizophrenia), we converted the association between exposure and outcome to an odds ratio.
Sensitivity analyses
Mendelian randomisation methodology assumes absence of directional horizontal pleiotropy, where SNPs influence the outcome directly or via phenotypes other than the exposure, creating an artificial direction of effect.Reference Hemani, Bowden and Davey Smith51 Therefore we also conducted Mendelian randomisation using several methods that are robust to violations: Mendelian randomisation-Egger, which does not constrain the intercept to zero; the weighted mode, which is valid if the largest group of SNPs are valid instruments; and the weighted median method, which is valid if >50% SNPs are valid instruments.Reference Burgess and Thompson29 We report the significance of the Mendelian randomisation-Egger intercept from a random-effects model to test for horizontal pleiotropy. As further sensitivity analyses, we conducted single SNP and ‘leave-one-out’ analysis, and the Mendelian randomisation pleiotropy residual sum and outlier (MR-PRESSO) test to identify outlying SNPs, with a significance threshold of 0.05.Reference Verbanck, Chen, Neale and Do52 We performed Cochran's Q-test for heterogeneity, and generated scatter and funnel plots to visually inspect results. Symmetry of the funnel plot is evidence against directional pleiotropy.Reference Anderson, Howe, Wade, Ben-Shlomo, Hill and Deary53
If a statistically significant association was found, we compared the results where poor distance acuity was the phenotypic exposure or outcome to dental caries, to see if overall neglect of physical healthcare was a likely mechanism by which the association could occur.
Schizophrenia as a cause of myopia non-correction
As a post hoc analysis, we also tested whether schizophrenia as exposure was causally associated with reporting or not reporting needing glasses for short sight as an outcome.
Results
Hypothesis 1: poor distance acuity is a causal risk factor for schizophrenia in European ancestry samples
We found no evidence of a causal effect of poor distance acuity on schizophrenia (odds ratio 1.00, 95% CI 0.91–1.10; P = 0.955) (Table 1, Fig. 2 and Supplementary Figs 1–3).
Graphical results of Mendelian randomisation. logMAR, logarithm of minimal angle of resolution; SNP, single nucleotide polymorphism.

Results of Mendelian randomisation analysis

SNP, single nucleotide polymorphism; logMAR, logarithm of minimal angle of resolution.
Hypothesis 1: severe myopia is a causal risk factor for schizophrenia in East Asian ancestry samples
There was also no evidence of association between severe myopia as exposure and schizophrenia as outcome in East Asian ancestry samples (odds ratio 1.00, 95% CI 0.95–1.05; P = 0.962) (Table 1, Fig. 2 and Supplementary Figs 1–3).
Hypothesis 1: poorer habitual visual acuity is a risk factor for schizophrenia in European ancestry samples
Consistent with our previous analyses, using poorer continuous logMAR score as the exposure phenotype to represent visual impairment in a sample of people with European ancestry found no evidence of an association with schizophrenia as outcome (odds ratio for one-point poorer logMAR score: 0.99, 95% CI 0.88–1.12; P = 0.927) (Table 1, Fig. 2 and Supplementary Figs 1–3).
Hypothesis 1: poorer habitual visual acuity is a risk factor for schizophrenia in East Asian ancestry samples
We similarly found no association between poorer visual acuity and schizophrenia in East Asian ancestry samples in the IVW analysis (odds ratio per one-point poorer logMAR score: 0.98, 95% CI 0.94–1.01; P = 0.179) or any other method.
Throughout hypothesis 1 analyses, sensitivity analyses were in keeping with primary analyses (Table 1, Fig. 2 and Supplementary Figs 1–3).
Hypothesis 2: schizophrenia is a causal risk factor for poorer habitual visual acuity in European ancestry samples
We found evidence of a causal effect based on schizophrenia instruments’ association with the outcome (poorer habitual visual acuity) when using the IVW method (beta coefficient: 0.024, 95% CI 0.014–0.033; P = 9.63 × 10⁻⁷) (Table 1, Fig. 2 and Supplementary Figs 1–3). The direction of effect was consistent across other Mendelian randomisation methods. The Mendelian randomisation-Egger intercept indicated no evidence of pleiotropy (P = 0.877), suggesting a true effect, but Cochran's Q-statistic showed evidence of heterogeneity (P = 0.029). However, the funnel plot was broadly symmetrical (Supplementary Fig. 3(e)). MR-PRESSO did not identify outlying SNPs, and IVW results remained significant in single SNP and leave-one-out analyses, suggesting outliers were not responsible for the association (Supplementary Figs 1(e) and 2(e)).
Hypothesis 2: schizophrenia is a causal risk factor for poorer habitual visual acuity in East Asian ancestry samples
The causal estimate for East Asian ancestry samples was larger (beta coefficient: 0.186, 95% CI −0.008 to 0.379; P = 0.060) and directionally consistent with the estimate for European ancestry. However, it did not reach statistical significance, and the results from this analysis were imprecise (Table 1, Fig. 2 and Supplementary Figs 1–3).
Post hoc analysis: schizophrenia is a causal risk factor for myopia
Schizophrenia was negatively associated with reporting glasses use for myopia (odds ratio 0.95, 95% CI 0.920–0.974; P = 0.0002). Sensitivity methods were consistent with this (Table 1, Fig. 2 and Supplementary Figs 1–3).
Schizophrenia as exposure and dental caries as outcome in European ancestry samples
There was a negative association between schizophrenia as exposure and dental caries as outcome when using identical methods to those used to test hypothesis 2 (odds ratio 0.948, 95% CI 0.903–0.995; P = 0.032) (Table 1, Fig. 2, Supplementary Figs 1–3 and Supplementary Table 1).
Discussion
Main findings
We found no evidence to support a causal role of poor distance acuity in the development of schizophrenia. Conversely, we found evidence that schizophrenia is a casual risk factor for poorer visual acuity in people of European ancestry. Although Cochran's Q-test showed evidence of heterogeneity, this test has been suggested to be oversensitive with large sample sizes.Reference Higgins, Thompson, Deeks and Altman54 There was little evidence of heterogeneity between results from European and East Asian ancestry groups, and the smaller sample size resulted in less precise estimates for the analyses in participants with East Asian ancestry. The size of the effect was very small: less than a one-line difference on the visual acuity chart.
In our comparison analysis to investigate neglect of physical healthcare as a possible mechanism, we found a negative association when dental caries was the outcome. This is likely to be because people with schizophrenia were less likely to receive dental treatment and have this outcome recorded, in keeping with neglect of healthcare. Our finding that schizophrenia was negatively associated with reporting glasses use for myopia further suggests that neglect of eyecare specifically may be a mechanism.
Strengths and limitations
We tested the effect of poor distance acuity on schizophrenia risk and schizophrenia on risk of poor distance acuity, using a methodology not previously applied to this question. We were able to exclude reverse causation and reduce confounding from unobserved environmental variables. The SNPs from European ancestry samples were credible instruments because of their strong associations with the exposures in meta-analyses and replication samples and recognised biological pathways to the exposures.
There are, however, limitations to our methodology. Mendelian randomisation relies on the assumption of no directional horizontal pleiotropy, which cannot be proven, although we have carried out multiple sensitivity analyses to detect this.Reference Verbanck, Chen, Neale and Do52 Sample overlap can bias results toward the null in two-sample Mendelian randomisation.Reference Burgess, Davies and Thompson55 We have aimed to exclude this where possible, by using international rather than UK samples alongside the UK Biobank. Also, as schizophrenia is a relatively rare condition, it is unlikely that many cases would be present in the other studies. We cannot exclude the possibility of collider bias as a possible explanation for the finding that schizophrenia contributes causally to myopia.Reference Holmberg and Andersen56 However, myopia did not, to our knowledge, influence the chance of selection, making this unlikely.
There are also limitations regarding choice of phenotypes. The studies used to detect genetic variants associated with poor distance acuity used different phenotypic measures, including self-reported rather than objective measures. However, self-reported short-sightedness has been shown to be a reliable indicator of myopia.Reference Breslin, O'Donoghue and Saunders57 Perhaps more importantly, we were unable to account for correction of vision using aids when poor distance acuity was the exposure, and so cannot exclude modification of risk through this. There is some evidence that correction of myopia reduces the association with subsequent schizophrenia.Reference Hayes, Picot, Osborn, Lewis, Dalman and Lundin12 Indeed, people self-reporting myopia may be more likely to be using aids than people who are unaware of their poor eyesight. We had no information regarding age at onset of myopia, which would alter the dose of exposure received and whether it was received during central nervous system development, which may modify associations, particularly as schizophrenia is a neurodevelopmental disorder.Reference McCutcheon, Reis Marques and Howes58
Further, we have used techniques that assume a linear relationship between exposure and outcome. As most cases of myopia lead to mild, rather than severe, distance visual acuity impairment, we consider the linear relationship likely despite the non-linear shape of the PaSZ model across degrees of visual impairment. We were nevertheless restricted to using severe myopia as the phenotype in one analysis of East Asian ancestry samples. However, the authors of this GWAS used this phenotype to yield more variants associated with myopia overall.Reference Meguro, Yamane, Takeuchi, Miyake, Fan and Zhao43 Our results are not necessarily inconsistent with more severe forms of visual impairment, such as retinal conditions with different genetic determinants, being a causal risk factor for psychotic illnesses.
Comparison with other studies
We are unaware of any prior Mendelian randomisation studies on this topic. Three longitudinal studies of children report a positive association between ocular dysfunction and subsequent psychotic symptoms or diagnoses.Reference Shoham, Hayes, Cooper and Lewis15,Reference Schiffman, Maeda, Hayashi, Michelsen, Sorensen and Ekstrom59,Reference Schubert, Henriksson and McNeil60 However, similar studies of adolescents and adults give mixed findings, with some reporting no association, some a positive association and some a negative association.Reference Hayes, Picot, Osborn, Lewis, Dalman and Lundin12,Reference Caspi, Vishne, Reichenberg, Weiser, Dishon and Lubin61–Reference Hamedani, Thibault, Shea and Willis64 There are, therefore, two likely explanations for our null result when visual impairment is the exposure. The first is that that myopia or mild visual impairment is a causal risk factor for psychosis, but only during a critical period of central nervous system development; this was captured in the studies of children, but not with our phenotype measure in this study, because genetic variants for childhood visual impairment specifically may not fully overlap with our instrument, which related to lifelong phenotype.Reference Fan, Guo, Tideman, Williams, Yazar and Hosseini40 The second is that there is truly no causal effect of poor distance acuity on schizophrenia, and the finding in other studies is a result of residual confounding. We consider this the most likely because there was no trend toward a positive association in our study, which might be expected if poor distance acuity was relevant at any time point. Further, psychotic symptoms, as measured in some of the studies, do not equate to having schizophrenia and might be non-pathological or result from other conditions associated with poorer eyesight, such as depression.Reference Bourgin, Tebeka, Mallet, Mazer, Dubertret and Le Strat65
In conclusion, our results suggest that mild visual acuity impairment is not causally associated with subsequent schizophrenia, but schizophrenia as an exposure is causally associated with poorer visual acuity, although the effect was very small. Regardless of the mechanism, this study highlights a potentially unmet health need in people with schizophrenia. A combination of visual side-effects from medications, and possible lower propensity to seek treatment, could be potentially important areas to investigate to improve quality of care in this group. Shared actions of genes may also account for some of the association. With further research, this may translate into clinical benefit for patients, such as wider use of routine eye tests at the annual physical health check for people with serious mental illnesses. Future research could aim to use mediation analyses to establish mechanisms by which schizophrenia might lead to poorer vision, and to assess whether interventions to improve eye health for people with schizophrenia are acceptable and effective.
Supplementary material
Supplementary material is available online at https://doi.org/10.1192/bjo.2023.6
Data availability
Data used in this study are publicly available. Data can be accessed from the Psychiatric Genomics Consortium (https://www.med.unc.edu/pgc/), UK Biobank (http://www.nealelab.is/uk-biobank) and papers referenced in the article.
Acknowledgements
We are grateful to the Schizophrenia Working Group of the Psychiatric Genomics Consortium for providing us with ancestry-specific summary statistics, and to the participants in all of the GWAS studies included. We acknowledge the use of the UCL High Performance Computing Facility, and associated support services, in the completion of this work.
Author contributions
J.F.H. conceptualised the idea for this study, with contributions from all co-authors to developing the idea. A.M. helped with obtaining ancestry-specific data from the Psychiatric Genomics Consortium. N.S. wrote the study protocol, analysed the data and drafted the manuscript, with support from D.D. and K.K. N.B. informed on the design of the study, and helped write the manuscript with G.L. and C.C. All authors contributed to reviewing and editing the manuscript.
Funding
This work was funded by a National Institute for Health and Care Research (NIHR) Doctoral Fellowship (number NIHRDH-NIHR300703) awarded to N.S. J.F.H. is supported by the Wellcome Trust, the University College London Hospitals NIHR Biomedical Research Centre and the NIHR North Thames Applied Research Collaboration. The funders had no role in the study design, data collection, analysis, interpretation or writing of the manuscript.
Declaration of interest
N.S. is a trainee editor with BJPsych Open. No other authors have conflicts of interest to declare.


 Open access
eLetters
No eLetters have been published for this article.