


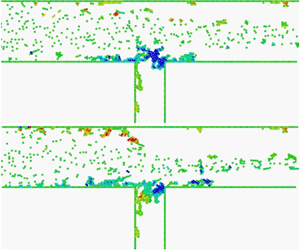



1. Introduction
The transport of micrometre-sized particles within confined geometries is an active subject of practical and scientific research, as it is found in everyday life and draws increasing interest in industrial applications. This phenomenon encompasses various fields, including the flow of blood in microvessels within our bodies (Poddar, Mondal & Madden Reference Poddar, Mondal and Madden2021), particle separation through microfiltration (Vernhet, Cartalade & Moutounet Reference Vernhet, Cartalade and Moutounet2003; Rayess et al. Reference Rayess, Albasi, Bacchin, Taillandier, Raynal and Mietton-Peuchot2011), applications in lab-on-a-chip devices (Agastin, King & Jones Reference Agastin, King and Jones2009; Samiei, Tabrizian & Hoorfar Reference Samiei, Tabrizian and Hoorfar2016) and material transport in microfluidics (Sharp & Adrian Reference Sharp and Adrian2005; Mirani, Fazlali & Rahimi Reference Mirani, Fazlali and Rahimi2021; Kim et al. Reference Kim, Jung, Lee, Jin and Ahn2023a,Reference Kim, Kim, Park, Jeon and Chob). Particle dynamics within microscopic channels, observed across diverse disciplines, shares several common characteristics. First, due to the small characteristic length scales found in a microchannel, particle dynamics occurs in the very-low-Reynolds-number regime, approaching zero. Therefore, to observe noticeable macroscopic structural changes occurring in the microchannel, analysis over a long-time scale is inevitably required. Second, stochastic fluctuations induced by Brownian motion or external excitations like background noise can also influence the dynamics of micro or sub-micro sized particles, which complicates the analysis (Zuriguel et al. Reference Zuriguel2014; Sendekie & Bacchin Reference Sendekie and Bacchin2016). Lastly, low Reynolds numbers in confined flow channels correspond to the regime where various factors influencing particle dynamics, including the background velocity of the fluid, hydrodynamic interactions between particles and inter-particle interactions, occur with comparable magnitudes. Thus, the complex interplay among these factors that influences particle dynamics has largely limited its comprehensive physical understanding, despite the importance of particle transport within confined microchannels. In these circumstances, numerical simulations that allow for the convenient and independent control of individual factors and enable easy comparisons with experimental results across various length scales can serve as valuable tools for studying particle dynamics in a flow channel.
Various simulation methods have been employed to comprehend the intricate interactions between particles and fluids within confined flow channels. These methods can be categorized based on the manner of describing both fluids and particles: Euler–Euler, Euler–Lagrangian and fully Lagrangian models. We outline the features of existing methodologies within each category, particularly when they are applied to simulate particle flow within microchannels.
As the first category, the Euler–Euler model treats the fluid and particles as an interpenetrating continuum and solves the momentum balance equations for both phases (Filtvedt el al. Reference Filtvedt, Holt, Ramachandran and Melaaen2012). In this approach, rather than seeking a detailed solution to the Navier–Stokes equation, a reduced description based on spatially or ensemble-averaged mathematical models is pursued, retaining the fundamental physical processes that determine the behaviour of the system (Prosperetti & Tryggvason Reference Prosperetti and Tryggvason2009). In the discretized computational domain, a key characteristic of the Eulerian framework is that the model equation is solved including the volume occupied by the particles. Specific body forces are set to make the so-called fictitious fluid inside each particle respond as if it is in rigid-body motion (Maxey Reference Maxey2017). One of the representative methods used in this category is the lattice Boltzmann method, where the simulation involves modelling fluid density on a discretized lattice using streaming and collision processes (Chen & Doolen Reference Chen and Doolen1998; Tong et al. Reference Tong, Li, He and Li2015; Johannsmann et al. Reference Johannsmann, Petri, Leppin, Langhoff and Ibrahim2023). Due to its adaptive nature and local dynamics, the lattice Boltzmann method can accommodate complex particle shapes and intricate confinement boundaries. Furthermore, the lattice Boltzmann method naturally introduces Brownian forces by incorporating random forces into fluid particles directly. However, despite being a linear simulation with respect to the number of colloidal particles, it exhibits a super-linear computational complexity in overdamped systems (Fiore et al. Reference Fiore, Usabiaga, Donev and Swan2017). As pointed out by Fiore & Swan (Reference Fiore and Swan2019), this is due to the characteristic behaviour of the Stokes flow in overdamped systems, so a sufficiently short simulation time scale must be set to allow vorticity to diffuse out of the system volume. Also, the need to resolve inertial degrees of freedom in the solvent results in a loss of efficiency when dealing with overdamped systems.
In the case of Euler–Lagrangian modelling, the fluid phase is described in a conventional averaged Eulerian grid, while groups of particles are tracked in a Lagrangian manner, adapted to Eulerian grids (Prosperetti & Tryggvason Reference Prosperetti and Tryggvason2009). Since each phase can employ an independent model equation, specific methods differ according to how forces are determined and how force localization on the particle is achieved. The force-coupling method is one example in which the particles, modelled by forcing terms spatially spread out in Gaussian envelopes, are added to the momentum equations of the fluid (Maxey & Patel Reference Maxey and Patel2001). Once the resolution is fine enough to resolve the Gaussian force envelope, the force-coupling method can accurately reproduce flow perturbations and is extensively used to study confined particulate flows (Agbangla, Bacchin & Climent Reference Agbangla, Bacchin and Climent2014a; Agbangla, Climent & Bacchin Reference Agbangla, Climent and Bacchin2014b). The force-coupling method offers an advantage in its ease of adaptation to complex channel boundaries, eliminating the necessity to compute an expensive Green's function for each iteration. However, a drawback exists when resolving particles in the near-contact range under lubrication interaction, where additional assumptions, such as introducing lubrication force and torque, are required to account for viscous lubrication (Maxey Reference Maxey2017). Additionally, the coupling of lubrication correction with Brownian fluctuation remains unclear, despite recent research findings (Yeo & Maxey Reference Yeo and Maxey2010). Another example within the Euler–Lagrangian model, widely used in the study of flow channels, is the discrete element method (DEM) coupled with a computational fluid dynamics (CFD) solver (Zhu et al. Reference Zhu, Zhou, Yang and Yu2007; Yang et al. Reference Yang, Cheng, Wang and Ahmad2019). The CFD solver discretizes domains using finite-volume or finite-element approximations, and nonlinear flow equations are solved iteratively (Wang et al. Reference Wang, Zhang, Furtney and Damjanac2022). The DEM provides dynamic information, including trajectories and transient forces acting on individual particles. This method has demonstrated its versatility in accommodating various shapes of simulated objects, including granular materials and bonded assemblies (Ai et al. Reference Ai, Chen, Rotter and Ooi2011; Ma & Huang Reference Ma and Huang2018). However, there are also limitations, such as the intrinsic reliance on approximations for determining the magnitude of the drag force applied to each individual suspended object. Additionally, to obtain a high resolution of accurate fluid flow, fluid mesh sizes much smaller than the diameters of particles are required, which can become a significant computational burden as the number of particles increases (Yang et al. Reference Yang, Cheng, Wang and Ahmad2019).
In the Stokes flow regime, fluid inertia becomes negligible, resulting in linear equations of motion. Therefore, fully Lagrangian approaches that describe particle dynamics, especially in microchannels, generate fluid disturbances about given boundaries by superimposing a fundamental solution to a point force. When incorporating boundary conditions through surface integrals, an infinite number of multipole terms is required to provide a spectrally accurate representation (Brady & Bossis Reference Brady and Bossis1988; Maxey Reference Maxey2017). As this is a formidable task, truncated multipole expansions are typically employed based on the desired level of accuracy. The commonly used method in this category is the Stokesian dynamics (SD) method, which uses Stokeslet, rotlet and stresslet terms along with associated degenerate multipoles. Lubrication corrections for viscous forces and torques, when particles are in close contact, are included in a pairwise manner to construct the resistance matrix. The Lagrangian approach offers the advantage of independently controlling the influence of particle–particle interactions and particle–surface interactions, facilitating a direct mapping of physical properties such as viscosity and temperature of the medium. However, obtaining the fundamental solution of fluid for arbitrary geometries is challenging, making it difficult to handle complex-shaped particles and confinement. Additionally, considering higher-order terms of far-field flow induced by particles necessitates the effect of matrix inversion, which can lead to expensive computational expenses.
Upon reexamining the characteristics of particulate transport in microchannels at a low-Reynolds-number region, microstructures develop over an extended time scale, and hydrodynamic forces, along with inter-particle interactions, exert comparable influences on the particles. Therefore, when evaluating the advantages of the simulation methodologies discussed earlier, formulating equations of motion for individual particles and tracking their micro-scale changes appears to be an appropriate choice. Euler–Lagrangian modelling is an approach widely used in the field of particle transport because it allows obtaining the velocity of the fluid at all points in the system domain, and the dynamics of closely located particles can be improved by using appropriate mesh refinement and sufficiently small time steps. However, this property can also become a drawback when the particle volume fraction is high or when particle interactions are predominantly attractive, as computational costs increase significantly due to the need for mesh refinements. Alternative methods exist, such as using a non-deforming mesh along the boundaries, as demonstrated by the immersed boundary method (Peskin Reference Peskin2002; Griffith & Patankar Reference Griffith and Patankar2020) or Brownian dynamics coupled with the finite-element method (Myung et al. Reference Myung, Song, Ahn and Lee2011; Jung et al. Reference Jung, Jeong, Park and Ahn2021). In these cases, solving the momentum balance for the fluid throughout the entire computational domain is still necessary, or many-body inter-particle hydrodynamic interactions are not taken into consideration, even in sparse particulate suspensions. This implies that even systems with a small number of particles do not benefit from cost savings. However, in the fully Lagrangian description, as the equations of motion are only solved at the centre of particles, a relatively low computational cost is required when the number of particles is low, which is proportional to the number of particles, to describe particle dynamics within the channel. However, while the fully Lagrangian description evaluates velocity disturbances by superimposing fundamental Green's solutions of the fluid equation, this Green's function becomes increasingly complex even with minor modifications to the boundaries. In some cases, no explicit solution may be available. Therefore, simulating particle transport in a confined flow channel using a fully Lagrangian description has been considered an inappropriate choice. Alternatively, methods incorporating only non-hydrodynamic interactions, such as Brownian dynamics, have frequently been used to study the interaction between channel walls and particles (Oberholzer et al. Reference Oberholzer, Stankovich, Carnie, Chan and Lenhoff1997; Chang, Chen & Lee Reference Chang, Chen and Lee2003; Brewer, Tsapatsis & Kumar Reference Brewer, Tsapatsis and Kumar2010).
In this study, we propose a novel simulation method to address the challenges associated with mesh refinement in the Eulerian framework and the complexity of boundary treatment in the Lagrangian framework, which is particularly applicable in microchannels with low Reynolds numbers. This new method combines a computational fluid dynamics solver with the Stokesian dynamics method, creating a multiscale simulation scheme. The advantages of our simulation methodology for exploring particle dynamics within microscopic channels can be summarized as follows. Through the Lagrangian framework, it is possible to simulate particle dynamics that is proportional to the number of particles, even for complex geometries. Additionally, simulations of particle interactions with high accuracy are achievable, especially when a large number of particles is present, by considering exact lubrication interactions between particles. Furthermore, because hydrodynamic forces and stresses acting on colloid particles or walls are explicitly obtained during the simulation process, it allows for an intuitive explanation of agglomerate deformation or resuspension dynamics at the individual particle scale, even in systems where the particles form structures and interact vigorously with walls. Therefore, our approach can serve as a comprehensive way of investigating particle dynamics in confined flow channels, from the entry of particles into the channel to the occurrence of channel clogging, even in environments with high areal fractions, without the need for introducing additional structural kinetic models or parameters.
The developed simulation method has been demonstrated to simulate the transport of attractive colloid suspensions within a microscopic channel, which is susceptible to causing particle fouling. Fouling initiates with the deposition of individual particles on an initially clean surface, and the continuous accumulation of particles can eventually lead to a complete blockage of the fluid cross-section (Henry, Minier & Lefevre Reference Henry, Minier and Lefevre2012). Consequently, the dynamics of cluster breakup and resuspension processes until clogging occurs become highly complex. While many existing simulation methods have been limited to observing only specific aspects of particle fouling, the proposed simulation method effectively captures particle and structural dynamics from the initial introduction of particles to the point of complete channel blocking.
This paper is structured as follows. In § 2, the equation of motion describing overdamped colloid particle dynamics inside a channel is derived by combining a fluid dynamics solver and the SD method. In the same section, a constrained SD formulation aimed at minimizing computational costs when including wall geometry within the SD framework is suggested and examined in comparison to existing methodologies using SD. In § 3.1, the established methodology is validated by comparing friction coefficients, rheological properties and diffusion coefficients to previous exact or numerical studies to assess how accurately it captures the dynamics of particles within the channel. Additionally, the efficiency of the constrained formulation is assessed based on the measured wall time of the simulation time step relative to the number of interior and wall particles. Furthermore, in § 3.2, the developed methodologies are applied to the contraction and T-shaped cross-flow channel, and comparisons are made with experimental results under the same flow conditions and inter-particle potential.
2. Simulation methods
In this section, a Lagrangian formulation is derived that describes the motion of individual particles when a colloid suspension is transported in a confined flow channel. The fundamental principle is to treat the boundary effect as a force field by expanding the force density at the solid boundary using a multipole expansion. This principle is based on the fact that the background velocity is perturbed by the force density on the particle surface. Consequently, velocity and force moments are evaluated at the centre of the particle, without the need to calculate velocity changes at all points within the open channel. This implies that there is no need to refine the mesh, including the case when new particles are introduced at the channel inlet.
The flowchart of the overall simulation scheme is presented in figure 1. In the first step, the fluid dynamics solver computes the Stokes equation and obtains the velocity moments of the fluid within the confined channel, in the absence of suspended particles. These velocity fields serve as ambient velocities for the subsequent introduction of a particulate suspension into the confined channel. Using the positions of the inlet particles, a mobility matrix is constructed, which is then used to calculate the velocity moments at the centre of the particles located in the ambient velocity field. Based on these particle velocities, the positions of the particles for the next time step are updated. This process is repeated iteratively, with each cycle involving the construction of a new mobility matrix from the altered particle positions and the calculation of particle velocities. In the Stokes flow regime, the mobility formulation is derived based on the linearity of the forces acting on particle velocities and is uniquely determined from the properties of the fundamental solution in this regime (Dhont Reference Dhont1996). This means that the mobility relation represents the unique response of particles in the suspended flow field, and each simulation step is essentially independent. As a result, the background velocity is computed only once at the beginning of the simulation when no particles are present, and each step calculates velocity disturbances from it. However, addressing the complexity of dealing with boundary conditions resulting from the channel geometry is achieved by introducing imaginary particles on the wall. This approach allows for the use of the same Green's function for both imaginary wall particles and interior particles within the channel. The concept of introducing imaginary wall particles to tackle transport problems in confined suspensions has been explored previously through the suspension balance model by Nott & Brady (Reference Nott and Brady1994). However, it is also recognized that the introduction of wall particles essentially constitutes the bumpy walls which entail a certain sacrifice in terms of accuracy (Singh & Nott Reference Singh and Nott2000). In this study, an extension to arbitrary confined geometries is pursued through the integration of the finite-element method (FEM) with the SD framework, with due consideration given to additional higher-order terms pertaining to the far-field interaction between interior and wall particles.
Flowchart of the proposed multiscale simulation method, including the mathematical symbols used in this study. The blue box represents the process conducted by the fluid dynamics solver, which uses the finite-element method, while the black box represents the process conducted by the Stokesian dynamics method.

In this section, we detail the simulation methodology presented in figure 1 by explaining how to obtain ambient velocity moments and establish the equation of motion for suspended particles. Since ambient velocity moments are specific to the target geometry, we describe the FEM part alongside the definition of the target geometry for conducting case studies. For the equation of motion for particles, we briefly discuss the principles of conventional Stokesian dynamics simulation in § 2.1.1, which cast inter-particle hydrodynamic interactions into matrix-vector form. Subsequently, in § 2.1.2, a constrained Stokesian formulation is derived considering wall particles subject to velocity constraints. Next, in § 2.1.3, we introduce a way of applying the suggested approach to further accelerate computation speeds, leveraging the characteristics of the constrained formulation. Finally, § 2.2 provides a geometric description of the microchannels on which case studies will be conducted for the transport of attractive colloidal suspensions.
2.1. Equation of motion for particles
2.1.1. Matrix-vector formulation of hydrodynamic interactions
In the Stokes flow regime, the equations of motion for particles are described by the Langevin equation, which represents the balance of forces affecting particle motion. The Stokesian dynamics is one approach that accounts for multibody hydrodynamic interactions through the effect of matrix inversion pioneered by Brady & Bossis (Reference Brady and Bossis1988). The changes in force density within a suspension inevitably lead to fluctuations at all points, and this, in turn, affects the changes in force density. This infinite sum of reflections is analogous to the inversion of the mobility matrix, which contains the information on force density (Durlofsky, Brady & Bossis Reference Durlofsky, Brady and Bossis1987). Therefore, in this section, we start from the Langevin equation and briefly describe the conventional methods for formulating multibody hydrodynamic interactions in particle suspensions using matrix-based approaches.
The number of N colloid particles suspended in the fluid that have viscosity  $\mu $ and density $\rho$ satisfies the following force and torque balance (Brady Reference Brady1993):
 \begin{gather}{\boldsymbol{m}}\boldsymbol{\cdot }\frac{{\textrm{d}{\boldsymbol{U}}}}{{\textrm{d}t}} = {{\boldsymbol{F}}^H} + {{\boldsymbol{F}}^P} + {{\boldsymbol{F}}^B},\end{gather}
 \begin{gather}{{\boldsymbol{I}}_m}\boldsymbol{\cdot }\frac{{\textrm{d}{\boldsymbol{\varOmega} }}}{{\textrm{d}t}} = {{\boldsymbol{T}}^H} + {{\boldsymbol{T}}^P} + {{\boldsymbol{T}}^B}.\end{gather}
 In the above equations, the left-hand sides can be ignored in the overdamped condition where the mass and relaxation time of the particles are sufficiently small. Here,  ${\boldsymbol{m}}$ and ${{\boldsymbol{I}}_m}$ denote mass and moment of inertia, respectively, while ${\boldsymbol{U}}$ and ${\boldsymbol{\varOmega} }$ denote the translational and rotational velocity of the particle, respectively. Therefore, the forces and torques that make balances are hydrodynamic contributions denoted by superscript H, deterministic non-hydrodynamic force or torque with superscript $P$ and stochastic force or torque with B. Hydrodynamic force acts upon the particle due to the relative motion of the fluid with respect to the particle, and deterministic non-hydrodynamic force acts between a pair of particles based on the inter-particle potential. However, stochastic force and torque describe the thermal motion of particles through Brownian random walk and are uncorrelated with time.
To obtain the hydrodynamic contributions acting on a particle, a correlation between the velocity moments and force moments needs to be established. In the Stokes flow regime, characterized by the negligible fluid inertia, a linear relationship exists between an infinitude of higher-order velocity derivatives and hydrodynamic traction moments. Mediating this relationship is the Green's function  ${\boldsymbol{J}}$, a fundamental solution of the Stokes equation. The point force ${\boldsymbol{f}}(\kern 1.5pt {\boldsymbol{y}})$, located on the surface element $\textrm{d}{S_{\boldsymbol{y}}}$ of the particle suspended in the fluid where ${\boldsymbol{y}}$ is a position vector, is integrated to determine the fluid velocity ${\boldsymbol{u}}({\boldsymbol{x}})$ at point ${\boldsymbol{x}}$:
 \begin{equation}{\boldsymbol{u}}({\boldsymbol{x}}) = {{\boldsymbol{u}}^\infty }({\boldsymbol{x}}) - \frac{1}{{8{\rm \pi} \mu }}\sum\limits_{\alpha = 1}^N {\int_{{S^\alpha }} {[{\boldsymbol{J}}({\boldsymbol{x}} - {\boldsymbol{y}})\boldsymbol{\cdot }{\boldsymbol{f}}({\,\boldsymbol{y}})]\,\textrm{d}{S_{\boldsymbol{y}}}} } .\end{equation}
 The multipole expansion of the Green's function about the centre  ${{\boldsymbol{x}}^\alpha }$ of each particle yields
 \begin{equation}{J_{ij}}({\boldsymbol{x}} - {\boldsymbol{y}}) = {J_{ij}}({\boldsymbol{x}} - {{\boldsymbol{x}}^\alpha }) + (x_k^\alpha - {y_k}){\nabla _k}{J_{ij}}({\boldsymbol{x}} - {{\boldsymbol{x}}^\alpha }) + \cdots .\end{equation}
The above expansion is substituted into (2.3), and after simplification through some replacements, it yields
 \begin{align}{u_i}({\boldsymbol{x}}) = u_i^\infty ({\boldsymbol{x}}) - \frac{1}{{8{\rm \pi} \mu }}\sum\limits_{\alpha = 1}^N {[{J_{ij}}({\boldsymbol{x}} - {{\boldsymbol{x}}^\alpha })F_j^H + {R_{ij}}({\boldsymbol{x}} - {{\boldsymbol{x}}^\alpha })T_j^H - {K_{ijk}}({\boldsymbol{x}} - {{\boldsymbol{x}}^\alpha })S_{jk}^H + \cdots ].}\end{align}
 The replaced terms are equal to (2.6)–(2.10), while  $\varepsilon$ is the Levi-Civita symbol in three dimensions. Here, ${{\boldsymbol{F}}^H}$ and ${{\boldsymbol{T}}^H}$ are the total force and torque on the particle exerted by the fluid. The propagator for the torque ${\boldsymbol{R}}$ is called the rotlet and ${{\boldsymbol{S}}^H}$ is the stresslet on the fluid exerted by the particle. In (2.5), each moment of the force density induces a velocity disturbance of the fluid through propagators. For these moments, ${{\boldsymbol{F}}^H}$ corresponds to the monopole or zeroth moment, the asymmetric part of the dipole or first moment becomes ${{\boldsymbol{T}}^H}$, while the symmetric part becomes ${{\boldsymbol{S}}^H}$. In this study, terms beyond the first moment are truncated in subsequent expansions, except for two higher multipole contributions arising from the finite size of particles. There are two main reasons for this truncation. The first reason is for computational efficiency. The second reason is that while the force moments and velocity moments are linearly related by the proportionality tensor with the same degree of correlation, in this study, background velocity moments are obtained up to the first moment through a fluid dynamics solver, thus coupling up to this degree of accuracy is considered. Therefore, higher force moments lose their significance as they would not introduce additional coupling effects beyond the first moment.
 \begin{gather}F_i^H = \int_{{S^\alpha }} {{f_i}(\kern 1.5pt {\boldsymbol{y}})\,\textrm{d}{S_y}} ,\end{gather}
 \begin{gather}{R_{ij}} ={-} \frac{1}{2}{\varepsilon _{ijk}}{\nabla _k}{J_{il}},\end{gather}
 \begin{gather}T_i^H = \int_{{S^\alpha }} {{\varepsilon _{ijk}}(\kern 1.5pt {y_j} - x_j^\alpha ){f_k}(\kern 1.5pt {\boldsymbol{y}})\,\textrm{d}{S_y}} ,\end{gather}
 \begin{gather}{K_{ijk}} = \frac{1}{2}({\nabla _k}{J_{ij}} + {\nabla _j}{J_{ik}}),\end{gather}
 \begin{gather}S_{ij}^H = \int_{{S^\alpha }} {\left[ {(\kern 1.5pt {y_i} - x_i^\alpha ){f_j} + (\kern 1.5pt {y_j} - x_j^\alpha ){f_i} - \frac{2}{3}{\delta_{ij}}(\kern 1.5pt {y_k} - x_k^\alpha ){f_k}} \right]\textrm{d}{S_y}} .\end{gather}
 Assuming the spherical particles with radius a, each particle generates fluid disturbances due to its finite size in the fluid. The higher terms of the force moments that are added correspond to the quadrupole contribution  $(1/6){a^2}{\nabla ^2}{J_{ij}}$ and octuplet contribution $(1/10){a^2}{\nabla ^2}{K_{ijk}}$ from straining motion (Durlofsky et al. Reference Durlofsky, Brady and Bossis1987).
 \begin{align}{u_i}({\boldsymbol{x}}) = u_i^\infty ({\boldsymbol{x}}) - \frac{1}{{8{\rm \pi} \mu }}\sum\limits_{\alpha = 1}^N {\left[ \begin{array}{@{}l@{}} \left( {1 + \dfrac{1}{6}{a^2}{\nabla^2}} \right){J_{ij}}({\boldsymbol{x}} - {{\boldsymbol{x}}^\alpha })F_j^H + {R_{ij}}({\boldsymbol{x}} - {{\boldsymbol{x}}^\alpha })T_j^H\\ \quad - \left( {1 + \dfrac{1}{{10}}{a^2}{\nabla^2}} \right){K_{ijk}}({\boldsymbol{x}} - {{\boldsymbol{x}}^\alpha })S_{jk}^H \end{array} \right]} .\end{align}
 Due to the flow disturbance in the summation of (2.11) without contribution from the particle  $\alpha$, denoted by ${\boldsymbol{u}^{\prime}}({{\boldsymbol{x}}^\alpha })$, the particle velocities at the centre of the particle ${{\boldsymbol{x}}^\alpha }$ are given by Faxen's formulae (2.12)–(2.14). In these equations, ${{\boldsymbol{U}}^\alpha }$ and ${{\boldsymbol{\varOmega} }^\alpha }$ refer to the translational and rotational velocities of the particle $\alpha$, respectively.
 \begin{gather}U_i^\alpha - u_i^\infty ({{\boldsymbol{x}}^\alpha }) ={-} \frac{{F_i^{H,\alpha }}}{{6{\rm \pi} \mu {a_\alpha }}} + \left( {1 + \frac{{a_\alpha^2}}{6}{\nabla^2}} \right){u^{\prime}_i}({{\boldsymbol{x}}^\alpha }),\end{gather}
 \begin{gather}\varOmega _i^\alpha - \varOmega _i^\infty ={-} \frac{{T_i^{H,\alpha }}}{{8{\rm \pi} \mu a_\alpha ^3}} + \frac{1}{2}{\varepsilon _{ijk}}{\nabla _j}{u^{\prime}_k}({{\boldsymbol{x}}^\alpha }),\end{gather}
 \begin{gather}- E_{ij}^\infty = \frac{1}{2}\left[ { - \frac{{S_{ij}^{H,\alpha }}}{{(10/3){\rm \pi} \mu a_\alpha^3}} + \left( {1 + \frac{{a_\alpha^2}}{{10}}{\nabla^2}} \right)({\nabla_j}{u^{\prime}_i}({{\boldsymbol{x}}^\alpha }) + {\nabla_i}{u^{\prime}_j}({{\boldsymbol{x}}^\alpha }))} \right].\end{gather}
 Using Faxen's equations, the velocity moments that include particle translational ( ${\boldsymbol{U}} - {{\boldsymbol{u}}^\infty }$) and angular velocity against the background flow ( ${\boldsymbol{\varOmega} } - {{\boldsymbol{\varOmega} }^\infty }$), as well as the rate of strain of the background flow $- {{\boldsymbol{E}}^\infty }$, are represented by the linear combination of force moments ${{\boldsymbol{F}}^H}$, ${{\boldsymbol{T}}^H}$ and ${{\boldsymbol{S}}^H}$. By representing the corresponding proportionalities in a matrix-tensor formulation, the far-field mobility matrix ${{\mathcal{M}}^\infty }$ is constructed. However, to account for lubrication interactions, all terms of the multipole expansion are necessary. Therefore, for particles within the lubrication cutoff radius, the exact resistivity is reflected in a pairwise additive manner. In this process, the far-field corrective term is excluded to prevent double-counting of far-field interactions, resulting in the contribution of the near-field resistance matrix ${{\mathcal{R}}_{nf}}$ (Jeffrey & Onishi Reference Jeffrey and Onishi1984; Jeffrey Reference Jeffrey1992). The near-field and far-field resistivity are combined to give the grand resistance matrix ${\mathcal{R}} = {({\mathcal{M}^\infty })^{ - 1}} + {{\mathcal{R}}_{nf}}$.
 \begin{equation}\left( {\begin{array}{@{}c@{}} {{{\boldsymbol{F}}^H}}\\ {{{\boldsymbol{T}}^H}}\\ {{{\boldsymbol{S}}^H}} \end{array}} \right) ={-} {\mathcal{R}}\boldsymbol{\cdot }\left( {\begin{array}{@{}c@{}} {{\boldsymbol{U}} - {{\boldsymbol{u}}^\infty }}\\ {{\boldsymbol{\varOmega} } - {{\boldsymbol{\varOmega} }^\infty }}\\ { - {{\boldsymbol{E}}^\infty }} \end{array}} \right).\end{equation}
 The inverse problem is to obtain velocity moments from force moments, and the proportionality tensor  ${\mathcal{M}}$ in this relation is called the grand mobility matrix, which has a relation ${\mathcal{M}}= {{\mathcal{R}}^{ - 1}}$ with the grand resistance matrix. Each component of the grand resistance matrix is important for subsequent developments and is given as shown in (2.16). Another characteristic of the proportionality tensor is their symmetry and positive definiteness, which arise from the dissipative nature of the system (Kim & Karrila Reference Kim and Karrila2005).
 \begin{equation}{\mathcal{R}} = \left( {\begin{array}{@{}ccc@{}} {{{\boldsymbol{R}}_{FU}}}&{{{\boldsymbol{R}}_{F\varOmega }}}&{{{\boldsymbol{R}}_{FE}}}\\ {{{\boldsymbol{R}}_{TU}}}&{{{\boldsymbol{R}}_{T\varOmega }}}&{{{\boldsymbol{R}}_{TE}}}\\ {{{\boldsymbol{R}}_{SU}}}&{{{\boldsymbol{R}}_{S\varOmega }}}&{{{\boldsymbol{R}}_{SE}}} \end{array}} \right).\end{equation}
 Returning to (2.1) and (2.2), the non-hydrodynamic inter-particle force  ${{\boldsymbol{F}}^P}$ is pairwise additive and is obtained by taking a derivative of the analytic form of the potential based on the inter-particle distance. Though various analytical potentials can be employed to study fouling dynamics, in our case study in § 3.2, we use a Morse potential due to its finite-sized derivative, including the potential well. In the definition in (2.17), ${r_{d,}}_{ij}$ is the inter-particle distance between particles i and j, equal to $|{{{\boldsymbol{x}}_i} - {{\boldsymbol{x}}_j}} |$, while ${a_i}$ and ${a_j}$ are the radius of particles i and j, respectively. However, the attraction range parameter $\kappa$ controls the magnitude of attraction and is suggested in accordance with the specific case study. The potential well depth ${V_0}$ is represented as $6{\rm \pi} \mu u_{avg}^\infty {a^2}/{V_0}$, signifying the dimensionless ratio of the characteristic hydrodynamic force $6{\rm \pi} \mu u_{avg}^\infty a$ to the attractive force ${V_0}/a$ in the specific simulation system. In this ratio, $u_{avg}^\infty$ is the surface average of the background fluid velocity at the inlet surface.
 \begin{gather}{\varphi _{Morse}}({r_{d,}}_{ij}) ={-} {V_0}\left[2\,{\textrm{e}^{ - \kappa \{ {r_{d,}}_{ij} - ({a_i} + {a_j})\} }} - {\textrm{e}^{ - 2\kappa \{ {r_{d,}}_{ij} - ({a_i} + {a_j})\} }}\right],\end{gather}
 \begin{gather}F_{ij}^P ={-} \frac{{\partial {\varphi _{Morse}}({r_{d,}}_{ij})}}{{\partial {r_{d,}}_{ij}}}.\end{gather}
Despite the singular lubrication forces, a small amount of particle overlap may occur due to the finite time step of the simulation (Ekiel-Jezewska, Tomasz & Szymczak Reference Ekiel-Jezewska, Tomasz and Szymczak2008). The same Morse potential is also used to prevent unphysical overlap at  ${r_{d,ij}} < {a_i} + {a_j}$.
Finally, the Brownian random force and torque terms  ${{\boldsymbol{F}}^B}$ and ${{\boldsymbol{T}}^B}$ originate from the thermal fluctuation of the fluid and are given by the following equations, with angle brackets representing an ensemble average over the entire suspension:
 \begin{gather}\langle {{\boldsymbol{F}}^B}(t)\rangle = \langle {{\boldsymbol{T}}^B}(t)\rangle = 0,\end{gather}
 \begin{gather}\langle {{\boldsymbol{F}}^B}(t){{\boldsymbol{F}}^B}(t^{\prime})\rangle = 2{k_B}T{{\boldsymbol{R}}_{FU}}\delta (t - t^{\prime}),\end{gather}
 \begin{gather}\langle {{\boldsymbol{T}}^B}(t){{\boldsymbol{T}}^B}(t^{\prime})\rangle = 2{k_B}T{{\boldsymbol{R}}_{T\varOmega }}\delta (t - t^{\prime}).\end{gather}
In this section, each term that constitutes the force balance in the Langevin equation has been introduced. However, there are additional considerations when describing particle dynamics inside a confined channel. For example, as wall particles are immobile, a constraint must be imposed to fix the hydrodynamic velocity moments to zero. Similarly, since there are no thermal fluctuations for the wall particles, (2.19)–(2.21) should also be appropriately modified to account for the Brownian motion of interior particles only while preserving multi-body hydrodynamic interactions. The derivation of the modified formulation, including these constraints, is carried out in the next section.
2.1.2. Stokesian dynamics with velocity constraint
In the framework of Stokesian-based methods, various attempts have been made to incorporate a channel's confined geometries in describing particle-laden flow. One of them is constructing a new Green's function in the presence of wall geometry using Blake's solution to obtain images of Stokeslets based on the distance H from the wall (Blake Reference Blake1971; Bossis, Meunier & Sherwood Reference Bossis, Meunier and Sherwood1991; Swan & Brady Reference Swan and Brady2007). This additional Green's function induced from wall geometry  ${{\boldsymbol{J}}_{wall}}({\boldsymbol{x}},{\boldsymbol{y}};H)$ is superposed onto the fundamental function for particles in (2.22) to form the total Green's function ${\boldsymbol{J}}({\boldsymbol{x}},{\boldsymbol{y}};H) = {{\boldsymbol{J}}_{non\text{-}peri}}({\boldsymbol{x}},{\boldsymbol{y}}) + {{\boldsymbol{J}}_{wall}}({\boldsymbol{x}},{\boldsymbol{y}};H)$.
 \begin{equation}{{\boldsymbol{J}}_{non\text{-}peri}}({\boldsymbol{x}},{\boldsymbol{y}})\frac{1}{{8{\rm \pi} \mu }}\left( {\frac{{\boldsymbol{I}}}{r} + \frac{{{\boldsymbol{rr}}}}{{{r^3}}}} \right).\end{equation}
 The above function is also called the Oseen tensor (Oseen Reference Oseen1927), while  ${\boldsymbol{I}}$ denotes the identity tensor, ${\boldsymbol{r}} = {\boldsymbol{x}} - {\boldsymbol{y}}$ and ${r^2} = {\boldsymbol{r}}\boldsymbol{\cdot }{\boldsymbol{r}}$. For the fluid velocity at ${\boldsymbol{x}}$ induced by the periodic images at ${\boldsymbol{y}}$, the Green's function derived by Hasimoto (Reference Hasimoto1959) is used while ${\boldsymbol{k}}$ represents lattice vector on a reciprocal space:
 \begin{equation}{{\boldsymbol{J}}_{peri}}({\boldsymbol{x}},{\boldsymbol{y}}) = \frac{1}{{\mu V}}\sum\limits_{{\boldsymbol{k}} {\ne} 0} {{\textrm{e}^{\textrm{i}{\boldsymbol{k}}\,\boldsymbol{\cdot}\,({\boldsymbol{x}} - {\boldsymbol{y}})}}\frac{1}{{{k^2}}}({\boldsymbol{I}} - {\hat{\boldsymbol{k}}\hat{\boldsymbol{k}}})} .\end{equation}
When this total Green's function is integrated through a surface boundary integral that takes wall geometry into account, it allows for the evaluation of fluid disturbances at arbitrary points (Ladyzhenskaya Reference Ladyzhenskaya1963). For the extension in the case of multiple wall geometries, the same method of continuously superposing Green's functions has been used for studying the dynamics and rheology of particles placed between the parallel and perpendicular walls (Swan & Brady Reference Swan and Brady2003, Reference Swan and Brady2011; Staben, Zinchenko & Davis Reference Staben, Zinchenko and Davis2003). While it has the advantage of accurately reflecting the boundary effects where point forces are located, it also has certain limitations. The rapid increase in complexity with each superposed boundary makes it challenging to derive an explicit form of the Green function; an explicit form of the Green function does not already exist in the case of the flow between parallel slits according to Swan & Brady (Reference Swan and Brady2011). Expandability to accommodate changed boundary conditions is also limited, as the strategies to integrate force densities on each surface boundary have to be changed.
In this study, to circumvent these difficulties, the confined channel wall is simulated using a particle-wall scheme, as shown in figure 2. The primary advantage of this scheme is that it allows for the utilization of the same form of Green's function for both interior particles and wall particles, eliminating the need for calculating complex Green's functions. The placement of imaginary particles on the wall has been previously employed in a suspension balance model (Singh & Nott Reference Singh and Nott2000; Nott, Guazzelli & Pouliquen Reference Nott, Guazzelli and Pouliquen2011). In our study, we have developed an extension to arbitrary channel geometries by coupling a fluid dynamic solver to obtain background velocity moments while satisfying the microscopic force balances on the suspended particles and deriving macroscopic properties from the overall force balance on the channel. This approach develops into an efficient method for solving the interior dynamics of particles, leveraging the constraint properties on wall particles. Furthermore, by analysing the hydrodynamic force moments applied to the wall particles, it becomes possible to calculate the stress applied to a specific location on the channel wall, a capability challenging to achieve when using Oseen's superposition approach.
Schematic pictures of boundary treatment methods using wall particles. In panel (a), the excluded volume scheme is displayed, where the wall particles are entirely excluded from the fluid domain where fluid and particle velocity are evaluated. In panel (b), the included volume scheme is displayed, where the wall particles are arranged in a way that removes the excluded volume.

However, the accompanying limitations of the particle-wall scheme are examined. Since it models the boundary using wall particles, and point forces are located on the surfaces of spherical particles, it practically simulates a rough or bumpy wall. Moreover, as it considers particles as a patch on the wall approximating the wall resistivity, the computational cost increases rapidly as the system size becomes larger, in proportion to the cube of the total number of particles used. To mitigate this cubic dependence on the total number of particles, the effects from the wall particles are separated and treated as predetermined hydrodynamic force moments acting on the interior particles, originating from the properties of the prescribed velocity of wall particles. This treatment allows an efficient description of particle dynamics inside the channel, especially at the beginning of the simulation. However, as the volume fraction inside the channel increases in the late stage of the simulation, hydrodynamics within the channel becomes dominated by particle–particle interactions, and the influence of the wall on particle motion becomes less significant (Swan & Brady Reference Swan and Brady2011). The deviatoric effects of the particle-wall scheme on the transport properties and scaling performance of the constrained SD by the system size are discussed in § 3.1.
There are two ways of arranging particles to replace the wall boundary, which are the excluded volume scheme in figure 2(a), where the particles completely retreat from the target boundary, and the included volume scheme in figure 2(b), where the particles intrude over the target boundary. The excluded volume scheme has the advantage that macroscopic properties converge to those of pure fluid when there are no interior particles. However, the included scheme focuses on filling the place of the wall to the greatest extent. If the background flow is uniform, or in simulations where both force-rotational velocity and force-strain rate coupling do not exist (Nott & Brady Reference Nott and Brady1994), there is no practical difference between the two methods as they do not differ in the hydrodynamic forces experienced by interior and wall particles. However, in this study, the background velocity within the channel is calculated through the fluid dynamics solver, allowing for the application of any form of background flow field within the Stokes flow region. Due to its generality, force moments up to the dipole term, which corresponds to the same degree of accuracy as velocity moments, are considered. This increases the accuracy of the mobility relation governing HI. Thus, as depicted in figure 2(b), if particle centres are located on the target boundary, additional stresses are exerted on the channel wall even when there are no suspended particles due to the velocity gradient at the centre of wall particles. Therefore, in this study, we will proceed with the development according to the excluded volume scheme in figure 2(a) to avoid this situation.
If we expand the hydrodynamic forces on interior particles I and wall particles W through the resistance formulation in (2.15), each force can respectively be expressed as follows:
 \begin{align}{{\boldsymbol{F}}^I} &={-}
{\boldsymbol{R}}_{FU}^{II}\boldsymbol{\cdot
}({{\boldsymbol{u}}^I} - {{\boldsymbol{U}}^\infty }) +
{\boldsymbol{R}}_{FU}^{IW}\boldsymbol{\cdot
}{{\boldsymbol{U}}^\infty } - {\boldsymbol{R}}_{F\varOmega
}^{II}\boldsymbol{\cdot }({{\boldsymbol{\omega} }^I} -
{{\boldsymbol{\varOmega} }^\infty })\nonumber\\ &\quad +
{\boldsymbol{R}}_{F\varOmega }^{IW}\boldsymbol{\cdot
}{{\boldsymbol{\varOmega} }^\infty } +
{\boldsymbol{R}}_{FE}^{II}\boldsymbol{\cdot
}{{\boldsymbol{E}}^\infty } +
{\boldsymbol{R}}_{FE}^{IW}\boldsymbol{\cdot
}{{\boldsymbol{E}}^\infty
},\end{align}
\begin{align}{{\boldsymbol{F}}^I} &={-}
{\boldsymbol{R}}_{FU}^{II}\boldsymbol{\cdot
}({{\boldsymbol{u}}^I} - {{\boldsymbol{U}}^\infty }) +
{\boldsymbol{R}}_{FU}^{IW}\boldsymbol{\cdot
}{{\boldsymbol{U}}^\infty } - {\boldsymbol{R}}_{F\varOmega
}^{II}\boldsymbol{\cdot }({{\boldsymbol{\omega} }^I} -
{{\boldsymbol{\varOmega} }^\infty })\nonumber\\ &\quad +
{\boldsymbol{R}}_{F\varOmega }^{IW}\boldsymbol{\cdot
}{{\boldsymbol{\varOmega} }^\infty } +
{\boldsymbol{R}}_{FE}^{II}\boldsymbol{\cdot
}{{\boldsymbol{E}}^\infty } +
{\boldsymbol{R}}_{FE}^{IW}\boldsymbol{\cdot
}{{\boldsymbol{E}}^\infty
},\end{align} \begin{align}{{\boldsymbol{F}}^W} &=
{\boldsymbol{R}}_{FU}^{WW}\boldsymbol{\cdot
}{{\boldsymbol{U}}^\infty } -
{\boldsymbol{R}}_{FU}^{WI}\boldsymbol{\cdot
}({{\boldsymbol{u}}^I} - {{\boldsymbol{U}}^\infty })\nonumber\\ &\quad +
{\boldsymbol{R}}_{FU}^{WW}\boldsymbol{\cdot
}{{\boldsymbol{\varOmega} }^\infty } -
{\boldsymbol{R}}_{F\varOmega }^{WI}\boldsymbol{\cdot
}({{\boldsymbol{\omega} }^I} - {{\boldsymbol{\varOmega}
}^\infty }) + {\boldsymbol{R}}_{FE}^{WW}\boldsymbol{\cdot
}{{\boldsymbol{E}}^\infty } +
{\boldsymbol{R}}_{FE}^{WI}\boldsymbol{\cdot
}{{\boldsymbol{E}}^\infty
}.\end{align}
\begin{align}{{\boldsymbol{F}}^W} &=
{\boldsymbol{R}}_{FU}^{WW}\boldsymbol{\cdot
}{{\boldsymbol{U}}^\infty } -
{\boldsymbol{R}}_{FU}^{WI}\boldsymbol{\cdot
}({{\boldsymbol{u}}^I} - {{\boldsymbol{U}}^\infty })\nonumber\\ &\quad +
{\boldsymbol{R}}_{FU}^{WW}\boldsymbol{\cdot
}{{\boldsymbol{\varOmega} }^\infty } -
{\boldsymbol{R}}_{F\varOmega }^{WI}\boldsymbol{\cdot
}({{\boldsymbol{\omega} }^I} - {{\boldsymbol{\varOmega}
}^\infty }) + {\boldsymbol{R}}_{FE}^{WW}\boldsymbol{\cdot
}{{\boldsymbol{E}}^\infty } +
{\boldsymbol{R}}_{FE}^{WI}\boldsymbol{\cdot
}{{\boldsymbol{E}}^\infty
}.\end{align} Here,  ${{\boldsymbol{F}}^I}$ and ${{\boldsymbol{F}}^W}$ denote the hydrodynamic forces on the interior and wall particles exerted by the fluid, respectively. In subsequent developments, the additional superscript H will be omitted for the sake of simplicity since the grand resistance formulation itself is based on the common understanding that it represents relationships involving hydrodynamic force moments. Regarding the meaning of the proportionalities, ${\boldsymbol{R}}_{FU}^{II}$ corresponds to the resistance matrix, indicating the coupling between the force and translational velocity among the interior particles, while ${\boldsymbol{R}}_{FE}^{IW}$ represents the coupling between the force and strain rate among the interior and wall particles. The remaining components of the resistance matrix follow the same fashion of coupling notation. Here, ${{\boldsymbol{u}}^I}$ and ${{\boldsymbol{u}}^W}$ denote the translational velocities of interior and wall particles, respectively, while ${{\boldsymbol{\omega} }^I}$ and ${{\boldsymbol{\omega} }^W}$ represent the rotational velocities of interior and wall particles. Wall particles are assumed to be immobile, and velocity constraints are applied as ${{\boldsymbol{u}}^W} = {{\boldsymbol{\omega} }^W} = {\textbf{0}}$. Subsequently, as the resistance tensor is independent of the particles’ momentum and is pre-determined based on the configuration of the particles and the topology of the wall, the deterministic part of the hydrodynamic forcing term under the background velocity is substituted, as shown in (2.26) and (2.27), and the velocity moments of interior particles are reformulated, as in (2.28):
 \begin{gather}{\boldsymbol{A}} = ({\boldsymbol{R}}_{FU}^{II} + {\boldsymbol{R}}_{FU}^{IW})\boldsymbol{\cdot }{{\boldsymbol{U}}^\infty } + ({\boldsymbol{R}}_{F\varOmega }^{II} + {\boldsymbol{R}}_{F\varOmega }^{IW})\boldsymbol{\cdot }{{\boldsymbol{\varOmega} }^\infty } + ({\boldsymbol{R}}_{FE}^{II} + {\boldsymbol{R}}_{FE}^{IW})\boldsymbol{\cdot }{{\boldsymbol{E}}^\infty },\end{gather}
 \begin{gather}{\boldsymbol{B}} = ({\boldsymbol{R}}_{TU}^{II} + {\boldsymbol{R}}_{TU}^{IW})\boldsymbol{\cdot }{{\boldsymbol{U}}^\infty } + ({\boldsymbol{R}}_{T\varOmega }^{II} + {\boldsymbol{R}}_{T\varOmega }^{IW})\boldsymbol{\cdot }{{\boldsymbol{\varOmega} }^\infty } + ({\boldsymbol{R}}_{TE}^{II} + {\boldsymbol{R}}_{TE}^{IW})\boldsymbol{\cdot }{{\boldsymbol{E}}^\infty }{,_{}}\end{gather}
 \begin{gather}\left[
{\begin{array}{*{20}{@{}c@{}}} {{{\boldsymbol{F}}^P} +
{{\boldsymbol{F}}^B} + {\boldsymbol{A}}}\\
{{{\boldsymbol{T}}^B} + {\boldsymbol{B}}} \end{array}}
\right] = \left[ {\begin{array}{@{}cc@{}}
{{\boldsymbol{R}}_{FU}^{II}}& {{\boldsymbol{R}}_{F\varOmega
}^{II}}\\
{{\boldsymbol{R}}_{TU}^{II}}& {{\boldsymbol{R}}_{T\varOmega
}^{II}} \end{array}} \right]\boldsymbol{\cdot }\left[
{\begin{array}{@{}c@{}} {{{\boldsymbol{u}}^I}}\\
{{{\boldsymbol{\omega} }^I}} \end{array}}
\right],\end{gather}
\begin{gather}\left[
{\begin{array}{*{20}{@{}c@{}}} {{{\boldsymbol{F}}^P} +
{{\boldsymbol{F}}^B} + {\boldsymbol{A}}}\\
{{{\boldsymbol{T}}^B} + {\boldsymbol{B}}} \end{array}}
\right] = \left[ {\begin{array}{@{}cc@{}}
{{\boldsymbol{R}}_{FU}^{II}}& {{\boldsymbol{R}}_{F\varOmega
}^{II}}\\
{{\boldsymbol{R}}_{TU}^{II}}& {{\boldsymbol{R}}_{T\varOmega
}^{II}} \end{array}} \right]\boldsymbol{\cdot }\left[
{\begin{array}{@{}c@{}} {{{\boldsymbol{u}}^I}}\\
{{{\boldsymbol{\omega} }^I}} \end{array}}
\right],\end{gather} \begin{gather}\left[
{\begin{array}{*{20}{@{}c@{}}} {{{\boldsymbol{u}}^I}}\\
{{{\boldsymbol{\omega} }^I}} \end{array}} \right] = \left[
{\begin{array}{@{}cc@{}} {{{({\boldsymbol{R}}_{FU}^{II})}^{
- 1}}}&{{{({\boldsymbol{R}}_{F\varOmega }^{II})}^{ - 1}}}\\
{{{({\boldsymbol{R}}_{TU}^{II})}^{ -
1}}}&{{{({\boldsymbol{R}}_{T\varOmega }^{II})}^{ - 1}}}
\end{array}} \right]\boldsymbol{\cdot }\left[
{\begin{array}{*{20}{@{}c@{}}} {{{\boldsymbol{F}}^P} +
{{\boldsymbol{F}}^B} + {\boldsymbol{A}}}\\
{{{\boldsymbol{T}}^B} + {\boldsymbol{B}}} \end{array}}
\right].\end{gather}
\begin{gather}\left[
{\begin{array}{*{20}{@{}c@{}}} {{{\boldsymbol{u}}^I}}\\
{{{\boldsymbol{\omega} }^I}} \end{array}} \right] = \left[
{\begin{array}{@{}cc@{}} {{{({\boldsymbol{R}}_{FU}^{II})}^{
- 1}}}&{{{({\boldsymbol{R}}_{F\varOmega }^{II})}^{ - 1}}}\\
{{{({\boldsymbol{R}}_{TU}^{II})}^{ -
1}}}&{{{({\boldsymbol{R}}_{T\varOmega }^{II})}^{ - 1}}}
\end{array}} \right]\boldsymbol{\cdot }\left[
{\begin{array}{*{20}{@{}c@{}}} {{{\boldsymbol{F}}^P} +
{{\boldsymbol{F}}^B} + {\boldsymbol{A}}}\\
{{{\boldsymbol{T}}^B} + {\boldsymbol{B}}} \end{array}}
\right].\end{gather} In writing (2.28), the governing equation in (2.1) substitutes the hydrodynamic force on the interior particles. Here, with regards to  ${({\boldsymbol{R}}_{FU}^{II})^{ - 1}}$, it should be noted that it is not a result of direct inversion of the force-velocity coupling part of the resistance tensor, but rather the submatrix obtained after inverting the entire resistance matrix between interior particles in (2.28). The contribution from the inter-particle non-hydrodynamic interactions ${{\boldsymbol{F}}^P}$ is calculated in the pairwise additive fashion as in conventional SD, while the Brownian force and torque terms, represented as ${{\boldsymbol{F}}^B}$ and ${{\boldsymbol{T}}^B}$, can be simplified as follows:
 \begin{gather}\langle {{\boldsymbol{F}}^B}(t)\rangle = \langle {{\boldsymbol{T}}^B}(t)\rangle = 0,\end{gather}
 \begin{gather}\langle {{\boldsymbol{F}}^B}(t){{\boldsymbol{F}}^B}(t^{\prime})\rangle = 2{k_B}T{\boldsymbol{R}}_{FU}^{II}\delta (t - t^{\prime}),\end{gather}
 \begin{gather}\langle {{\boldsymbol{T}}^B}(t){{\boldsymbol{T}}^B}(t^{\prime})\rangle = 2{k_B}T{\boldsymbol{R}}_{T\varOmega }^{II}\delta (t - t^{\prime}).\end{gather}
While the Brownian random force has been explicitly added in (2.29), it alone does not fully account for the effects of thermal motion. In concentrated colloid systems, diffusivity varies depending on the configuration, and particle diffusion can be enhanced by random walks in structures with high diffusivity (Ermak & McCammon Reference Ermak and Mccammon1978). Therefore, a mean drift term with equal strength is added to counteract the erroneous particle depletion resulting from configurations that have high diffusivity (Brady & Bossis Reference Brady and Bossis1988).
 \begin{align}\left[
{\begin{array}{*{20}{@{}c@{}}} {{{\boldsymbol{x}}^I}({t_{n +
1}})}\\ {{{\boldsymbol{\theta} }^I}({t_{n + 1}})}
\end{array}} \right] &= \left[ {\begin{array}{*{20}{@{}c@{}}}
{{{\boldsymbol{x}}^I}({t_n})}\\ {{{\boldsymbol{\theta}
}^I}({t_n})} \end{array}} \right] + ({t_{n + 1}} -
{t_n})\nonumber\\ &\quad \times \left( \begin{array}{l} \left[
{\begin{array}{@{}cc@{}} {{{({\boldsymbol{R}}_{FU}^{II})}^{
- 1}}}&{{{({\boldsymbol{R}}_{F\varOmega }^{II})}^{ - 1}}}\\
{({\boldsymbol{R}}_{TU}^{II})^{ -
1}}&{{{({\boldsymbol{R}}_{T\varOmega }^{II})}^{ - 1}}}
\end{array}} \right]\boldsymbol{\cdot }\left[
{\begin{array}{*{20}{@{}c@{}}} {{{\boldsymbol{F}}^P} +
{{\boldsymbol{F}}^B} + {\boldsymbol{A}}}\\
{{{\boldsymbol{T}}^B} + {\boldsymbol{B}}} \end{array}}
\right]\\ + \left[ {\begin{array}{*{20}{@{}c@{}}}
{\boldsymbol{\nabla }\boldsymbol{\cdot
}{{({\boldsymbol{R}}_{FU}^{II})}^{ - 1/2}}}\\
{\boldsymbol{\nabla }\boldsymbol{\cdot
}{{({\boldsymbol{R}}_{T\varOmega }^{II})}^{ - 1/2}}}
\end{array}} \right] \end{array}
\right).\end{align}
\begin{align}\left[
{\begin{array}{*{20}{@{}c@{}}} {{{\boldsymbol{x}}^I}({t_{n +
1}})}\\ {{{\boldsymbol{\theta} }^I}({t_{n + 1}})}
\end{array}} \right] &= \left[ {\begin{array}{*{20}{@{}c@{}}}
{{{\boldsymbol{x}}^I}({t_n})}\\ {{{\boldsymbol{\theta}
}^I}({t_n})} \end{array}} \right] + ({t_{n + 1}} -
{t_n})\nonumber\\ &\quad \times \left( \begin{array}{l} \left[
{\begin{array}{@{}cc@{}} {{{({\boldsymbol{R}}_{FU}^{II})}^{
- 1}}}&{{{({\boldsymbol{R}}_{F\varOmega }^{II})}^{ - 1}}}\\
{({\boldsymbol{R}}_{TU}^{II})^{ -
1}}&{{{({\boldsymbol{R}}_{T\varOmega }^{II})}^{ - 1}}}
\end{array}} \right]\boldsymbol{\cdot }\left[
{\begin{array}{*{20}{@{}c@{}}} {{{\boldsymbol{F}}^P} +
{{\boldsymbol{F}}^B} + {\boldsymbol{A}}}\\
{{{\boldsymbol{T}}^B} + {\boldsymbol{B}}} \end{array}}
\right]\\ + \left[ {\begin{array}{*{20}{@{}c@{}}}
{\boldsymbol{\nabla }\boldsymbol{\cdot
}{{({\boldsymbol{R}}_{FU}^{II})}^{ - 1/2}}}\\
{\boldsymbol{\nabla }\boldsymbol{\cdot
}{{({\boldsymbol{R}}_{T\varOmega }^{II})}^{ - 1/2}}}
\end{array}} \right] \end{array}
\right).\end{align}Various algorithms have been proposed to account for the mean drift term simultaneously during time-stepping (Grassia, Hinch & Nitsche Reference Grassia, Hinch and Nitsche1995; Delong et al. Reference Delong, Usabiaga, Buscalioni, Griffith and Donev2014). Among these methods, the mid-point algorithm of Fixman (Reference Fixman1986) has been widely adopted and can be readily implemented within the current formalism. Employing this method, the evolution equations for the particle trajectories become
 \begin{align}{\left. {\left[
{\begin{array}{*{20}{@{}c@{}}} {{{\boldsymbol{x}}^I}}\\
{{{\boldsymbol{\theta} }^I}} \end{array}} \right]}
\right|_{{t_{n + 1/2}}}} &= {\left. {\left[
{\begin{array}{*{20}{@{}c@{}}} {{{\boldsymbol{x}}^I}}\\
{{{\boldsymbol{\theta} }^I}} \end{array}} \right]}
\right|_{{t_n}}} + \frac{{({t_{n + 1}} - {t_n})}}{2}{\left.
{\left[ {\begin{array}{@{}cc@{}}
{{{({\boldsymbol{R}}_{FU}^{II})}^{ -
1}}}&\ {{{({\boldsymbol{R}}_{F\varOmega }^{II})}^{ - 1}}}\\
{{{({\boldsymbol{R}}_{TU}^{II})}^{ -
1}}}&\ {{{({\boldsymbol{R}}_{T\varOmega }^{II})}^{ - 1}}}
\end{array}} \right]} \right|_{{t_n}}}\nonumber\\ &\quad \boldsymbol{\cdot
}\left[ {\begin{array}{*{20}{@{}c@{}}} {{{ {({{\boldsymbol{F}}^P}
+ {\boldsymbol{A}})} |}_{{t_n}}} + {{
{{{\boldsymbol{F}}^B}} |}_{{t_n}}}}\\ {{{ {\boldsymbol{B}}
|}_{{t_n}}} + {{ {{{\boldsymbol{T}}^B}} |}_{{t_n}}}}
\end{array}}
\right],\end{align}
\begin{align}{\left. {\left[
{\begin{array}{*{20}{@{}c@{}}} {{{\boldsymbol{x}}^I}}\\
{{{\boldsymbol{\theta} }^I}} \end{array}} \right]}
\right|_{{t_{n + 1/2}}}} &= {\left. {\left[
{\begin{array}{*{20}{@{}c@{}}} {{{\boldsymbol{x}}^I}}\\
{{{\boldsymbol{\theta} }^I}} \end{array}} \right]}
\right|_{{t_n}}} + \frac{{({t_{n + 1}} - {t_n})}}{2}{\left.
{\left[ {\begin{array}{@{}cc@{}}
{{{({\boldsymbol{R}}_{FU}^{II})}^{ -
1}}}&\ {{{({\boldsymbol{R}}_{F\varOmega }^{II})}^{ - 1}}}\\
{{{({\boldsymbol{R}}_{TU}^{II})}^{ -
1}}}&\ {{{({\boldsymbol{R}}_{T\varOmega }^{II})}^{ - 1}}}
\end{array}} \right]} \right|_{{t_n}}}\nonumber\\ &\quad \boldsymbol{\cdot
}\left[ {\begin{array}{*{20}{@{}c@{}}} {{{ {({{\boldsymbol{F}}^P}
+ {\boldsymbol{A}})} |}_{{t_n}}} + {{
{{{\boldsymbol{F}}^B}} |}_{{t_n}}}}\\ {{{ {\boldsymbol{B}}
|}_{{t_n}}} + {{ {{{\boldsymbol{T}}^B}} |}_{{t_n}}}}
\end{array}}
\right],\end{align} \begin{align}{\left. {\left[
{\begin{array}{*{20}{@{}c@{}}} {{{\boldsymbol{x}}^I}}\\
{{{\boldsymbol{\theta} }^I}} \end{array}} \right]}
\right|_{{t_{n + 1}}}} &= {\left. {\left[
{\begin{array}{*{20}{@{}c@{}}} {{{\boldsymbol{x}}^I}}\\
{{{\boldsymbol{\theta} }^I}} \end{array}} \right]}
\right|_{{t_n}}} + ({t_{n + 1}} - {t_n}){\left. {\left[
{\begin{array}{@{}cc@{}} {{{({\boldsymbol{R}}_{FU}^{II})}^{
- 1}}}&\ {{{({\boldsymbol{R}}_{F\varOmega }^{II})}^{ - 1}}}\\
{{{({\boldsymbol{R}}_{TU}^{II})}^{ -
1}}}&\ {{{({\boldsymbol{R}}_{T\varOmega }^{II})}^{ - 1}}}
\end{array}} \right]} \right|_{{t_{n + 1/2}}}}\nonumber\\ &\quad \cdot \left[
{\begin{array}{*{20}{@{}c@{}}} {{{ {({{\boldsymbol{F}}^P} +
{\boldsymbol{A}})} |}_{{t_{n + 1/2}}}} + {{
{{{\boldsymbol{F}}^B}} |}_{{t_n}}}}\\ {{{ {\boldsymbol{B}}
|}_{{t_{n + 1/2}}}} + {{ {{{\boldsymbol{T}}^B}}
|}_{{t_n}}}} \end{array}}
\right].\end{align}
\begin{align}{\left. {\left[
{\begin{array}{*{20}{@{}c@{}}} {{{\boldsymbol{x}}^I}}\\
{{{\boldsymbol{\theta} }^I}} \end{array}} \right]}
\right|_{{t_{n + 1}}}} &= {\left. {\left[
{\begin{array}{*{20}{@{}c@{}}} {{{\boldsymbol{x}}^I}}\\
{{{\boldsymbol{\theta} }^I}} \end{array}} \right]}
\right|_{{t_n}}} + ({t_{n + 1}} - {t_n}){\left. {\left[
{\begin{array}{@{}cc@{}} {{{({\boldsymbol{R}}_{FU}^{II})}^{
- 1}}}&\ {{{({\boldsymbol{R}}_{F\varOmega }^{II})}^{ - 1}}}\\
{{{({\boldsymbol{R}}_{TU}^{II})}^{ -
1}}}&\ {{{({\boldsymbol{R}}_{T\varOmega }^{II})}^{ - 1}}}
\end{array}} \right]} \right|_{{t_{n + 1/2}}}}\nonumber\\ &\quad \cdot \left[
{\begin{array}{*{20}{@{}c@{}}} {{{ {({{\boldsymbol{F}}^P} +
{\boldsymbol{A}})} |}_{{t_{n + 1/2}}}} + {{
{{{\boldsymbol{F}}^B}} |}_{{t_n}}}}\\ {{{ {\boldsymbol{B}}
|}_{{t_{n + 1/2}}}} + {{ {{{\boldsymbol{T}}^B}}
|}_{{t_n}}}} \end{array}}
\right].\end{align} First, by using (2.34), particle displacement at  ${t_{n + 1/2}}$ is computed, and subsequently, employing the updated resistance matrix, particle displacement at ${t_{n + 1}}$ is determined according to (2.35). This step corresponds to the final phase of the algorithm, as illustrated in figure 1, which entails determining the new particle positions through time marching.
When drawing an analogy between the present approach and conventional SD, the grand resistance matrix presented in (2.15) is replaced with the resistance matrix between interior particles in (2.28). Furthermore, the Brownian motions described by (2.19)–(2.21) are replaced by those designed for interior particles in (2.30)–(2.32). Consequently, in constrained SD, the procedure for calculating the square root or inverse of the grand resistance matrix in conventional SD is replaced with the process of determining the square root or inverse of the resistance matrix, which accounts for the interactions among the interior particles. In essence, as the system size increases, primarily due to the greater number of wall particles, the computational overhead associated with direct matrix inversion is confined to that from interior particles. This structural advantage ensures that the number of independent equations is directly proportional to the number of interior particles, effectively minimizing the computational cost stemming from the number of wall particles.
However, the influence of wall particles on computational cost is not entirely negligible throughout the entire algorithm. This is because when obtaining the grand resistance matrix in (2.16), it is necessary to invert the far-field mobility matrix containing information about all the particles to account for long-ranged hydrodynamics induced by wall particles. As a result of this process, the dynamics of particles in accordance with ambient flow and thermal fluctuation reflect the effects from the channel walls. However, since hydrodynamic effects from far-field interactions change slowly over time, this process is performed only once per single diffusional time of a particle  $6{\rm \pi} \mu {a^3}/{k_B}T$ (Nott & Brady Reference Nott and Brady1994), where ${k_B}$ is the Boltzmann constant and T is the system temperature. In our study, the time step used for simulations is 10−4 times a single diffusional time, so the inversion of the grand mobility matrix is performed once every 104 steps, significantly reducing its computational proportion in the simulation.
However, as (2.29) takes a fully generalized form independent of the number of wall particles, this formulation can also be applied in conventional SD where wall particles are not present. Interestingly, Wang & Swan (Reference Wang and Swan2019) employed a similar form of the governing equation to investigate the heterogeneity effect of patched beads on colloid gelation. In this study, each of the sphere particles comprising the beads is compelled into rigid body motion through the action of constraint force. Although developed for different systems, this constraint-containing Stokesian dynamics formulation shares the structural advantages presented in (2.29) and could find applications in various systems.
Not only essential aspects of particle motion, but also the rheological properties of interior particles and the hydrodynamic stress  ${{\boldsymbol{S}}^H}$ exerted on the channel wall can be efficiently calculated. First, obtaining the hydrodynamic force ${{\boldsymbol{F}}^W}$ on the channel wall is straightforward, achieved by performing the matrix-vector multiplication in (2.25) using the velocity vector of interior particles obtained during the time marching. Similarly, the hydrodynamic stress experienced by the wall and interior particles is determined using the velocity vector of internal particles and (2.15). More specifically, the particle-phase stress is divided into non-hydrodynamic and hydrodynamic contributions, as illustrated in (2.36) (Batchelor Reference Batchelor1970, Reference Batchelor1977). The first two terms, ideal osmotic pressure and inter-particle elastic stress, constitute the non-hydrodynamic stress, while the third term, representing the hydrodynamic component, is elaborated upon in (2.37) for interior particles ( ${\langle {\boldsymbol{\Sigma} }\rangle ^H} = {\langle {\boldsymbol{S}}\rangle ^I}$), and (2.38) for the wall stress simulated by wall particles ( ${\langle {\boldsymbol{\Sigma} }\rangle ^H} = {\langle {\boldsymbol{S}}\rangle ^W}$).
 \begin{gather}\langle {\boldsymbol{\Sigma} }\rangle ={-} nkT{\boldsymbol{I}} - n\langle {\boldsymbol{r}}{{\boldsymbol{F}}^P}\rangle + {\langle {\boldsymbol{\Sigma} }\rangle ^H},\end{gather}
 \begin{gather}{{\boldsymbol{S}}^I} ={-}
{\boldsymbol{R}}_{SU}^{II}\boldsymbol{\cdot
}({{\boldsymbol{u}}^I} - {{\boldsymbol{U}}^\infty }) +
{\boldsymbol{R}}_{SU}^{IW}\boldsymbol{\cdot
}{{\boldsymbol{U}}^\infty } - {\boldsymbol{R}}_{S\varOmega
}^{II}\boldsymbol{\cdot }({{\boldsymbol{\omega} }^I} -
{{\boldsymbol{\varOmega} }^\infty })\nonumber\\ \quad +\,{\boldsymbol{R}}_{S\varOmega }^{IW}\boldsymbol{\cdot
}{{\boldsymbol{\varOmega} }^\infty } +
{\boldsymbol{R}}_{SE}^{II}\boldsymbol{\cdot
}{{\boldsymbol{E}}^\infty } +
{\boldsymbol{R}}_{SE}^{IW}\boldsymbol{\cdot
}{{\boldsymbol{E}}^\infty
},\end{gather}
\begin{gather}{{\boldsymbol{S}}^I} ={-}
{\boldsymbol{R}}_{SU}^{II}\boldsymbol{\cdot
}({{\boldsymbol{u}}^I} - {{\boldsymbol{U}}^\infty }) +
{\boldsymbol{R}}_{SU}^{IW}\boldsymbol{\cdot
}{{\boldsymbol{U}}^\infty } - {\boldsymbol{R}}_{S\varOmega
}^{II}\boldsymbol{\cdot }({{\boldsymbol{\omega} }^I} -
{{\boldsymbol{\varOmega} }^\infty })\nonumber\\ \quad +\,{\boldsymbol{R}}_{S\varOmega }^{IW}\boldsymbol{\cdot
}{{\boldsymbol{\varOmega} }^\infty } +
{\boldsymbol{R}}_{SE}^{II}\boldsymbol{\cdot
}{{\boldsymbol{E}}^\infty } +
{\boldsymbol{R}}_{SE}^{IW}\boldsymbol{\cdot
}{{\boldsymbol{E}}^\infty
},\end{gather} \begin{align}{{\boldsymbol{S}}^W} &=
{\boldsymbol{R}}_{SU}^{WW}\boldsymbol{\cdot
}{{\boldsymbol{U}}^\infty } -
{\boldsymbol{R}}_{SU}^{WI}\boldsymbol{\cdot
}({{\boldsymbol{u}}^I} - {{\boldsymbol{U}}^\infty }) +
{\boldsymbol{R}}_{S\varOmega }^{WW}\boldsymbol{\cdot
}{{\boldsymbol{\varOmega} }^\infty } -
{\boldsymbol{R}}_{S\varOmega }^{WI}\boldsymbol{\cdot
}({{\boldsymbol{\omega} }^I} - {{\boldsymbol{\varOmega}
}^\infty })\nonumber\\ &\quad + {\boldsymbol{R}}_{SE}^{WI}\boldsymbol{\cdot
}{{\boldsymbol{E}}^\infty } +
{\boldsymbol{R}}_{SE}^{WW}\boldsymbol{\cdot
}{{\boldsymbol{E}}^\infty
}.\end{align}
\begin{align}{{\boldsymbol{S}}^W} &=
{\boldsymbol{R}}_{SU}^{WW}\boldsymbol{\cdot
}{{\boldsymbol{U}}^\infty } -
{\boldsymbol{R}}_{SU}^{WI}\boldsymbol{\cdot
}({{\boldsymbol{u}}^I} - {{\boldsymbol{U}}^\infty }) +
{\boldsymbol{R}}_{S\varOmega }^{WW}\boldsymbol{\cdot
}{{\boldsymbol{\varOmega} }^\infty } -
{\boldsymbol{R}}_{S\varOmega }^{WI}\boldsymbol{\cdot
}({{\boldsymbol{\omega} }^I} - {{\boldsymbol{\varOmega}
}^\infty })\nonumber\\ &\quad + {\boldsymbol{R}}_{SE}^{WI}\boldsymbol{\cdot
}{{\boldsymbol{E}}^\infty } +
{\boldsymbol{R}}_{SE}^{WW}\boldsymbol{\cdot
}{{\boldsymbol{E}}^\infty
}.\end{align}The hydrodynamic part of the stress is further divided into the stress from the background velocity field, the Brownian stress and the dissipative part of the inter-particle stress. If relative motion between particles is induced by inter-particle forces and they are hydrodynamically coupled, this motion induces stresslets (Chu & Zia Reference Chu and Zia2016). The individual contributions constituting the hydrodynamic part can be calculated by determining the slip velocity under the influence of the corresponding force using (2.29), followed by performing matrix-vector multiplications as described in (2.37) and (2.38).
One of the primary interests in fouling dynamics is the observation of how the deformation of clogs and resuspension kinetics is affected by the hydrodynamic stress resulting from the combined effects of particle–fluid interaction and particle–particle interaction. From a Lagrangian perspective, the inter-particle stress, which falls under the non-hydrodynamic contribution, has primarily been associated with the elastic energy stored within the given particle structure (Whittle & Dickinson Reference Whittle and Dickinson1997; Johnson, Landrum & Zia Reference Johnson, Landrum and Zia2018; Lee et al. Reference Lee, Jin, Kim, Myung and Ahn2021). However, a comprehensive understanding of the effects of hydrodynamics on agglomerate deformation has not yet been fully established. Therefore, the method developed in this section, which allows for an easy evaluation of the kinetics of individual particles influenced by the interaction of various opposing forces within the flow channel, can offer advantages in studying the impact of hydrodynamics on fouling dynamics.
While the constrained Stokesian dynamics formulation has indeed resulted in a significant enhancement of computational speed during the initial phases of the simulation, it fundamentally possesses a time complexity of  $O({({N^I})^3})$ when the number of interior particles is ${N^I}$. Therefore, as fouling advances to later stages, the computational workload escalates rapidly. In the subsequent subsection, various acceleration schemes developed to facilitate efficient calculations for hydrodynamic coupling are presented, assuming constrained velocity on wall particles.
2.1.3. Acceleration scheme on the constraint Stokesian dynamics
The most time-consuming step in considering many-body hydrodynamics is matrix inversion, which becomes the rate-determining step in the SD paradigm. Therefore, to circumvent matrix inversion, a method of dividing hydrodynamic force into near-field lubrication and far-field contributions and obtaining the desired properties through an iterative scheme has been considered (Sierou & Brady Reference Sierou and Brady2001; Banchio & Brady Reference Banchio and Brady2003). According to this scheme, far-field force  ${{\boldsymbol{F}}_{ff}}$, torque ${{\boldsymbol{T}}_{ff}}$ and stresslet ${{\boldsymbol{S}}_{ff}}$ are defined as follows:
 \begin{equation}\left[
{\begin{array}{*{20}{@{}c@{}}} {{{\boldsymbol{F}}_{ff}}}\\
{{{\boldsymbol{T}}_{ff}}}\\ {{{\boldsymbol{S}}_{ff}}}
\end{array}} \right] ={-} {({{\mathcal{M}}^\infty })^{ -
1}}\boldsymbol{\cdot }\left[ {\begin{array}{*{20}{@{}c@{}}}
{{\boldsymbol{u}} - {{\boldsymbol{U}}^\infty }}\\
{{\boldsymbol{\omega} } - {{\boldsymbol{\varOmega} }^\infty
}}\\ { - {{\boldsymbol{E}}^\infty }} \end{array}}
\right].\end{equation}
\begin{equation}\left[
{\begin{array}{*{20}{@{}c@{}}} {{{\boldsymbol{F}}_{ff}}}\\
{{{\boldsymbol{T}}_{ff}}}\\ {{{\boldsymbol{S}}_{ff}}}
\end{array}} \right] ={-} {({{\mathcal{M}}^\infty })^{ -
1}}\boldsymbol{\cdot }\left[ {\begin{array}{*{20}{@{}c@{}}}
{{\boldsymbol{u}} - {{\boldsymbol{U}}^\infty }}\\
{{\boldsymbol{\omega} } - {{\boldsymbol{\varOmega} }^\infty
}}\\ { - {{\boldsymbol{E}}^\infty }} \end{array}}
\right].\end{equation}Therefore, the action of the grand resistance matrix is divided into contributions from near-field lubrication and far-field interactions:
 \begin{align}\left[
{\begin{array}{*{20}{@{}c@{}}} {\textbf{0}}\\ {\textbf{0}}\\
{{{\boldsymbol{S}}^H}} \end{array}} \right] &={-} \left[
{\left[ {\begin{array}{@{}ccc@{}}
{{{\boldsymbol{R}}_{FU,nf}}}& \ {{{\boldsymbol{R}}_{F\varOmega
,nf}}}& \ {{{\boldsymbol{R}}_{FE,nf}}}\\
{{{\boldsymbol{R}}_{TU,nf}}}& \ {{{\boldsymbol{R}}_{T\varOmega
,nf}}}& \ {{{\boldsymbol{R}}_{TE,nf}}}\\
{{{\boldsymbol{R}}_{SU,nf}}}& \ {{{\boldsymbol{R}}_{S\varOmega
,nf}}}& \ {{{\boldsymbol{R}}_{SE,nf}}} \end{array}} \right] +
{{({{\mathcal{M}}^\infty })}^{ - 1}}}
\right]\boldsymbol{\cdot }\left[ {\begin{array}{*{20}{@{}c@{}}}
{{\boldsymbol{u}} - {{\boldsymbol{U}}^\infty }}\\
{{\boldsymbol{\omega} } - {{\boldsymbol{\varOmega} }^\infty
}}\\ { - {{\boldsymbol{E}}^\infty }} \end{array}} \right]\nonumber\\ &\quad +
\left[ {\begin{array}{*{20}{@{}c@{}}} {{{\boldsymbol{F}}^P} +
{{\boldsymbol{F}}^B}}\\ {{{\boldsymbol{T}}^B}}\\ { -
{\boldsymbol{x}}{{\boldsymbol{F}}^P}} \end{array}}
\right].\end{align}
\begin{align}\left[
{\begin{array}{*{20}{@{}c@{}}} {\textbf{0}}\\ {\textbf{0}}\\
{{{\boldsymbol{S}}^H}} \end{array}} \right] &={-} \left[
{\left[ {\begin{array}{@{}ccc@{}}
{{{\boldsymbol{R}}_{FU,nf}}}& \ {{{\boldsymbol{R}}_{F\varOmega
,nf}}}& \ {{{\boldsymbol{R}}_{FE,nf}}}\\
{{{\boldsymbol{R}}_{TU,nf}}}& \ {{{\boldsymbol{R}}_{T\varOmega
,nf}}}& \ {{{\boldsymbol{R}}_{TE,nf}}}\\
{{{\boldsymbol{R}}_{SU,nf}}}& \ {{{\boldsymbol{R}}_{S\varOmega
,nf}}}& \ {{{\boldsymbol{R}}_{SE,nf}}} \end{array}} \right] +
{{({{\mathcal{M}}^\infty })}^{ - 1}}}
\right]\boldsymbol{\cdot }\left[ {\begin{array}{*{20}{@{}c@{}}}
{{\boldsymbol{u}} - {{\boldsymbol{U}}^\infty }}\\
{{\boldsymbol{\omega} } - {{\boldsymbol{\varOmega} }^\infty
}}\\ { - {{\boldsymbol{E}}^\infty }} \end{array}} \right]\nonumber\\ &\quad +
\left[ {\begin{array}{*{20}{@{}c@{}}} {{{\boldsymbol{F}}^P} +
{{\boldsymbol{F}}^B}}\\ {{{\boldsymbol{T}}^B}}\\ { -
{\boldsymbol{x}}{{\boldsymbol{F}}^P}} \end{array}}
\right].\end{align} In the above equation, the force balance for interior particles in the first and second rows is expanded as follows. The superscripts in the resistance matrix denote the submatrix of the near-field matrix corresponding to interior particle I or wall particle  $W$.
$W$.
 \begin{align}
{\textbf{0}} & = {\boldsymbol{F}}_{ff}^I -
{\boldsymbol{R}}_{FU,nf}^{II}\boldsymbol{\cdot
}({{\boldsymbol{u}}^I} - {{\boldsymbol{U}}^\infty }) +
{\boldsymbol{R}}_{FU,nf}^{IW}\boldsymbol{\cdot
}{{\boldsymbol{U}}^\infty } - {\boldsymbol{R}}_{F\varOmega
,nf}^{II}\boldsymbol{\cdot }({{\boldsymbol{\omega} }^I} -
{{\boldsymbol{\varOmega} }^\infty }) +
{\boldsymbol{R}}_{F\varOmega ,nf}^{IW}\boldsymbol{\cdot
}{{\boldsymbol{\varOmega} }^\infty }\nonumber\\ & \quad +
{\boldsymbol{R}}_{FE,nf}^{II}\boldsymbol{\cdot
}{{\boldsymbol{E}}^\infty } +
{\boldsymbol{R}}_{FE,nf}^{IW}\boldsymbol{\cdot
}{{\boldsymbol{E}}^\infty } + {{\boldsymbol{F}}^P} +
{{\boldsymbol{F}}^B},
\end{align}
\begin{align}
{\textbf{0}} & = {\boldsymbol{F}}_{ff}^I -
{\boldsymbol{R}}_{FU,nf}^{II}\boldsymbol{\cdot
}({{\boldsymbol{u}}^I} - {{\boldsymbol{U}}^\infty }) +
{\boldsymbol{R}}_{FU,nf}^{IW}\boldsymbol{\cdot
}{{\boldsymbol{U}}^\infty } - {\boldsymbol{R}}_{F\varOmega
,nf}^{II}\boldsymbol{\cdot }({{\boldsymbol{\omega} }^I} -
{{\boldsymbol{\varOmega} }^\infty }) +
{\boldsymbol{R}}_{F\varOmega ,nf}^{IW}\boldsymbol{\cdot
}{{\boldsymbol{\varOmega} }^\infty }\nonumber\\ & \quad +
{\boldsymbol{R}}_{FE,nf}^{II}\boldsymbol{\cdot
}{{\boldsymbol{E}}^\infty } +
{\boldsymbol{R}}_{FE,nf}^{IW}\boldsymbol{\cdot
}{{\boldsymbol{E}}^\infty } + {{\boldsymbol{F}}^P} +
{{\boldsymbol{F}}^B},
\end{align} \begin{align}
{\textbf{0}} & = {\boldsymbol{T}}_{ff}^I -
{\boldsymbol{R}}_{TU,nf}^{II}\boldsymbol{\cdot
}({{\boldsymbol{u}}^I} - {{\boldsymbol{U}}^\infty }) +
{\boldsymbol{R}}_{TU,nf}^{IW}\boldsymbol{\cdot
}{{\boldsymbol{U}}^\infty } - {\boldsymbol{R}}_{T\varOmega
,nf}^{II}\boldsymbol{\cdot }({{\boldsymbol{\omega} }^I} -
{{\boldsymbol{\varOmega} }^\infty }) +
{\boldsymbol{R}}_{T\varOmega ,nf}^{IW}\boldsymbol{\cdot
}{{\boldsymbol{\varOmega} }^\infty }\nonumber\\ & \quad +
{\boldsymbol{R}}_{TE,nf}^{II}\boldsymbol{\cdot
}{{\boldsymbol{E}}^\infty } +
{\boldsymbol{R}}_{TE,nf}^{IW}\boldsymbol{\cdot
}{{\boldsymbol{E}}^\infty } + {{\boldsymbol{T}}^B}.
\end{align}
\begin{align}
{\textbf{0}} & = {\boldsymbol{T}}_{ff}^I -
{\boldsymbol{R}}_{TU,nf}^{II}\boldsymbol{\cdot
}({{\boldsymbol{u}}^I} - {{\boldsymbol{U}}^\infty }) +
{\boldsymbol{R}}_{TU,nf}^{IW}\boldsymbol{\cdot
}{{\boldsymbol{U}}^\infty } - {\boldsymbol{R}}_{T\varOmega
,nf}^{II}\boldsymbol{\cdot }({{\boldsymbol{\omega} }^I} -
{{\boldsymbol{\varOmega} }^\infty }) +
{\boldsymbol{R}}_{T\varOmega ,nf}^{IW}\boldsymbol{\cdot
}{{\boldsymbol{\varOmega} }^\infty }\nonumber\\ & \quad +
{\boldsymbol{R}}_{TE,nf}^{II}\boldsymbol{\cdot
}{{\boldsymbol{E}}^\infty } +
{\boldsymbol{R}}_{TE,nf}^{IW}\boldsymbol{\cdot
}{{\boldsymbol{E}}^\infty } + {{\boldsymbol{T}}^B}.
\end{align}Similar to the previous subsection, since the resistance tensor is independent of the particle's momentum and determined solely by the particle's configuration and the topology of the wall, the predetermined hydrodynamic force from the wall can be substituted, as illustrated in (2.43) and (2.44). The remaining terms are then restructured into a matrix formulation, as presented in (2.45).
 \begin{gather}{\boldsymbol{A}^{\prime}} = {\boldsymbol{R}}_{FU,nf}^{IW}\boldsymbol{\cdot }{{\boldsymbol{U}}^\infty } + {\boldsymbol{R}}_{F\varOmega ,nf}^{IW}\boldsymbol{\cdot }{{\boldsymbol{\varOmega} }^\infty } + {\boldsymbol{R}}_{FE,nf}^{II}\boldsymbol{\cdot }{{\boldsymbol{E}}^\infty } + {\boldsymbol{R}}_{FE,nf}^{IW}\boldsymbol{\cdot }{{\boldsymbol{E}}^\infty },\end{gather}
 \begin{gather}{\boldsymbol{B}^{\prime}} = {\boldsymbol{R}}_{TU,nf}^{IW}\boldsymbol{\cdot }{{\boldsymbol{U}}^\infty } + {\boldsymbol{R}}_{T\varOmega ,nf}^{IW}\boldsymbol{\cdot }{{\boldsymbol{\varOmega} }^\infty } + {\boldsymbol{R}}_{TE,nf}^{II}\boldsymbol{\cdot }{{\boldsymbol{E}}^\infty } + {\boldsymbol{R}}_{TE,nf}^{IW}\boldsymbol{\cdot }{{\boldsymbol{E}}^\infty },\end{gather}
 \begin{gather}\left[
{\begin{array}{*{20}{@{}c@{}}} {{{\boldsymbol{u}}^I} -
{{\boldsymbol{U}}^\infty }}\\ {{{\boldsymbol{\omega} }^I} -
{{\boldsymbol{\varOmega} }^\infty }} \end{array}} \right] =
\left[ {\begin{array}{@{}cc@{}}
{{{({\boldsymbol{R}}_{FU,nf}^{II})}^{ -
1}}}& \ {{{({\boldsymbol{R}}_{F\varOmega ,nf}^{II})}^{ - 1}}}\\
{{{({\boldsymbol{R}}_{TU,nf}^{II})}^{ -
1}}}& \ {{{({\boldsymbol{R}}_{T\varOmega ,nf}^{II})}^{ - 1}}}
\end{array}} \right]\left[ {\begin{array}{*{20}{@{}c@{}}}
{{\boldsymbol{F}}_{ff}^I + {{\boldsymbol{F}}^P} +
{{\boldsymbol{F}}^B} + {\boldsymbol{A}^{\prime}}}\\
{{\boldsymbol{T}}_{ff}^I + {{\boldsymbol{T}}^B} +
{\boldsymbol{B}^{\prime}}} \end{array}}
\right].\end{gather}
\begin{gather}\left[
{\begin{array}{*{20}{@{}c@{}}} {{{\boldsymbol{u}}^I} -
{{\boldsymbol{U}}^\infty }}\\ {{{\boldsymbol{\omega} }^I} -
{{\boldsymbol{\varOmega} }^\infty }} \end{array}} \right] =
\left[ {\begin{array}{@{}cc@{}}
{{{({\boldsymbol{R}}_{FU,nf}^{II})}^{ -
1}}}& \ {{{({\boldsymbol{R}}_{F\varOmega ,nf}^{II})}^{ - 1}}}\\
{{{({\boldsymbol{R}}_{TU,nf}^{II})}^{ -
1}}}& \ {{{({\boldsymbol{R}}_{T\varOmega ,nf}^{II})}^{ - 1}}}
\end{array}} \right]\left[ {\begin{array}{*{20}{@{}c@{}}}
{{\boldsymbol{F}}_{ff}^I + {{\boldsymbol{F}}^P} +
{{\boldsymbol{F}}^B} + {\boldsymbol{A}^{\prime}}}\\
{{\boldsymbol{T}}_{ff}^I + {{\boldsymbol{T}}^B} +
{\boldsymbol{B}^{\prime}}} \end{array}}
\right].\end{gather} While (2.45) serves as an analogy to (2.29), the acceleration scheme includes the additional separation of far-field components into a force vector. This separation results in a sparse near-field matrix that, in most cases, becomes singular as contributions from the particles that have not entered the lubrication boundary layer become zero. To ensure positive definiteness and enhance convergence, the introduction of an isotropic tensor on the right-hand side leads to the transformation of the near-field resistance to  ${\boldsymbol{R}}_{FU,nf}^{II} + \beta {\boldsymbol{I}} = \tilde{{\boldsymbol{R}}}_{FU,nf}^{II}$ and the far-field force on the interior particles to ${\boldsymbol{F}}_{ff}^I + \beta ({{\boldsymbol{u}}^I} - {{\boldsymbol{U}}^\infty }) = \tilde{{\boldsymbol{F}}}_{ff}^I$, where $\beta$ is a positive scalar. This treatment changes (2.45) into (2.46), making it a suitable form for practical implementation:
 \begin{equation}\left[
{\begin{array}{*{20}{@{}c@{}}} {\tilde{{\boldsymbol{F}}}_{ff}^I +
{{\boldsymbol{F}}^P} + {{\boldsymbol{F}}^B} +
{\boldsymbol{A}^{\prime}}}\\
{\tilde{{\boldsymbol{T}}}_{ff}^I + {{\boldsymbol{T}}^B} +
{\boldsymbol{B}^{\prime}}} \end{array}} \right] = \left[
{\begin{array}{@{}cc@{}}
{\tilde{{\boldsymbol{R}}}_{FU,nf}^{II}}& \ {\tilde{{\boldsymbol{R}}}_{F\varOmega
,nf}^{II}}\\
{\tilde{{\boldsymbol{R}}}_{TU,nf}^{II}}& \ {\tilde{{\boldsymbol{R}}}_{T\varOmega
,nf}^{II}} \end{array}} \right]\boldsymbol{\cdot }\left[
{\begin{array}{*{20}{@{}c@{}}} {{{\boldsymbol{u}}^I} -
{{\boldsymbol{U}}^\infty }}\\ {{{\boldsymbol{\omega} }^I} -
{{\boldsymbol{\varOmega} }^\infty }} \end{array}}
\right].\end{equation}
\begin{equation}\left[
{\begin{array}{*{20}{@{}c@{}}} {\tilde{{\boldsymbol{F}}}_{ff}^I +
{{\boldsymbol{F}}^P} + {{\boldsymbol{F}}^B} +
{\boldsymbol{A}^{\prime}}}\\
{\tilde{{\boldsymbol{T}}}_{ff}^I + {{\boldsymbol{T}}^B} +
{\boldsymbol{B}^{\prime}}} \end{array}} \right] = \left[
{\begin{array}{@{}cc@{}}
{\tilde{{\boldsymbol{R}}}_{FU,nf}^{II}}& \ {\tilde{{\boldsymbol{R}}}_{F\varOmega
,nf}^{II}}\\
{\tilde{{\boldsymbol{R}}}_{TU,nf}^{II}}& \ {\tilde{{\boldsymbol{R}}}_{T\varOmega
,nf}^{II}} \end{array}} \right]\boldsymbol{\cdot }\left[
{\begin{array}{*{20}{@{}c@{}}} {{{\boldsymbol{u}}^I} -
{{\boldsymbol{U}}^\infty }}\\ {{{\boldsymbol{\omega} }^I} -
{{\boldsymbol{\varOmega} }^\infty }} \end{array}}
\right].\end{equation}As the far-field mobility remains undetermined, the translational and rotational velocities of the interior particles are expressed as functions of the far-field force and subsequently substituted into (2.40). Following several steps of rearrangement, it takes the form
 \begin{align} &
\left( {{\mathcal{M}}^\infty }\boldsymbol{\cdot }\left(
{{\boldsymbol{I}} - \beta \left[ {\begin{array}{@{}ccccc@{}}
{{{(\tilde{{\boldsymbol{R}}}_{FU,nf}^{II})}^{ -
1}}}&{\textbf{0}}&{{{(\tilde{{\boldsymbol{R}}}_{F\varOmega
,nf}^{II})}^{ - 1}}}&{\textbf{0}}&{\textbf{0}}\\
{\textbf{0}}&{\textbf{0}}&{\textbf{0}}&{\textbf{0}}&{\textbf{0}}\\
{{{(\tilde{{\boldsymbol{R}}}_{TU,nf}^{II})}^{ -
1}}}&{\textbf{0}}&{{{({\tilde{{\boldsymbol{R}}}_{T\varOmega
,nf}^{II}} )}^{ - 1}}}&{\textbf{0}}&{\textbf{0}}\\
{\textbf{0}}&{\textbf{0}}&{\textbf{0}}&{\textbf{0}}&{\textbf{0}}\\
{\textbf{0}}&{\textbf{0}}&{\textbf{0}}&{\textbf{0}}&{\textbf{0}}
\end{array}} \right]} \right)\right.\nonumber\\ &\left.\quad + \left[
{\begin{array}{@{}ccccc@{}}
{{{(\tilde{{\boldsymbol{R}}}_{FU,nf}^{II})}^{ -
1}}}&{\textbf{0}}&{{{(\tilde{{\boldsymbol{R}}}_{F\varOmega
,nf}^{II})}^{ - 1}}}&{\textbf{0}}&{\textbf{0}}\\
{\textbf{0}}&{\textbf{0}}&{\textbf{0}}&{\textbf{0}}&{\textbf{0}}\\
{{{(\tilde{{\boldsymbol{R}}}_{TU,nf}^{II})}^{ -
1}}}&{\textbf{0}}&{{{(\tilde{{\boldsymbol{R}}}_{T\varOmega
,nf}^{II})}^{ - 1}}}&{\textbf{0}}&{\textbf{0}}\\
{\textbf{0}}&{\textbf{0}}&{\textbf{0}}&{\textbf{0}}&{\textbf{0}}\\
{\textbf{0}}&{\textbf{0}}&{\textbf{0}}&{\textbf{0}}&{\textbf{0}}
\end{array}} \right] \right)\boldsymbol{\cdot }\left[
{\begin{array}{@{}c@{}}
{\tilde{{\boldsymbol{F}}}_{ff}^I}\\
{\tilde{{\boldsymbol{F}}}_{ff}^W}\\
{\tilde{{\boldsymbol{T}}}_{ff}^I}\\
{\tilde{{\boldsymbol{T}}}_{ff}^W}\\
{{{\boldsymbol{S}}_{ff}}} \end{array}} \right]\nonumber\\ & \quad
={-} \left[ {\begin{array}{@{}c@{}}
{{{(\tilde{{\boldsymbol{R}}}_{FU,nf}^{II})}^{ -
1}}\boldsymbol{\cdot }({{\boldsymbol{F}}^P} +
{{\boldsymbol{F}}^B} + {\boldsymbol{A}^{\prime}}) +
{{(\tilde{{\boldsymbol{R}}}_{F\varOmega ,nf}^{II})}^{ -
1}}\boldsymbol{\cdot }({{\boldsymbol{T}}^B} +
{\boldsymbol{B}^{\prime}})}\\ { - {{\boldsymbol{U}}^\infty
}}\\ {{{(\tilde{{\boldsymbol{R}}}_{TU,nf}^{II})}^{ -
1}}\boldsymbol{\cdot }({{\boldsymbol{F}}^P} +
{{\boldsymbol{F}}^B} + {\boldsymbol{A}^{\prime}}) +
{{(\tilde{{\boldsymbol{R}}}_{T\varOmega ,nf}^{II})}^{ -
1}}\boldsymbol{\cdot }({{\boldsymbol{T}}^B} +
{\boldsymbol{B}^{\prime}})}\\ { - {{\boldsymbol{\varOmega}
}^\infty }}\\ { - {{\boldsymbol{E}}^\infty }} \end{array}}
\right]\nonumber\\ & \quad \quad + \beta {{\mathcal{M}}^\infty
}\boldsymbol{\cdot }\left[ {\begin{array}{@{}c@{}}
{{{(\tilde{{\boldsymbol{R}}}_{FU,nf}^{II})}^{ -
1}}\boldsymbol{\cdot }({{\boldsymbol{F}}^P} +
{{\boldsymbol{F}}^B} + {\boldsymbol{A}^{\prime}}) +
{{(\tilde{{\boldsymbol{R}}}_{F\varOmega ,nf}^{II})}^{ -
1}}\boldsymbol{\cdot }({{\boldsymbol{T}}^B} +
{\boldsymbol{B}^{\prime}})}\\ {\textbf{0}}\\
{{{(\tilde{{\boldsymbol{R}}}_{TU,nf}^{II})}^{ -
1}}\boldsymbol{\cdot }({{\boldsymbol{F}}^P} +
{{\boldsymbol{F}}^B} + {\boldsymbol{A}^{\prime}}) +
{{(\tilde{{\boldsymbol{R}}}_{F\varOmega ,nf}^{II})}^{ -
1}}\boldsymbol{\cdot }({{\boldsymbol{T}}^B} +
{\boldsymbol{B}^{\prime}})}\\ {\textbf{0}}\\ {\textbf{0}}
\end{array}} \right].
\end{align}
\begin{align} &
\left( {{\mathcal{M}}^\infty }\boldsymbol{\cdot }\left(
{{\boldsymbol{I}} - \beta \left[ {\begin{array}{@{}ccccc@{}}
{{{(\tilde{{\boldsymbol{R}}}_{FU,nf}^{II})}^{ -
1}}}&{\textbf{0}}&{{{(\tilde{{\boldsymbol{R}}}_{F\varOmega
,nf}^{II})}^{ - 1}}}&{\textbf{0}}&{\textbf{0}}\\
{\textbf{0}}&{\textbf{0}}&{\textbf{0}}&{\textbf{0}}&{\textbf{0}}\\
{{{(\tilde{{\boldsymbol{R}}}_{TU,nf}^{II})}^{ -
1}}}&{\textbf{0}}&{{{({\tilde{{\boldsymbol{R}}}_{T\varOmega
,nf}^{II}} )}^{ - 1}}}&{\textbf{0}}&{\textbf{0}}\\
{\textbf{0}}&{\textbf{0}}&{\textbf{0}}&{\textbf{0}}&{\textbf{0}}\\
{\textbf{0}}&{\textbf{0}}&{\textbf{0}}&{\textbf{0}}&{\textbf{0}}
\end{array}} \right]} \right)\right.\nonumber\\ &\left.\quad + \left[
{\begin{array}{@{}ccccc@{}}
{{{(\tilde{{\boldsymbol{R}}}_{FU,nf}^{II})}^{ -
1}}}&{\textbf{0}}&{{{(\tilde{{\boldsymbol{R}}}_{F\varOmega
,nf}^{II})}^{ - 1}}}&{\textbf{0}}&{\textbf{0}}\\
{\textbf{0}}&{\textbf{0}}&{\textbf{0}}&{\textbf{0}}&{\textbf{0}}\\
{{{(\tilde{{\boldsymbol{R}}}_{TU,nf}^{II})}^{ -
1}}}&{\textbf{0}}&{{{(\tilde{{\boldsymbol{R}}}_{T\varOmega
,nf}^{II})}^{ - 1}}}&{\textbf{0}}&{\textbf{0}}\\
{\textbf{0}}&{\textbf{0}}&{\textbf{0}}&{\textbf{0}}&{\textbf{0}}\\
{\textbf{0}}&{\textbf{0}}&{\textbf{0}}&{\textbf{0}}&{\textbf{0}}
\end{array}} \right] \right)\boldsymbol{\cdot }\left[
{\begin{array}{@{}c@{}}
{\tilde{{\boldsymbol{F}}}_{ff}^I}\\
{\tilde{{\boldsymbol{F}}}_{ff}^W}\\
{\tilde{{\boldsymbol{T}}}_{ff}^I}\\
{\tilde{{\boldsymbol{T}}}_{ff}^W}\\
{{{\boldsymbol{S}}_{ff}}} \end{array}} \right]\nonumber\\ & \quad
={-} \left[ {\begin{array}{@{}c@{}}
{{{(\tilde{{\boldsymbol{R}}}_{FU,nf}^{II})}^{ -
1}}\boldsymbol{\cdot }({{\boldsymbol{F}}^P} +
{{\boldsymbol{F}}^B} + {\boldsymbol{A}^{\prime}}) +
{{(\tilde{{\boldsymbol{R}}}_{F\varOmega ,nf}^{II})}^{ -
1}}\boldsymbol{\cdot }({{\boldsymbol{T}}^B} +
{\boldsymbol{B}^{\prime}})}\\ { - {{\boldsymbol{U}}^\infty
}}\\ {{{(\tilde{{\boldsymbol{R}}}_{TU,nf}^{II})}^{ -
1}}\boldsymbol{\cdot }({{\boldsymbol{F}}^P} +
{{\boldsymbol{F}}^B} + {\boldsymbol{A}^{\prime}}) +
{{(\tilde{{\boldsymbol{R}}}_{T\varOmega ,nf}^{II})}^{ -
1}}\boldsymbol{\cdot }({{\boldsymbol{T}}^B} +
{\boldsymbol{B}^{\prime}})}\\ { - {{\boldsymbol{\varOmega}
}^\infty }}\\ { - {{\boldsymbol{E}}^\infty }} \end{array}}
\right]\nonumber\\ & \quad \quad + \beta {{\mathcal{M}}^\infty
}\boldsymbol{\cdot }\left[ {\begin{array}{@{}c@{}}
{{{(\tilde{{\boldsymbol{R}}}_{FU,nf}^{II})}^{ -
1}}\boldsymbol{\cdot }({{\boldsymbol{F}}^P} +
{{\boldsymbol{F}}^B} + {\boldsymbol{A}^{\prime}}) +
{{(\tilde{{\boldsymbol{R}}}_{F\varOmega ,nf}^{II})}^{ -
1}}\boldsymbol{\cdot }({{\boldsymbol{T}}^B} +
{\boldsymbol{B}^{\prime}})}\\ {\textbf{0}}\\
{{{(\tilde{{\boldsymbol{R}}}_{TU,nf}^{II})}^{ -
1}}\boldsymbol{\cdot }({{\boldsymbol{F}}^P} +
{{\boldsymbol{F}}^B} + {\boldsymbol{A}^{\prime}}) +
{{(\tilde{{\boldsymbol{R}}}_{F\varOmega ,nf}^{II})}^{ -
1}}\boldsymbol{\cdot }({{\boldsymbol{T}}^B} +
{\boldsymbol{B}^{\prime}})}\\ {\textbf{0}}\\ {\textbf{0}}
\end{array}} \right].
\end{align} The iterative form of the equation presented above includes velocity constraints for wall particles but remains in a fully generalized form. Consequently, it can be immediately reduced to the form used in the accelerated Stokesian dynamics scheme (ASD) for studying the systems such as dispersion between parallel plates or colloidal gels (Swan & Brady Reference Swan and Brady2011; Ouaknin, Su & Zia Reference Ouaknin, Su and Zia2021), even when the number of wall particles  ${N^W}$ is zero. This adaptive nature does not require any changes to the governing equation. Alternatively, in systems where thermal motion is not significant, as indicated by ${{\boldsymbol{F}}^B} = {{\boldsymbol{T}}^B} = {\textbf{0}}$, it can be reduced into a form for obtaining deterministic force moments. In the presence of thermal motion, the relationships below replace (2.30)–(2.32), as thermal motion can also be divided into contributions from the near- and far-field parts. To avoid unnecessary repetition, only the force term is represented since torque is conventionally included in the force vector (Brady & Bossis Reference Brady and Bossis1988).
 \begin{gather}\langle {\boldsymbol{F}}_{nf}^B(t)\rangle = \langle {\boldsymbol{F}}_{ff}^B(t)\rangle = 0,\end{gather}
 \begin{gather}\langle {\boldsymbol{F}}_{nf}^B(t){\boldsymbol{F}}_{nf}^B(t^{\prime})\rangle = 2{k_B}T{\boldsymbol{R}}_{FU,nf}^{II}\delta (t - t^{\prime}),\end{gather}
 \begin{gather}\langle {\boldsymbol{F}}_{ff}^B(t){\boldsymbol{F}}_{ff}^B(t^{\prime})\rangle = 2{k_B}T({{\mathcal{M}}^\infty })_{FU}^{ - 1}\delta (t - t^{\prime}).\end{gather}
 The near-field contribution, which encompasses the limited contributions from each particle pair  $\gamma$ within the cutoff radius of $4a$, results in a sparse resistance matrix. Due to its pairwise additive nature, it can be factorized by Cholesky decomposition (Banchio & Brady Reference Banchio and Brady2003).
 \begin{equation}F_{nf,i}^B = \sum\limits_{(i,j) \in S(\gamma )} {(L_{ii}^\gamma \cdot {\varPsi _{nf,i}} + L_{ij}^\gamma \cdot {\varPsi _{nf,j}}).}\end{equation}
 In this context,  ${\boldsymbol{L}}$ represents the lower triangular matrix of ${\boldsymbol{R}}_{FU,nf}^{II}$, while ${{\boldsymbol{\varPsi} }_{nf}}$ is a stochastic vector with zero mean and unit variance. It is important to clarify that the superscript $II$ in the factorized resistance matrix does not imply that lubrication contributions are exclusively between the interior particles; rather, it denotes the submatrix corresponding to interior particles in the matrix. Indeed, while the near-field thermal motion of interior particles is influenced by contributions from the wall particles within the cutoff radius, the computational advantage lies in the fact that only the matrix components corresponding to interior particles undergo Cholesky decomposition.
In the next part, the far-field contribution unavoidably involves considering the far-field effects from all the particles, as mentioned in § 2.1.2, but this step needs to be executed only once per unit diffusion time. Additionally, an approximation of  $({{\mathcal{M}}^\infty })_{FU}^{ - 1/2}{{\boldsymbol{\varPsi} }_{ff}}$ using the Lanczos process, a type of Krylov subspace method, can circumvent the direct inversion of the far-field mobility matrix. Since this process uses mobility components from all particles, this part aligns with conventional ASD, and the detailed procedure for the Lanczos process is omitted here but can be found in its pioneering works (Ando et al. Reference Ando, Chow, Saad and Skolnick2012; Chow & Saad Reference Chow and Saad2014; Ouaknin et al. Reference Ouaknin, Su and Zia2021).
Returning to the governing equation, (2.47) can be solved using an iterative method such as the generalized minimum residual method (Saad & Schultz Reference Saad and Schultz1986). By substituting the obtained far-field force back into (2.46), the particle velocity can be obtained. When expressed in a form that incorporates drift velocity, similar to those in (2.34) and (2.35), it takes the following form:
 \begin{align}{ {{{\boldsymbol{x}}^I}}
|_{{t_{n + 1/2}}}} &= { {{{\boldsymbol{x}}^I}} |_{{t_n}}} +
\frac{{({t_{n + 1}} - {t_n})}}{2}\left( \begin{array}{@{}l@{}} {
{{{\boldsymbol{U}}^\infty }} |_{{t_n}}} + {
{{{(\tilde{{\boldsymbol{R}}}_{FU,nf}^{II})}^{ - 1}}}
|_{{t_n}}}\boldsymbol{\cdot }{
{(\tilde{{\boldsymbol{F}}}_{ff}^I + {{\boldsymbol{F}}^P} +
{{\boldsymbol{F}}^B} + {\boldsymbol{A}^{\prime}})}
|_{{t_n}}}\\ \quad +\, {
{{{(\tilde{{\boldsymbol{R}}}_{F\varOmega ,nf}^{II})}^{ - 1}}}
|_{{t_n}}}\boldsymbol{\cdot }{
{(\tilde{{\boldsymbol{T}}}_{ff}^I + {{\boldsymbol{T}}^B} +
{\boldsymbol{B}^{\prime}})} |_{{t_n}}} \end{array}
\right),\end{align}
\begin{align}{ {{{\boldsymbol{x}}^I}}
|_{{t_{n + 1/2}}}} &= { {{{\boldsymbol{x}}^I}} |_{{t_n}}} +
\frac{{({t_{n + 1}} - {t_n})}}{2}\left( \begin{array}{@{}l@{}} {
{{{\boldsymbol{U}}^\infty }} |_{{t_n}}} + {
{{{(\tilde{{\boldsymbol{R}}}_{FU,nf}^{II})}^{ - 1}}}
|_{{t_n}}}\boldsymbol{\cdot }{
{(\tilde{{\boldsymbol{F}}}_{ff}^I + {{\boldsymbol{F}}^P} +
{{\boldsymbol{F}}^B} + {\boldsymbol{A}^{\prime}})}
|_{{t_n}}}\\ \quad +\, {
{{{(\tilde{{\boldsymbol{R}}}_{F\varOmega ,nf}^{II})}^{ - 1}}}
|_{{t_n}}}\boldsymbol{\cdot }{
{(\tilde{{\boldsymbol{T}}}_{ff}^I + {{\boldsymbol{T}}^B} +
{\boldsymbol{B}^{\prime}})} |_{{t_n}}} \end{array}
\right),\end{align} \begin{align}{ {{{\boldsymbol{x}}^I}}
|_{{t_{n + 1}}}} &= { {{{\boldsymbol{x}}^I}} |_{{t_n}}} +
({t_{n + 1}} - {t_n})\nonumber\\ &\quad\times\, \left( \begin{array}{@{}l@{}} {
{{{\boldsymbol{U}}^\infty }} |_{{t_{n + 1/2}}}} + {
{{{(\tilde{{\boldsymbol{R}}}_{FU,nf}^{II})}^{ - 1}}}
|_{{t_{n + 1/2}}}}\boldsymbol{\cdot }\{ {
{(\tilde{{\boldsymbol{F}}}_{ff}^I + {{\boldsymbol{F}}^P} +
{\boldsymbol{A}^{\prime}})} |_{{t_{n + 1/2}}}} + {
{{{\boldsymbol{F}}^B}} |_{{t_n}}}\} \\ \quad +\, {
{{{(\tilde{{\boldsymbol{R}}}_{F\varOmega ,nf}^{II})}^{ - 1}}}
|_{{t_{n + 1/2}}}}\boldsymbol{\cdot }\{ {
{(\tilde{{\boldsymbol{T}}}_{ff}^I +
{\boldsymbol{B}^{\prime}})} |_{{t_{n + 1/2}}}} + {
{{{\boldsymbol{T}}^B}} |_{{t_n}}}\} \end{array}
\right).\end{align}
\begin{align}{ {{{\boldsymbol{x}}^I}}
|_{{t_{n + 1}}}} &= { {{{\boldsymbol{x}}^I}} |_{{t_n}}} +
({t_{n + 1}} - {t_n})\nonumber\\ &\quad\times\, \left( \begin{array}{@{}l@{}} {
{{{\boldsymbol{U}}^\infty }} |_{{t_{n + 1/2}}}} + {
{{{(\tilde{{\boldsymbol{R}}}_{FU,nf}^{II})}^{ - 1}}}
|_{{t_{n + 1/2}}}}\boldsymbol{\cdot }\{ {
{(\tilde{{\boldsymbol{F}}}_{ff}^I + {{\boldsymbol{F}}^P} +
{\boldsymbol{A}^{\prime}})} |_{{t_{n + 1/2}}}} + {
{{{\boldsymbol{F}}^B}} |_{{t_n}}}\} \\ \quad +\, {
{{{(\tilde{{\boldsymbol{R}}}_{F\varOmega ,nf}^{II})}^{ - 1}}}
|_{{t_{n + 1/2}}}}\boldsymbol{\cdot }\{ {
{(\tilde{{\boldsymbol{T}}}_{ff}^I +
{\boldsymbol{B}^{\prime}})} |_{{t_{n + 1/2}}}} + {
{{{\boldsymbol{T}}^B}} |_{{t_n}}}\} \end{array}
\right).\end{align} The theoretical time complexity of the algorithm outlined above corresponds to  $O(N\,\textrm{log}\,N)$. Recently, Fiore & Swan (Reference Fiore and Swan2019) reported that the SD scheme can be accelerated up to $O(N)$ through a reformulation using the property of a saddle-point matrix. Appendix A demonstrates how to reformulate the constrained SD in a manner that exploits the properties of the saddle-point formulation. This is grounded in the common idea that both the saddle-point formulation and ASD share the concept of dividing hydrodynamic force moments into far-field and near-field interactions. This approach also enables the formation of the Schur complement required for the saddle-point formulation, even when there is a strong constraint on the velocity vector.
In summary, the algorithm developed in our study offers an advantage in terms of efficiency compared with Euler-based methods for systems with thousands of particles, as it does not require the process of remeshing after the application of new boundary conditions. While this study only implements the formulation in § 2.1.3 for the subsequent results, there are potential opportunities for future improvements for systems involving tens of thousands or more particles through GPU parallelization, as suggested by Fiore & Swan (Reference Fiore and Swan2019).
However, the process described in (2.52) and (2.53) corresponds to solving for the new particle positions through time marching, as depicted in the final step of figure 1. Before proceeding to the next section, in which we define the case system for fouling studies, we would like to provide a brief review of the coupling relationship between FEM and constraint SD. Obtaining the ambient velocity through FEM at the algorithm's outset and subsequently evaluating the velocity disturbance appears to be a one-way coupling, according to the form of the flowchart in figure 1. However, fluid and particles inherently interact through a two-way coupling. This is due to the continuous feedback loop that occurs between the fluid and particles through a series of processes: initially, the velocity disturbance is calculated at the centre of the particles, corresponding to the influence from the particles; subsequently, the changed positions of the particles are determined, corresponding to the influence from the fluid. Given the boundary conditions of the channel, FEM provides a steady-state solution of pure fluid as a reference in this feedback process. In the following section, the target geometry and boundary conditions are introduced, allowing for the acquisition of a unique FEM solution for the time-marching process.
2.2. Geometrical descriptions for flow channels
Using the simulation scheme developed in § 2.1, the simulations of the transport of particulate suspension have been conducted in the two confined geometries shown in figure 3 to observe fouling phenomena. Figure 3(a) depicts a T-shaped cross-flow channel with a side stream perpendicular to the main flow direction, while figure 3(b) illustrates a 4:1 contraction channel where a bottleneck occurs in the same direction as the main flow. One of the industrial processes in which particle fouling is a significant concern is membrane separation processes. The structures shown in figure 3 have been chosen as representative configurations for the case study because they simplify the unit structures of cross-end filtration and dead-end filtration, which are representative classifications in membrane separation processes (Kim et al. Reference Kim, Jung, Lee, Jin and Ahn2023a,Reference Kim, Kim, Park, Jeon and Chob). In § 3.2, a comparison with experimental results under the same flow conditions is made to examine fouling behaviours based on the influences of inter-particle potential and hydrodynamic stress in the respective structures.
Schematic pictures of confined flow channels correspond to (a) a T-shaped cross-flow channel and (b) a 4:1 contraction channel used in the particulate fouling simulations. The relative magnitude of translational velocity  $|{{{\boldsymbol{u}}^\infty }} |$ is indicated using RGB colouring, with maximum velocity represented by red and minimum velocity by blue. Additionally, finite element meshes that resolve background velocity moments are depicted as black lines.

In fouling simulations, this study configures a three-dimensional channel with periodic boundary conditions applied to the vorticity direction. However, the particles are input with the same vorticity coordinate to practically form a monolayer of clogs, allowing for the investigation of structural changes that occur over an extended period. Since it is expected that larger variations would occur in the velocity and velocity gradient directions rather than the width of the channel, the analysis of the particle dynamics is more focused on these two directions, aligning with the results of fluid visualization (Kim et al. Reference Kim, Jung, Lee and Ahn2022; Reference Kim, Jung, Lee, Jin and Ahn2023a,Reference Kim, Kim, Park, Jeon and Chob).
When obtaining solutions from the FEM part, we employed the commercial software COMSOL Multiphysics 4.2 as a fluid dynamics solver. After constructing the geometry, computational domains were discretized into physics-controlled meshes, as illustrated in figure 3. The cross-flow channel used 9619 elements, while the contraction channel used 2228 elements to resolve the background velocity moments. We have further conducted a convergence study on mesh refinement and delineated the results in table 1. Although it does not achieve complete convergence with the finest mesh offered by the software, it shows that the built-in physics-controlled meshing schemes already represent good performance relative to the finest one. Therefore, we chose the type-2 scheme from table 1 to compromise between accuracy and efficiency. Concerning the boundary conditions, a constant flow rate condition with a flow rate per unit width of  $70{a^2}/s$ was assumed at the inlet surface, where ${t_B} = 6{\rm \pi} \mu {a^3}/{k_B}T$ represents the characteristic time of a single colloidal particle. However, the zero static pressure condition is applied at the outlet, where the velocity is assigned based on a zero normal derivative across the boundary. This results in $u_{avg}^\infty = 1.167a/s$ at the inlet of the cross-flow channel and $u_{avg}^\infty = 0.875a/s$ at the contraction channel, with the radius of colloidal particles being $a = 1\;{\rm \mu}\mathrm{m}$. Given these average inlet velocities and physical parameters, including $\mu = 0.15\;\textrm{Pa} \cdot \textrm{s}$ which resembles the viscosity of the aqueous glycerol solution and system temperature $T = 300\;\textrm{K}$, the Péclet number of the colloidal particles $Pe = u_{avg}^\infty {t_B}/H$ corresponds to 13.28 for the cross-flow channel and 9.96 for the contraction channel, while H represents the height of the channel at the inlet.
Convergence test for average velocity at the inlet surface of the channel: (left) a T-shaped cross-flow channel and (right) a contraction channel. Relative velocity is calculated by normalizing each velocity measurement against the results from the finest discretization. The type of discretized mesh shown in boldface is depicted in figure 3.

3. Results and discussions
In this section, the accuracy of the methodology developed in § 2.1 is verified against previous studies in § 3.1. In § 3.2, case studies are conducted on a target system where the particle fouling phenomenon is primarily an issue to confirm the efficiency of the methodology. Specifically, in the validation section, the sedimentation velocity and diffusion coefficients of colloid particles are measured in the presence of confined geometry to assess how accurately the particle-wall scheme captures the motion of particles near the wall. Next, the stochastic self-diffusion coefficients of particles are examined by varying distances from the wall and particle concentration. Lastly, the computational efficiency introduced by the constrained formulation is explored by measuring processing time when the number of interior and wall particles are adjusted. In § 3.2, the particle dynamics is observed when attractive colloidal suspensions are transported in the case systems introduced in § 2.2. The observed fouling patterns are compared with the experimental studies with the same flow conditions in each confined geometry. Through these investigations, we will demonstrate how the Lagrangian formulation developed in this study can contribute to the understanding of particle dynamics in fouling phenomena using a unique and intrinsic approach rooted in the Lagrangian description.
3.1. Validations
The key concept of the methodology in this study is the utilization of imaginary wall particles and the construction of a constrained velocity formulation when incorporating confined geometry. Therefore, it was expected that the accuracy would inevitably decrease when measuring transport properties in confined geometry compared with the methods that consider an exact wall boundary using the geometry-reflected Green functions or the explicit solvent method. The primary objective of this section is to ascertain how closely the results obtained through the combination of FEM with constraint SD align with those from previous studies. The validations of the rheological properties, which reflect hydrodynamic interactions in an infinite suspension are available in Appendix B.
First, the transport properties of colloid particles in a parallel slit channel employing the excluded volume scheme are compared with previous studies using the fluctuating immersed boundary method (IBM) by Delong et al. (Reference Delong, Usabiaga, Buscalioni, Griffith and Donev2014) and a modified Green function by Swan & Brady (Reference Swan and Brady2011). In figure 4(a), the velocity of a single particle is depicted when placed at a distance h from the channel wall, and subjected to an external force  ${\boldsymbol{F}}$ in parallel and perpendicular directions to the wall. The gap between the parallel walls was $h/a = 32$, and the values were measured from $h/a = 0$, where the particles come into contact with the target boundary, up to $h/a = 13$, where the mobility becomes nearly constant. The mobility obtained through (2.26) to (2.29) shows qualitatively similar behaviour to the fluctuating IBM by Delong et al. (Reference Delong, Usabiaga, Buscalioni, Griffith and Donev2014) that reflects a flat geometry, but quantitatively, systematic deviations are observed, especially in the contact range with the wall. Though the particle-wall scheme aimed to simulate point forces on the surface of the wall by placing imaginary particles, as the spherical particles cannot tessellate the flat surface, the simulated wall boundary practically exhibits porous, bumpy characteristics, leading to deviations from the result that accurately reflects the topology of a flat wall. The effect of the averaged mobility over the surface parallel to the target boundary due to the bumpy wall is manifested as inconsistent changes in mobility observed at $h/a < 2$. Results from BD are also plotted for reference, which is the free-draining simulation without HI.
(a) Mobility of a single sphere inside a slit channel in the directions parallel (blue) and perpendicular (green) to the no-slip wall as a function of the distance from the wall. Mobility results from the fluctuating IBM by Delong et al. (Reference Delong, Usabiaga, Buscalioni, Griffith and Donev2014) and BD simulation are also plotted for comparison purposes. (b) The sedimentation velocity of spherical particles residing on a square lattice falling parallel to the channel walls. The velocities for square lattices, with lattice dimension L, residing in the middle of the channel, are compared with the results of Swan & Brady (Reference Swan and Brady2011) who used a corrected form of Green's function in a parallel channel.

In figure 4(b), the sedimentation velocity of the particles arranged at square lattice points on the central plane of the channel is measured when subjected to an external force. The gap between parallel walls H and the spacing of the lattice array L are prescribed in dimensionless units with respect to the particle radius. This example aims to investigate the rationality of the particle-wall scheme based on the number density of suspended particles. The sedimentation velocities obtained through (2.26) to (2.29) show reduced deviations when compared with the results obtained from the simulations that reflect flat wall geometry through the modified Green function by Swan & Brady (Reference Swan and Brady2011). This decrease in deviation is more pronounced when referencing figure 4(a). As suggested by Swan & Brady (Reference Swan and Brady2011) in the phase diagram considering the dynamical behaviour of the particles, the hydrodynamic influence of the wall decreases significantly as the concentration of suspended particles increases. Furthermore, as the gap between parallel walls increases, the influence of the wall on the sedimentation velocity of particles also decreases. Therefore, the smaller gap, the larger deviation, and vice versa. Therefore, although our study does not reproduce results that reflect flat geometry precisely, it is able to reproduce more accurate results, especially when the suspension is confined by a wall with a large gap or the concentration of particles is high.
Next, we measure the short-time self-diffusivity of a single colloid particle in a slit channel. The short-time self-diffusivity, defined by mean square displacement, is given as follows:
 \begin{equation}{D_S} = \mathop {\lim }\limits_{t \to 0} \frac{1}{2}\frac{\textrm{d}}{{\textrm{d}t}}\langle {\boldsymbol{x}}(t)\boldsymbol{\cdot }{\boldsymbol{x}}(t)\rangle .\end{equation}
 According to the fluctuation-dissipation theorem, the short-time self-diffusivity represents the instantaneous velocity a particle acquires due to a force proportional to thermal energy  $kT$. To illustrate both situations in which a particle approaches the channel wall and diffuses in the main flow direction, we measure short-time self-diffusivity in both parallel and perpendicular directions to the wall. Additionally, the results obtained at various volume fractions are plotted in figure 5 to investigate the changes in accuracy as the particles continuously enter the channel. Compared with the results of Swan & Brady (Reference Swan and Brady2011), relatively high accuracy at a volume fraction of 0.40 is observed, while significant deviation becomes apparent as the volume fraction decreases to 0.10. Furthermore, when the volume fraction is 0.25 or higher, the diffusivity in the direction perpendicular to the wall consistently shows lower values than that in the horizontal direction, whereas at a volume fraction of 0.10, the diffusivity in both directions tend to be comparable, especially at the centre of the channel. The increase in accuracy at higher volume fraction is due to the interaction between the interior particles, which shield the wall effect, as observed in deterministic results. The lower accuracy observed at lower volume fractions, even larger than the deterministic results, indicates the challenges of accurately simulating the diffusion of particles towards the wall due to thermal motion during the early stage of fouling. However, as can be observed in the upcoming case study in the next section, the primary role in particle fouling, involving the creation and destruction of clogs, is played by the hydrodynamic stress which is orders of magnitude larger than the Brownian stress. Therefore, when studying the kinetics of particle deposition on a clean surface, more accurate methods, such as molecular dynamics or the method of reflection, should be considered, but short-time self-diffusivity does not have a decisive impact on the overall pattern when observed over a long period of time.
Short-time self-diffusion coefficients of a single particle between a parallel slit channel with channel gap  $H/a = 6$. The scattered data points are obtained from the constrained SD, and the scatter-line plots are reproduced from the results of Swan & Brady (Reference Swan and Brady2011), who used a modified Green function in ASD simulation.

The final test is the efficiency of the constrained SD formulation. This is accomplished by measuring the processing time, or wall time, for a single time step of simulation when applying the constrained formulation to both conventional SD and ASD schemes. It is assumed that the number of  ${N^I}$ interior particles, which undergo Brownian motion, is randomly dispersed with a volume fraction of 0.2, and there are no inter-particle non-hydrodynamic interactions. The number of ${N^W}$ particles constrained to have a velocity of 0 is varied, and the ratio of the particles subjected to this constraint is adjusted to 0 %, 90 % and 99 %. The total number of $N = {N^W} + {N^I}$ particles ranges from 102 to 104.
Given that structural changes in colloidal particles occur over very long times in low-Reynolds-number conditions, the required total time steps during simulation can become much larger than a million. Therefore, if the wall time exceeds 1 s, the corresponding system may not be suitable for practical applications. When examining the data points in figure 6, it appears that conventional SD without constrained particles  ${N^I}/N = 1$ satisfies this time condition for up to 102 particles. The time complexity of conventional SD was $O({N^{1.99}})$, indicating that the critical step determining the processing time was the construction of the mobility matrix rather than matrix inversion. This is likely attributed to the utilization of LAPACK (Linear Algebra PACKage) built-in functions, which make use of multiple threads from our Intel Xeon Gold 6246R Processor CPU for matrix calculations under the default settings. Significant improvements in wall time are observed when the constrained formulation is applied, resulting in a reduction in wall time by more than an order of magnitude, while keeping the time complexity unchanged. In other words, the constrained formulation enables efficient calculations with conventional SD for up to 103 particles, notably alleviating the known speed limitations of the conventional SD framework. In the case of ASD, it exhibits a scaling performance indicated by $O({N^{1.15}})$. The cost reduction achieved through the constraint formulation is not as pronounced as in conventional SD, being just slightly less than half an order. This is primarily because, as shown in (2.47), the force moments of wall particles are regressed every time step, even though it is unnecessary for obtaining the trajectory of interior particles. Consequently, even with an increased ratio of particles subjected to velocity constraints, the dimension of the force vector remains unchanged. However, as illustrated in figure 6, the constrained formulation extends the practical applicability of ASD, accommodating a total number of 103 to 104 particles within its framework. However, employing the fast Stokesian dynamics framework outlined in Appendix A could further reduce the size of the regression vector, contingent upon the ratio of wall particles. This, in turn, could yield additional enhancements in speed, a topic that may be explored in future work.
The average wall time for randomly dispersed particles at a volume fraction of 0.2 under shear rate  $Pe = 1$. In each dataset, the particles with a ratio of ${N^I}/N = 1$ (red), ${N^I}/N = 0.1$ (green) and ${N^I}/N = 0.01$ (purple) are free to move, while the others are subject to velocity constraints. The scatter and line plots depict the results of constrained SD, while the scatter and dashed line plots represent the results of constrained ASD.

In this section, we examined how well the colloid dispersion simulated by constrained SD reproduces the transport properties in confined geometries. As a result, we confirmed that more accurate results are obtained when there is a larger number of particles, and when the particles interact with each other rather than directly interacting with a bumpy wall. Summarizing this relationship between time complexity and the characteristics of Lagrangian simulation, our methodology has the advantage in speed when the number of particles is low, while it has the advantage in accuracy when the number of particles is high. In the next section, we will conduct simulations in more complex geometries and explain the mechanism of particle fouling using a Lagrangian perspective on the scale of particle dynamics.
3.2. Case study: particulate fouling in a T-shaped cross-flow and contraction channel
When an attractive colloidal suspension is transported through a channel, some particles diffuse towards the channel wall through Brownian random motion and adhere to it by wall–particle interactions. However, particle adhesion to the wall is often temporary. When the attractive force between an adsorbed particle and the aggregate in the main flow exceeds the force between the particle and the wall, these particles can detach from the wall and exhibit resuspension behaviour. Consequently, comprehending the dynamic growth of clogs necessitates prolonged observation periods. To characterize this temporal evolution, the pressure drop and areal fraction within a channel is quantified, which can be served as an indicator that reveals critical moments during the evolution of fouling patterns. The channel pressure drop is calculated by adding the hydrodynamic force received by the imaginary wall to the pressure drop of the pure fluid  $\Delta P = \Delta {P_{fluid}} + \Delta {P_{particle}}$. While the microscopic balance on the interior particles is satisfied by the governing equation given in (2.1), the pressure gradient is established through an overall momentum balance for wall particles $\mathrm{\Delta }{P_{particle}} = {n_w}\langle {{\boldsymbol{F}}^W}\rangle$, as presented by Nott & Brady (Reference Nott and Brady1994), where ${n_w}$ is the number density of the wall particles. Up to the point of channel blockage, the simulation snapshots are compared with experimental images captured using an inverted microscope at similar fouling stages. The experimental data are derived from the studies conducted by Kim et al. (Reference Kim, Jung, Lee and Ahn2022, Reference Kim, Jung, Lee, Jin and Ahn2023a,Reference Kim, Kim, Park, Jeon and Chob), using non-reactive polystyrene particles dispersed in a glycerol solution, which exhibits Newtonian behaviour. Although our simulations employ the same dimensionless flow conditions as the experiments, not all the conditions are identical, including the conversion of volume fraction of the particles to areal fraction and the modelling scheme for inter-particle potential. In our simulations, a Newtonian suspension containing an areal fraction of 0.1 no-slip particles is employed. Particle inputs have been randomized by the Monte Carlo algorithm in a way that the locations with high inlet velocity have a higher chance of particle inflow. The inter-particle potential is modelled as the Morse potential, in contrast to experiments in which attractive particles were modelled to have an infinite well depth using the DLVO potential.
The first case study is conducted in the T-shaped cross-flow channel, where the macroscopic properties are illustrated over time in figure 7. Microscopic snapshots and corresponding experimental images are presented in figure 8. The individual particles in the channel are coloured in RGB according to the magnitude of the applied hydrodynamic stress. For the inter-particle interactions, the Morse potential with attraction coefficient  $\kappa a = 5$ is employed, while well depth is set to ${V_0}/6{\rm \pi} \mu u_{avg}^\infty {a^2} = 10$.
(a) The pressure drop inside the main (red) and side channels (purple) over time, and (b) the areal fractions inside the main (solid line) and side channel (dotted line) when  ${V_0}/6{\rm \pi} \mu u_{avg}^\infty {a^2} = 10$ and $\kappa a = 5$.

Particle snapshots from the simulation (left) and the images from experiments (right) within the crossflow channel when  ${V_0}/6{\rm \pi} \mu u_{avg}^\infty {a^2} = 10$ and $\kappa a = 5$. In the simulation, the particles are RGB coloured to represent the amount of hydrodynamic stress applied on them.

Leveraging the advantages of the Lagrangian approach, the stress distribution within the channel can be analysed, revealing distinct behaviours of particles depending on their positions within the channel. The particles forming clogs that adhere to the wall of the main channel do not develop into relatively large structures, even when subjected to relatively weak hydrodynamic stress. This repeated deposition and resuspension are reflected in the continuous pressure drop fluctuations illustrated in figure 7(a). However, the clogs formed at locations where the main stream and side stream meet experience stress in the perpendicular direction to the channel wall, leading to their compression and solidification. The simulation and experimental snapshots exhibit similar shapes of protruding particle clogs formed in the same region. As more particles accumulate on the clogs and channel wall, flow blockage occurs at point  $t/(6{\rm \pi} \mu {a^3}/{k_B}T) = 2450$. Still, this blockage was temporary due to the strong hydrodynamic stress within the clog. The accumulated stress inside the cluster at time $t/(6{\rm \pi} \mu {a^3}/{k_B}T) = 2450$ was higher than ${\boldsymbol{S}}_{xy}^I = 800{k_B}T/{a^3}$, which deforms the cluster in the direction of velocity, rendering the cluster unstable and ultimately leading to its subsequent breakup. Conversely, as observed at time $t/(6{\rm \pi} \mu {a^3}/{k_B}T) = 2869$, if the hydrodynamic stress within the clog is weak, the clog remains stable with minimal deformation, ultimately resulting in the permanent blockage of the channel. This complete blockage of the channel is related to the sudden increase in areal fraction inside the side channel which is depicted in figure 7(b). In summary, the compression at the junction of the main and side channels, followed by an influx into the entrance of the side channel with low hydrodynamic stress, leads to clogging in the cross-flow channel.
The next case study is conducted in the two separate contraction channels, with only the magnitude of attraction varied by the well depth parameter  ${V_0}/6{\rm \pi} \mu u_{avg}^\infty {a^2}$. In the case which uses more attractive particles, where ${V_0}/6{\rm \pi} \mu u_{avg}^\infty {a^2}$ is set to 10, the macroscopic properties over time are presented in figure 9. Microscopic snapshots and corresponding experimental images can be found in figure 10. For the case using weakly attractive particles, where ${V_0}/6{\rm \pi} \mu u_{avg}^\infty {a^2}$ is set to 2, the macroscopic properties over time are plotted in figure 11, with microscopic snapshots and corresponding experimental images shown in figure 12.
(a) The pressure drop and (b) areal fraction inside the contraction channel over time when  ${V_0}/6{\rm \pi} \mu u_{avg}^\infty {a^2} = 10$ and $\kappa a = 5$.

Particle snapshots from the simulation (left) and images from experiments (right) within the contraction channel when  ${V_0}/6{\rm \pi} \mu u_{avg}^\infty {a^2} = 10$ and $\kappa a = 5$. In the simulation, the particles are RGB coloured to represent the amount of hydrodynamic stress applied on them.

(a) The pressure drop and (b) areal fraction inside the contraction channel over time when  ${V_0}/6{\rm \pi} \mu u_{avg}^\infty {a^2} = 2$ and $\kappa a = 5$.

Particle snapshots from the simulation (left) and images from experiments (right) within the contraction channel when  ${V_0}/6{\rm \pi} \mu u_{avg}^\infty {a^2} = 2$ and $\kappa a = 5$. In the simulation, the particles are RGB coloured to represent the amount of hydrodynamic stress applied on them.

In figure 10, the particles predominantly deposit at the entrance of the contraction due to strong attractive interactions. However, in figure 12, the particles predominantly deposit on the channel wall after passing through the contraction. The significant difference in pressure changes between these two conditions also indicates that the clogging pattern, triggered by the difference in particle property, which is the magnitude of inter-particle attraction, has a substantial effect on the flow history.
In the early stages of fouling, both simulations exhibit a similar pattern, as shown in figures 10(a) and 12(a). During this phase, occasional particle contact occurs at the edge of the contraction entrance. Only the particles with strong attractive forces remain in contact and resist resuspension. Subsequent depositions in this area, as illustrated in figure 10(b), increase the available surface area and, consequently, the likelihood of further particle contacts. However, these clogs are not immune to partial breakup and ongoing deposition, resulting in pressure fluctuations observed in figure 9(a). The continuous deposition has secondary effects, as shown in figure 10(c), where the velocity of particles and agglomerates is reduced near the wall due to the clogs formed earlier. This leads to agglomerates depositing on the side wall of the main channel. As seen in figure 10(d), the hydrodynamic stress on these clogs is very low, allowing these agglomerates to form permanent deposits.
Subsequently, a more detailed investigation is carried out to understand the behaviour of deposited particles in weakly attractive suspensions after passing through the contraction channel. Initially, the particles tend to form a single-layer deposit, causing the channel to be narrow. Although the narrowed channel increases the chances of particles coming into contact with the contraction wall, abrupt channel blockage is not observed due to the high hydrodynamic stress on the particles, as indicated in the legend in figure 12. As the single-particle deposit accumulates, it grows beyond a double layer and merges with clusters that form when multiple particles pass through the narrowed channel simultaneously, ultimately leading to clogging. An intriguing observation is that when analysing the stress distribution within the clog structure during clogging, the highest stress is concentrated at the clog edges, rather than at the centre of the channel or on the wall particles, as shown in figure 12(c). Consequently, the deformation is primarily localized in this area, and during channel reopening, only the edges of the clog collapse, while the rest remains in the form of aggregates until exiting the channel. It is also noteworthy that the hydrodynamic stress on the channel wall at the moment of clogging is rather evenly distributed throughout the channel.
However, in contrast to the side stream in the T-shaped cross-flow channel, permanent blockage does not occur in the one-way contraction channel. The constant flow rate provided at the inlet, continuously delivering fluid and particles, occasionally leads to the reopening of the channel due to the influence of strong hydrodynamic pressure. This, in turn, results in notable fluctuations in pressure drop and areal fraction, as evident in figure 11. In the context of fouling, which reaches a clogging limit, the particle cakes obstruct fluid flow, causing a reduction in velocity. Therefore, the Lagrangian description of colloid particles provides a more intrinsic understanding of the structure formation and breakup dynamics of fouling, complementing the insights gained from Eulerian approaches. Additionally, the Lagrangian description can be used to analyse alterations in fluid flow for interpreting fouling dynamics, which will be elaborated in the subsequent work.
In this section, we explained the deposition dynamics within a confined channel using the Lagrangian formulation developed in § 2. Consequently, we were able to harness the advantages of the Lagrangian approach, which enables efficient modelling that scales proportionally with the number of particles. This greatly facilitates the observation of particle dynamics over extended time periods. In previous fouling studies, the focus was primarily on explaining particle dynamics, clog break-up and clogging, with a predominant emphasis on fluid flow. Nonetheless, inferring the characteristics of clogs and forecasting their future behaviour based on the internal stress distribution within the fluid perspective proved to be a challenging task. This challenge was primarily due to the presence of the no-slip condition, which resulted in a reduction of fluid velocity around the clogs. This reduction made it difficult to describe structural changes or break-up within the clogs using fluid kinetics as the sole tool. However, when we analysed fouling dynamics from a particle-centred perspective, a more fundamental and comprehensive approach became feasible. This approach allowed for a detailed examination of agglomerate collapse and the underlying factors contributing to clog formation. Moreover, even for agglomerates with identical structures, stress distribution could vary significantly based on their location within the channel. In such scenarios, the Lagrangian description clarified clog properties and revealed their preferred locations. Predicting the changes based on the stress direction provided an efficient and thorough approach to fouling prevention, thus highlighting one of the key advantages of the Lagrangian method. Furthermore, our simulation retains the capability to analyse fluid properties, similar to the Euler-based framework, by updating fluid velocity at any desired points within the system before applying Faxen's law. In summary, our simulation underscores the importance of particle-centric analysis in understanding deposition kinetics, and presents a more efficient and direct approach to addressing clogging issues.
4. Conclusion
In this study, we have proposed a new simulation scheme that combines FEM and SD to observe the transport of colloid suspensions within confined microchannels. The proposed simulation method offers advantages in efficiency even when dealing with situations where particle spacing is narrow or particle concentration is high, achieved by evaluating velocity disturbances caused by the given force field only at the centre of the particle, in contrast to the Eulerian framework, which computes velocity distributions at all mesh points. Consequently, this methodology enables the exploration of transport properties from the influx of particles into a channel to the formation of particle structures over extended periods of time. The geometry of the confined channel is emulated using a particle wall scheme. This approach enhances efficiency through the application of a constrained formulation and leverages the computational advantage of using the same form of Green's function used for interior particles. However, the inherent roughness of the emulated wall sacrifices a certain degree of accuracy when the distance between the wall and particles is small. Nonetheless, as the particle concentration increases, this effect is masked, resulting in enhanced accuracy. Additionally, the precise modelling of near-field lubrication allows our simulation method to offer a competitive approach to analysing clogging dynamics with particles in close proximity.
Traditional simulations focused more on the flow of surrounding fluid rather than the mechanics of particles in deposition studies. Our simulation, however, allows to interpret the deposition dynamics from the perspective of particles by considering the hydrodynamic stress and forces experienced by the particles. This approach enables to quantitatively measure the point at which a certain level of hydrodynamic stress causes structural collapse or deformation within a specific cake structure, or when channel blocking occurs. Importantly, this method offers a quantitative way to measure these phenomena. Notably, the focus on particles does not compromise the information regarding the fluid, allowing us to obtain information about velocity disturbances from a fluid-centred perspective similar to conventional Eulerian-based simulations. In conclusion, this study not only proposes a more efficient simulation method for studying deposition dynamics but also introduces a new paradigm for interpreting deposition dynamics from a particle-centred perspective.
Funding
This work was supported by the National Research Foundation of Korea (NRF) grant funded by the Korea government (MSIT) (No. NRF-2018R1A5A1024127).
Declaration of interests
The authors report no conflict of interest.
Appendix A. Saddle point formulation of particulate flow with velocity constraint
It was reported by Fiore & Swan (Reference Fiore and Swan2019) that the general SD-based approach can be reformulated as follows to use the property of saddle point matrix on matrix inversion:
 \begin{align}&\left[
{\begin{array}{@{}cc@{}} {{{\mathcal{M}}^\infty
}}&{\mathcal{B}}\\ {{{\mathcal{B}}^T}}&{ - \left[
{\begin{array}{@{}cc@{}}
{{{\boldsymbol{R}}_{FU,nf}}}& \ {{{\boldsymbol{R}}_{F\varOmega
,nf}}}\\
{{{\boldsymbol{R}}_{TU,nf}}}& \ {{{\boldsymbol{R}}_{T\varOmega
,nf}}} \end{array}} \right]} \end{array}}
\right]\boldsymbol{\cdot }\left[ {\begin{array}{*{20}{@{}c@{}}}
{\left[ {\begin{array}{@{}c@{}}
{{{\boldsymbol{F}}_{ff}}}\\ {{{\boldsymbol{T}}_{ff}}}\\
{{{\boldsymbol{S}}_{ff}}} \end{array}} \right]}\\ {\left[
{\begin{array}{@{}c@{}} {{\boldsymbol{U}} -
{{\boldsymbol{U}}^\infty }}\\ {{\boldsymbol{\omega} } -
{{\boldsymbol{\varOmega} }^\infty }} \end{array}} \right]}
\end{array}} \right]\nonumber\\ &\quad = \left[ {\begin{array}{*{20}{@{}c@{}}}
{\left[ {\begin{array}{@{}c@{}} {\textbf{0}}\\
{{{\boldsymbol{E}}^\infty }} \end{array}} \right]}\\ { -
\left[ {\begin{array}{@{}c@{}} {{{\boldsymbol{F}}^P} +
{{\boldsymbol{R}}_{FE,nf}}\,\textrm{:}\,{{\boldsymbol{E}}^\infty
} + {{\boldsymbol{F}}^B}}\\ {{{\boldsymbol{F}}^P} +
{{\boldsymbol{R}}_{TE,nf}}\,\textrm{:}\,{{\boldsymbol{E}}^\infty
} + {{\boldsymbol{F}}^B}} \end{array}} \right]}
\end{array}}
\right].\end{align}
\begin{align}&\left[
{\begin{array}{@{}cc@{}} {{{\mathcal{M}}^\infty
}}&{\mathcal{B}}\\ {{{\mathcal{B}}^T}}&{ - \left[
{\begin{array}{@{}cc@{}}
{{{\boldsymbol{R}}_{FU,nf}}}& \ {{{\boldsymbol{R}}_{F\varOmega
,nf}}}\\
{{{\boldsymbol{R}}_{TU,nf}}}& \ {{{\boldsymbol{R}}_{T\varOmega
,nf}}} \end{array}} \right]} \end{array}}
\right]\boldsymbol{\cdot }\left[ {\begin{array}{*{20}{@{}c@{}}}
{\left[ {\begin{array}{@{}c@{}}
{{{\boldsymbol{F}}_{ff}}}\\ {{{\boldsymbol{T}}_{ff}}}\\
{{{\boldsymbol{S}}_{ff}}} \end{array}} \right]}\\ {\left[
{\begin{array}{@{}c@{}} {{\boldsymbol{U}} -
{{\boldsymbol{U}}^\infty }}\\ {{\boldsymbol{\omega} } -
{{\boldsymbol{\varOmega} }^\infty }} \end{array}} \right]}
\end{array}} \right]\nonumber\\ &\quad = \left[ {\begin{array}{*{20}{@{}c@{}}}
{\left[ {\begin{array}{@{}c@{}} {\textbf{0}}\\
{{{\boldsymbol{E}}^\infty }} \end{array}} \right]}\\ { -
\left[ {\begin{array}{@{}c@{}} {{{\boldsymbol{F}}^P} +
{{\boldsymbol{R}}_{FE,nf}}\,\textrm{:}\,{{\boldsymbol{E}}^\infty
} + {{\boldsymbol{F}}^B}}\\ {{{\boldsymbol{F}}^P} +
{{\boldsymbol{R}}_{TE,nf}}\,\textrm{:}\,{{\boldsymbol{E}}^\infty
} + {{\boldsymbol{F}}^B}} \end{array}} \right]}
\end{array}}
\right].\end{align} This arises from the property that the Schur complement of the upper left block  ${\mathcal{S}}$ in the saddle point matrix in (A1) coincides with the grand resistance matrix:
 \begin{equation}{\mathcal{S}} ={-}
\left( {{{\mathcal{B}}^T} \cdot {{({{\mathcal{M}}^\infty
})}^{ - 1}} \cdot {\mathcal{B}} + \left[
{\begin{array}{@{}cc@{}}
{{{\boldsymbol{R}}_{FU,nf}}}&{{{\boldsymbol{R}}_{F\varOmega
,nf}}}\\
{{{\boldsymbol{R}}_{TU,nf}}}&{{{\boldsymbol{R}}_{T\varOmega
,nf}}} \end{array}} \right]} \right) ={-} \left[
{\begin{array}{@{}cc@{}}
{{{\boldsymbol{R}}_{FU}}}&{{{\boldsymbol{R}}_{F\varOmega }}}\\
{{{\boldsymbol{R}}_{TU}}}&{{{\boldsymbol{R}}_{T\varOmega }}}
\end{array}}
\right].\end{equation}
\begin{equation}{\mathcal{S}} ={-}
\left( {{{\mathcal{B}}^T} \cdot {{({{\mathcal{M}}^\infty
})}^{ - 1}} \cdot {\mathcal{B}} + \left[
{\begin{array}{@{}cc@{}}
{{{\boldsymbol{R}}_{FU,nf}}}&{{{\boldsymbol{R}}_{F\varOmega
,nf}}}\\
{{{\boldsymbol{R}}_{TU,nf}}}&{{{\boldsymbol{R}}_{T\varOmega
,nf}}} \end{array}} \right]} \right) ={-} \left[
{\begin{array}{@{}cc@{}}
{{{\boldsymbol{R}}_{FU}}}&{{{\boldsymbol{R}}_{F\varOmega }}}\\
{{{\boldsymbol{R}}_{TU}}}&{{{\boldsymbol{R}}_{T\varOmega }}}
\end{array}}
\right].\end{equation} Meanwhile, projection matrices  ${\mathcal{B}}$ and ${{\mathcal{B}}^T}$ possess the following properties:
 \begin{equation}\left[ {\begin{array}{@{}c@{}} {\boldsymbol{U}}\\ {\textbf{0}} \end{array}} \right] = {\mathcal{B}}\boldsymbol{\cdot }{\boldsymbol{U}},\quad {\boldsymbol{F}} = {{\mathcal{B}}^T}\boldsymbol{\cdot }\left[ {\begin{array}{@{}c@{}} {\boldsymbol{F}}\\ {\boldsymbol{S}} \end{array}} \right].\end{equation}
In this case, if particles are divided into two groups, interior particles and wall particles, (A1) can be explicitly written as follows:
 \begin{align}&\left[
{\begin{array}{@{}cc@{}}
{{{\mathcal{M}}^\infty }}&{\mathcal{B}}\\
{{{\mathcal{B}}^T}}&{ - \left[{\begin{array}{@{}cccc@{}}
{{\boldsymbol{R}}_{FU,nf}^{II}}& \ {{\boldsymbol{R}}_{FU,nf}^{IW}}& \ {{\boldsymbol{R}}_{F\varOmega
,nf}^{II}}&{{\boldsymbol{R}}_{F\varOmega ,nf}^{IW}}\\
{{\boldsymbol{R}}_{FU,nf}^{WI}}& \ {{\boldsymbol{R}}_{FU,nf}^{WW}}& \ {{\boldsymbol{R}}_{F\varOmega
,nf}^{WI}}&{{\boldsymbol{R}}_{F\varOmega ,nf}^{WW}}\\
{{\boldsymbol{R}}_{TU,nf}^{II}}& \ {{\boldsymbol{R}}_{TU,nf}^{IW}}& \ {{\boldsymbol{R}}_{T\varOmega
,nf}^{II}}&{{\boldsymbol{R}}_{T\varOmega ,nf}^{IW}}\\
{{\boldsymbol{R}}_{TU,nf}^{WI}}& \ {{\boldsymbol{R}}_{TU,nf}^{WW}}& \ {{\boldsymbol{R}}_{T\varOmega
,nf}^{WI}}&{{\boldsymbol{R}}_{T\varOmega ,nf}^{WW}}
\end{array}} \right]} \end{array}} \right]\boldsymbol{\cdot
}\left[ {\begin{array}{*{20}{@{}c@{}}} {\left[
{\begin{array}{*{20}{@{}c@{}}} {{\boldsymbol{F}}_{ff}^I}\\
{{\boldsymbol{F}}_{ff}^W}\\ {{\boldsymbol{T}}_{ff}^I}\\
{{\boldsymbol{T}}_{ff}^W}\\ {{\boldsymbol{S}}_{ff}^I}\\
{{\boldsymbol{S}}_{ff}^W} \end{array}} \right]}\\ {\left[
{\begin{array}{@{}c@{}} {{{\boldsymbol{U}}^I} -
{{\boldsymbol{U}}^\infty }}\\ {{{\boldsymbol{U}}^W} -
{{\boldsymbol{U}}^\infty }}\\ {{{\boldsymbol{\omega} }^I} -
{{\boldsymbol{\varOmega} }^\infty }}\\ {{{\boldsymbol{\omega}
}^W} - {{\boldsymbol{\varOmega} }^\infty }} \end{array}}
\right]} \end{array}} \right]\nonumber\\ &\quad = \left[
{\begin{array}{*{20}{@{}c@{}}} {\left[ {\begin{array}{*{20}{@{}c@{}}}
{\textbf{0}}\\ {{{\boldsymbol{E}}^\infty }} \end{array}}
\right]}\\ { - \left[ {\begin{array}{@{}c@{}}
{{{\boldsymbol{F}}^P} + ({\boldsymbol{R}}_{FE,nf}^{II} +
{\boldsymbol{R}}_{FE,nf}^{IW})\,\textrm{:}\,{{\boldsymbol{E}}^\infty
} + {{\boldsymbol{F}}^B}}\\ {{{\boldsymbol{F}}^P} +
({\boldsymbol{R}}_{FE,nf}^{WI} +
{\boldsymbol{R}}_{FE,nf}^{WW})\,\textrm{:}\,{{\boldsymbol{E}}^\infty
}}\\ {({\boldsymbol{R}}_{TE,nf}^{II} +
{\boldsymbol{R}}_{TE,nf}^{IW})\,\textrm{:}\,{{\boldsymbol{E}}^\infty
} + {{\boldsymbol{F}}^B}}\\ {({\boldsymbol{R}}_{TE,nf}^{WI}
+
{\boldsymbol{R}}_{TE,nf}^{WW})\,\textrm{:}\,{{\boldsymbol{E}}^\infty
}} \end{array}} \right]} \end{array}}
\right].\end{align}
\begin{align}&\left[
{\begin{array}{@{}cc@{}}
{{{\mathcal{M}}^\infty }}&{\mathcal{B}}\\
{{{\mathcal{B}}^T}}&{ - \left[{\begin{array}{@{}cccc@{}}
{{\boldsymbol{R}}_{FU,nf}^{II}}& \ {{\boldsymbol{R}}_{FU,nf}^{IW}}& \ {{\boldsymbol{R}}_{F\varOmega
,nf}^{II}}&{{\boldsymbol{R}}_{F\varOmega ,nf}^{IW}}\\
{{\boldsymbol{R}}_{FU,nf}^{WI}}& \ {{\boldsymbol{R}}_{FU,nf}^{WW}}& \ {{\boldsymbol{R}}_{F\varOmega
,nf}^{WI}}&{{\boldsymbol{R}}_{F\varOmega ,nf}^{WW}}\\
{{\boldsymbol{R}}_{TU,nf}^{II}}& \ {{\boldsymbol{R}}_{TU,nf}^{IW}}& \ {{\boldsymbol{R}}_{T\varOmega
,nf}^{II}}&{{\boldsymbol{R}}_{T\varOmega ,nf}^{IW}}\\
{{\boldsymbol{R}}_{TU,nf}^{WI}}& \ {{\boldsymbol{R}}_{TU,nf}^{WW}}& \ {{\boldsymbol{R}}_{T\varOmega
,nf}^{WI}}&{{\boldsymbol{R}}_{T\varOmega ,nf}^{WW}}
\end{array}} \right]} \end{array}} \right]\boldsymbol{\cdot
}\left[ {\begin{array}{*{20}{@{}c@{}}} {\left[
{\begin{array}{*{20}{@{}c@{}}} {{\boldsymbol{F}}_{ff}^I}\\
{{\boldsymbol{F}}_{ff}^W}\\ {{\boldsymbol{T}}_{ff}^I}\\
{{\boldsymbol{T}}_{ff}^W}\\ {{\boldsymbol{S}}_{ff}^I}\\
{{\boldsymbol{S}}_{ff}^W} \end{array}} \right]}\\ {\left[
{\begin{array}{@{}c@{}} {{{\boldsymbol{U}}^I} -
{{\boldsymbol{U}}^\infty }}\\ {{{\boldsymbol{U}}^W} -
{{\boldsymbol{U}}^\infty }}\\ {{{\boldsymbol{\omega} }^I} -
{{\boldsymbol{\varOmega} }^\infty }}\\ {{{\boldsymbol{\omega}
}^W} - {{\boldsymbol{\varOmega} }^\infty }} \end{array}}
\right]} \end{array}} \right]\nonumber\\ &\quad = \left[
{\begin{array}{*{20}{@{}c@{}}} {\left[ {\begin{array}{*{20}{@{}c@{}}}
{\textbf{0}}\\ {{{\boldsymbol{E}}^\infty }} \end{array}}
\right]}\\ { - \left[ {\begin{array}{@{}c@{}}
{{{\boldsymbol{F}}^P} + ({\boldsymbol{R}}_{FE,nf}^{II} +
{\boldsymbol{R}}_{FE,nf}^{IW})\,\textrm{:}\,{{\boldsymbol{E}}^\infty
} + {{\boldsymbol{F}}^B}}\\ {{{\boldsymbol{F}}^P} +
({\boldsymbol{R}}_{FE,nf}^{WI} +
{\boldsymbol{R}}_{FE,nf}^{WW})\,\textrm{:}\,{{\boldsymbol{E}}^\infty
}}\\ {({\boldsymbol{R}}_{TE,nf}^{II} +
{\boldsymbol{R}}_{TE,nf}^{IW})\,\textrm{:}\,{{\boldsymbol{E}}^\infty
} + {{\boldsymbol{F}}^B}}\\ {({\boldsymbol{R}}_{TE,nf}^{WI}
+
{\boldsymbol{R}}_{TE,nf}^{WW})\,\textrm{:}\,{{\boldsymbol{E}}^\infty
}} \end{array}} \right]} \end{array}}
\right].\end{align} However, the translational velocity  ${{\boldsymbol{U}}^W}$ and rotational velocity ${{\boldsymbol{\omega} }^W}$ of wall particles are predetermined value before the regression. Therefore, when applying the velocity constraint in this case, the far-field force and torque on interior particles can be written as
 \begin{align}
{\textbf{0}} & = {\boldsymbol{F}}_{ff}^I -
{\boldsymbol{R}}_{FU,nf}^{II}\boldsymbol{\cdot
}({{\boldsymbol{u}}^I} - {{\boldsymbol{U}}^\infty }) +
{\boldsymbol{R}}_{FU,nf}^{IW}\boldsymbol{\cdot
}{{\boldsymbol{U}}^\infty } - {\boldsymbol{R}}_{F\varOmega
,nf}^{II}\boldsymbol{\cdot }({{\boldsymbol{\omega} }^I} -
{{\boldsymbol{\varOmega} }^\infty }) +
{\boldsymbol{R}}_{F\varOmega ,nf}^{IW}\boldsymbol{\cdot
}{{\boldsymbol{\varOmega} }^\infty }\nonumber\\ & \quad +
({\boldsymbol{R}}_{FE,nf}^{II} +
{\boldsymbol{R}}_{FE,nf}^{IW})\boldsymbol{\cdot
}{{\boldsymbol{E}}^\infty } + {{\boldsymbol{F}}^P} +
{{\boldsymbol{F}}^B},
\end{align}
\begin{align}
{\textbf{0}} & = {\boldsymbol{F}}_{ff}^I -
{\boldsymbol{R}}_{FU,nf}^{II}\boldsymbol{\cdot
}({{\boldsymbol{u}}^I} - {{\boldsymbol{U}}^\infty }) +
{\boldsymbol{R}}_{FU,nf}^{IW}\boldsymbol{\cdot
}{{\boldsymbol{U}}^\infty } - {\boldsymbol{R}}_{F\varOmega
,nf}^{II}\boldsymbol{\cdot }({{\boldsymbol{\omega} }^I} -
{{\boldsymbol{\varOmega} }^\infty }) +
{\boldsymbol{R}}_{F\varOmega ,nf}^{IW}\boldsymbol{\cdot
}{{\boldsymbol{\varOmega} }^\infty }\nonumber\\ & \quad +
({\boldsymbol{R}}_{FE,nf}^{II} +
{\boldsymbol{R}}_{FE,nf}^{IW})\boldsymbol{\cdot
}{{\boldsymbol{E}}^\infty } + {{\boldsymbol{F}}^P} +
{{\boldsymbol{F}}^B},
\end{align} \begin{align}
{\textbf{0}} & = {\boldsymbol{T}}_{ff}^I -
{\boldsymbol{R}}_{TU,nf}^{II}\boldsymbol{\cdot
}({{\boldsymbol{u}}^I} - {{\boldsymbol{U}}^\infty }) +
{\boldsymbol{R}}_{TU,nf}^{IW}\boldsymbol{\cdot
}{{\boldsymbol{U}}^\infty } - {\boldsymbol{R}}_{T\varOmega
,nf}^{II}\boldsymbol{\cdot }({{\boldsymbol{\omega} }^I} -
{{\boldsymbol{\varOmega} }^\infty }) +
{\boldsymbol{R}}_{T\varOmega ,nf}^{IW}\boldsymbol{\cdot
}{{\boldsymbol{\varOmega} }^\infty }\nonumber\\ & \quad +
({\boldsymbol{R}}_{TE,nf}^{II} +
{\boldsymbol{R}}_{TE,nf}^{IW})\boldsymbol{\cdot
}{{\boldsymbol{E}}^\infty }.
\end{align}
\begin{align}
{\textbf{0}} & = {\boldsymbol{T}}_{ff}^I -
{\boldsymbol{R}}_{TU,nf}^{II}\boldsymbol{\cdot
}({{\boldsymbol{u}}^I} - {{\boldsymbol{U}}^\infty }) +
{\boldsymbol{R}}_{TU,nf}^{IW}\boldsymbol{\cdot
}{{\boldsymbol{U}}^\infty } - {\boldsymbol{R}}_{T\varOmega
,nf}^{II}\boldsymbol{\cdot }({{\boldsymbol{\omega} }^I} -
{{\boldsymbol{\varOmega} }^\infty }) +
{\boldsymbol{R}}_{T\varOmega ,nf}^{IW}\boldsymbol{\cdot
}{{\boldsymbol{\varOmega} }^\infty }\nonumber\\ & \quad +
({\boldsymbol{R}}_{TE,nf}^{II} +
{\boldsymbol{R}}_{TE,nf}^{IW})\boldsymbol{\cdot
}{{\boldsymbol{E}}^\infty }.
\end{align}It should be noted that, except for the Brownian force term, each of these equations has an analogy to (2.41) and (2.42). This similarity arises because the FSD formulation also divides hydrodynamic contributions into far-field and near-field, sharing commonalities with ASD. Applying the constraint form to (A4) using the substitution made in (A5) and (A6) yields
 \begin{align}&\left[
{\begin{array}{@{}cc@{}} {{{\mathcal{M}}^\infty
}}&{{\mathcal{B}}^{\prime} }\\
{{{({\mathcal{B}}^{\prime})}^T}}&- { \left[
{\begin{array}{@{}cc@{}}
{{\boldsymbol{R}}_{FU,nf}^{II}}& \ {{\boldsymbol{R}}_{F\varOmega
,nf}^{II}}\\
{{\boldsymbol{R}}_{TU,nf}^{II}}& \ {{\boldsymbol{R}}_{T\varOmega
,nf}^{II}} \end{array}} \right]} \end{array}} \right] \cdot
\left[ {\begin{array}{*{20}{@{}c@{}}} {\left[
{\begin{array}{*{20}{@{}c@{}}} {{\boldsymbol{F}}_{ff}^I}\\
{{\boldsymbol{F}}_{ff}^W}\\ {{\boldsymbol{T}}_{ff}^I}\\
{{\boldsymbol{T}}_{ff}^W}\\ {{\boldsymbol{S}}_{ff}^I}\\
{{\boldsymbol{S}}_{ff}^W} \end{array}} \right]}\\ {\left[
{\begin{array}{*{20}{@{}c@{}}} {{{\boldsymbol{U}}^I} -
{{\boldsymbol{U}}^\infty }}\\ {{{\boldsymbol{\omega} }^I} -
{{\boldsymbol{\varOmega} }^\infty }} \end{array}} \right]}
\end{array}} \right]\nonumber\\ &\quad = \left[ {\begin{array}{*{20}{@{}c@{}}}
{\left[ {\begin{array}{*{20}{@{}c@{}}} {\textbf{0}}\\
{{{\boldsymbol{U}}^\infty }}\\ {\textbf{0}}\\
{{{\boldsymbol{\varOmega} }^\infty }}\\
{{{\boldsymbol{E}}^\infty }}\\ {{{\boldsymbol{E}}^\infty }}
\end{array}} \right]}\\ { - \left[ {\begin{array}{*{20}{@{}c@{}}}
{{{\boldsymbol{F}}^P} +
{\boldsymbol{R}}_{FU,nf}^{IW}\boldsymbol{\cdot
}{{\boldsymbol{U}}^\infty } + {\boldsymbol{R}}_{F\varOmega
,nf}^{IW}\boldsymbol{\cdot }{{\boldsymbol{\varOmega} }^\infty
} + ({\boldsymbol{R}}_{FE,nf}^{II} +
{\boldsymbol{R}}_{FE,nf}^{IW})\,\textrm{:}\,{{\boldsymbol{E}}^\infty
} + {{\boldsymbol{F}}^B}}\\
{{\boldsymbol{R}}_{TU,nf}^{IW}\boldsymbol{\cdot
}{{\boldsymbol{U}}^\infty } + {\boldsymbol{R}}_{T\varOmega
,nf}^{IW}\boldsymbol{\cdot }{{\boldsymbol{\varOmega} }^\infty
} + ({\boldsymbol{R}}_{TE,nf}^{II} +
{\boldsymbol{R}}_{TE,nf}^{IW})\,\textrm{:}\,{{\boldsymbol{E}}^\infty
} + {{\boldsymbol{F}}^B}} \end{array}} \right]}
\end{array}}
\right].\end{align}
\begin{align}&\left[
{\begin{array}{@{}cc@{}} {{{\mathcal{M}}^\infty
}}&{{\mathcal{B}}^{\prime} }\\
{{{({\mathcal{B}}^{\prime})}^T}}&- { \left[
{\begin{array}{@{}cc@{}}
{{\boldsymbol{R}}_{FU,nf}^{II}}& \ {{\boldsymbol{R}}_{F\varOmega
,nf}^{II}}\\
{{\boldsymbol{R}}_{TU,nf}^{II}}& \ {{\boldsymbol{R}}_{T\varOmega
,nf}^{II}} \end{array}} \right]} \end{array}} \right] \cdot
\left[ {\begin{array}{*{20}{@{}c@{}}} {\left[
{\begin{array}{*{20}{@{}c@{}}} {{\boldsymbol{F}}_{ff}^I}\\
{{\boldsymbol{F}}_{ff}^W}\\ {{\boldsymbol{T}}_{ff}^I}\\
{{\boldsymbol{T}}_{ff}^W}\\ {{\boldsymbol{S}}_{ff}^I}\\
{{\boldsymbol{S}}_{ff}^W} \end{array}} \right]}\\ {\left[
{\begin{array}{*{20}{@{}c@{}}} {{{\boldsymbol{U}}^I} -
{{\boldsymbol{U}}^\infty }}\\ {{{\boldsymbol{\omega} }^I} -
{{\boldsymbol{\varOmega} }^\infty }} \end{array}} \right]}
\end{array}} \right]\nonumber\\ &\quad = \left[ {\begin{array}{*{20}{@{}c@{}}}
{\left[ {\begin{array}{*{20}{@{}c@{}}} {\textbf{0}}\\
{{{\boldsymbol{U}}^\infty }}\\ {\textbf{0}}\\
{{{\boldsymbol{\varOmega} }^\infty }}\\
{{{\boldsymbol{E}}^\infty }}\\ {{{\boldsymbol{E}}^\infty }}
\end{array}} \right]}\\ { - \left[ {\begin{array}{*{20}{@{}c@{}}}
{{{\boldsymbol{F}}^P} +
{\boldsymbol{R}}_{FU,nf}^{IW}\boldsymbol{\cdot
}{{\boldsymbol{U}}^\infty } + {\boldsymbol{R}}_{F\varOmega
,nf}^{IW}\boldsymbol{\cdot }{{\boldsymbol{\varOmega} }^\infty
} + ({\boldsymbol{R}}_{FE,nf}^{II} +
{\boldsymbol{R}}_{FE,nf}^{IW})\,\textrm{:}\,{{\boldsymbol{E}}^\infty
} + {{\boldsymbol{F}}^B}}\\
{{\boldsymbol{R}}_{TU,nf}^{IW}\boldsymbol{\cdot
}{{\boldsymbol{U}}^\infty } + {\boldsymbol{R}}_{T\varOmega
,nf}^{IW}\boldsymbol{\cdot }{{\boldsymbol{\varOmega} }^\infty
} + ({\boldsymbol{R}}_{TE,nf}^{II} +
{\boldsymbol{R}}_{TE,nf}^{IW})\,\textrm{:}\,{{\boldsymbol{E}}^\infty
} + {{\boldsymbol{F}}^B}} \end{array}} \right]}
\end{array}}
\right].\end{align} The projection matrix  ${\mathcal{B}}^{\prime}$ and ${({\mathcal{B}}^{\prime})^T}$ have to be changed to cast the following vector:
 \begin{equation}\left[
{\begin{array}{@{}c@{}} {{{\boldsymbol{U}}^I} -
{{\boldsymbol{U}}^\infty }}\\ {\textbf{0}}\\
{{{\boldsymbol{\omega} }^I} - {{\boldsymbol{\varOmega}
}^\infty }}\\ {\textbf{0}}\\ {\textbf{0}}\\ {\textbf{0}}
\end{array}} \right] =
{\mathcal{B}}^{\prime}\boldsymbol{\cdot }\left[
{\begin{array}{@{}c@{}} {{{\boldsymbol{U}}^I} -
{{\boldsymbol{U}}^\infty }}\\ {{{\boldsymbol{\omega} }^I} -
{{\boldsymbol{\varOmega} }^\infty }} \end{array}}
\right],\quad \left[ {\begin{array}{@{}c@{}}
{{\boldsymbol{F}}_{ff}^I}\\ {{\boldsymbol{T}}_{ff}^I}
\end{array}} \right] =
{({\mathcal{B}}^{\prime})^T}\boldsymbol{\cdot }\left[
{\begin{array}{@{}c@{}} {{\boldsymbol{F}}_{ff}^I}\\
{{\boldsymbol{F}}_{ff}^W}\\ {{\boldsymbol{T}}_{ff}^I}\\
{{\boldsymbol{T}}_{ff}^W}\\ {{\boldsymbol{S}}_{ff}^I}\\
{{\boldsymbol{S}}_{ff}^W} \end{array}} \right].\end{equation}
\begin{equation}\left[
{\begin{array}{@{}c@{}} {{{\boldsymbol{U}}^I} -
{{\boldsymbol{U}}^\infty }}\\ {\textbf{0}}\\
{{{\boldsymbol{\omega} }^I} - {{\boldsymbol{\varOmega}
}^\infty }}\\ {\textbf{0}}\\ {\textbf{0}}\\ {\textbf{0}}
\end{array}} \right] =
{\mathcal{B}}^{\prime}\boldsymbol{\cdot }\left[
{\begin{array}{@{}c@{}} {{{\boldsymbol{U}}^I} -
{{\boldsymbol{U}}^\infty }}\\ {{{\boldsymbol{\omega} }^I} -
{{\boldsymbol{\varOmega} }^\infty }} \end{array}}
\right],\quad \left[ {\begin{array}{@{}c@{}}
{{\boldsymbol{F}}_{ff}^I}\\ {{\boldsymbol{T}}_{ff}^I}
\end{array}} \right] =
{({\mathcal{B}}^{\prime})^T}\boldsymbol{\cdot }\left[
{\begin{array}{@{}c@{}} {{\boldsymbol{F}}_{ff}^I}\\
{{\boldsymbol{F}}_{ff}^W}\\ {{\boldsymbol{T}}_{ff}^I}\\
{{\boldsymbol{T}}_{ff}^W}\\ {{\boldsymbol{S}}_{ff}^I}\\
{{\boldsymbol{S}}_{ff}^W} \end{array}} \right].\end{equation} The Schur complement of the upper left block  ${\mathcal{S}}^{\prime}$ of the matrix in (A7) matches the grand resistance matrix with only the components related to interior particles. Therefore, it retains the advantages of the saddle point matrix when conducting matrix inversion.
 \begin{equation}{\mathcal{S}}^{\prime}
={-} \left(
{{{({\mathcal{B}}^{\prime})}^T}\boldsymbol{\cdot
}({{\mathcal{M}}^\infty }{)^{ - 1}}\boldsymbol{\cdot
}{\mathcal{B}}^{\prime} + \left[ {\begin{array}{@{}cc@{}}
{{\boldsymbol{R}}_{FU,nf}^{II}}&{{\boldsymbol{R}}_{F\varOmega
,nf}^{II}}\\
{{\boldsymbol{R}}_{TU,nf}^{II}}&{{\boldsymbol{R}}_{T\varOmega
,nf}^{II}} \end{array}} \right]} \right) ={-} \left[
{\begin{array}{@{}cc@{}}
{{\boldsymbol{R}}_{FU}^{II}}&{{\boldsymbol{R}}_{F\varOmega
}^{II}}\\
{{\boldsymbol{R}}_{TU}^{II}}&{{\boldsymbol{R}}_{T\varOmega
}^{II}} \end{array}}
\right].\end{equation}
\begin{equation}{\mathcal{S}}^{\prime}
={-} \left(
{{{({\mathcal{B}}^{\prime})}^T}\boldsymbol{\cdot
}({{\mathcal{M}}^\infty }{)^{ - 1}}\boldsymbol{\cdot
}{\mathcal{B}}^{\prime} + \left[ {\begin{array}{@{}cc@{}}
{{\boldsymbol{R}}_{FU,nf}^{II}}&{{\boldsymbol{R}}_{F\varOmega
,nf}^{II}}\\
{{\boldsymbol{R}}_{TU,nf}^{II}}&{{\boldsymbol{R}}_{T\varOmega
,nf}^{II}} \end{array}} \right]} \right) ={-} \left[
{\begin{array}{@{}cc@{}}
{{\boldsymbol{R}}_{FU}^{II}}&{{\boldsymbol{R}}_{F\varOmega
}^{II}}\\
{{\boldsymbol{R}}_{TU}^{II}}&{{\boldsymbol{R}}_{T\varOmega
}^{II}} \end{array}}
\right].\end{equation}Therefore, instead of computing a solution vector of size  $17({N^I} + {N^W})$ containing far-field force vectors and velocity vectors for all particles, regression is performed on a smaller total size of a $11({N^I} + {N^W}) + 6{N^I}$ vector. Thus, it has been demonstrated that a formulation satisfying both the velocity constraint and the saddle point formulation exists.
Appendix B. Validation on rheological properties of colloidal suspension in Stokes regime
The transport properties of particles reflecting HI in an infinite suspension are compared with the results obtained from conventional SD. In figure 13(a), the sedimentation velocities  ${u^I}$ are shown, resulting from an external force ${\boldsymbol{F}}$ acting on spherical particles of the same size arranged at periodically replicated simple cubic (SC) lattice points. The volume fraction $\phi$ of the total particles is adjusted from 0.01 to the maximum packing fraction of 0.5236. This example allows us to validate the correctness of Green's function implemented through (2.23) and the Ewald summation rule. As a result, the sedimentation velocity at all volume fractions showed no difference from the results obtained through the ASD simulation by Sierou & Brady (Reference Sierou and Brady2001). Additionally, the results using the point-force particle model by Saffman (Reference Saffman1973) and the exact results by Zick & Homsy (Reference Zick and Homsy1982), which include higher moments beyond the first moment used in SD, are plotted for comparison purposes. In figure 13(b), relative viscosities of the suspension are measured using particles arranged in the same SC lattice. For a system of spherical particles arranged in a cubic lattice, there exists an explicit form of effective viscosity due to the symmetric nature of the structure according to the study by Nunan & Keller (Reference Nunan and Keller1984):
 \begin{equation}{\eta _{ijkl}} = {\textstyle{1 \over 2}}\mu (1 + \beta )({\delta _{ik}}{\delta _{jl}} + {\delta _{il}}{\delta _{jk}} - {\textstyle{2 \over 3}}{\delta _{ij}}{\delta _{kl}}) + \mu (\alpha + \beta )({\delta _{ijkl}} - {\textstyle{1 \over 3}}{\delta _{ij}}{\delta _{kl}}).\end{equation}
(a) The dependence of sedimentation velocity of spherical particles on the volume fraction. The particles are located at the simple cubic lattice points. Simulation results in this work (purple dashed line) are compared with the ASD results of Sierou & Brady (Reference Sierou and Brady2001) (pink dashed line), exact results of Zick & Homsy (Reference Zick and Homsy1982) (orange dashed line) and point-force solution of Saffman (Reference Saffman1973) (black dotted line). (b) The dependence of shear viscosity of a simple cubic array of spheres on the volume fraction. The viscosity function in the case of uniaxial flow and simple shear flow is compared with the exact results of Hofman et al. (Reference Hofman, Clercx and Schram2000).

In uniaxial straining flow with an extension rate of  $\dot{\varepsilon }$, particle viscosity due to hydrodynamic stress becomes ${\eta ^\infty } = {\langle {\boldsymbol{\Sigma} }\rangle ^H}/\dot{\varepsilon }$, and the suspension viscosity becomes $\alpha = 1 + 2.5\phi {\eta ^\infty }$. Similarly, in simple shear flow with a strain rate of $\dot{\gamma }$, particle viscosity due to hydrodynamic stress becomes ${\eta ^\infty } = {\langle {\boldsymbol{\Sigma} }\rangle ^H}/\dot{\gamma }$ and the suspension viscosity becomes $\beta = 1 + 2.5\phi {\eta ^\infty }$. As a result, the suspension viscosity quantitatively matches well with the exact result by Hofman, Clercx & Schram (Reference Hofman, Clercx and Schram2000), with minor deviation at high volume fractions close to the maximum packing.


 Open access

