




I. INTRODUCTION
Vanadium oxide (VO x ) has been extensively studied for many decades, due to its polymorphism and wide applications in a variety of fields. Reference Griffiths and Eastwood1 The properties of VO x are closely related to its stoichiometry, crystal structure, and morphology. Reference Griffiths and Eastwood1 Among various VO x compounds, VO2 and V2O5 are particularly important for studying. Vanadium atoms in VO2 and V2O5 are in their +4 and +5 oxidation states, respectively. VO2 is featured for its well-known metal-insulator transition near 67 °C. Reference Morin2 This transition leads to an abrupt reduction in resistivity and infrared transmission, and therefore renders VO2 promising for nanoelectronic switches, Reference Lee, Park, Suh, Lee, Seo, Kim, Jung, Kang, Ahn, Lee, Seo, Cha, Yoo, Kim and Park3 transistors, Reference Jeong, Aetukuri, Graf, Schladt, Samant and Parkin4 and optical devices. Reference Appavoo, Wang, Brady, Seo, Nag, Prasankumar, Hilton, Pantelides and Haglund5 V2O5 also has a fairly wide scope of applications. Examples include cathode materials for lithium-ion batteries Reference Chen, Zhu, Chen, Shang, Cao, Hu and Rubloff6 and sodium-ion batteries, Reference Raju, Rains, Gates, Luo, Wang, Stickle, Stucky and Ji7 active materials for supercapacitors, Reference Rauda, Augustyn, Saldarriaga-Lopez, Chen, Schelhas, Rubloff, Dunn and Tolbert8,Reference Boukhalfa, Evanoff and Yushin9 charge-injection-layer materials for field-effect transistors, Reference Long, Xu, Kang, Park, Choi, Nah, Liu and Noh10 and catalysts for organic synthesis. Reference Keränen, Guimon, Iiskola, Auroux and Niinistö11
Synthesis techniques for VO x thin films are of great importance to realize the material applications. Over the years, various preparation approaches have been developed for VO x thin films, such as sol–gel, Reference Ozer12 spray pyrolysis, Reference Akl13 electrodeposition, Reference Ghosh, Ra, Jin, Jeong, Kim, Biswas and Lee14 evaporation, Reference Hakim, Liu, Zakharova and Chen15 magnetron sputtering, Reference Cui, Wang, Zhou, Gordon and Ramanathan16 pulsed laser deposition, Reference Smith, Ramana, Hussain, Chusuei and Julien17 chemical vapor deposition, Reference Nandakumar and Seebauer18 and atomic layer deposition (ALD). Reference Chen, Zhu, Chen, Shang, Cao, Hu and Rubloff6,Reference Rauda, Augustyn, Saldarriaga-Lopez, Chen, Schelhas, Rubloff, Dunn and Tolbert8,Reference Daubert, Lewis, Gotsch, Mundy, Monroe, Dickey, Losego and Parsons19–Reference Gao, Shao, Yan, Li, Su, Meng and Wang32 Among these approaches, ALD is of particular interest for preparing thin films. ALD employs alternate saturated self-limiting surface chemistry reactions, and allows one to deposit thin films in a well-controlled layer-by-layer fashion. Reference George33 The properties of ALD films, such as composition, crystal structure, and morphology, are highly consistent, reproducible, and uniform over large area, and meanwhile the thickness of deposited films can be precisely controlled at an atomic level by digitally adjusting the total ALD cycles. Moreover, ALD also allows for conformal thin-film coating on high aspect-ratio 3D structures, which is essential for realizing the above-mentioned high-performance batteries/supercapacitors applications Reference Chen, Zhu, Chen, Shang, Cao, Hu and Rubloff6,Reference Rauda, Augustyn, Saldarriaga-Lopez, Chen, Schelhas, Rubloff, Dunn and Tolbert8,Reference Boukhalfa, Evanoff and Yushin9 as well as various other applications. Reference Li, Gao, Shao, Su and Wang34–Reference Gu, Wang, Wu, Gordon and Ye36
ALD of VO x has been reported using several types of vanadium precursors. Vanadyl triisopropoxide was a commonly used vanadium precursor, Reference Chen, Zhu, Chen, Shang, Cao, Hu and Rubloff6,Reference Rauda, Augustyn, Saldarriaga-Lopez, Chen, Schelhas, Rubloff, Dunn and Tolbert8,Reference Daubert, Lewis, Gotsch, Mundy, Monroe, Dickey, Losego and Parsons19–Reference Musschoot, Deduytsche, Poelman, Haemers, Van Meirhaeghe, Van den Berghe and Detavernier23 and was applied for both thermal (with water Reference Chen, Zhu, Chen, Shang, Cao, Hu and Rubloff6,Reference Daubert, Lewis, Gotsch, Mundy, Monroe, Dickey, Losego and Parsons19–Reference Badot, Mantoux, Baffier, Dubrunfaut and Lincot21 or ozone Reference Rauda, Augustyn, Saldarriaga-Lopez, Chen, Schelhas, Rubloff, Dunn and Tolbert8,Reference Chen, Pomerantseva, Banerjee, Gregorczyk, Ghodssi and Rubloff22 ) and plasma-enhanced Reference Musschoot, Deduytsche, Poelman, Haemers, Van Meirhaeghe, Van den Berghe and Detavernier23 ALD processes. A similar precursor, vanadium n-propoxide, could also be used along with acetic acid to produce ALD V2O4. Reference Willinger, Neri, Rauwel, Bonavita, Micali and Pinna24 Also, VOCl3 could be used with water to deposit VO2. Reference Povey, Bardosova, Chalvet, Pemble and Yates25 β-diketonate-based precursors, such as VO(acac)2 (Ref. Reference Dagur, Mane and Shivashankar26) (acac = acetylacetonate) and VO(thd)2 (Ref. Reference Østreng, Nilsen and Fjellvåg27) (thd = 2,2,6,6-tetramethylheptane-3,5-dionate), were also reported for ALD with the combined use of oxygen Reference Dagur, Mane and Shivashankar26 and ozone, Reference Østreng, Nilsen and Fjellvåg27 respectively. Recently, an amino-based precursor of tetrakis(ethylmethylamino)vanadium [V(NEtMe)4] was described with water or ozone for depositing VO x thin films. Reference Blanquart, Niinisto, Gavagnin, Longo, Heikkila, Puukilainen, Pallem, Dussarrat, Ritala and Leskela28–Reference Premkumar, Toeller, Radu, Adelmann, Schaekers, Meersschaut, Conard and Elshocht30 In this case, since metal-nitrogen bonds are generally weaker than metal-oxygen bonds in transition metal organic compounds, V(NEtMe)4 should be more reactive toward forming oxides in ALD. Also, V is in nominal +4 valence state in V(NEtMe)4, and it should be therefore more favorable for depositing stoichiometric VO2 thin films. Reference Peter, Martens, Rampelberg, Toeller, Ablett, Meersschaut, Cuypers, Franquet, Detavernier, Rueff, Schaekers, Van Elshocht, Jurczak, Adelmann and Radu31 Very recently, our group used another type of amino vanadium precursor, tetrakis(dimethylamino)vanadium [V(dma)4], with water, and were able to deposit VO x at a fairly low temperature of 50 °C. Reference Gao, Shao, Yan, Li, Su, Meng and Wang32 The deposited VO x thin film showed great charge injection performance for organic field-effect transistor devices. Reference Gao, Shao, Yan, Li, Su, Meng and Wang32
In this paper, we present a detailed study of ALD VO x from this V(dma)4 precursor. The deposition temperature was largely extended up to 200 °C, and both ozone and water were investigated as the corresponding oxygen source. Careful material characterizations were performed on the films deposited under various conditions. Postdeposition annealing was also attempted to crystallize the amorphous as-deposited films. In situ quartz crystal microbalance (QCM) measurements were also performed to analyze the surface reaction mechanism involved in this ALD process. With these detailed characterizations, we hope to provide a comprehensive view of VO x ALD process from this V(dma)4 precursor.
II. EXPERIMENTAL SECTION
A. ALD of vanadium oxide films
Vanadium oxide films were deposited in a home-built tubular ALD reactor. Tetrakis(dimethylamino)vanadium [V(dma)4] was used as the vanadium precursor, and water vapor or ozone was used as the coreactant gas. Water and V(dma)4 were both kept at room temperature in two separate glass containers, respectively. Note that V(dma)4 is volatile and highly reactive with air and moisture, and thus it should be handled (e.g., loading into the glass container) in an inert gas filled glovebox with great care. Ozone was produced by an ozone generator from pure O2 (40 mg/L, ∼3% in O2). During the deposition, the vanadium precursor was delivered into the deposition chamber with the assistance of N2 carrier gas. As for the water vapor or ozone, it was first delivered into a ∼5 mL gas trap and then delivered into the deposition chamber for depositing films. The base pressure of the deposition chamber was ∼0.3 Torr during the step of purging with N2. All the N2 was purified through a Gatekeeper inert gas purifier. The deposition temperature was varied from 50 to 200 °C. Flow-through mode was used for all the ALD processes. A long purging time of 100 s was used after each precursor dose, allowing for a complete removal of the by-products as well as unreacted excess precursors. Si wafer and fused silica substrates were used for deposition studies. Both the substrates were treated with ultraviolet/ozone for 5 min before deposition, and the native oxide on Si was not intentionally removed.
B. Characterizations of precursor and VO x films
Thermogravimetric (TG) analyses were performed on a Mettler-Toledo TGA-2 system (Schwerzenbach, Switzerland) under N2 ambient inside a glovebox. Approximately 10 mg of V(dma)4 sample was used for each measurement. 50 sccm of N2 gas was used as the flow gas, and the temperature ramping rate was set as 10 °C/min. Both open-cup and close-cup modes were used for the TG measurements. Under close-cup condition, the sample crucible was covered by a lid with a pinhole of 1 mm diameter, which could slow down the release of V(dma)4 vapor and allow the precursor to be exposed to a higher temperature for evaluating its thermal stability.
The thickness of the deposited VO x films was measured by X-ray reflectometry (XRR) using parallel (Göbel mirror) Cu Kα radiation (D8 Advance, Bruker Corporation, Karlsruhe, Germany). The film composition was analyzed by X-ray photoelectron spectroscopy (XPS) using monochromated Al Kα radiation (Escalab 250Xi, Thermo Fisher Scientific, East Grinstead, United Kingdom). The pass energies for survey and high-resolution scans were 50 and 20 eV, respectively. To remove the adventitious carbon on sample surface, 20 s of 2 keV Ar+ sputtering was performed prior to each XPS measurement. X-ray diffraction (XRD) was used to analyze the film crystallinity. Regular XRD experiments were performed on the same Bruker diffractometer as for XRR. In situ high-temperature XRD (HTXRD) was performed on a Rigaku SmartLab diffractometer (Rigaku Corporation, Tokyo, Japan) equipped with an Anton-Paar oven under N2 ambient. The HTXRD spectra were taken at temperatures ranging from 200 to 800 °C in steps of 50 °C. The temperature ramping rate was set as 10 °C/min, and additional 10 min waiting time was set to stabilize the temperature before taking each spectrum. Atomic force microscopy (AFM; MultiMode 8, Bruker Corporation, Santa Barbara, California) and scanning electron microscopy (SEM; SUPRA55, Carl Zeiss AG, Oberkochen, Germany) were used to examine the film surface morphology. QCM was used to in situ investigate the reaction mechanism. The QCM consisted of a gold-covered quartz crystal sensor with an oscillation frequency of ∼6 MHz, and the change of the frequency was monitored by an Inficon SQC-310 controller (East Syracuse, New York).
III. RESULTS AND DISCUSSION
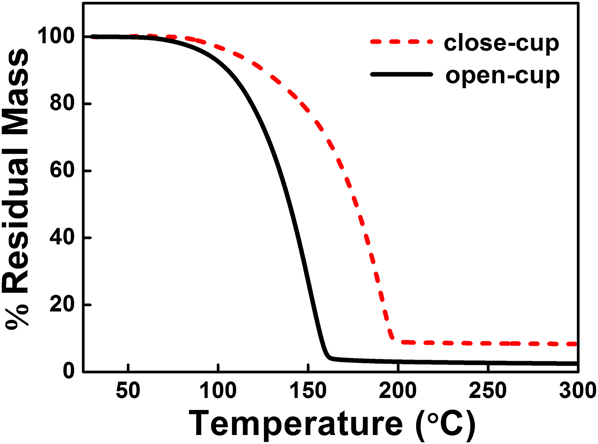
TG analysis was used to evaluate the volatility and thermal stability of the vanadium precursor V(dma)4. The TG experiments were performed under both open-cup and close-cup conditions. As shown in Fig. 1, the curves exhibited only a single step of weight loss, indicating a favorable single-step evaporation process upon heating. In particular, the TG weight loss started at a fairly low temperature under open-cup condition (1% weight loss at 70 °C) and completed at ∼160 °C, with only ∼2.5% in residual mass at the end of temperature ramping. This suggested that V(dma)4 is a highly volatile compound with sufficient thermal stability to serve as a suitable precursor for ALD. Moreover, V(dma)4 is comparatively much more volatile than V(NEtMe)4, a previously reported Reference Blanquart, Niinisto, Gavagnin, Longo, Heikkila, Puukilainen, Pallem, Dussarrat, Ritala and Leskela28 vanadium precursor which has a similar chemical structure as V(dma)4. The TG weight loss for V(NEtMe)4 was reported to finish at ∼210 °C, and its evaporation temperature was set as 65 °C during ALD. Reference Blanquart, Niinisto, Gavagnin, Longo, Heikkila, Puukilainen, Pallem, Dussarrat, Ritala and Leskela28 In our case, V(dma)4 completed weight loss at a much lower temperature around 160 °C, and therefore we expected (validated later) that room temperature should be enough to provide sufficient V(dma)4 vapor for ALD. Thus, no additional heating is needed for this precursor, which can greatly simplify the design of ALD reactors for future large-scale applications. On the other hand, it was also suggested that V(dma)4 might partially decompose during high-temperature ALD (>190 °C), since the TG curve under close-cup condition showed an appreciably higher residual mass (8% above 200 °C), which was likely from the thermal decomposition.
TG curves of V(dma)4 performed under open-cup and close-cup conditions.
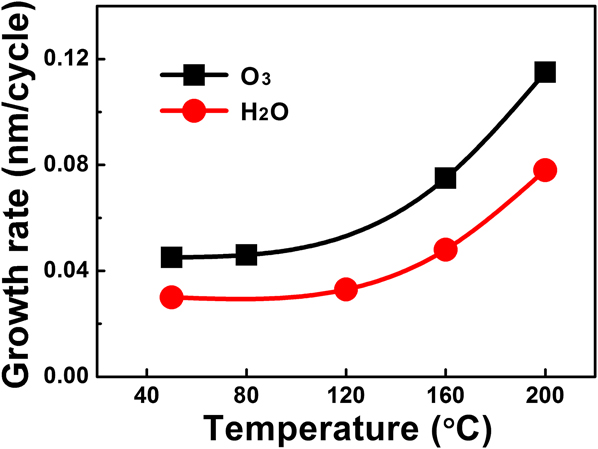
ALD of vanadium oxide thin films were performed following the procedure described in the Experimental Section. As we previously demonstrated for the deposition at 50 °C, Reference Gao, Shao, Yan, Li, Su, Meng and Wang32 single doses for both V(dma)4 and H2O were sufficient to, respectively, provide enough precursor exposures to saturate the ALD surface reactions. We therefore continued to use single doses for the precursors in this study. The equivalent exposures for single doses were roughly 0.02 and 0.05 Torr s for V(dma)4 and H2O, respectively. Single dose was also used for O3, which corresponded to 0.03 Torr s in exposure, assuming negligible decomposition of O3 during delivering. The temperature dependence of the VO x film growth rate is plotted in Fig. 2. The growth rates remained fairly constant up to 120 °C, but substantially increased above 160 °C, which was likely due to partial thermal decomposition at higher temperatures. Below 120 °C, the VO x growth rate using O3 as the oxygen source was ∼0.045 nm/cycle, which was ∼50% higher than the growth rate using H2O (∼0.030 nm/cycle).
Growth rate of VO x films as a function of the deposition temperature. Water vapor or ozone was used as the oxygen source.
The chemical composition of the deposited VO x films were examined by XPS. The XPS signals were collected on the VO x samples with 20 s of Ar+ sputtering to remove the adventitious carbon on surface. Figure 3 displays a set of representative spectra for a 15 nm film deposited at 120 °C using H2O as the coreactant. The survey spectrum [Fig. 3(a)] shows that the deposited film contained the elements of V, O, C, N, and Ar, where the impurities of C and N were likely from the amino ligand of V(dma)4, and Ar was from the sputtering cleaning process. High-resolution XPS scans for V, O, C, and N were also performed, and the spectra are shown in Figs. 3(b)–3(e). The elemental atomic percentages of the films deposited under various conditions were further extracted from the XPS data and listed in Table I. For all these deposition conditions, both the C and N impurity levels were fairly low (<3 at.%), suggesting that the deposited VO x films were fairly pure. The atomic ratios of O/V were also included in Table I. Pure VO2 and V2O5 should have O/V ratios of 2 and 2.5, respectively. However, the measured ratios were all between 2 and 2.5, without any clear trends on the deposition conditions. Similar results were also obtained with the use of V(NEtMe)4 as the vanadium precursor. Reference Blanquart, Niinisto, Gavagnin, Longo, Heikkila, Puukilainen, Pallem, Dussarrat, Ritala and Leskela28 It should be noted that the film oxygen content could also be affected by post oxidation after the films were exposed to air, and also, incorporation of water and/or unreacted hydroxyl groups during deposition could deviate the oxygen content from ideal stoichiometry as well. Deconvolution of the high-resolution V 2p 3/2 spectrum [Fig. 3(b)] suggested the presence of both V4+ (516.2 eV) and V5+ (517.6 eV) in the film, Reference Benayad, Martinez, Gies, Pecquenard, Levasseur and Gonbeau37 but further attempts to quantify the V4+/V5+ ratio were found to involve too much uncertainty to draw any solid conclusions. Reference Blanquart, Niinisto, Gavagnin, Longo, Heikkila, Puukilainen, Pallem, Dussarrat, Ritala and Leskela28
Representative XPS results for a 15 nm VO x film deposited at 120 °C with H2O as the coreactant. (a) Survey and high-resolution scans for (b) V 2p, (c) O 1s, (d) C 1s, and (e) N 1s, respectively.

Elemental composition of the VO x films deposited under various conditions (Data were extracted from XPS results).

All the as-deposited VO x films were amorphous, as there were no peaks in their XRD spectra. The films were also quite smooth. As examined by AFM, the rms roughness was only ∼0.32 nm for the films (approximately 10 nm in thickness) deposited with water at 50 or 120 °C. The films deposited with ozone was slightly rougher, with the rms roughness around 1.0 nm for the films deposited at 50 or 80 °C. Representative AFM images are shown in Fig. 4. Notice that no grain-like features were observed by AFM, which was consistent with the amorphous nature of these films. Reference Li, Shao, Su, Gao and Wang38
Representative AFM images for ALD VO x films deposited (a) with H2O at 120 °C and (b) with O3 at 80 °C, respectively. The film thicknesses were both ∼10 nm, and the corresponding rms roughness values were (a) 0.32 nm and (b) 0.96 nm, respectively.

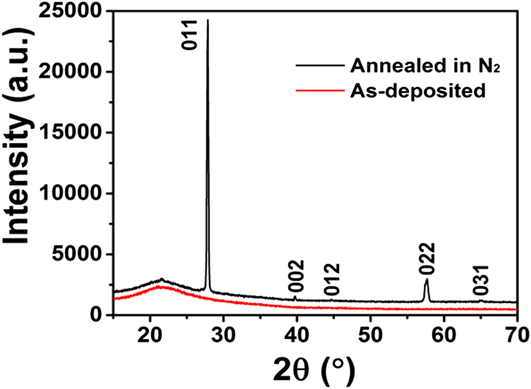
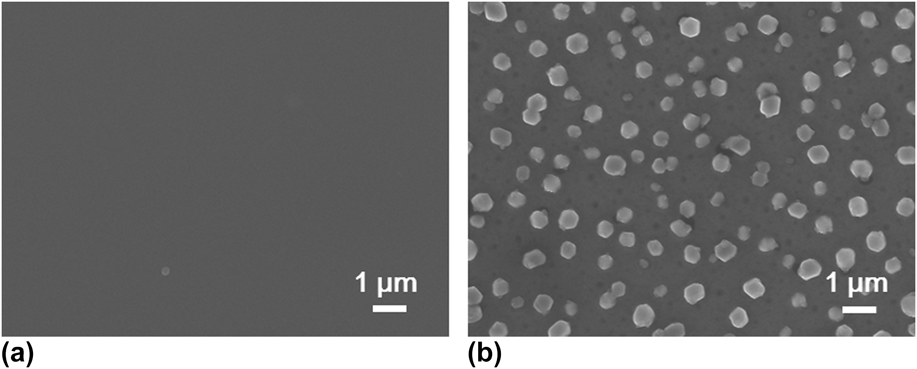
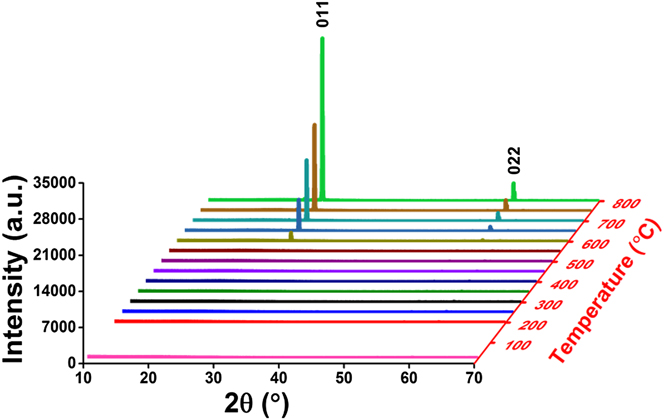
Postdeposition annealing was attempted to crystallize the amorphous VO x films. As suggested by previous reports, Reference Blanquart, Niinisto, Gavagnin, Longo, Heikkila, Puukilainen, Pallem, Dussarrat, Ritala and Leskela28,Reference Peter, Martens, Rampelberg, Toeller, Ablett, Meersschaut, Cuypers, Franquet, Detavernier, Rueff, Schaekers, Van Elshocht, Jurczak, Adelmann and Radu31 we performed the annealing under N2 ambient, aiming to form crystalline VO2 films. Several ALD VO x films deposited with H2O at 50 °C on fused silica substrates were used for this annealing study. The film thickness ranged from 30 to 60 nm, with no observable difference in this study. After 2 h annealing at 800 °C under N2, we found that the amorphous VO x films indeed converted to a monoclinic phase of VO2 (PDF#44–0252). The XRD spectra of the film before and after the annealing are comparatively shown in Fig. 5. On the other hand, the film showed severe agglomeration after the annealing; the film became discontinuous and formed submicron-sized islands (Fig. 6). To better understand the temperature effect during annealing, we performed in situ HTXRD for these ALD VO x films. An amorphous ALD VO x film (approximately 60 nm in thickness) was heated from room temperature to 800 °C with a temperature ramping rate of 10 °C/min. During the heating process, XRD spectra were taken in steps of 50 °C from 200 °C. As the results shown in Fig. 7, the XRD spectra started to show pronounced crystalline VO2 peaks at 600 °C, suggesting that the film crystallization probably occurred at 550–600 °C. Based on the HTXRD results, we performed another ex situ annealing experiment at 600 °C. However, the annealed film was still discontinuous, with almost identical island morphology as after 800 °C annealing [Fig. 6(b)]. As Peter et al. Reference Peter, Martens, Rampelberg, Toeller, Ablett, Meersschaut, Cuypers, Franquet, Detavernier, Rueff, Schaekers, Van Elshocht, Jurczak, Adelmann and Radu31 and Rampelberg et al. Reference Rampelberg, Deduytsche, De Schutter, Premkumar, Toeller, Schaekers, Martens, Radu and Detavernier39 both pointed out, besides annealing temperature, O2 partial pressure was also a critical factor to maintain the continuity of VO x films after annealing. We therefore suspected that the lack of O2 control in our annealing ambient was perhaps the reason for agglomeration, although further experiments are needed to confirm this.
XRD spectra of an ALD VO x film before and after thermal annealing at 800 °C under N2 ambient for 2 h. The as-deposited film (i.e., before annealing) did not show any XRD peaks (the broad feature at 20°–25° was from the fused silica substrate); whereas the annealed film showed pronounced XRD peaks which well matched with the pattern of monoclinic VO2 (PDF#44–0252). The ALD VO x film was originally deposited at 50 °C with H2O, and the thickness was ∼60 nm.
SEM top-view images comparatively showing the accompanying morphological change of the VO x film (a) before and (b) after the annealing process as described in Fig. 5.
In situ HTXRD for an ALD VO x film heated from room temperature to 800 °C, with the XRD spectra taken in steps of 50 °C from 200 °C. The XRD spectra started to show pronounced crystalline VO2 peaks at 600 °C.
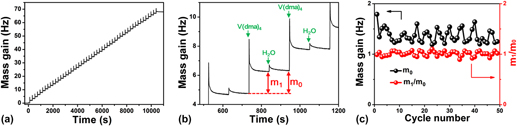
On the other hand, understanding surface reaction mechanism is of great importance for an ALD process. Reference George33 To elucidate the mechanism involved in this VO x ALD process, we further performed in situ QCM experiments to monitor the growth behavior of VO x using H2O as the oxygen source. The QCM experiments were performed at 50 °C using the same recipe as that for the film depositions. The dosing times for V(dma)4 and H2O were both 1 s, and the purging times after each precursor dose were all 100 s. Figure 8(a) displays the mass gain on the QCM sensor during 50 cycles of ALD. The mass gain showed a generally linear behavior with deposition time, suggesting a well-behaved linear growth for this ALD process. To further analyze the mass gain, an enlarged view for three consecutive ALD cycles was representatively plotted in Fig. 8(b). The mass gain showed a jump increase when V(dma)4 or H2O was dosed into the chamber, and then gradually decayed and flattened out during the following purging step. The jump increase should correspond to the chemical reactions occurred on the surface, and the following decay process was likely due to the desorption of the physisorbed excess V(dma)4 or H2O, or the byproduct dimethylamine molecules. Since we used a fairly low deposition temperature of 50 °C, the molecule desorption rate was relatively slow. It should be noted that the spike-like signals when dosing V(dma)4 were probably interfered with the temperature effect, since the high-pressure assisting gas could suddenly fluctuate the sensor temperature and change the apparent mass reading on QCM. Reference Rocklein and George40 However, this temperature effect should last only for a few seconds in our system [control experiments were performed without supplying V(dma)4], and, therefore, the following decay, which lasted for several tens of seconds, was indeed caused by the change of mass on the QCM sensor.
In situ QCM measurements for ALD VO x at 50 °C. (a) Mass gain versus time for 50 ALD cycles. (b) Enlarged view for three consecutive ALD cycles. (c) Per cycle mass gain (m 0) and m 1/m 0 ratio extracted for each individual ALD cycle.
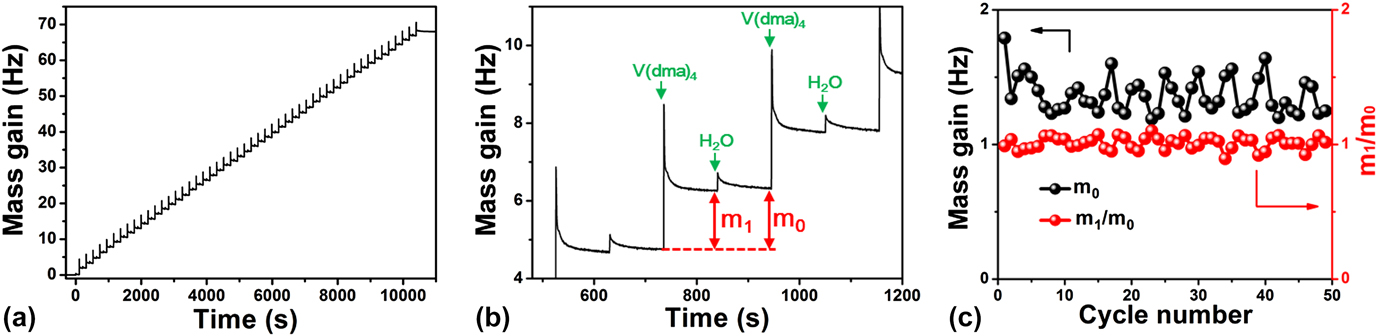
From the QCM curve [Fig. 8(a)], we further extracted the mass changes for each ALD cycle (m 0) and each vanadium half cycle (m 1), and plotted m 0 and m 1/m 0 ratios in Fig. 8(c). The mass gain for each ALD cycle (m 0) was quite constant at around 1.37 ± 0.13 Hz, which again indicated a constant per cycle growth rate for this ALD process. The m 1/m 0 ratio was also quite constant at around 1.01 ± 0.05, which suggested that the surface reaction chemistry was consistent over the entire deposition time. The m 1/m 0 ratio can be further used to analyze the surface reaction mechanism. Reference Guo, Li, Chen, Sang, Yang, Liu and Wang41 As dimethylamino metal precursors are commonly suggested to follow ligand-exchange mechanisms, Reference Meng, Libera, Fister, Zhou, Hedlund, Fenter and Elam42–Reference Hausmann, Kim, Becker and Gordon44 we first assume that this ALD VO x process follows a simple ligand-exchange mechanism, and the associated two half–cycle reactions are rewritten as the following:
 $$\left| { - {{\left( {{\rm{OH}}} \right)}_y} + {\rm{V}}{{\left( {{\rm{N}}{{\left( {{\rm{C}}{{\rm{H}}_{\rm{3}}}} \right)}_2}} \right)}_4}\left( {\rm{g}} \right)\; \to \;} \right - {{\rm{O}}_y}{\rm{V}}{\left( {{\rm{N}}{{\left( {{\rm{C}}{{\rm{H}}_{\rm{3}}}} \right)}_2}} \right)_{4 - y}} + y{\rm{NH}}{\left( {{\rm{C}}{{\rm{H}}_{\rm{3}}}} \right)_2}\left( {\rm{g}} \right)\quad ,$$
 $$\left| { - {{\rm{O}}_y}{\rm{V}}{{\left( {{\rm{N}}{{\left( {{\rm{C}}{{\rm{H}}_{\rm{3}}}} \right)}_2}} \right)}_{4 - y}} + 2{\rm{H}}_2^{}{\rm{O}}\left( {\rm{g}} \right)\; \to \;} \right - \left( {{\rm{VO}}_2^{}} \right){\left( {{\rm{OH}}} \right)_y} + \left( {4 - y} \right){\rm{NH}}{\left( {{\rm{C}}{{\rm{H}}_{\rm{3}}}} \right)_2}\left( {\rm{g}} \right)\quad ,$$
where the symbols “|−” and “(g)” denote the surface and gaseous compounds, respectively. In Eq. (1a), a V(dma)4 molecule reacts with y number of surface hydroxyl groups, and affords y numbers of V–O bonds on surface and y numbers of gaseous dimethylamine molecules. Notice that (4 − y) number of dimethylamino ligands are still attached on the vanadium at the end of the first (vanadium) half cycle. These attached dimethylamino ligands will react with H2O in the second (water) half cycle, following Eq. (1b), and afford surface hydroxyl groups at the end. Thus, according to Eqs. (1a) and (1b), the mass gain ratio, m 1/m 0, should be equal to (227 – 45y)/83. Plugging in the experimental data, y is calculated as 3.18, implying that 3.18/4 (or ∼80%) of dimethylamino groups are released in the vanadium half cycle. It should be noted that the surface dimethylamino groups can also possibly undergo partial decomposition to form methyleneamino groups, as observed for other dimethylamino metal precursors. Reference Meng, Libera, Fister, Zhou, Hedlund, Fenter and Elam42,Reference Burton, Kang, Rhee and George45 If we arbitrarily assume that this decomposition is 100% in our case, the equations should be rewritten as the following:
 $$\left| { - {{\left( {{\rm{OH}}} \right)}_{y'}} + {\rm{V}}{{\left( {{\rm{N}}{{\left( {{\rm{C}}{{\rm{H}}_{\rm{3}}}} \right)}_2}} \right)}_4}\left( {\rm{g}} \right)\; \to \;} \right - {{\rm{O}}_{y'}}{\rm{V}}{( {{\rm{N}}\;{\rm{ = }}\;{\rm{C}}{{\rm{H}}_{\rm{2}}}} )_{4 - y'}} + ( {4 - y'} ){\rm{C}}{{\rm{H}}_4}( {\rm{g}} ) + y'{\rm{NH}}{( {{\rm{C}}{{\rm{H}}_{\rm{3}}}} )_2}( {\rm{g}} )\quad ,$$
 $$\left| { - {{\rm{O}}_{y'}}{\rm{V}}{{\left( {{\rm{N}}\;{\rm{ = }}\;{\rm{C}}{{\rm{H}}_{\rm{2}}}} \right)}_{4 - y'}} + 2{{\rm{H}}_2}{\rm{O}}\left( {\rm{g}} \right)\; \to \;} \right - \left( {{\rm{V}}{{\rm{O}}_2}} \right){\left( {{\rm{OH}}} \right)_{y'}}{\rm{ + }}\left( {{\rm{4}} - y'} \right){\rm{NH}}\;{\rm{ = }}\;{\rm{C}}{{\rm{H}}_{\rm{2}}}\left( {\rm{g}} \right)\quad ,$$
where y′ is used to distinguish from y as previously used in Eqs. (1a) and (1b). With similar analysis as above, y′ is calculated as 2.73, corresponding to ∼68% of dimethylamino groups released in the vanadium half cycle. The real case for y (or y′) should be expected to be between 2.73 and 3.18. To find out the exact percentage of decomposition, one would probably need some other in situ techniques, such as in situ XPS. Reference Ma, Guo, Gordon and Zaera46 But, nevertheless, the value for y (or y′) is fairly high (roughly 3), implying that approximately three surface hydroxyl groups are needed to react with each V(dma)4 molecule in the vanadium half cycle.
IV. CONCLUSIONS
In summary, we performed a comprehensive study of ALD for VO x thin films using tetrakis(dimethylamino)vanadium [i.e., V(dma)4] as the vanadium precursor. The V(dma)4 precursor was highly volatile, and therefore no additional precursor heating was needed for deposition. Both H2O and O3 were investigated as the coreactant for depositing VO x . The deposition temperature was explored from 50 to 200 °C. The film growth rates remained fairly constant up to 120 °C, but substantially increased above 160 °C, which was likely due to partial thermal decomposition at higher temperatures. Below 120 °C, the VO x growth rate using O3 was ∼0.045 nm/cycle, and the growth rate using H2O was ∼0.030 nm/cycle. Careful material characterizations were performed on the ALD VO x films. The deposited films were found fairly pure, with the impurity levels for C and N both below 3 at.%. All the as-deposited films were amorphous and smooth. Postdeposition annealing under N2 ambient could crystallize the as-deposited films to monoclinic VO2 phase. In situ HTXRD suggested that the minimum temperature needed for film crystallization was at around 550–600 °C. However, annealing (at either 600 or 800 °C) could lead to severe film agglomeration, and as a result, the annealed films were no longer continuous and formed submicron-sized islands. In situ mechanism study using QCM was also performed to analyze the surface reaction chemistry during ALD. The QCM results showed that the VO x film growth followed a consistently linear growth, and each V(dma)4 molecule was suggested to react with approximately three surface hydroxyl groups in the vanadium half cycle during ALD.
ACKNOWLEDGMENTS
This work was financially supported by NSFC (Grant No. 51302007), Guangdong Natural Science Funds for Distinguished Young Scholar (Grant No. 2015A030306036), and Shenzhen Science and Technology Innovation Committee (Grant Nos. JCYJ20140417144423201 and KQCX20150327093155293).


 Open access

