


Introduction
Host-associated bacterial communities (also known as the microbiome) play an important role in host ecology and evolution. Host-bacterial communities can confer colonization resistance to invading parasites (Buffie and Pamer, Reference Buffie and Pamer2013), and this function is hypothesized to be the primary evolutionary advantage of having a microbiome (McLaren and Callahan, Reference McLaren and Callahan2020). However, the precise role of bacterial communities in host–parasite interaction is not straightforward as they generally appear to have variable effects on the outcome of infection (Leung et al., Reference Leung, Graham and Knowles2018). Host microbiota are proposed to form the 4th vertex of a ‘Disease Pyramid’; thus their responses may play an important role in host–parasite dynamics and subsequently, host ecology (Bernardo-Cravo et al., Reference Bernardo-Cravo, Schmeller, Chatzinotas, Vredenburg and Loyau2020).
In general, host genetics, parasite exposure and successful infection by the parasite may all have time-dependent effects on the diversity and composition of host microbiota (Hahn et al., Reference Hahn, Piecyk, Jorge, Cerrato, Kalbe and Dheilly2022). However, the relative influence of all these factors have rarely been investigated as it is challenging and expensive to manipulate multiple factors and assess their influence on host microbiota. Beetle and vole hosts successfully infected with their respective parasites (the helminth Hymenolepis diminuta and trematode Schistosoma japonicum) show relative abundance shifts of some bacterial orders across days post parasite exposure. However, it is unknown if host genotypes vary in the responses of bacterial communities to infection (Fredensborg et al., Reference Fredensborg, Fossdal, Kálvalíð, Johannesen, Stensvold, Nielsen and Kapel2020; Zhang et al., Reference Zhang, Hu, Liu, Liu, Gao, Liang, Zou, Su, Zhi and Zhou2020). In other hosts, such as the stickleback, experimental exposure to the helminth parasite Schistocephalus solidus causes hosts to vary in their bacterial community composition in both a host-genotype-specific (Ling et al., Reference Ling, Steinel, Weber, Ma, Smith, Correa, Zhu, Bolnick and Wang2020) as well as parasite genotype-specific manner (Hahn et al., Reference Hahn, Piecyk, Jorge, Cerrato, Kalbe and Dheilly2022). Longitudinal changes in the gut microbiome after helminth parasite exposure correlated with differential immune response at varying time points in the stickleback (Hahn et al., Reference Hahn, Piecyk, Jorge, Cerrato, Kalbe and Dheilly2022). On the other hand, some animals such as oysters show no changes in bacterial community diversity and composition after exposure to its bacterial pathogen Vibrio (Lokmer and Mathias Wegner, Reference Lokmer and Mathias Wegner2015). Furthermore, most studies focus on assessing bacterial community changes in specific host tissues (typically gut or haemolymph) with respect to infection. However, no study investigated the influence of parasite exposure on host–bacterial community at various timepoints (i.e. longitudinally), across host genotypes, and simultaneously at tissue-level resolution.
We addressed this knowledge gap by investigating the longitudinal effects of parasite exposure and successful infection across genotypes of the freshwater crustacean host Daphnia magna. Daphnia is a compelling system to investigate both host–parasite (reviewed in Ebert, Reference Ebert2005) and host–bacterial community interactions (reviewed in Akbar et al., Reference Akbar, Gu, Sun, Zhang, Lyu, Huang and Yang2022). Although in laboratory investigations, Daphnia bacterial communities neither influenced susceptibility to a parasite (Sison-Mangus et al., Reference Sison-Mangus, Metzger and Ebert2018) nor conferred tolerance upon parasite re-exposure (Bulteel et al., Reference Bulteel, Houwenhuyse, Declerck and Decaestecker2021), bacterial communities varied with the presence of infection in the wild (Rajarajan et al., Reference Rajarajan, Wolinska, Walser, Mäder and Spaak2022b). The fungal parasite Metschnikowia bicuspidata (hereafter referred to as Metschnikowia) is a generalist parasite that commonly infects various Daphnia species in lakes and ponds across Europe (Ebert et al., Reference Ebert, Lipsitch and Mangin2000; Wolinska et al., Reference Wolinska, Seda, Koerner, Smilauer and Petrusek2011), North America (Penczykowski et al., Reference Penczykowski, Hall, Civitello and Duffy2014) and Israel (Goren and Ben-Ami, Reference Goren and Ben-Ami2013). It is a horizontally transmitted parasite that reduces host fecundity and life span (Ebert et al., Reference Ebert, Lipsitch and Mangin2000). Furthermore, its growth and reproduction within the host is well-documented (Stewart Merrill and Cáceres, Reference Stewart Merrill and Cáceres2018). Within 24 hours after ingestion, Metschnikowia spores cross the host gut barrier (termed ‘attacking spores’) and enter the Daphnia haemolymph. This initial breaching of the gut barrier is a critical step required for the parasite to reproduce in the haemolymph. Successfully infected individuals have dense clusters of mature parasite spores circa 10 days after exposure, and at this point of time, the infection can be easily identified under a dissecting microscope (Stewart Merrill and Cáceres, Reference Stewart Merrill and Cáceres2018). Despite its global prevalence and well-documented pathology, host microbiome responses to Metschnikowia exposure and successful infection have not yet been characterized.
In this study, we investigated the influence of Metschnikowia bicuspidata parasite exposure on Daphnia magna bacterial communities of 3 host genotypes at 2 timepoints after parasite exposure – (i) 24 h (hereafter referred to as ‘initial exposure’ or ‘parasite exposure’) and (ii) 10 days (hereafter ‘successful infection’ or ‘infection status’). In general, we expected host–bacterial community composition and diversity to vary with different stages of parasite's life cycle. We hypothesized that (a) the beta diversity of the host–gut bacterial community (but not the body) would undergo changes in response to attacking Metschnikowia spores, immediately after initial parasite exposure, evident after 24 h, and (b) both the host gut and body (excluding gut) bacterial communities would exhibit reduced alpha diversity and altered beta diversity upon successful infection after 10 days, reflecting the proliferation of Metschnikowia spores within the Daphnia body. To address these hypotheses, we analysed host gut and body bacterial communities at the 2 specified timepoints. We also investigated the potential role of host genotype in host–bacterial community changes in response to parasite exposure and successful infection. To address this question, we additionally analysed the bacterial communities of whole individual Daphnia of 3 genotypes 24 h post-parasite exposure. We hypothesized that (c) both alpha and beta diversity of whole Daphnia individuals would vary based on the interaction between host genotype and parasite exposure, reflecting differential responses of host genotypes to parasite exposure [for example, host-genotype-specific variation in the outcome of Metschnikowia infection (Duffy and Sivars-Becker, Reference Duffy and Sivars-Becker2007)]. We additionally examined if this interaction is localized to specific tissue (Daphnia gut or body). Finally, we expected that (d) relative abundances of specific bacterial taxa would indicate either parasite exposure- or infection status in both gut and body samples, regardless of host genotype.
Materials and methods
Daphnia magna culturing conditions
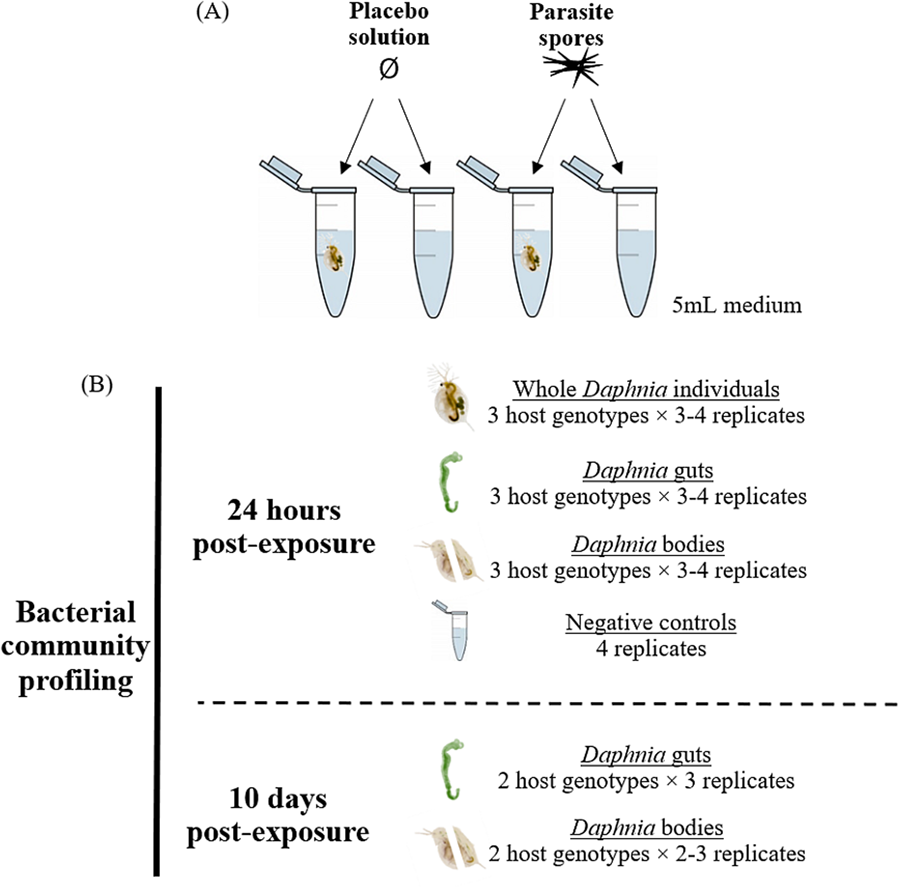
This study includes 3 Daphnia magna genotypes, each isolated from a different location: E17:07 and GB-LK-1 from populations in England (Hesse et al., Reference Hesse, Engelbrecht, Laforsch and Wolinska2012) and NO-V-7 from a population in Norway (Haag et al., Reference Haag, Pombert, Sun, De Albuquerque, Batliner, Fields, Lopes and Ebert2020). All 3 host genotypes were maintained under standardized laboratory conditions: 2–3 females each in 3 jars were kept at 20°C and a 16:8 light:dark cycle in 200 mL Greifensee lake water (Switzerland; N 47°20′41″, E 8°40′21″) filtered through a 0.45 μm mesh. No Metschnikowia infections have been detected in this lake over the past 20 years (Turko et al., Reference Turko, Tellenbach, Keller, Tardent, Keller, Spaak and Wolinska2018). Daphnia individuals were fed 2 mg C/L Acutodesmus obliquus algae and medium was refreshed 3 times a week. For the experiment, all free-swimming juveniles of the same genotype, born within a 24-h period, were pooled into a jar containing 200 mL medium. Juveniles aged 3–4 days were then transferred individually into 5 mL microcentrifuge tubes containing 5 mL medium (experimental units) and exposed to either a parasite spore- or placebo solution (Fig. 1A). Additional experimental units not containing Daphnia were set up as experimental negative controls, to assess changes in bacterial communities in the media due to addition of spores or crushed host tissue. Thus, these negative controls were exposed to either the spore solution or placebo solution, respectively (see below).
(A) Experiment design and (B) samples analysed, for each parasite exposure treatment. Placebo solution consisted of crushed host tissue. Only 2 genotypes were included in the 10-day timepoint after spore exposure analysis as the third (GB-LK-1) did not survive spore exposure until this timepoint (see Methods and Table S7).

Parasite (Metschnikowia bicuspidata) culturing conditions
Parasite strain ‘METS_AMME_2008’ was originally isolated in 2008 from the Daphnia population of lake Ammersee (Germany) and maintained in vivo on the D. magna genotype E17:07 since then (Manzi et al., Reference Manzi, Agha, Mühlenhaupt and Wolinska2022). Metschnikowia-infected individuals were picked from D. magna E17:07 stock infected cultures, homogenized with a pestle in filtered lake water, and pooled into a single spore solution. For the placebo solution, the same number of uninfected D. magna (genotype: E17:07) individuals were homogenized in filtered lake water. The spore suspension was filtered through a 0.7 μm mesh (Whatman GF/F filter Cat #28497-914) to allow Daphnia-associated bacteria to flow through; spores retained on the filter were then rinsed with, and resuspended in filtered lake water for use in the experiment. The same procedure was repeated with the placebo solution. Metschnikowia spore concentration was measured on 2 subsamples using a Neubauer counting chamber. Individuals in the experiment were exposed to a target concentration of 3500 spores/mL (Manzi et al., Reference Manzi, Agha, Mühlenhaupt and Wolinska2022, Reference Manzi, Schlösser, Owczarz and Wolinska2023); control Daphnia were exposed to an equivalent volume of the placebo solution. 48 h after the addition of spores, individuals remaining in the experiment were transferred to a new experimental unit containing 5 mL fresh, spore-free medium. They were fed 1 mg C/L of A. obliquus 3 times a week for the duration of the experiment.
Dissection and sample processing
Dissections and sample preparation were conducted at 2 timepoints: 24 h and 10 days post-exposure to parasite spores. At 24 h post-exposure, juveniles were gently lifted by the antennae with a pair of sterilized forceps and placed on a microscope glass slide containing a droplet of nuclease-free water. The gut was extracted, placed in a separate droplet of water and transferred with a pipette into a 1.5 mL microcentrifuge along with 10 μL nuclease-free water. The remaining body tissue was transferred to a separate 1.5 mL microcentrifuge tube using a second pair of sterilized forceps. For whole individual samples, juveniles were lifted by the antennae with a pair of forceps and transferred directly into a 1.5 mL microcentrifuge tube containing 10 μL nuclease-free water. Forceps were wiped with 10% bleach and air-dried between each processed sample to eliminate cross-contamination. For negative controls (see above), medium was filtered through a sterile 0.2 μm filter; the filter was then transferred to a 2 mL microcentrifuge tube using a pair of forceps. All samples were placed on ice immediately upon collection and stored at −20°C within an hour. At the second timepoint (10 days post-exposure), individuals were visually screened for the presence of mature Metschnikowia asci under 50 × magnification. Of the surviving individuals, 50% of genotype E-17-07 and 42.9% of genotype NO-V-7 were successfully infected; only these individuals were included in the ‘infected’ group. Unexposed individuals formed the ‘uninfected’ group (Table S7). Individuals of the genotype GB-LK-1, which died within 5 days of exposure, were excluded from analysis due to the inability to confirm Metschnikowia infection at this time point. Consequently, the 10-day timepoint included only genotypes E17:07 and NO-V-7 (Table S6). The same sample processing protocol was followed as for the 24-h time point, except that only gut and body samples were collected, not whole individuals or negative controls. For both timepoints, the order of sample processing was randomized across host genotypes, parasite exposure treatments, sample types (gut-body pair or whole individual), and replicates (Fig. 1).
Bacterial community profiling
DNA was extracted using the Qiagen Blood & Tissue kit (Cat #69506). Briefly, samples were lysed at 56°C for 3 hours, and the protocol recommended by the manufacturer was followed for Daphnia tissue samples. For filter samples (negative controls), modifications to the protocol were made to maximize DNA recovery (Hinlo et al., Reference Hinlo, Gleeson, Lintermans and Furlan2017). The location of DNA samples on the 384-well plate was completely randomized to minimize experimental bias in subsequent PCR steps. A nested PCR was used to amplify bacterial DNA. The V3–V4 region of the 16S rRNA gene was amplified using primers 515F (5′-GTGCCAGCMGCCGCGGTAA-3′) and m806R (5′-GGACTACNVGGGTWTCTAAT-3′) under the following cycling conditions: initial denaturation at 95°C for 3 min; (98°C – 20 s, 52°C – 15 s, 72°C – 15 s), 33 cycles, followed by a final extension at 72°C for 5 min. This PCR step was done on 3 technical replicates and pooled for each sample. Samples were then purified using Agencourt AMPure beads (Cat #A63881) in preparation for the second PCR step (indexing). Indexes were added to samples via PCR under the following cycling conditions: initial denaturation at 95°C for 3 min; (95°C – 30 s, 55°C – 30 s, 72°C – 30 s), 13 cycles followed by a final extension at 72°C for 5 min. Indexed samples were again purified with AMPure beads, quantified with a Qubit BR Assay (Cat #Q32850), normalized and pooled into a 2.2 nm library for amplicon sequencing. Paired-end sequencing was carried out using MiSeq-600 cycles (PE300) v3 run kit with 10% PhiX.
Pre-processing of reads
Sequencing resulted in 3.2 M paired-end reads (minimum = 620, maximum = 156,355 reads per sample). Initial pre-processing steps were performed on the Euler computing cluster at ETH Zürich as previously described (Rajarajan et al., Reference Rajarajan, Wolinska, Walser, Mäder and Spaak2022b). Briefly, raw reads were trimmed at the 5′-end, merged and quality filtered. Amplicons were clustered using UPARSE2 to cluster OTUs at 97% sequence similarity (Edgar, Reference Edgar2013), denoised into Zero-radius OTUs (ZOTUs) using UNOISE3 (Edgar, Reference Edgar2016a) and annotated using the SINTAX classifier (Edgar, Reference Edgar2016b) against the SILVA database (v138) (Quast et al., Reference Quast, Pruesse, Yilmaz, Gerken, Schweer, Yarza, Peplies and Glöckner2012). Subsequent steps were performed in R v.4.0.2 using the phyloseq package (McMurdie and Holmes, Reference McMurdie and Holmes2013). 69 chloroplasts, 127 mitochondria and 51 ZOTUs of unknown phylum were filtered out of the dataset. Only samples for which rarefaction curves plateaued (indicating sufficient sequencing depth) were retained in the dataset (see McMurdie and Holmes, Reference McMurdie and Holmes2014). Final sample sizes for formal statistical analyses are summarized in Fig. 1. Pre-processing resulted in a total of 3193 ZOTUs in the final dataset.
Statistical analyses
Bacterial community diversity and composition assessments were made using the vegan package in R, and were made at the ZOTU level (Dixon, Reference Dixon2003). The Inverse Simpson Index (alpha diversity) was calculated using vegan::estimate_richness. For Daphnia gut- and whole Daphnia individual samples, variation of Inverse Simpson Index across groups at 24 h post parasite exposure was tested with a 2-way ANOVA with host genotype and parasite exposure as explanatory variables, after verifying that the assumptions of normality and homoscedasticity were met with a Bartlett test and Shapiro–Wilk test, respectively. For whole individual samples, comparisons included 3 host genotypes × 2 parasite exposure levels × 3–4 replicates. Since neither ANOVA assumptions were met for body samples, they were analysed with 2 non-parametric Kruskal–Wallis tests conducted separately using host genotype and infection status as explanatory variables. Next, beta diversity metric Bray–Curtis dissimilarity and Jaccard dissimilarity were calculated and compared across groups with a 2-way PERMANOVAs with the function vegan::adonis2 (9999 permutations); using host genotype and parasite exposure as explanatory variables (3 host genotypes × 2 parasite exposure levels × 3–4 replicates). These analyses were performed separately for Daphnia whole individuals, gut and body samples (Fig. 1B).
The same analyses as above on Inverse Simpson index (alpha diversity) and Bray–Curtis dissimilarity and Jaccard dissimilarity (beta diversity) were repeated for gut and body samples collected 10 days post parasite exposure. All 2-way tests were performed with host genotype and infection status as explanatory variables.
Differential abundance of dominant bacterial orders across infection status was tested for Daphnia guts and bodies, 10 days post-exposure. For this, rare orders, i.e. those comprising <1% of, and not present in every gut sample were lumped in the category ‘Other’ using the function microbiome::aggregate_rare, and this was similarly done for body samples. Samples of host genotypes were pooled to compare relative abundance of dominant bacterial orders across infection status (2 infection levels × 4–6 replicates) using a Wald test in the DeSeq2 package (Love et al., Reference Love, Huber and Anders2014).
Finally, specific ZOTUs indicative of Metschnikowia exposure or infection status were identified separately for each time point using the signassoc function of the indicspecies package (9999 permutations), and corrected for multiple comparisons using the Sidak method (Cáceres and Legendre, Reference Cáceres and Legendre2009). This analysis was conducted on a pooled set of gut and body samples to identify taxa indicative of Metschnikowia presence regardless of host tissue.
Results
Alpha diversity of Daphnia whole individual bacterial communities at 24 hours post-exposure
At 24 h post-parasite exposure, the Inverse Simpson index (evenness) of whole individual Daphnia bacterial communities varied depending on the interaction of host genotype and parasite exposure (Fig. 2, Table 1). In contrast, there were no changes in alpha diversity in the Daphnia gut or body bacterial communities by either host genotype, parasite exposure or their interaction (Table S1). Further, Inverse Simpson indices of bacterial communities in the medium (i.e. negative controls) did not vary with parasite exposure (Fig. S1, Table S2). Overall, this suggests that parasite exposure leads to host-genotype-specific changes in the evenness of bacterial communities within whole individual Daphnia, and that these changes are not driven due to the alteration in the bacterial communities of the medium following the addition of a spore solution.
Inverse Simpson Index of Daphnia whole individual bacterial communities, 24 h after exposure to parasite spores. Host genotypes are indicated by shape in separate panels, spore exposure groups are indicated by colour. Crosses show mean values.

2-Way ANOVA of Inverse Simpson index of whole Daphnia individual bacterial communities, across host genotype and parasite exposure treatments, 24 h after exposure to spores

*P < 0.05.
Beta diversity of Daphnia whole individual bacterial communities at 24 hours post-exposure
Beta diversity indices (Bray–Curtis and Jaccard Dissimilarity) varied primarily by host genotype but not by parasite exposure (Fig. 3, Table 2); with the genotype GB-LK-1 largely differing from the other two (Fig. 3, Fig. S3). However, there was some variation due to the interaction of host genotype and parasite exposure in the composition of whole individual bacterial communities. Specifically, both Bray–Curtis dissimilarity (which weighs taxa by their relative abundance) and Jaccard Dissimilarity (which compares sets of unshared taxa) varied by host genotype and the interaction of host genotype and parasite exposure, but not by parasite exposure alone (Table 2). No changes in bacterial community composition occurred in the medium (experimental negative controls), upon addition of the parasite spore solution (Fig. S2, Table S3). This suggests that parasite exposure alters Daphnia whole individual bacterial community composition in a host-genotype-specific manner, and that these changes are not driven by alterations in the medium bacterial communities. Further, there were no differences in the bacterial community composition of the Daphnia gut or body specifically by host genotype, parasite exposure or their interaction (Table S4, Fig. S3).
Principal co-ordinate analyses of beta diversity indices (A) Bray–Curtis dissimilarity and (B) Jaccard dissimilarity of Daphnia whole individual bacterial communities, 24 h after exposure to parasite spores. Colours indicate parasite exposure groups and data point shapes show host genotype. Ellipses represent 95% confidence intervals (for each host genotype × infection group except unexposed NO-V-7, since a minimum of 4 data points are required to compute a 95% confidence ellipse). Ellipse colours indicate parasite exposure group, and line types indicate host genotype group (solid = E-17-07, dashed = NO-V-7 and dotted = GB-LK-1).

2-Way PERMANOVA (9999 permutations) of (A) Bray–Curtis dissimilarity and (B) Jaccard dissimilarity of whole individual Daphnia bacterial communities across host genotype and parasite exposure treatments, 24 h after exposure to spores

*P < 0.05.
Alpha diversity of Daphnia body and gut bacterial communities at 10 days post-parasite exposure
Inverse Simpson Indices of Daphnia gut bacterial communities, but not body bacterial communities, varied by infection status 10 days after exposure to spores (Fig. 4, Table 3). Specifically, the evenness of gut bacterial community was lower in Daphnia that were successfully infected.
Inverse Simpson Index of Daphnia gut and body bacterial communities, 10 days after exposure to parasite spores. Host genotypes are indicated by shape in separate panels and Metschnikowia infection status is indicated by colour. Crosses indicate mean values.

Analysis of Inverse Simpson index of Daphnia gut- (2-way ANOVA) and body samples (Kruskal–Wallis test) across Metschnikowia infection status, 10 days post-exposure

*P < 0.05.
Beta diversity of Daphnia body and gut bacterial communities at 10 days post-parasite exposure
Beta diversity analyses using Bray–Curtis and Jaccard Dissimilarity, conducted separately for Daphnia guts and bodies, revealed that gut bacterial communities did not vary by host genotype, parasite exposure or their interaction (Fig. 5, Table 4). In contrast, the bacterial community composition in Daphnia bodies varied primarily by host genotype for both Bray–Curtis dissimilarity and Jaccard dissimilarity, but not by infection status or the interaction of host genotype and infection status (Table 4, Fig. S4).
Principal co-ordinate analyses of beta diversity indices of bacterial communities in the Daphnia gut (A) Bray–Curtis dissimilarity and (B) Jaccard dissimilarity and Daphnia body (C) Bray–Curtis dissimilarity and (D) Jaccard dissimilarity, 10 days after exposure to parasite spores. Colours indicate Metschnikowia infection status and shapes indicate host genotype. Ellipses represent 95% confidence intervals for each infection group.

2-Way PERMANOVAs (9999 permutations) of beta diversity indices Bray–Curtis dissimilarity and Jaccard dissimilarity across host genotype and Metschnikowia infection status 10 days post-exposure, separately for Daphnia (A) gut and (B) body bacterial communities

*P < 0.05.
Dominant bacterial orders at 10 days post-parasite exposure
Adult Daphnia gut bacterial communities consisted of 34 dominant bacterial orders (Fig. 6, Table S5). The relative abundance of Pseudomonadales was significantly higher in the guts of successfully infected Daphnia compared to uninfected ones, whereas Saccharimonadales was more abundant in the guts of uninfected Daphnia. No changes were observed in dominant bacterial orders of Daphnia body samples based on infection status (Fig. S4, Table S6).
Dominant bacterial orders in Daphnia guts 10 days after exposure to parasite spores with host genotype and Metschnikowia infection status being indicated. Bacterial orders constituting <1% of, and not present in every gut sample are classified as ‘Other’.

Discussion
In this study, we characterized bacterial community composition across 3 Daphnia magna genotypes after initial exposure (i.e. 24 h post-parasite exposure) and after successful infection (i.e. 10 days since exposure) with its fungal parasite Metschnikowia bicuspidata. The changes in diversity and composition of host–bacterial communities with respect to parasite exposure were complex: they only occurred at specific timepoints, in certain host tissues, and in a host-genotype-dependent manner. Overall, our hypotheses were only partially supported by our data. First, we hypothesized that changes in Daphnia bacterial communities would reflect the parasite's development within the host. Specifically, we expected that gut microbiomes would change in alpha and beta diversity 24 h after parasite exposure (in response to Metschnikowia attacking spores) and that these changes would occur in body microbiomes upon successful infection 10 days after exposure (as a result of the proliferation of mature spores). However, alpha or beta diversity of the gut bacterial community did not change in response to Metschnikowia attacking spores, and no bacterial community diversity or composition changes were detected in the Daphnia bodies upon successful infection. Second, we expected that whole individual microbiomes would vary by the interaction of host genotype and spore exposure, reflecting differential host-genotype-specific responses to parasite exposure. In line with this expectation, we found that whole individual microbiome alpha diversity (Inverse Simpson Index) as well as beta diversity (Jaccard dissimilarity and Bray–Curtis dissimilarity) varied significantly by the interaction of host genotype and infection status. These whole individual differences in microbiome diversity and community composition were not driven by changes specifically within the gut or body tissue, but instead only occurred at the whole-individual level. Despite some genotype-specific variation, specific ZOTUs were found to be indicative of both parasite exposure and successful infection status. Finally, none of the microbiome changes (in alpha diversity, beta diversity and the presence of indicator ZOTUs) occurred in the medium upon adding a spore or placebo solution, highlighting that the microbiome variation observed within Daphnia likely reflects the host's biological response to parasite exposure.
Instead of the hypothesized differences, unexpected patterns in the gut and body microbiomes were observed. Gut microbiome diversity did not differ with initial parasite exposure in response to Metschnikowia ‘attacking spores’. However, upon successful infection, alpha diversity (Inverse Simpson index) was significantly lower in the gut, indicating that bacterial community composition of infected Daphnia guts is less even. This is also consistent with the dominance of the group Pseudomonadales. Both of these changes in gut bacterial communities (i.e. community evenness and relative abundance of dominant bacterial groups) occurred upon successful infection but not after the initial parasite exposure. Surprisingly, there were no changes in beta diversity in gut microbiomes at either timepoint (i.e. upon initial parasite exposure or successful infection), despite an overall higher abundance of the Order Pseudomonadales after successful infection. This suggests that infected and uninfected Daphnia guts largely contain the same set of ZOTUs. Further, changes in the relative abundance of Pseudomonadales ZOTUs between infected and uninfected guts may be compensated by relative abundance changes of ZOTUs in other taxonomic groups, thus leading to similar beta diversity despite the overall enrichment of the Order Pseudomonadales, and lower community evenness in infected Daphnia guts. While lower community evenness only in guts was not expected for hosts successfully infected with a systemic parasite such as Metschnikowia, the pattern is consistent with alpha diversity changes that occur in wild Daphnia guts infected with the gut parasite Caullerya mesnili (Rajarajan et al., Reference Rajarajan, Wolinska, Walser, Mäder and Spaak2022b), as well as general patterns of lower gut microbiome diversity due to infection in a wide range of animal hosts from insects (Fredensborg et al., Reference Fredensborg, Fossdal, Kálvalíð, Johannesen, Stensvold, Nielsen and Kapel2020) to vertebrate hosts such as fish (Llewellyn et al., Reference Llewellyn, McGinnity, Dionne, Letourneau, Thonier, Carvalho, Creer and Derome2016) and snakes (Romer et al., Reference Romer, Grinath, Moe and Walker2022). One possible explanation for this in D. magna could be that mechanical damage inflicted by mature ascospores in the terminal stages of an infection drive starker gut microbiome changes than those caused by attacking spores in the initial stages of an infection.
The Order Pseudomonadales was previously found to be associated with Daphnia sp. in the D. longispina complex infected with the eukaryotic gut parasite Caullerya mesnili in the wild (Rajarajan et al., Reference Rajarajan, Wolinska, Walser, Mäder and Spaak2022b). In the present study, 88.7% of reads in this order belonged to the genus Pseudomonas (data not shown). Pseudomonas sp. have beneficial effects on Daphnia: for example, they have been associated with successful host embryonic development from dormant eggs (Mushegian et al., Reference Mushegian, Burcklen, Schär and Ebert2016) and increased tolerance to mercury exposure (Fong et al., Reference Fong, De Guzman, Lamborg and Sison-Mangus2019). Therefore, the enrichment of Pseudomonas strains in Metschnikowia-infected Daphnia may be related to parasite tolerance. On the other hand, Pseudomonas sp. may constitute the so-called ‘pathobionts’ that are enriched when the host is in a state of ‘dysbiosis’ (Hooks and O'Malley, Reference Hooks and O'Malley2017). For instance, whole-individual homogenate of healthy D. magna showed antibacterial activity against, and suppressed biofilm formation in the bacterium Pseudomonas aeruginosa (Khattab et al., Reference Khattab, Abo-Taleb, Abdelaziz, El-Tabakh, El-feky and Abu-Elghait2022). Compromised suppression of such biofilm formation within the gut microbiomes of successfully infected Daphnia may potentially contribute to the increased relative abundance of Pseudomonas sp. Thus, specific investigations are required to confirm the functional role of this taxon and its contribution to host health and immunity.
The extent of host genotype influence on Daphnia microbiome composition is debated (Frankel-Bricker et al., Reference Frankel-Bricker, Song, Benner and Schaack2020; Rajarajan et al., Reference Rajarajan, Wolinska, Walser, Dennis and Spaak2022a). Specifically, D. magna gut microbiome composition varied by host genotype in multiple laboratory-based investigations (Callens et al., Reference Callens, De Meester, Muylaert, Mukherjee and Decaestecker2020; Frankel-Bricker et al., Reference Frankel-Bricker, Song, Benner and Schaack2020). However, genotypes that displayed variation in gut microbiome composition in a laboratory setting do not show similar variation when raised in natural lake water (Hegg et al., Reference Hegg, Radersma and Uller2021). Consistent with this finding, gut microbiome diversity and composition of control (i.e. not parasite-exposed) D. magna in the present study did not vary by host genotype at either timepoint. However, whole individual- and body microbiome compositions varied by genotype at the 24-h and 10-day timepoints, respectively. This suggests that genotype-specific variation in Daphnia bacterial community composition may primarily occur in the Daphnia body (see Fig. S3). The mechanism of this genotype-specific variation, particularly in the Daphnia body, is still unknown. However, one potential mechanism may be related to cellular immune response within Daphnia.
In the present investigation, bacterial community composition in whole individuals after initial parasite exposure varied by the interaction of host genotype and exposure, but not by parasite exposure alone, and was not driven by composition changes specifically within the gut or body tissue. This pattern may be explained by Daphnia's immune response to parasite spores. Invertebrate bacterial communities are modulated by the innate immune system (reviewed in Nyholm and Graf, Reference Nyholm and Graf2012). Metschnikowia spores that breach the Daphnia gut barrier and enter the body cavity elicit an immune response in the form of haemocyte upregulation (Stewart Merrill et al., Reference Stewart Merrill, Hall, Merrill and Cáceres2019). The magnitude of Daphnia haemocyte response to parasite exposure is generally strongly host-genotype-specific (Auld et al., Reference Auld, Edel and Little2012a, Reference Auld, Graham, Wilson and Little2012b) though it may be considerably flexible in the wild, based on environmental conditions and co-infection with other parasites (Westphal and Stewart Merrill, Reference Westphal and Stewart Merrill2022). We speculate that host-genotype-specific bacterial community responses to parasite exposure in the present study may be due to a host-genotype-dependent immune response to Metschnikowia ‘attacking spores’. To our knowledge, such a genotype-specific, cellular immune response to parasite infection in Daphnia is only reported to occur in the Daphnia body cavity or haemocoel, and not, for example, in the gut (Auld et al., Reference Auld, Edel and Little2012a; Stewart Merrill et al., Reference Stewart Merrill, Hall, Merrill and Cáceres2019).
Initial parasite exposure counterintuitively altered bacterial community evenness and composition only in whole individuals, and not specifically in the Daphnia gut or body. This suggests that the host microbiome's response to parasite exposure may not be localized to a specific tissue at this stage, because the parasite may trigger a systemic response by both attacking the gut and eliciting a haemocyte response in the body. Further, changes in the relative abundance of specific bacterial taxa may drive this pattern. Of the 19 total ZOTUs identified as indicative of Metschnikowia exposure, only 1 (ZOTU4220, Order: Saccharimonadales) was identified at both timepoints and was consistently enriched in uninfected Daphnia when guts and bodies were pooled for analysis (see Fig. S5). Moreover, no ZOTUs were indicative of the addition of a spore or placebo solution into the medium, suggesting that the relative abundance of these ZOTUs shifted only within Daphnia, 24 h after Metschnikowia exposure. The order Saccharimonadales was also significantly enriched in uninfected Daphnia guts 10 days post-exposure (Table S5). However, the functional role of this taxon in zooplankton remains unknown.
These results raise questions about the extent of reversibility in bacterial community diversity and composition changes during and after infection. For instance, not all Metschnikowia attacking spores result in a successful infection; Daphnia individuals may clear the infection before spores reproduce (Stewart Merrill and Cáceres, Reference Stewart Merrill and Cáceres2018). In the present study, only microbiomes of hosts that either developed a successful infection or were not exposed to Metschnikowia were sequenced. To test the potential role of bacterial communities in the outcome of infection, future studies could include hosts that were exposed to, but cleared the parasite, and further link microbiome changes with cellular immune response such as haemocyte upregulation. Since host-associated bacterial communities substantially influence the fitness of a wide range of animal hosts (Suzuki, Reference Suzuki2017; Gould et al., Reference Gould, Zhang, Lamberti, Jones, Obadia, Korasidis, Gavryushkin, Carlson, Beerenwinkel and Ludington2018; Fontaine et al., Reference Fontaine, Mineo and Kohl2022), changes in bacterial community composition after initial parasite exposure may have downstream fitness effects on the host, regardless of whether a successful infection is established. Our study shows that both initial parasite exposure and successful infection drive host-genotype-specific changes in bacterial community diversity and composition, highlighting the importance of these bacterial communities in host–parasite dynamics.
Supplementary material
The supplementary material for this article can be found at https://doi.org/10.1017/S0031182024000787
Data availability statement
Raw 16S rRNA gene sequence data is available in the Sequence Read Archive (SRA) under Project ID PRJNA1143512. Processed data and reproducible R code can be found at https://doi.org/10.25678/0008HE.
Acknowledgements
We would like to thank the Disease Evolutionary Ecology group (IGB Berlin) for providing Daphnia genotypes and the in vivo Metschnikowia strain, and the Spaak group (Eawag) for experimental support and constructive discussions. We would also like to thank the Aquatic Biology group at KU Leuven, Kulak and Elvira Lafuente (Eawag) for helpful discussions about experiment design and data analysis. The Genetic Diversity Centre (GDC) at ETH Zürich provided considerable support with library preparation and sequencing. We also extend a special thanks to Cansu Çetin for motivating the first author to write this manuscript. We are grateful to 3 anonymous reviewers for their valuable comments that helped strengthen different versions of this manuscript.
Authors contributions
AR, ED, LB, PS and JW conceived and designed the study. AR performed experiments. JCW and AR analysed and interpreted amplicon sequencing data with input from JW, ED and PS. AR wrote the manuscript with input from JW, ED, LB and PS.
Financial support
This work was funded by Eawag (Swiss Federal Institute of Aquatic Science and Technology) and a joint ‘lead agency’ grant from the German Science Foundation (WO 1587/6-1 to JW) and Swiss National Science Foundation (310030 L 166628 to PS).
Competing interests
The authors declare there are no conflicts of interest.
Ethical standards
Not applicable.


 Open access