


“It’s basically the third election in a row that Donald Trump has cost us the race, and it’s like, three strikes, you’re out.” ~Larry Hogan (R), Former Governor of Maryland (Watson Reference Watson2022)
Since the conclusion of his presidency, former President Donald Trump has retained his place as the Republican Party’s leader through endorsements of GOP hopefuls—a stark departure from previous one-term presidents. Whether that influence serves the party beyond his own interests, however, remains unclear. Centrist Republicans including Larry Hogan are quick to ascribe blame to Trump for their party’s electoral shortcomings. Others disagree: Governor Henry McMaster (R-SC) proclaimed that a Trump reelection would “see a burst of freedom and prosperity unlike any we have ever seen before” (Seddiq and Metzger Reference Seddiq and Metzger2023). This article addresses this dispute and estimates whether Trump’s endorsement matters to voters in a general election. Trump’s endorsements do not always fall along clear ideological lines, with policy stances often taking a backseat to personality or professed affinity for the former president. Thus, we also seek to situate the importance of a Trump endorsement among candidates with different policy stances and test whether endorsements or policies—if either—matter more to voters and also whether one can compensate for the other.
The 2022 midterm elections demonstrated the continued importance of studying the “Trump effect” on contemporary American politics. One simulation found that Republicans endorsed by Trump in their primary performed 5 percentage points worse than they would have had they not received his endorsement (The Economist 2022). A similar analysis found that candidates who did not receive a Trump endorsement overperformed expectations by 2.2 percentage points (Wallach Reference Wallach2022). Association with Trump appears to be a liability for Republican candidates.
Scholarly evidence suggests that controversial presidents and policies have derailed parties’ midterm fortunes in the past. Gronke, Koch, and Wilson (Reference Gronke, Koch and Wilson2003) found strong evidence that congressional elections are proxies for a voter’s approval of the president. Nyhan et al. (Reference Nyhan, McGhee, Sides, Masket and Greene2012) extended this research and found that the Democratic Party lost an additional 25 House seats in the 2010 midterms due to vulnerable Democrats’ support of President Obama’s signature health care legislation. Ballard, Hassell, and Heseltine (Reference Ballard, Hassell and Heseltine2021) offered evidence that a Trump endorsement depressed Republicans’ chances of winning in 2018. We build on this literature in three distinct ways: (1) we use an experiment rather than observational evidence; (2) we test the effect of a former president as opposed to a current one; and (3) we randomize both endorsement and policy stances simultaneously to reconcile the two competing effects.
THEORY
Previous research demonstrated a significant impact of partisan and celebrity endorsements in intraparty primary elections (Dominguez Reference Dominguez2011; Garthwaite and Moore Reference Garthwaite and Moore2013; Kousser et al. Reference Kousser, Lucas, Masket and McGhee2015). Some scholars argue that party elites determine their party’s nominee before voting even begins (Cohen et al. Reference Cohen, Karol, Noel and Zaller2008). Our study builds on this literature by exploring how endorsements can impact voters’ likelihood to support a candidate in a general election rather than a primary election. Indeed, Trump’s persona and cult of personality uniquely mesh celebrity with political power, suggesting that his endorsement might be especially powerful in determining election outcomes.
Ballard, Hassell, and Heseltine (Reference Ballard, Hassell and Heseltine2021) analyzed the influence of Trump’s endorsements in 2018 congressional races. They found that the financial boost of Trump’s endorsements was outweighed by an increase in opposition fundraising. Trump’s endorsements energized Democratic voters while failing to mobilize Republican. Additionally, Ballard, Hassell, and Heseltine (Reference Ballard, Hassell and Heseltine2021) found that Trump’s endorsements decreased candidates’ chances of winning, showing that successful Republicans won despite—not because of—Trump’s support. Conversely, whereas Republican electoral shortcomings in 2018 were linked to Trump’s low overall favorability, Trump “approvers” were more likely to turn out than disapprovers, thereby reducing the Trump penalty for down-ballot Republicans (Cohen Reference Cohen2019). Moreover, voters are increasingly distrustful of opposing partisans, often casting votes against rivals rather than for allies, which suggests that liberal voters may be mobilized against Trump’s preferred candidate (Garzia and da Silva Reference Garzia and da Silva2022; Iyengar et al. Reference Iyengar, Lelkes, Levendusky, Malhotra and Westwood2019).
We thus hypothesized that a Trump endorsement in a general election would galvanize some Republican support for that candidate but foster even stronger Democratic backlash, thereby generating a net effect harmful to Republican candidates. We tested this hypothesis by building on Ballard, Hassell, and Heseltine’s research (Reference Ballard, Hassell and Heseltine2021). Instead of relying on observational data and matching techniques to test the effect of endorsements on electoral outcomes, we used a factorial survey experiment that eliminates endogeneity.
Furthermore, we added a policy dimension to our analysis to directly compare policy effects with endorsement effects. Lenz (Reference Lenz2012) showed that voters often choose a candidate for non-ideological reasons and subsequently adjust their views to align with their preferred candidate’s stances. Previous research considered the ideological effect of Trump on the Republican Party and its voters, finding that Trump-aligned politicians were perceived as more conservative (Amira Reference Amira2022; Hopkins and Noel Reference Hopkins and Noel2022). Conservative voters have expressed a willingness to support liberal policy stances when Trump is behind them, revealing that his endorsements can supersede the impact of ideological cues (Agadjanian Reference Agadjanian2021; Barber and Pope Reference Barber and Pope2019). Beyond the standalone effect of a Trump endorsement—itself a meaningful result—we contribute to this body of literature by directly testing a policy effect and an endorsement effect against each other, asking which—if either—matters more.
METHODS AND DATA
We conducted an online survey of 1,346 American adults provided by Lucid October 25–27, 2022, using quotas to ensure that the sample was balanced on education, race/ethnicity, income, age, region, and gender. Respondents were asked whether they identified as a Democrat, a Republican, or an Independent or held a different political affiliation. These options were reclassified into three categories: Democrat (N=619), Republican (N=481), and Independent/Other (N=246). Independents who lean toward one party were classified into that party (Piccoli, Blatte, and Zachem Reference Piccoli, Blatte and Zachem2024). Although we discuss Independents throughout this study, we urge caution in making specific inferences and conclusions for them, given the small sample.
All respondents read the following preface: “Suppose you are deciding who to vote for in the General Election. Terry Mitchell is a 56-year-old white male. He is the Republican nominee for a congressional seat in your state.” All respondents then were randomly assigned to view either “conventional” Republican positions (i.e., “unconventional” Democratic stances)—that is, lowering taxes, limiting government’s role in health care, and opposing citizenship for undocumented immigrants—or “unconventional” Republican positions (i.e., “conventional” Democratic stances)—that is, increasing taxes, expanding government’s role in health care, and supporting citizenship for undocumented immigrants. We did not assume that all co-partisans subscribed to these views but rather that these stances resonate with a typical Republican respondent. All mentions of “conventional” and “unconventional” in this article refer to conventional and unconventional Republican stances. Approximately half (N=669) of the respondents received the conventional scenario; the other half (N=677) received the unconventional scenario. Respondents then received one of three Trump endorsement conditions. Approximately one third of respondents (N=427) were told that Trump had given Mitchell his “complete and total endorsement.” Another third (N=471) was informed that Trump “will NOT be endorsing” Mitchell. The final third of respondents (N=448) served as a control, with no mention of Trump at all.
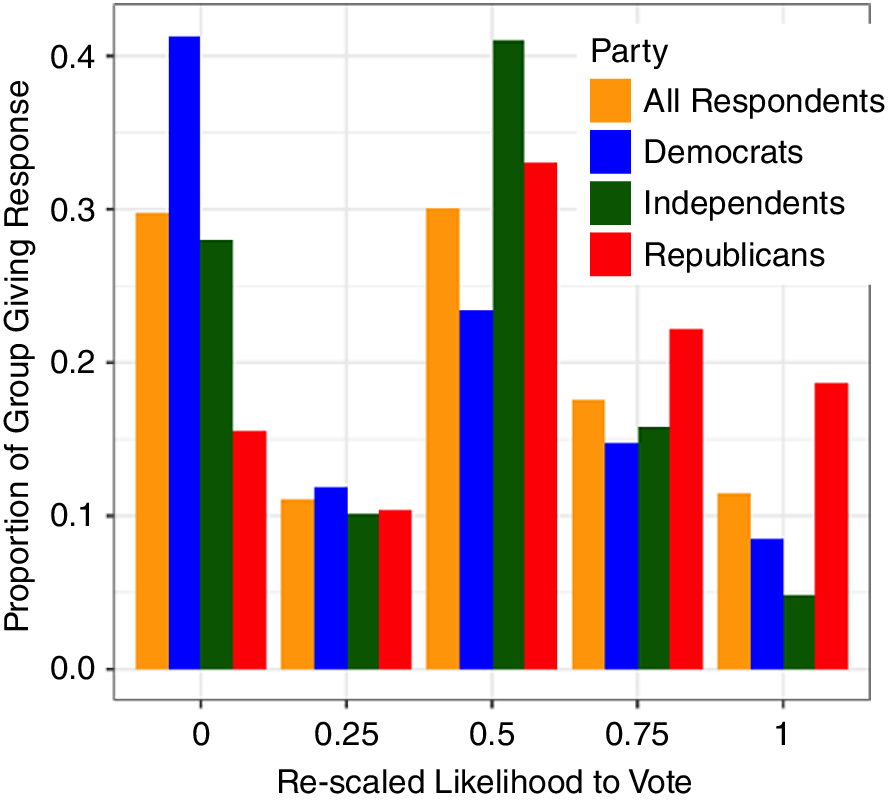
Respondents were asked how likely they were to vote for Mitchell, measured on a 5-point ordinal scale with “1” representing the lowest likelihood. This question is an appropriate proxy for electoral outcomes because previous research has demonstrated that voters’ expressed likelihood of voting causally impacts their probability of voting (Gerber and Rogers Reference Gerber and Rogers2009). To aid interpretation, we re-scaled the variable to range from 0 to 1. The mean (re-scaled) likelihood of voting for Mitchell was 0.34 for Democrats, 0.40 for Independents, and 0.55 for Republicans (figure 1 presents the distribution of responses). The online appendix includes estimates with a binary version of likelihood to vote. As alternative proxies for electability, respondents also were asked to rate their favorability of Mitchell from 0 to 100 and to indicate the share of $100 they would be willing to donate to Mitchell, using a 0–100 slider akin to the favorability rating. Results from both questions are in the online appendix.
Distribution of Reponses to the Likelihood to Vote Question (Re-Scaled)
In our analysis, we subsetted our data based on respondents’ party affiliation and further segmented them according to the specific policy and endorsement conditions to which they were exposed. However, it is important to note that our research design led to relatively small sample sizes, resulting in limited statistical power for specific analyses. Where it is relevant, we report the results of a post-hoc statistical-power test using the estimated means and standard deviations for the coefficients being compared. Nevertheless, we still found significant effects throughout our study and other strongly suggestive results. Higher-powered replications and extensions would validate our suggestive results.
ANALYSIS
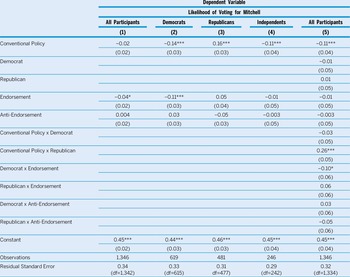
Table 1 presents the results of our main analysis. We evaluated the endorsement effect, the policy effect, and both effects in turn, beginning with the endorsement effect.
Main Model

Notes: Baseline for columns 1–4 is unconventional policy and no mention of an endorsement. Baseline for column 5 is unconventional policy, no mention of an endorsement, and Independent. *p<0.1, **p<0.05, ***p<0.01.
The Endorsement Effect
We began by asking a straightforward yet consequential question: Does the former president hurt Republican candidates? As shown in table 1, our findings provide suggestive evidence that he does. Column 1 presents the overall effect of an endorsement across all respondents. Consistent with our expectation, a Trump endorsement reduced the likelihood of voting for Mitchell by 4 points. Notably, this effect was significant at the 10% but not the 5% threshold, and a post-hoc analysis revealed that our statistical power is 0.36. We thus limit our conclusions in this section to suggestive findings; however, the effect is close to traditional significance despite the low statistical power. Moreover, our robustness checks found significant effects in identical directions to the suggestive results that we found in our main analysis. The online appendix presents these results in more detail. The result on the Trump “anti-endorsement” was close to a precise zero, suggesting that if an effect exists, it is asymmetrical, with a Trump anti-endorsement unlikely to match the negative impact of an endorsement.
Columns 2, 3, and 4 present the results of the same model segregated by party. We found that Democrats reduced their likelihood to vote for Mitchell by 11 points when faced with a Trump endorsement. This is the only significant endorsement effect that we observed in any within-party estimate. Republicans increased their likelihood by 5 points with an endorsement, but this was not a significant finding (p=0.16), although our statistical power remained low (0.33). An alternative outcome—favorability—yielded an effect more consistent with a positive Trump effect among Republicans (p=0.07); however, the result remains marginally significant. Independents displayed a negligible change from zero. Likewise, the effect of a Trump anti-endorsement was insignificant for all groups.
Although we found differential significance levels among the within-party effects of Democrats and Republicans, whether the magnitudes were significantly different is unresolved. We conducted a Wald test that asked whether the two coefficients together equal zero (and thus offset each other). We were unable to reject the null hypothesis that they do (p=0.73) and thus refrained from making any definitive conclusions regarding differential partisan effects. Within that context, these results suggest two key asymmetries underlying the “Trump” effect. First, among all respondents: the effect of a Trump anti-endorsement was close to a precise zero across all conditions, whereas the effect of an endorsement strongly hinted at a reduction in likelihood to vote. Second, across parties: a Trump endorsement led to a significant negative change in likelihood of voting among Democrats but no significant change among Republicans and a marginally significant change for the entire sample. We cannot conclusively determine whether the two parties exhibit different effects. However, in light of the marginally significant finding on the overall sample, our results suggest that a Trump endorsement hurts Republican candidates’ perceptions on balance.
…a Trump endorsement led to a significant negative change in likelihood of voting among Democrats but no significant change among Republicans…
Considering a Trump Endorsement and Policy Together
This section shifts our analysis to the second set of variables in table 1: policy. Column 1 includes policy as an independent variable, with unconventional stances as the baseline. Because we aggregated across parties, it is unsurprising that the effect of conventional Republican stances was insignificant. Columns 2, 3, and 4, however, indicate that all three partisan groups were significantly affected by policy. Democrats decreased their likelihood of voting by 14 points, Republicans increased by 16 points, and Independents decreased by 11 points. These findings broadly demonstrate that policy stances do matter for voters and, interestingly, that Independents appear to prefer Democratic to Republican policies.
Columns 2, 3, and 4 also allow us to question whether the endorsement and policy effects differ within each party. The results in columns 3 and 4 show that they do for Republicans and suggestively for Independents. For each party, we conducted a Wald test on the endorsement and conventional policy coefficients. For Democrats, there was little evidence that the two coefficients differed (p=0.47). The same, however, cannot be stated for Republicans, for whom a Wald test confirmed that there was a significant difference in the magnitude of the effects (p=0.02). Republicans’ likelihood of voting was more sensitive to policy than it was to Trump. Similarly, for Independents, an analogous test shows suggestive evidence of policy mattering more than an endorsement (p=0.094).
Together, these results support another partisan asymmetry: Republicans (and likely Independents) valued aligned policy more than an endorsement whereas Democrats showed no evidence of opposing either more vehemently. We believe that the similarity in effects is due to the unique connotation that Trump carries. Trump and the values that he represents are, in the view of Democrats, as negative as a set of antithetical policy views. If the Trump effect is negative, we find that it stems most directly from Democratic furor.
Republicans (and likely Independents) valued aligned policy more than an endorsement, whereas Democrats showed no evidence of opposing either more vehemently.
Can an Endorsement Counteract (Mis)Aligned Policies?
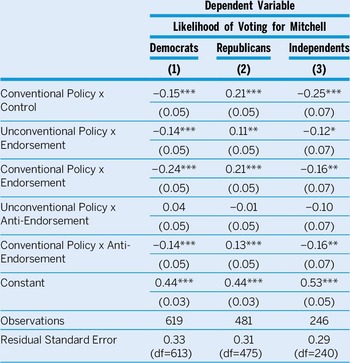
Our final analysis questions whether one effect can compensate for the other. We interacted the two treatments and present the results in table 2. We segregated by party because our sole focus was within-party effects. Columns 1, 2, and 3 present the results for Democrats, Republicans, and Independents, respectively. Our baseline was set to an unconventional Republican with no mention of an endorsement—the most realistic manifestation of Republicans attempting to distance themselves from Trump. Thus, all point estimates are relative to that hypothetical scenario. For Democrats, all three endorsement levels—when combined with conventional Republican policy stances—and an endorsement with unconventional Republican policy stances significantly reduced the likelihood of voting for our hypothetical candidate. It is not surprising that the switch in policy stances would reduce the likelihood regardless of whether Trump endorsed the candidate. However, these results reveal that the mere presence of a Trump endorsement can counteract policy signals, reducing Democrats’ likelihood of voting for a candidate with conventional Democratic policy stances by 14 points.
Interactive Model
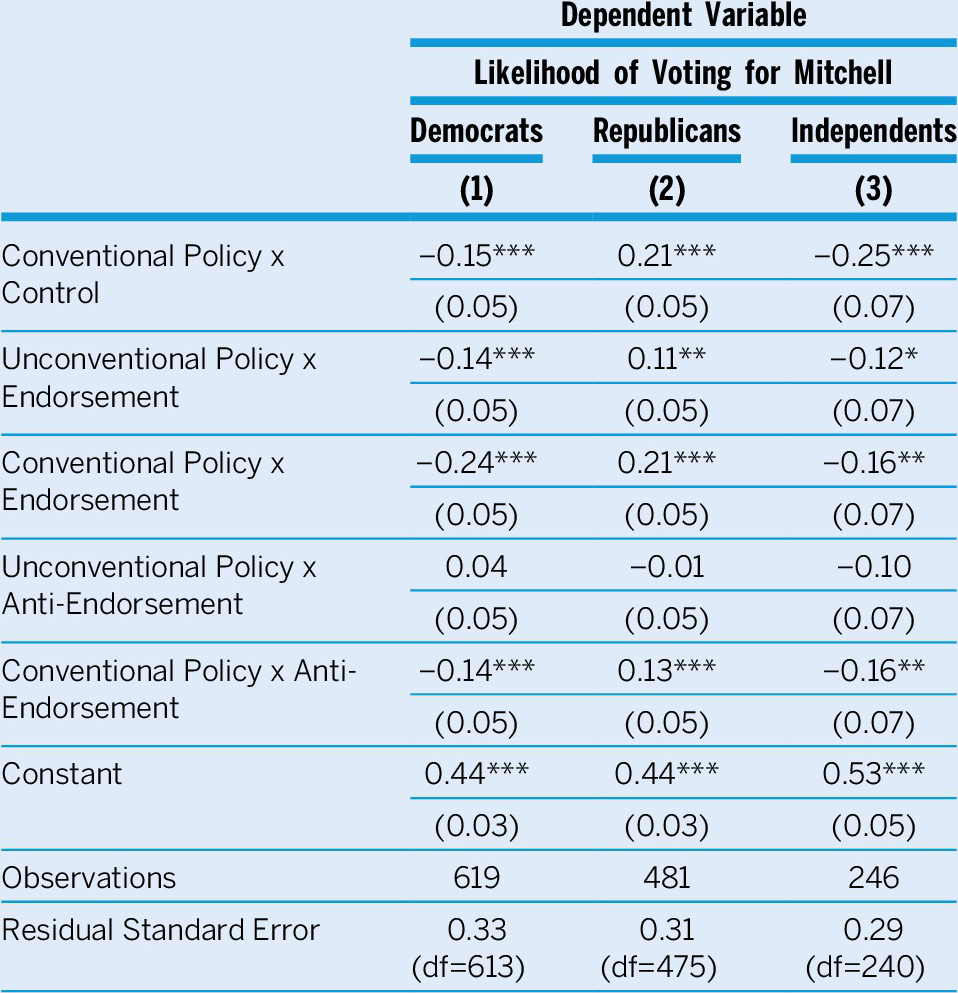
Notes: Baseline is unconventional policy and no mention of an endorsement. *p<0.1, **p<0.05, ***p<0.01.
Column 2 presents results for Republicans. We observe nearly identical trends, but in the opposite direction: all three endorsement levels paired with conventional stances increased Republicans’ likelihood to vote for Mitchell. More notably, an endorsement paired with unconventional stances significantly increased Republicans’ likelihood of supporting Mitchell by 11 points. Like Democrats, Republicans could be swayed by the mere presence of a Trump endorsement.
Column 3 shows results for Independents. We continue to urge caution in focusing on the magnitudes, with sample sizes of approximately 60 for each treatment pair. Nevertheless, it is notable that every estimate was negative, and the conventional treatment—whether paired with no mention of Trump or a Trump endorsement—was negative and significant. Moreover, an unconventional Republican with a Trump endorsement suggestively reduced the likelihood of supporting Mitchell by 12 points (p=0.08). A detailed analysis of this phenomenon is best left to higher-powered studies. Yet, this is an ominous sign for Republicans: the increasingly common type of Republican candidate—ideologically aligned with the party consensus with a neutral or supportive Trump—is viewed less favorably than the increasingly rare Republican willing to diverge from both party and Trump.
CONCLUSION
This article extends the literature on the effect of elite cues, revealing three asymmetries associated with former President Trump’s endorsement. Our first two asymmetries are partisan. We extended Ballard, Hassell, and Heseltine’s research (Reference Ballard, Hassell and Heseltine2021) and found suggestive evidence that an endorsement causally decreases the likelihood that a voter votes for a Republican candidate. There were significant decreases in the likelihood of voting among Democratic respondents but no significant change for Republicans. We also extended Lenz’s (Reference Lenz2012) research by asking if an ideological signal sent by a candidate retains supremacy over the signal sent from a uniquely influential leader. We found no evidence that it does for Democrats but significant evidence that it does for Republicans, our second asymmetry. Our final asymmetry was directional. We tested a newer phenomenon—the “anti-endorsement”—and found that, unlike an endorsement, it had no effect on voting behavior. We also found, however, that in specific hypothetical scenarios, both parties showed evidence of a symmetrical endorsement effect. In the presence of unconventional Republican stances, we found evidence that a Trump endorsement could counteract the effect of those stances, a significant negative change for Democrats and a positive change for Republicans.
In the presence of unconventional Republican stances, we found evidence that a Trump endorsement could counteract the effect of those stances…
Our findings contribute to a growing body of literature that disentangles the role of heuristics in a voter’s calculus. Many scholars and politicians lament the decreasing role that policy- and issue-based dialogue has in elections. For those holding that view, this study offers a sliver of hope and a slice of despair. We show that policy, especially for Republicans, continues to matter. However, we also demonstrate that policy does not always reign supreme, for Democrats provide no evidence of larger effects for policy over an endorsement. Moreover, we find that for both parties, the effect of an endorsement can partially counteract the effect of unorthodox policies, demonstrating that although the role of policy is nontrivial, it is not immune to elite signals.
Our final point concerns the (presumptive) “elephant in theroom”: the implications for upcoming elections. Even when Trump had been out of office for almost two years, he made an impact. As of this writing, Trump is the leading candidate to represent the GOP in 2024. We speculate that when he is on the ballot, those impacts will only be amplified: Trump’s presence would be a boon for Democrats and a bane for Republicans.
ACKNOWLEDGMENTS
We are grateful to Brian Schaffner and members of the Tufts Public Opinion Lab for their helpful feedback and suggestions. We thank the Tufts University Department of Political Science for its financial support and for allowing us to conduct these experiments.
DATA AVAILABILITY STATEMENT
Research documentation and data that support the findings of this study are openly available at the PS: Political Science & Politics Harvard Dataverse at https://doi.org/10.7910/DVN/QJAUTB.
CONFLICT OF INTEREST
The authors declare that there are no ethical issues or conflicts of interest in this research.
SUPPLEMENTARY MATERIAL
To view supplementary material for this article, please visit http://doi.org/10.1017/S1049096524000064.


 Open access