

Introduction
Archaeologists worldwide are now applying geochemical, biomolecular and ethnoarchaeological approaches to understand the long-term social and environmental histories of ancient pastoralism (Honeychurch & Makarewicz Reference Honeychurch and Makarewicz2016). Common early assumptions held that mobile herding societies were destined for relative invisibility in the archaeological record, but recent work has demonstrated that herding communities leave substantial material and residual records behind. This means that short-term or ephemeral occupations can be detected (Shahack-Gross et al. Reference Shahack-Gross, Marshall and Weiner2004, Reference Shahack-Gross, Simons and Ambrose2008; Égüez & Makarewicz Reference Égüez and Makarewicz2018; Égüez et al. Reference Égüez2020), and archaeologists can now reconstruct ancient mobility patterns instead of dismissing mobility as a prohibitive archaeological problem (Makarewicz Reference Makarewicz, Ventresca Miller and Makarewicz2017; Ventresca Miller & Makarewicz Reference Ventresca Miller and Makarewicz2017). To date, however, geophysical research has played a relatively minor role in the archaeology of herding societies, despite some success in detecting houses and other features at sites occupied by mobile foragers (e.g. Jones & Munson Reference Jones and Munson2005; Wiewel & Kvamme Reference Wiewel and Kvamme2014).
The archaeology of pastoralism in Africa is attracting growing global attention due to the longevity and apparent sustainability of pastoralist lifeways documented there. Applications of geophysical methods to investigate the archaeology of pastoralism across Africa, and especially south of the Sahara (for a review, see Magnavita Reference Magnavita2016), however, have been limited in number. In eastern Africa, for example, most geophysical work has been carried out at urban sites with permanent daub and coral architecture dating to the past two millennia (e.g. Fleisher et al. Reference Fleisher, Wynne-Jones, Steele and Welham2012; Wynne-Jones Reference Wynne-Jones2012; Welham et al. Reference Welham2014; Fitton & Wynne-Jones Reference Fitton and Wynne-Jones2017). Sites with earthen features have been explored in West Africa (Magnavita & Schleifer Reference Magnavita and Schleifer2004; Haour et al. Reference Haour2016; Magnavita Reference Magnavita2017; Olorunfemi et al. Reference Olorunfemi, Ogunfolakan and Oni2019), while in southern Africa, electromagnetic-induction survey at the Iron Age site of Mmadipudi Hill (Botswana) has helped to define an area of a cattle kraal and clusters of household units surrounded by thorn fencing; this, in turn, enabled the targeted excavation of a daub structure (Klehm & Ernenwein Reference Klehm and Ernenwein2016).
What features such as these might we expect at pastoralist sites? Early ethnoarchaeological research with mobile pastoralist communities in eastern Africa focused largely on material culture or taphonomic processes, and scholars generally concluded that very little would ever be left behind (Robbins Reference Robbins1973; Gifford Reference Gifford and Gould1978). Geo-ethnoarchaeological work with Maasai communities, however, suggested that livestock pens with dung deposits, livestock gates, postholes, hearths/hearthstones and refuse pits could all be archaeologically visible (Shahack-Gross et al. Reference Shahack-Gross, Marshall and Weiner2004; see also Mbae Reference Mbae and Robertshaw1990). Additional research with Samburu pastoralists emphasised potential diversity in pastoralist residential site types, including large ceremonial camps, that may each have distinctive spatial layouts and other material signatures (Grillo Reference Grillo2012).
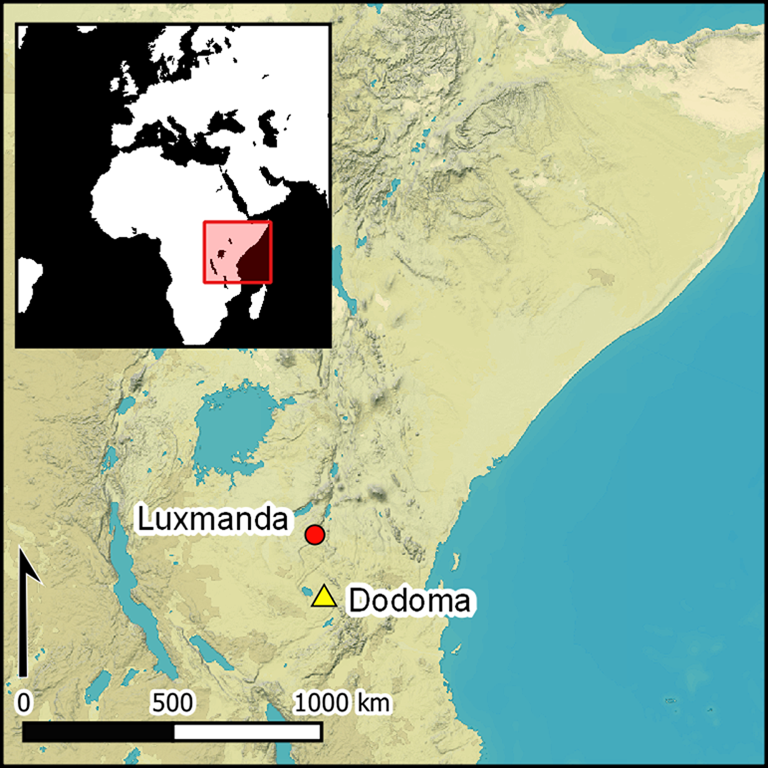
Here, we present a geophysical survey of Luxmanda, Tanzania, the most extensive known settlement site of the Pastoral Neolithic (c. 5000–1200 years BP), a period during which pastoralism became widespread across eastern Africa. To our knowledge, this is the first geophysical survey of a pre-Iron Age pastoralist site in Sub-Saharan Africa. A key goal of fieldwork at Luxmanda is to understand the site's spatial structure by attempting to identify features (e.g. hearths, livestock pens) and patterns in the structure of refuse deposits that might speak to social dynamics at the settlement (Gifford-Gonzalez Reference Gifford-Gonzalez2014) and the underpinnings of persistent ecological legacies of pastoralist land use (Marshall et al. Reference Marshall2018). Geophysical survey is particularly well suited to these goals, as it enables an understanding of site scale and layout and can help target specific areas for subsequent subsurface exploration, thus improving the efficiency of fieldwork and avoiding unnecessary damage to sites. Our results demonstrate the effectiveness of the application of this method to the archaeology of herding societies in Africa and elsewhere.
Background
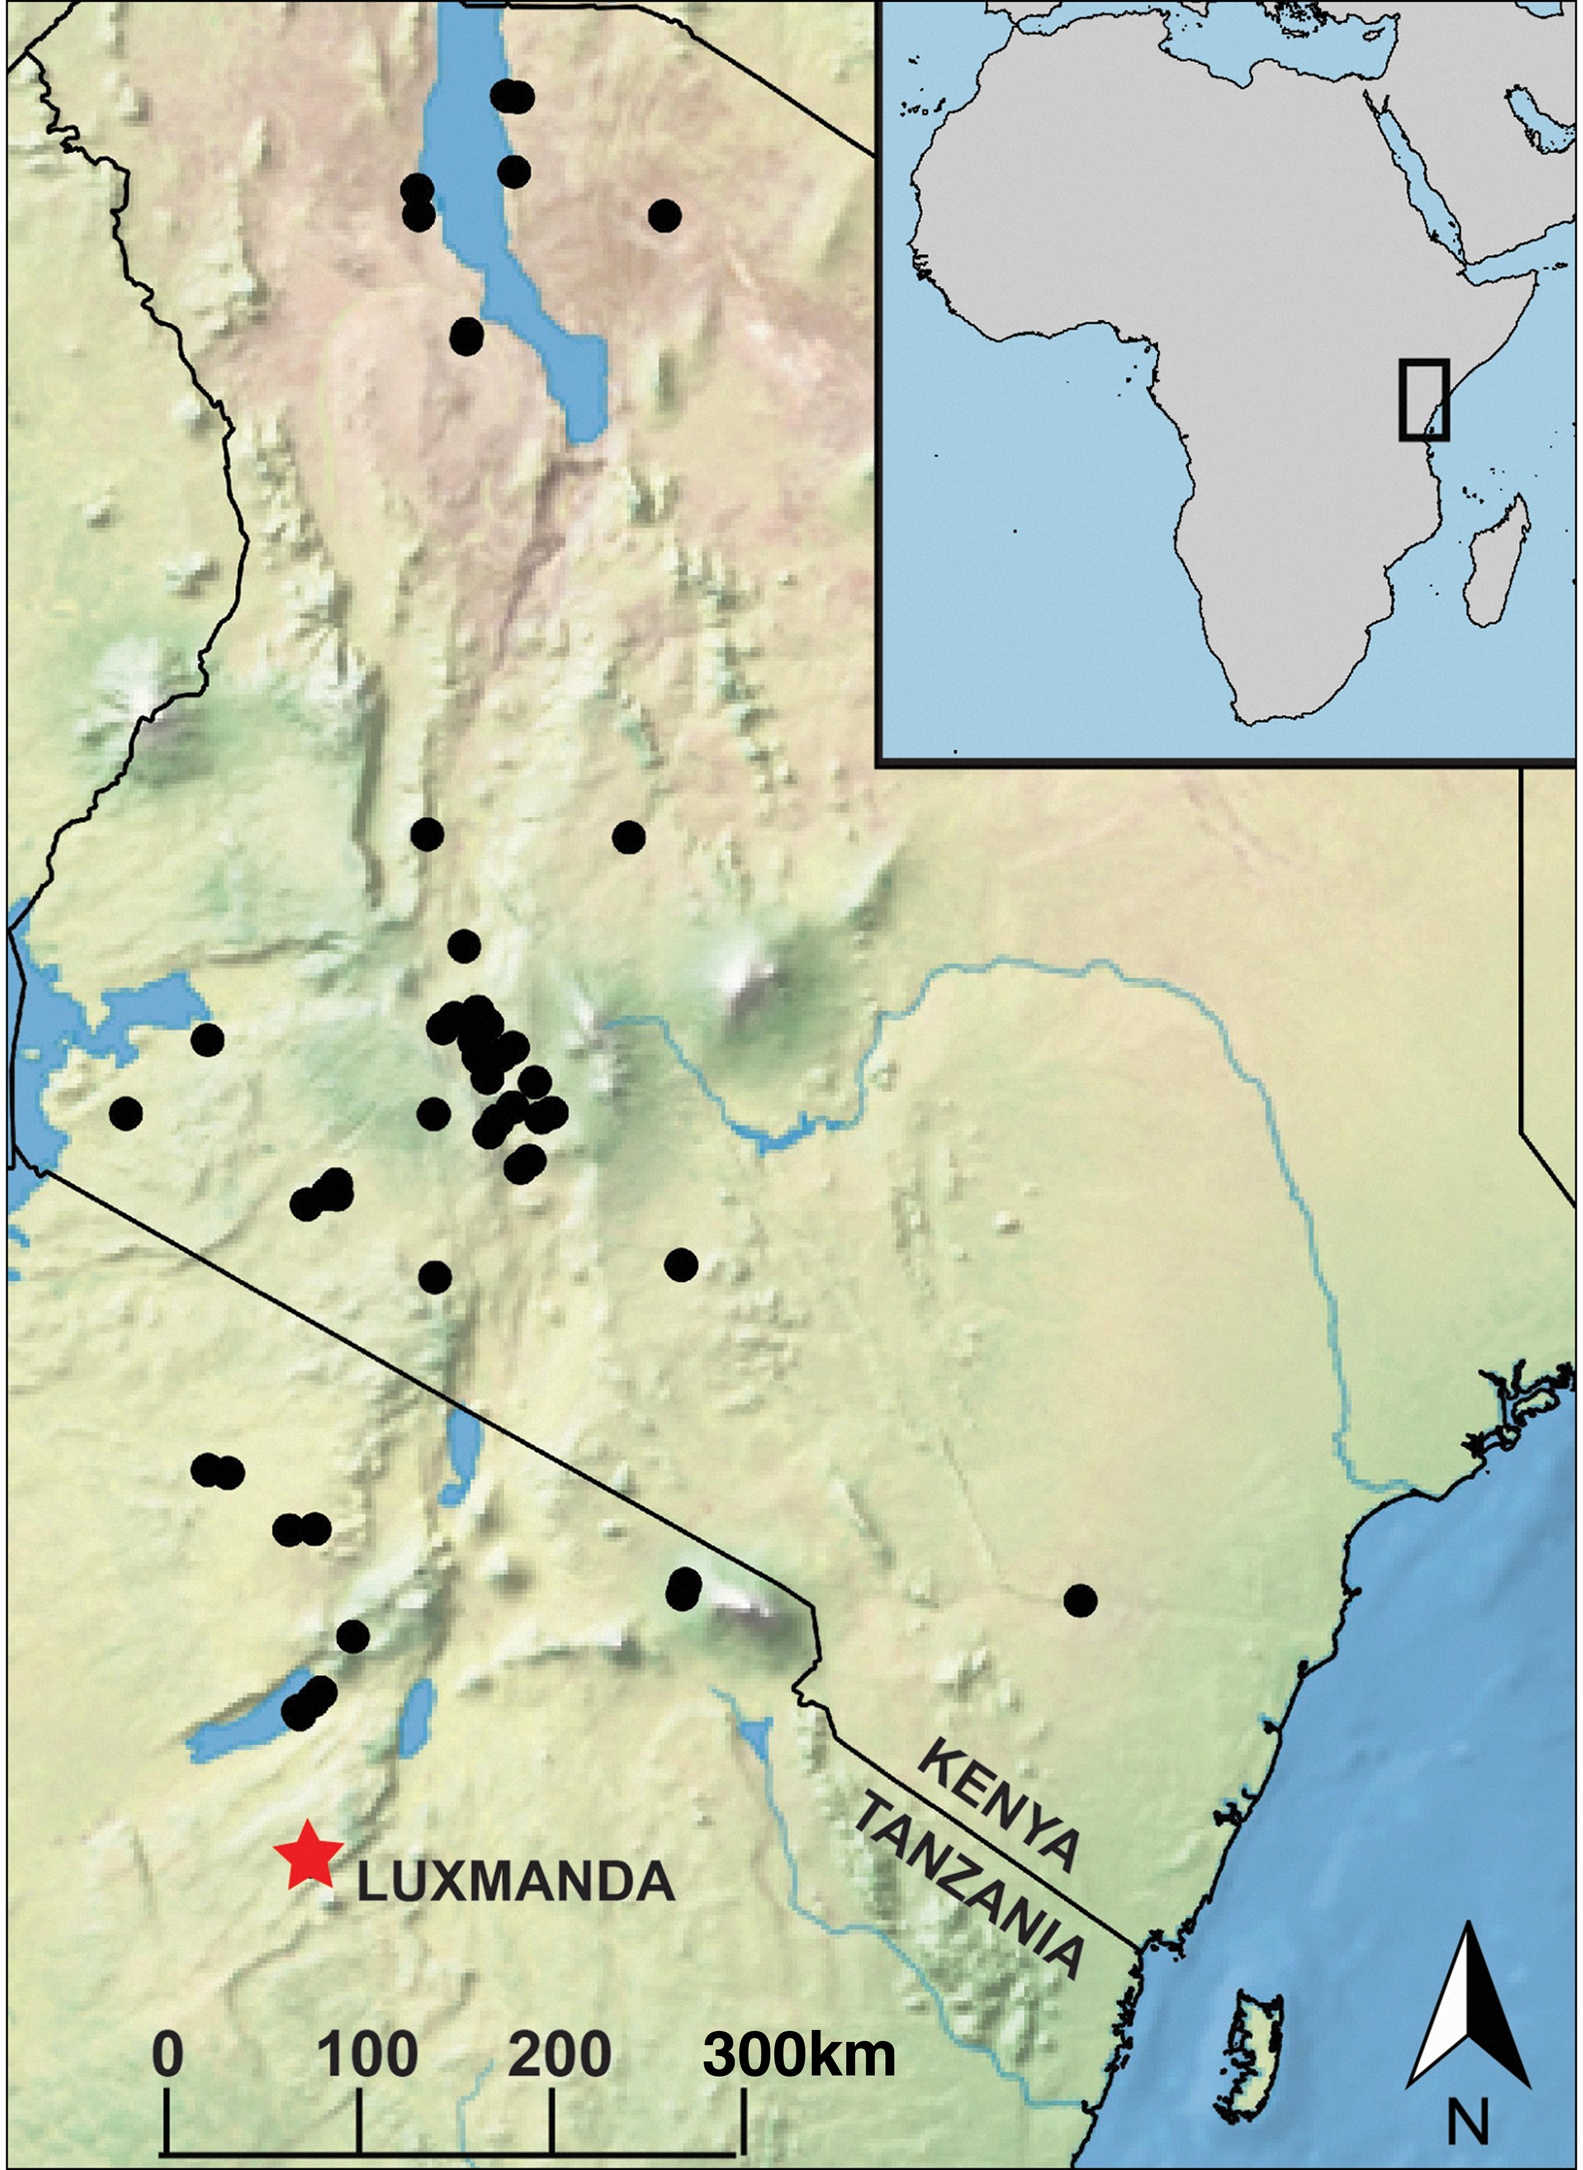
The Pastoral Neolithic is characterised by the emergence and spread of mobile pastoralism throughout much of the territory of modern-day Kenya and into northern Tanzania (Marshall et al. Reference Marshall, Grillo, Arco, Miller, Moore and Ryan2011). Pastoral Neolithic residential sites (in contrast to monumental and mortuary sites, which are also documented in this region) are characterised by large, dense middens of domestic refuse, which include pottery, lithic tools and debris, and remains of cattle, sheep, goat and occasionally donkey (Robertshaw Reference Robertshaw2021). During the 1970s and 1980s, archaeological studies of Pastoral Neolithic sites focused on the necessary work of building basic cultural sequences for the region. As such, many of these excavations concentrated on chronology and artefact typologies, which were determined through a limited number of test trenches. Analyses of settlement layout and activity areas were rare during this phase of research, except at Narosura (Odner Reference Odner1972) and Ngamuriak (Robertshaw Reference Robertshaw1990) in Kenya, where laterally extensive excavations enabled identification of features such as house floors, hearths and deposits of animal dung. The more recent discovery of the exceptionally large and well-preserved site of Luxmanda (Prendergast et al. Reference Prendergast2013, Grillo et al. Reference Grillo2018; Figure 1) has enabled a multi-faceted approach, using improved technologies, to explore the scale and spatial structure of an ancient pastoralist settlement.
Locations of Pastoral Neolithic sites in Kenya and Tanzania (black dots) and of Luxmanda (red star) (Basemap: Natural Earth) (figure credit: M. Prendergast).
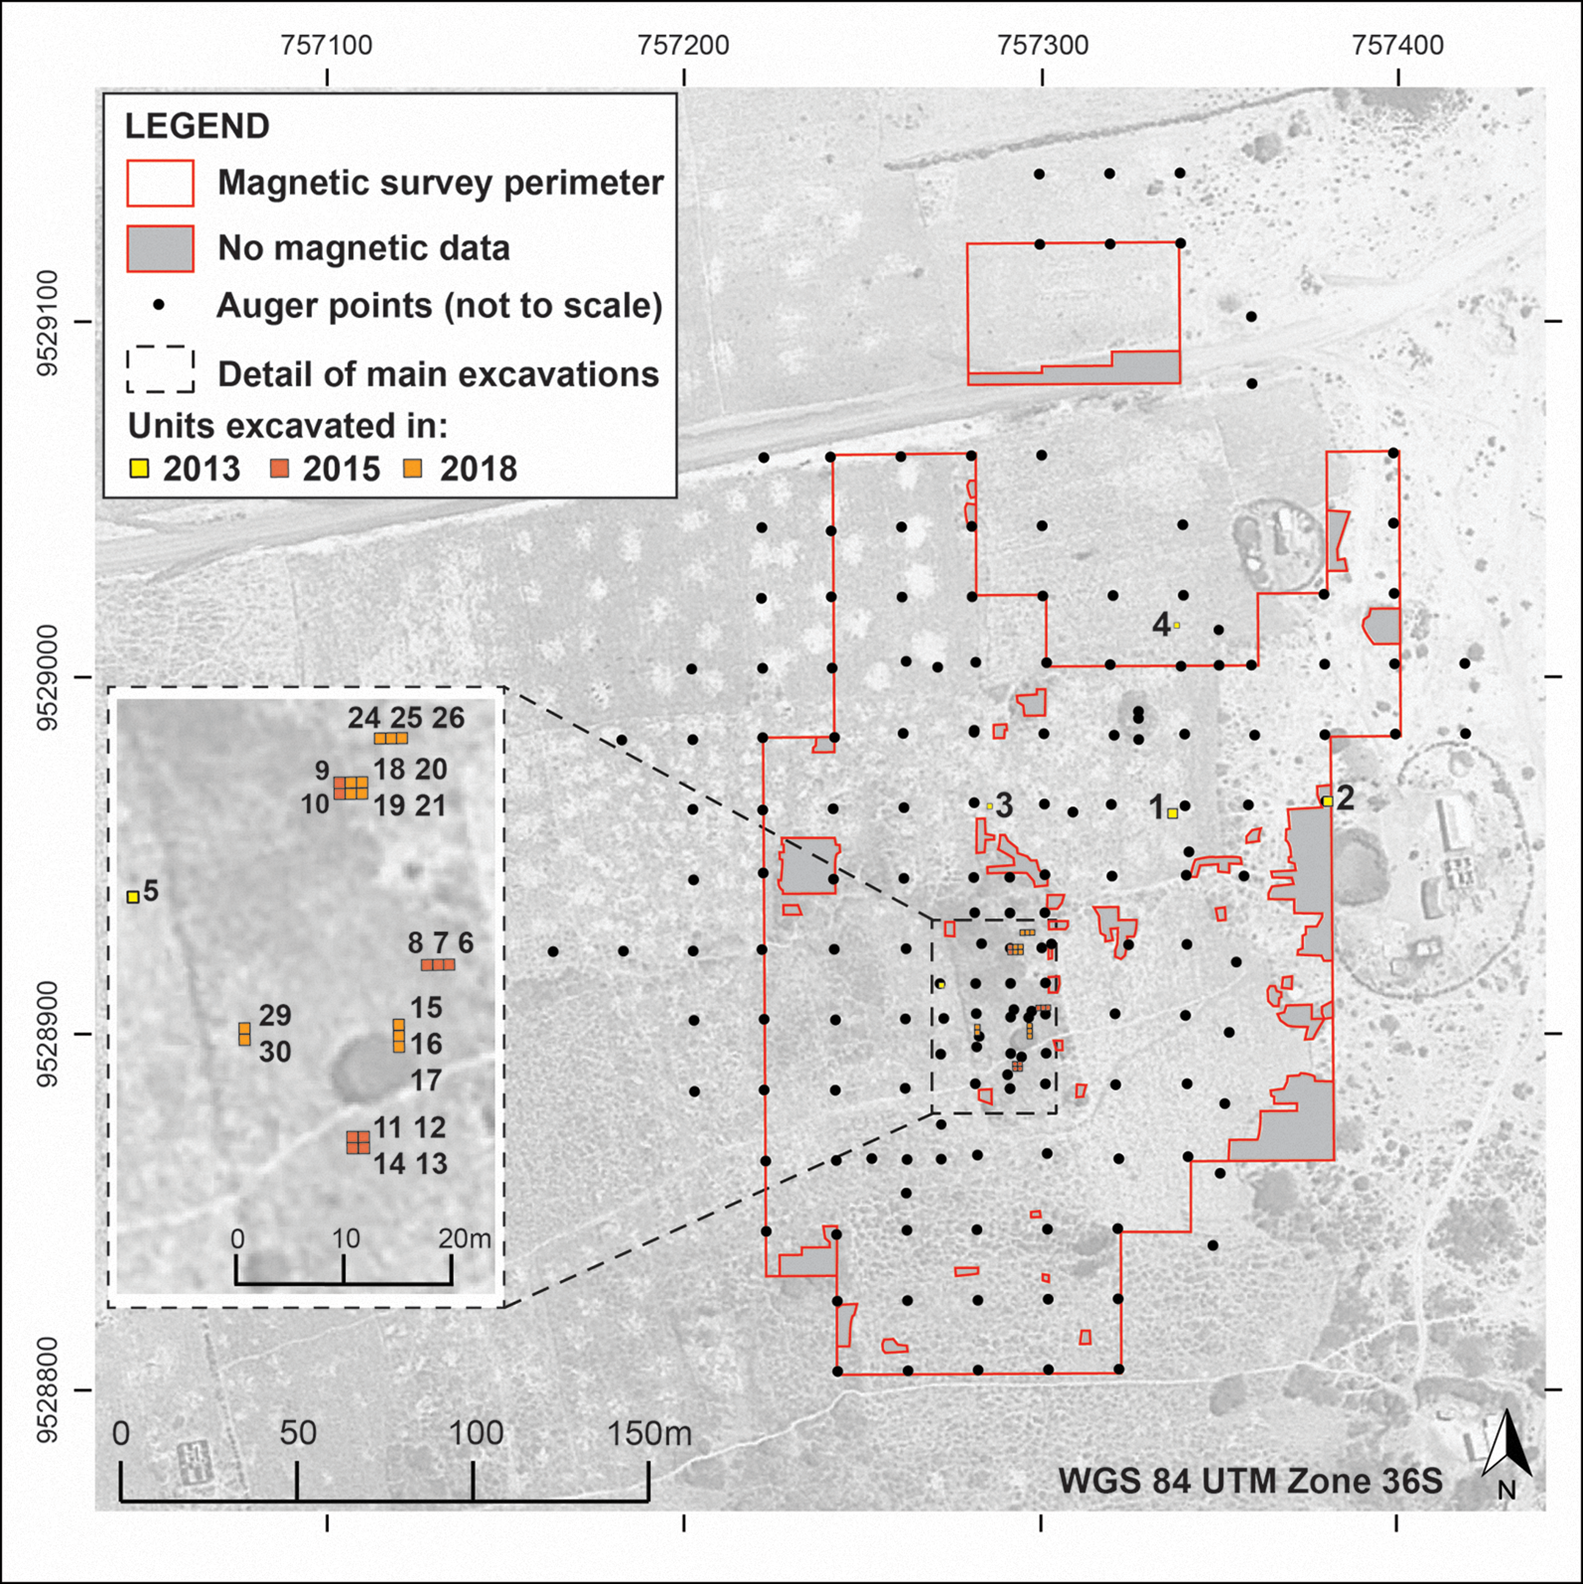
Fieldwalking and limited shovel test pits at Luxmanda in 2012 (Prendergast et al. Reference Prendergast2013), followed by test trenches in 2013, produced evidence of widely distributed domestic refuse, including pottery attributable to the ‘Narosura’ Pastoral Neolithic cultural tradition, with the initial occupation of the site dating to c. 3000 cal BP (Grillo et al. Reference Grillo2018). Field research in 2015 aimed to investigate the extent and nature of this wide distribution of material through surface collection, magnetometry (fluxgate gradiometry) survey, auger survey and formal excavation (Figure 2). An integrated and iterative approach was employed, in which multiple survey techniques were conducted simultaneously across the site grid, and results were integrated in a daily analysis to define and prioritise areas of interest for other forms of survey. The results of previous fieldwalking and surface collection surveys, for example, were used to define the initial area of magnetometry survey, but daily integration of new fieldwalking data informed the redefinition of high-priority areas of interest for subsequent magnetometry and auger surveys. The emerging magnetometry results, in conjunction with auger data, provided information that was then used to pinpoint loci for formal excavations, as well as complementary ground survey to inform the interpretation of the geophysical surveys (Grillo et al. Reference Grillo2018). In 2018, excavations were expanded to include additional areas that had been identified in 2015 as potentially fruitful. This article focuses on the results of the magnetometry and directly related aspects of excavations; more detailed information about the auger survey, excavations, material culture and subsistence at Luxmanda are published elsewhere (Grillo et al. Reference Grillo2018, Reference Grillo2020; Langley et al. Reference Langley, Prendergast and Grillo2019; Prendergast et al. Reference Prendergast, Janzen, Buckley and Grillo2019, Reference Prendergast, Grillo, Gidna and Mabulla2021; Storozum et al. Reference Storozum2021).
Plan of the Luxmanda site indicating boundaries of the magnetic survey area and excavation units (figure credit: M. Prendergast).
Geophysical survey methodology
As the 2015 field season at Luxmanda was an experiment in identifying putatively ephemeral remains of mobile pastoralists, our geophysical survey was conducted using a fluxgate magnetic gradiometer. Magnetometry is an established geophysical technique for identifying human activity areas and landscape modification in near-surface contexts. Such activities can create concentrations of enhanced magnetic particles or thermoremanent magnetisation of the soil, which can then be measured using a magnetometer as localised field strength (Clark Reference Clark2000). These measurements are used to produce a map of magnetic anomalies and potential archaeological features across a survey area, although specific causes are difficult to interpret without contextually relevant archaeological data.
The survey area (approximately 35 360m2) was divided into 20m grids and magnetic survey conducted using a Bartington Grad-601-2 Fluxgate Gradiometer (dual 1m sensors), with samples recorded at 0.125 × 0.5m intervals at a resolution of 0.1nT (Figure 3). Survey data were processed to account for stagger caused by dense vegetation, before being clipped to 3SD and georectified for analysis in ArcGIS. Surface collections (1m2 dog-leash collections) and a systematic auger survey were also carried out across the same grid (initial 20m spacing, followed by strategic infilling of the grid at select locations) to provide complementary datasets for both the surface and subsurface. Targeted excavation, following methods described by Grillo et al. (Reference Grillo2018), was then carried out in areas of the site identified as being of particular archaeological interest on the basis of the combined survey data. Soil samples were collected for magnetic susceptibility analysis during the excavation work.
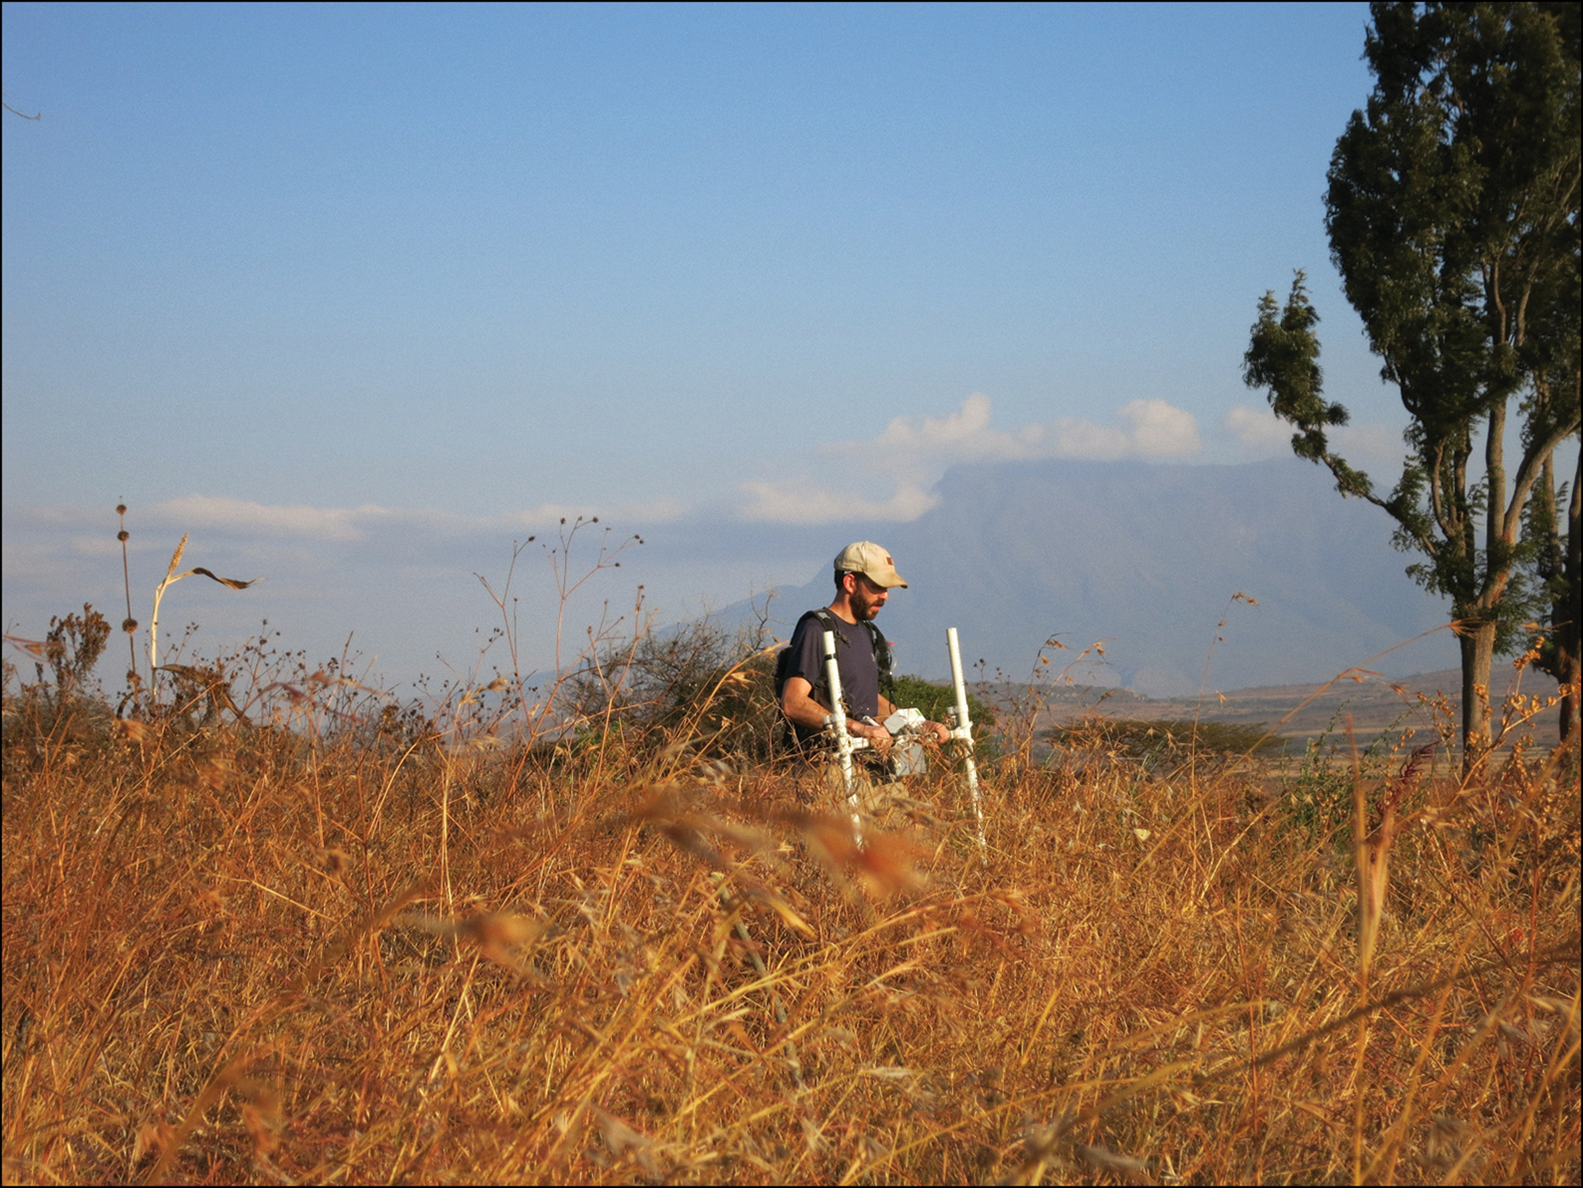
Geophysical survey at the Luxmanda site (figure credit: M. Prendergast).
Results
Fluxgate gradiometry survey
Figure 4 shows the processed and interpreted plots of the fluxgate gradiometry survey. The general principles of fluxgate gradiometry offer some broad interpretative guidelines for the results, in that areas of enhanced magnetism may indicate disturbed soils, such as pits, or human and animal activity areas. Bipolar anomalies (adjoining positive and negative poles) or dipolar anomalies (central pole surrounded by a contrasting halo) could indicate materials with their own potential magnetic fields, such as ferrous material, naturally palaeomagnetic rock, or thermoremanence caused by intense heating.
Left) Processed magnetic gradiometry data; right) interpretation of magnetic features, with areas of interest and excavations labelled (figure credit: T. Fitton).
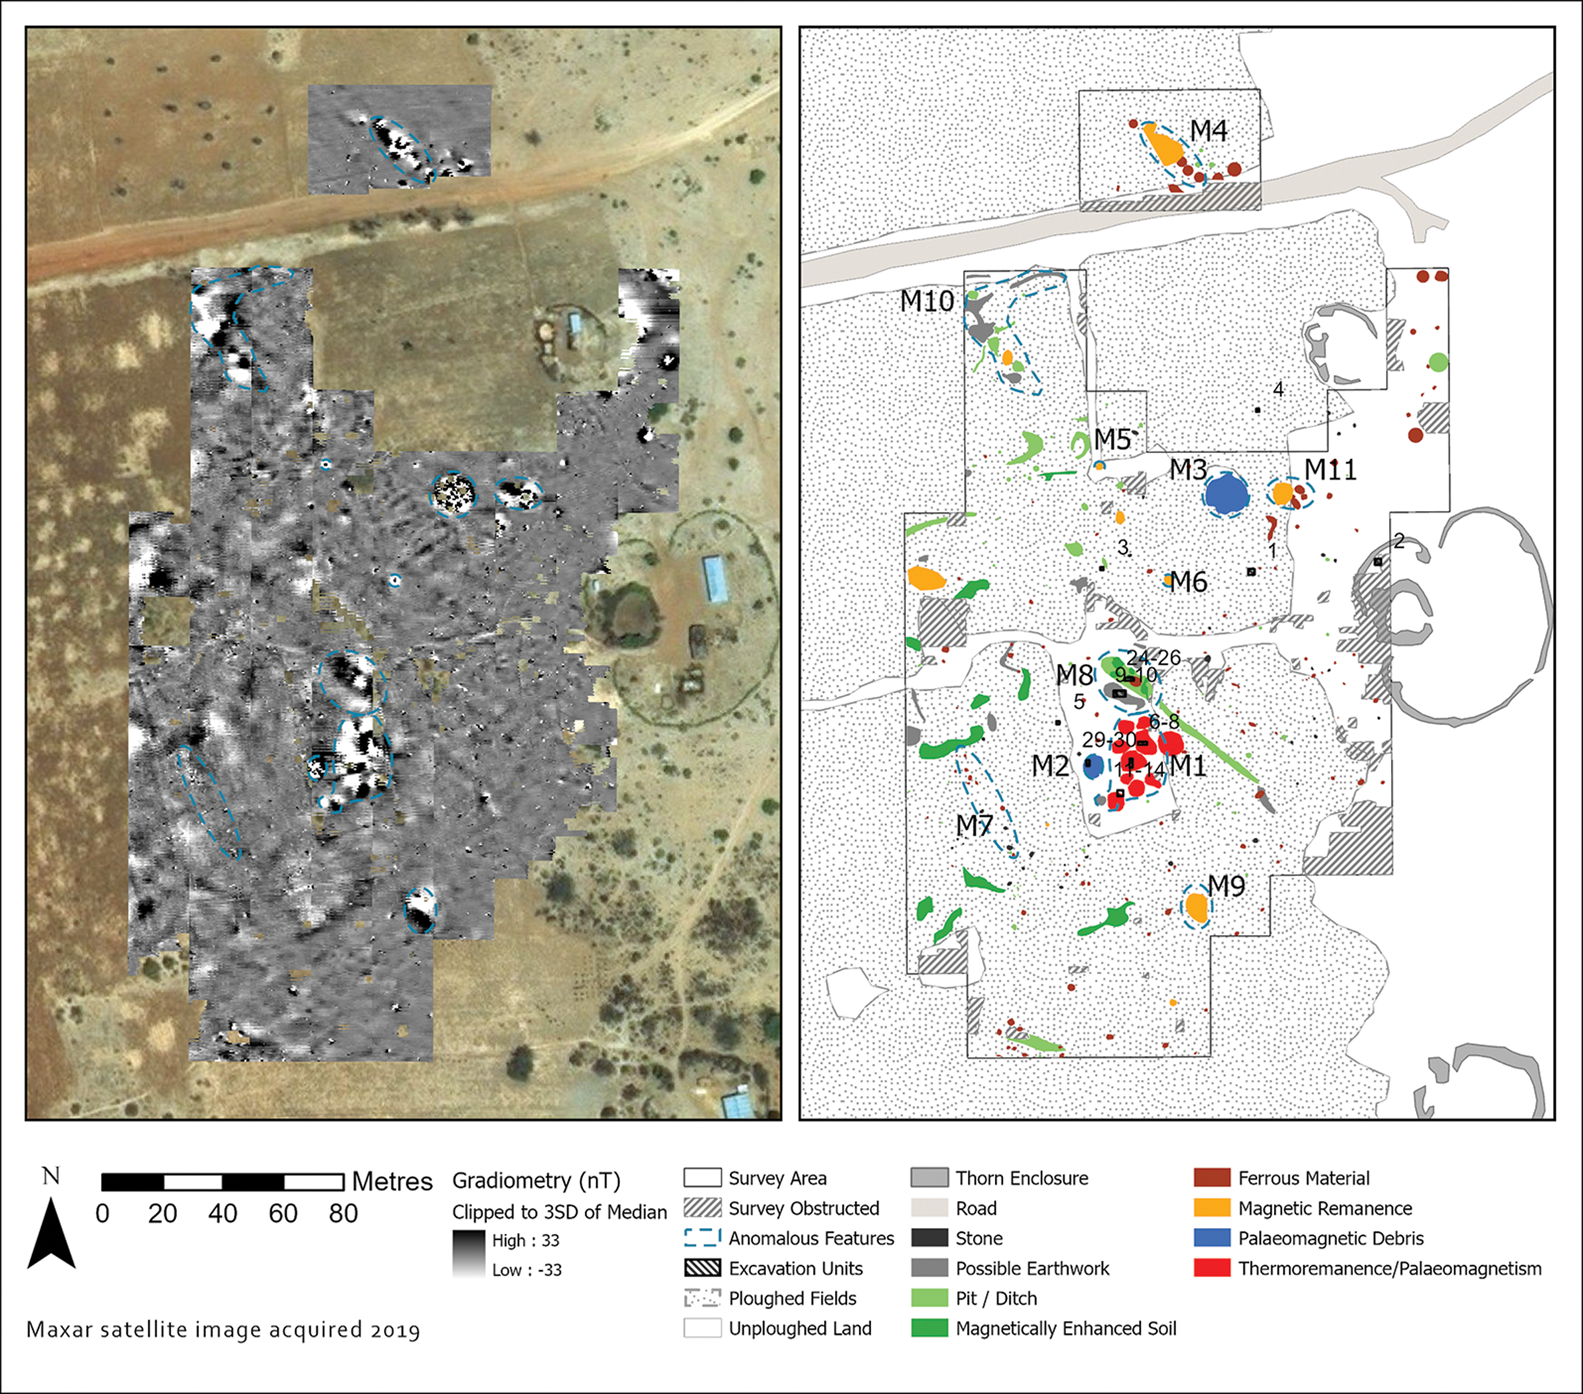
Regional variations in geology and archaeology can significantly affect the visibility of anomalies, while the orientation of buried features can create unpredictable patterns of overlapping magnetic fields. Operator experience with relevant archaeological materials in comparable contexts is therefore a significant advantage. The relative lack of published gradiometric survey work conducted in eastern Africa, however, and total absence away from the coast, meant that the interpretation of the Luxmanda gradiometry survey was, in part, informed by the complementary archaeological surveys, including fieldwalking and augering, that we conducted across the site during the same season. Areas of interest identified through gradiometry were denoted M1–M11 (Figure 4); four of these, which were investigated in 2015 and 2018, are discussed below (Figure 5).
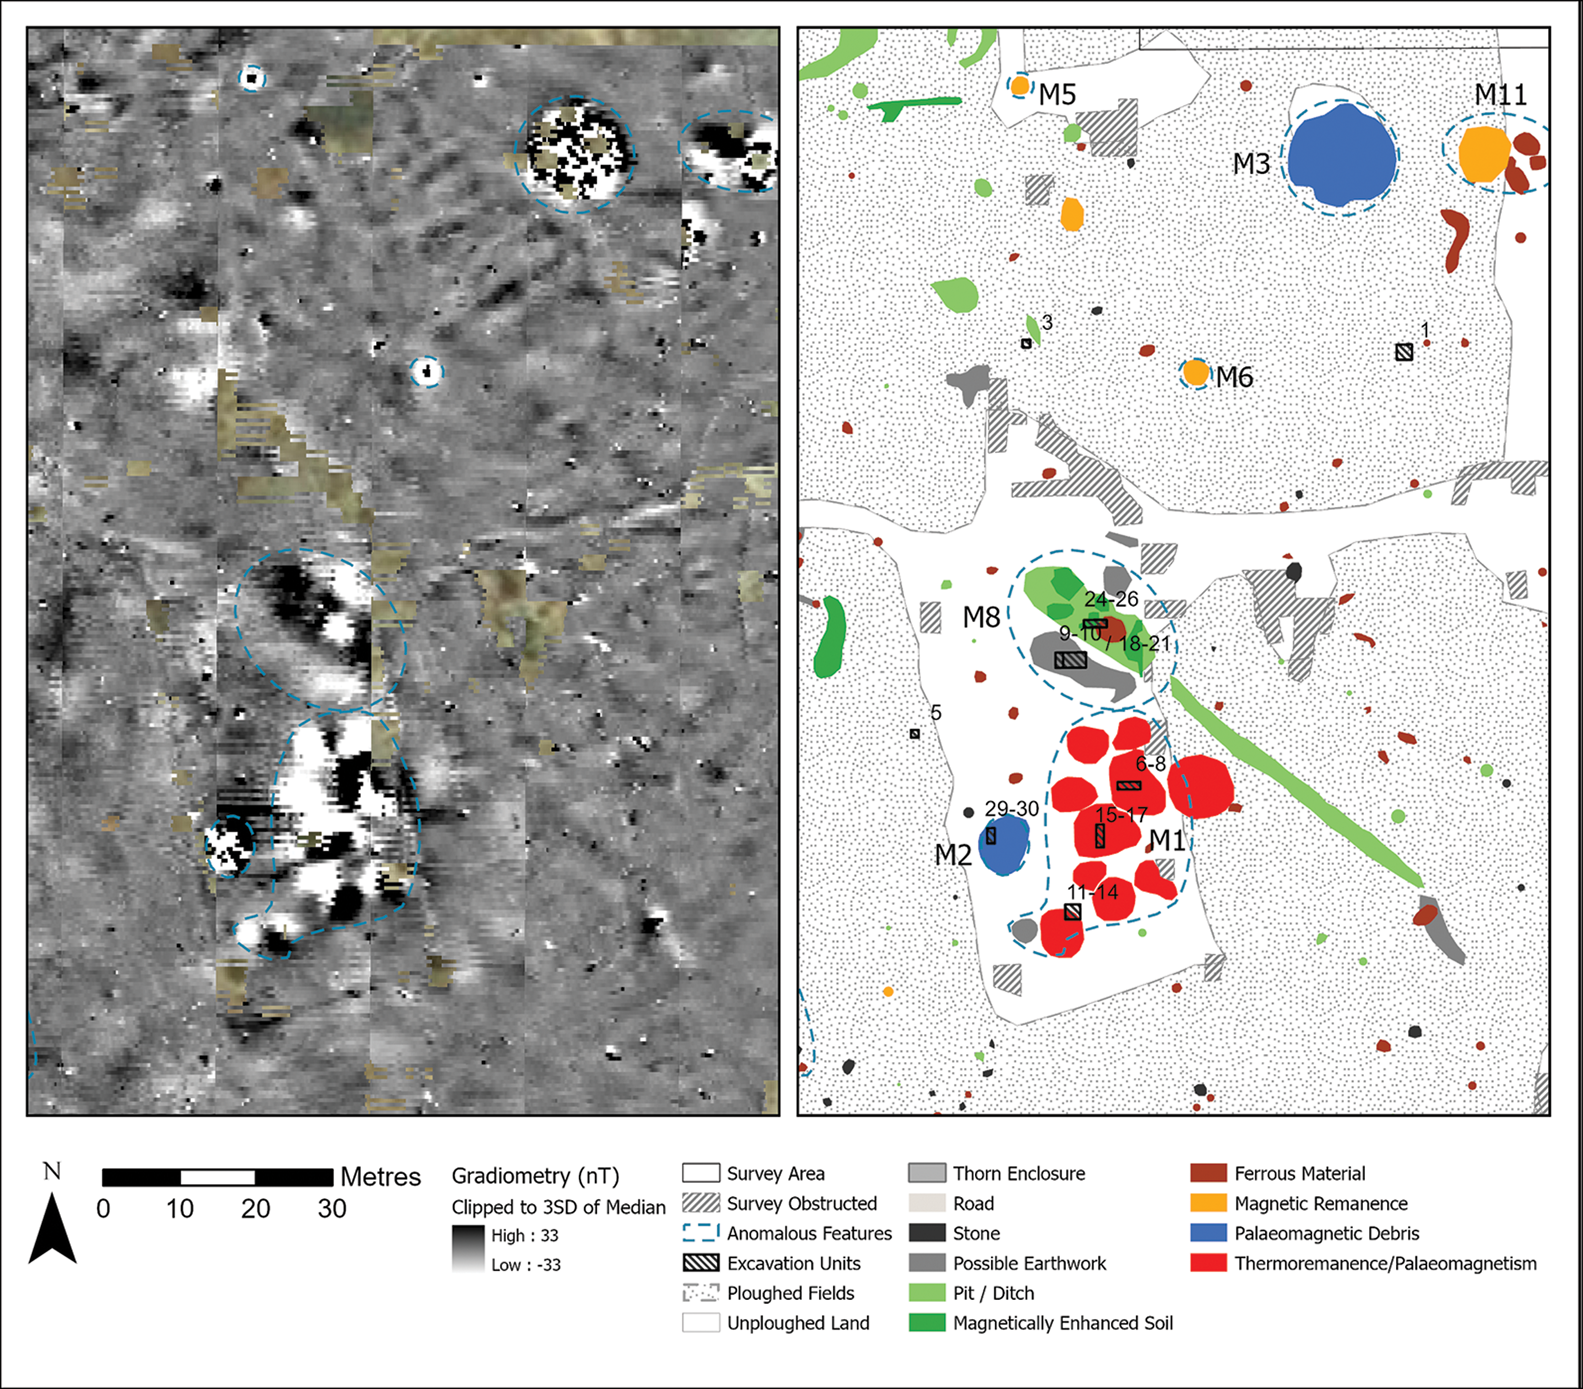
Detail of main area of interest: left) processed magnetic gradiometry data; right) interpretation of archaeological features (figure credit: T. Fitton).
Surface collection and auger survey
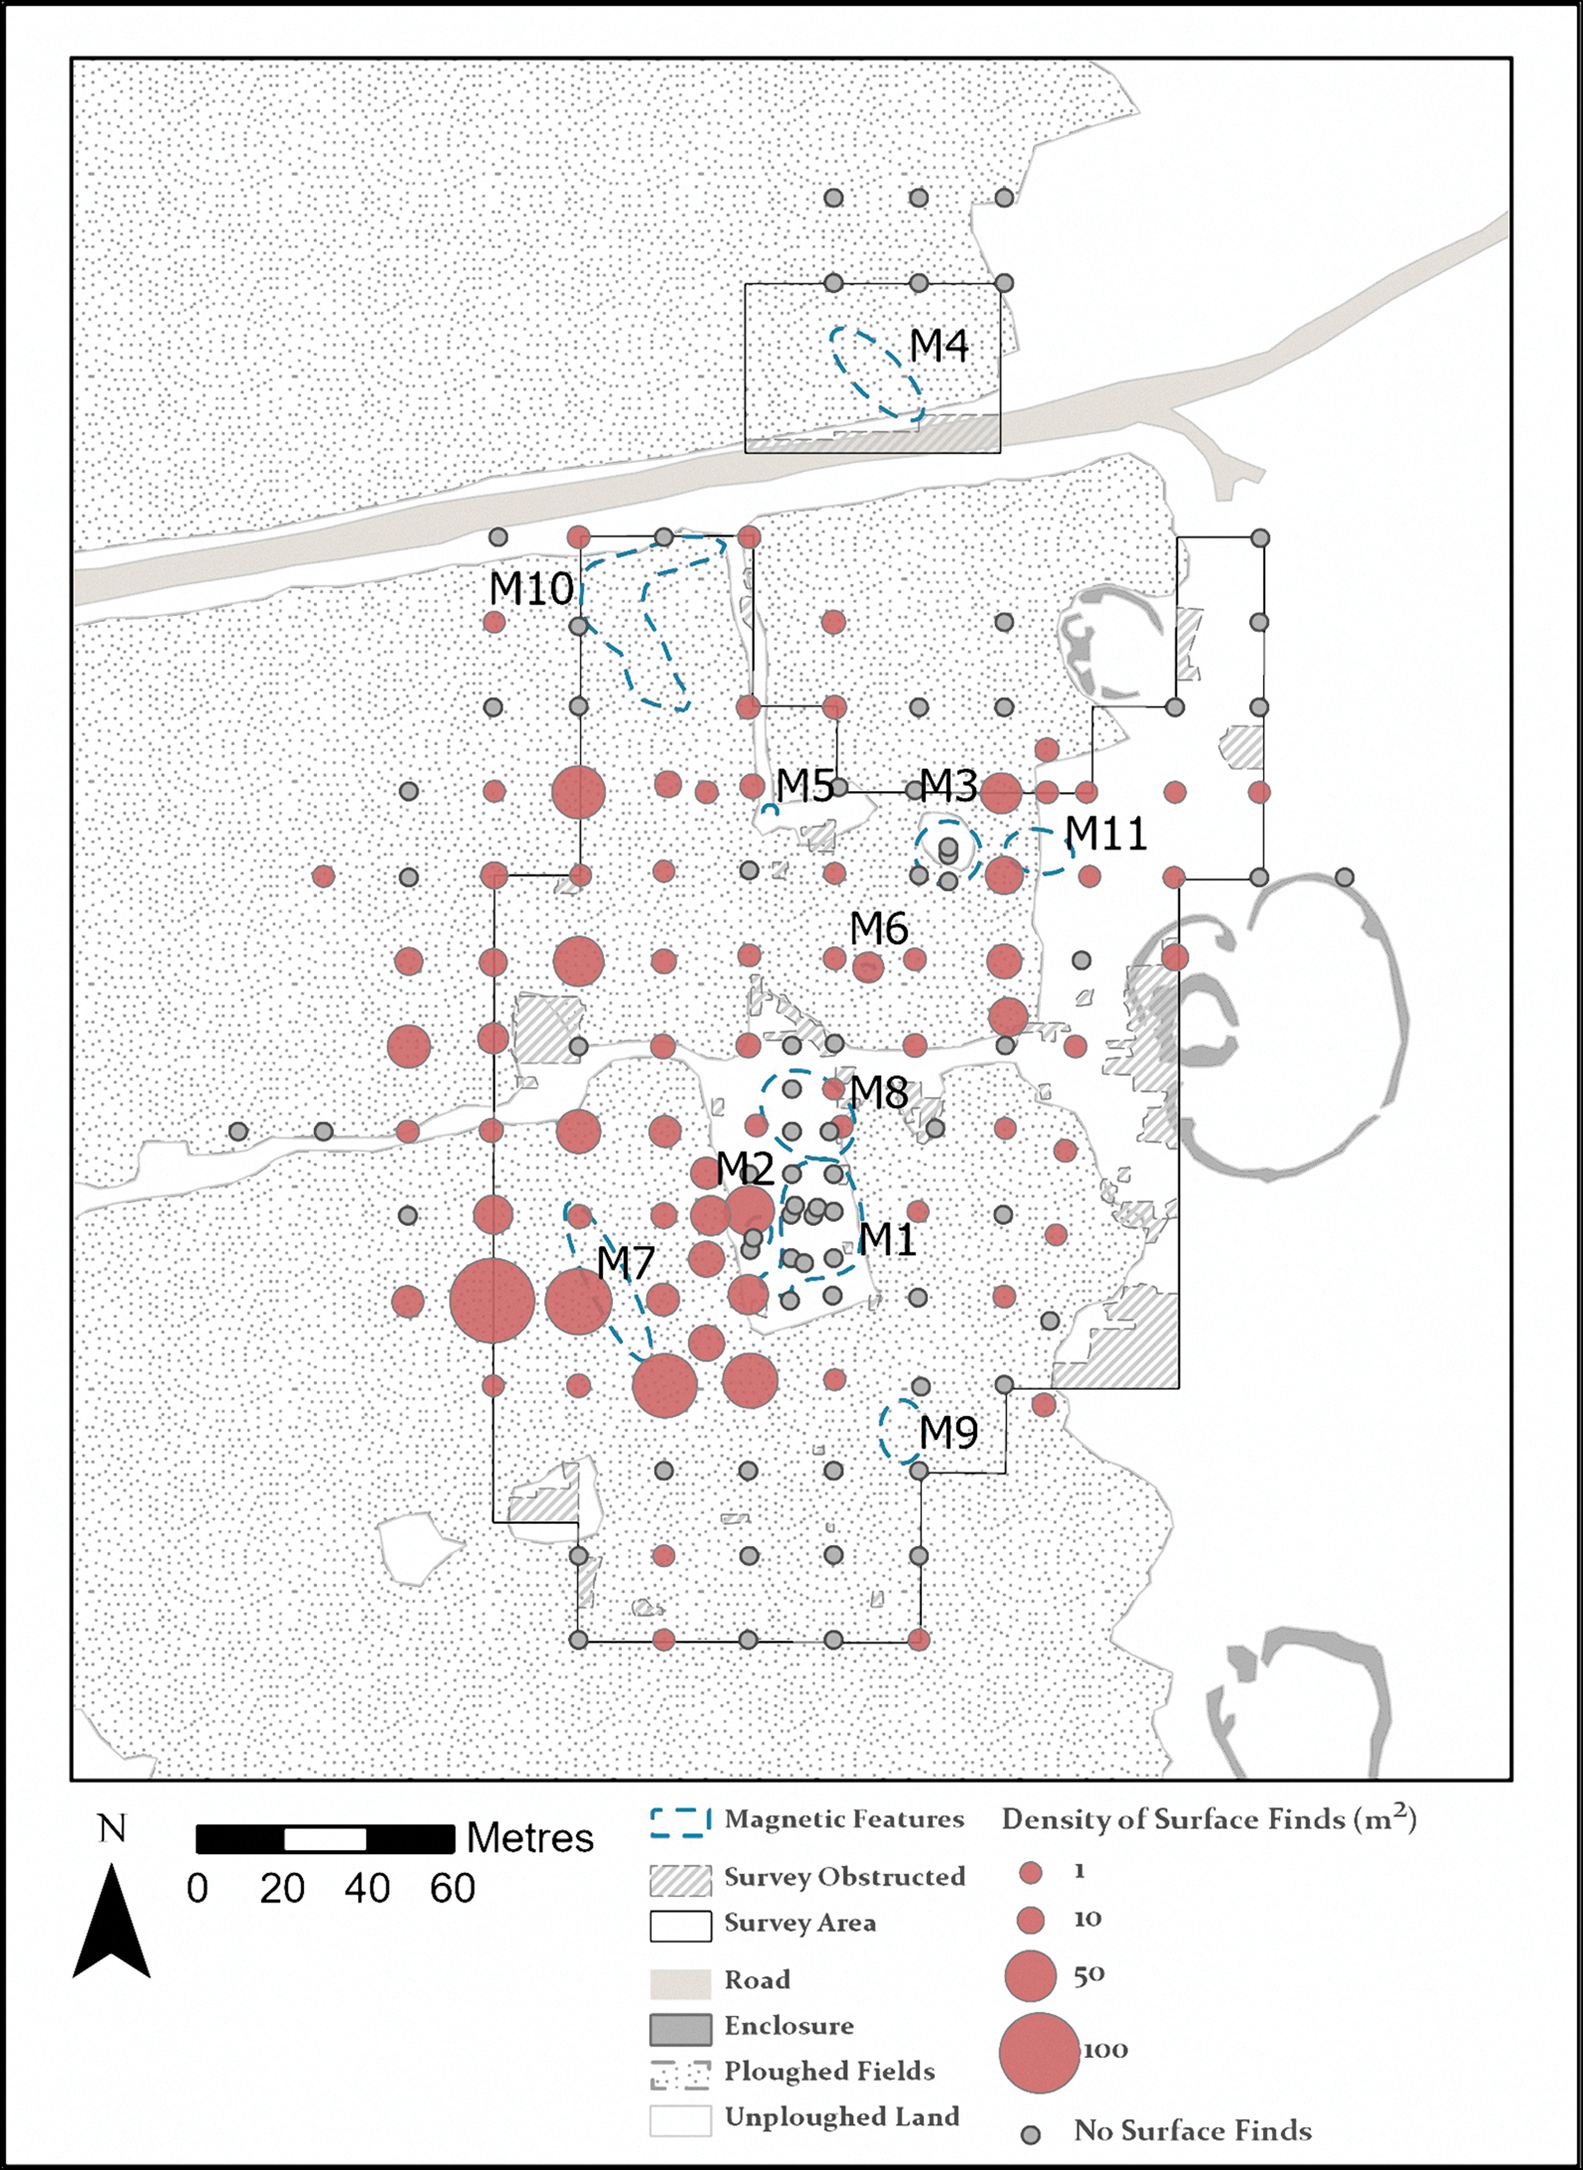
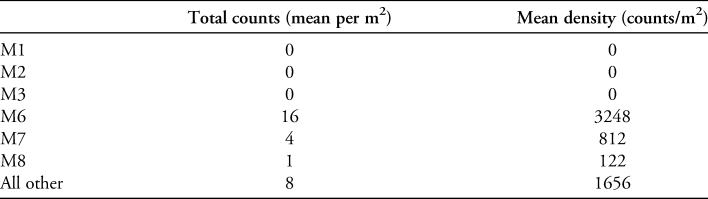
Densities of surface material demonstrate a clear gradient that defines an approximate site boundary, and anomalies identified in the magnetometry survey cluster in the central area of the site (Figure 6). There is no clear correlation, however, between surface density of cultural material and the location of magnetic anomalies (Table 1). Auger survey reveals that magnetically anomalous deposits are generally associated with elevated subsurface densities of material culture (Figure 7), but those densities—and by extension the cultural activities producing magnetic anomalies—are not necessarily visible on the surface. The surface density of material culture is closely correlated with modern farming and resulting aeolian erosion. Tillage removes covering vegetation and associated root structures, and fine sediment is then easily removed by wind. This deflation concentrates heavier materials—including archaeological ones—on the exposed surface. Three of the magnetically anomalous areas described below (M1, M2 & M8) are located in the centre of the site, within a historically untilled area preserved for pasture (Figure 5). This area preserves much more topsoil than surrounding areas, and archaeological material is therefore much less likely to be present on the surface. This suggests that surface survey alone is not always a reliable guide to excavation potential.
Densities of surface cultural material (predominantly pottery, lithics and bone) at 1m2 collection points, which help to define the site's extent. High-density areas of surface material do not map simply onto magnetic anomalies (M1–M11) (see also Table 1). Auger cores were also recovered at these points; subsurface density of material culture is summarised in Figure 7 (figure credit: D. Contreras and T. Fitton).
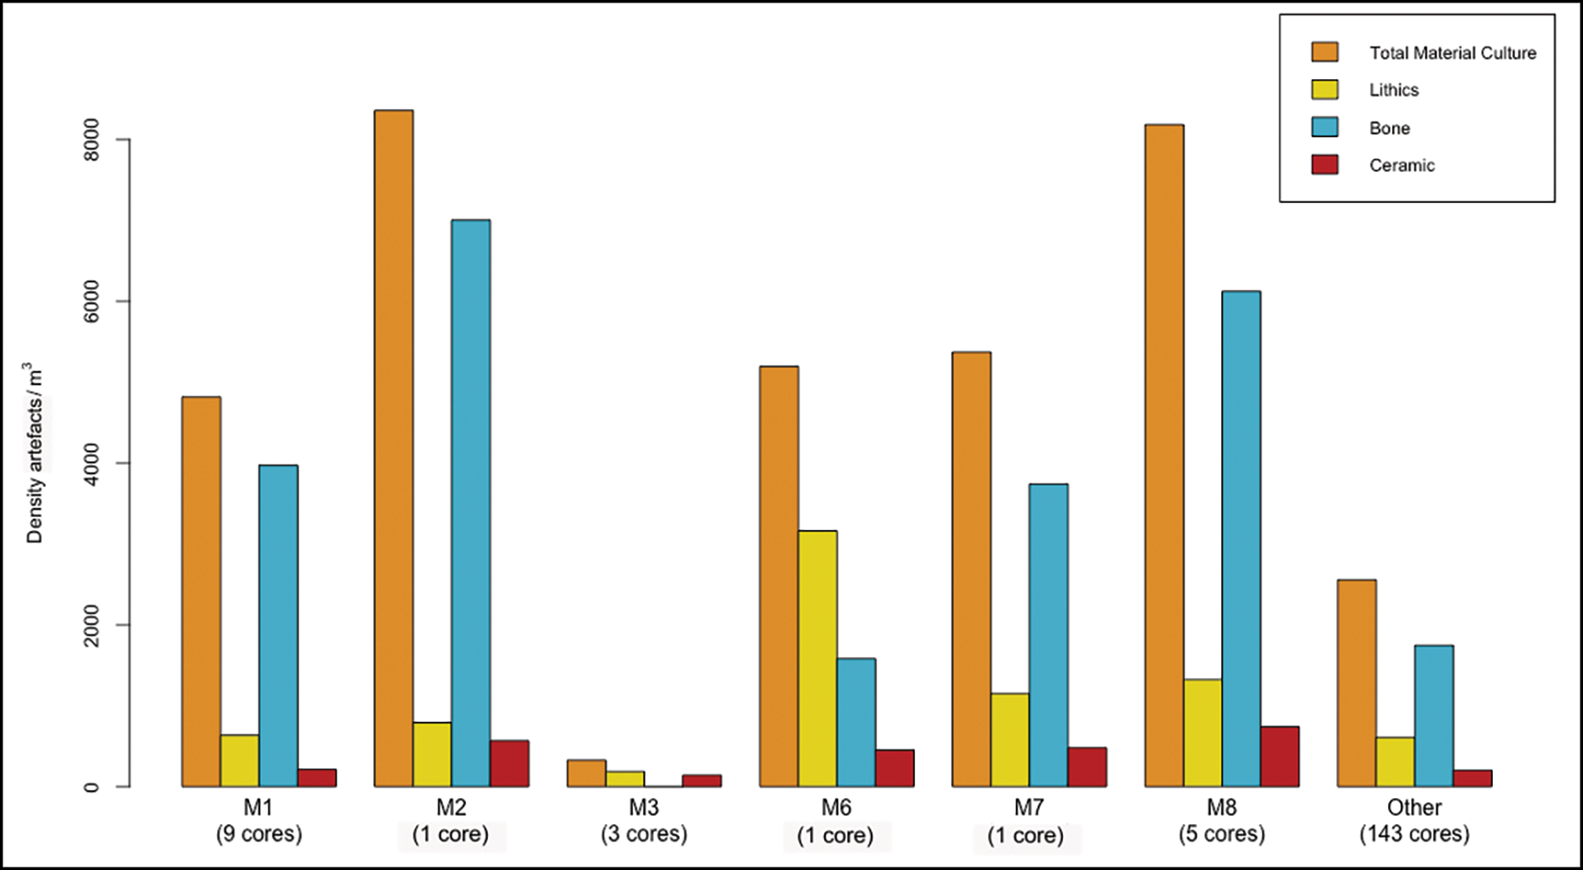
Densities of subsurface material recovered from auger cores within magnetically anomalous areas M1–M8 and in all other areas of the site (figure credit: D. Contreras).
Surface density of artefacts at points of collection within areas of magnetic anomaly (M), and at all other points of collection on site.
Area M1
The main area of interest identified during the 2015 season was a cluster of strong bipolar magnetic anomalies in the aforementioned untilled pasture area, which became the locus of excavation Units 6–8 and 11–14 in 2015, and Units 15–17 in 2018. The area appears to represent a cluster, at least 30m across, of overlapping bipolar anomalies averaging ±80nT, with peaks higher than ±100nT, each averaging 5m wide. Based on their size, orientation and intensity, our working hypothesis during survey in 2015 was that these anomalies represented thermoremanence related to archaeological activity.
Excavations in Units 6–8, 11–14 (only 11 was fully excavated) and 15–17 revealed highly variable deposits but clear evidence of anthropogenic activity (for details of Units 6–8 and 11–14, see Grillo et al. Reference Grillo2018). Units 6–8 are characterised by a deep, but not particularly artefact-dense deposit corresponding to lithostratigraphic unit LU 2-A—a dark, organic-rich silt deposit described in the online supplementary material (OSM) and in greater detail by Storozum et al. (Reference Storozum2021). Artefact density in these excavations suggests two discrete episodes of refuse disposal, occurring in relatively quick succession, separated by a rapid accumulation of aeolian silt. Nothing about these units presents an immediately obvious explanation for the bipolar magnetic anomalies.
Units 11 and 15–17 are more similar to one another (and to Units 29–30, described below) in terms of stratigraphy, and differ from Units 6–8 in that they preserve a deep deposit of LU 2-B—a grey, ash-like, carbonate-rich silt that we interpret as deriving from decayed animal dung (see the OSM and Storozum et al. Reference Storozum2021). Unit 11 is unremarkable, aside from a dense dung deposit and abundant artefacts that were almost exclusively coated in carbonate. Units 15–17, located with the intention of investigating the central area of one of the bipolar anomalies of M1, preserve a deep and more complex sequence that contains both LU 2-A and LU 2-B (Figure 8). Two layers of compacted, daub-like sediment were also noted at the base of LU 2-B in Units 15–17 and tentatively identified as possible house floors (pending micromorphological analysis). Natural sediments were encountered in Units 15–17 at variable depths ranging from approximately 0.85 to >1.65m below surface, with increasingly sterile deposits grading into saprolite (LU 3). Two protrusions of granitic rock were found surrounded by the matrix of LU3, grading into bedrock, and thus pre-date deposition of anthropogenic sediments (Figure 8a).
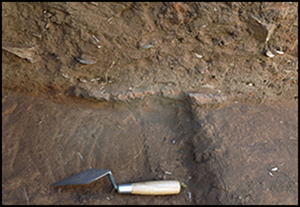
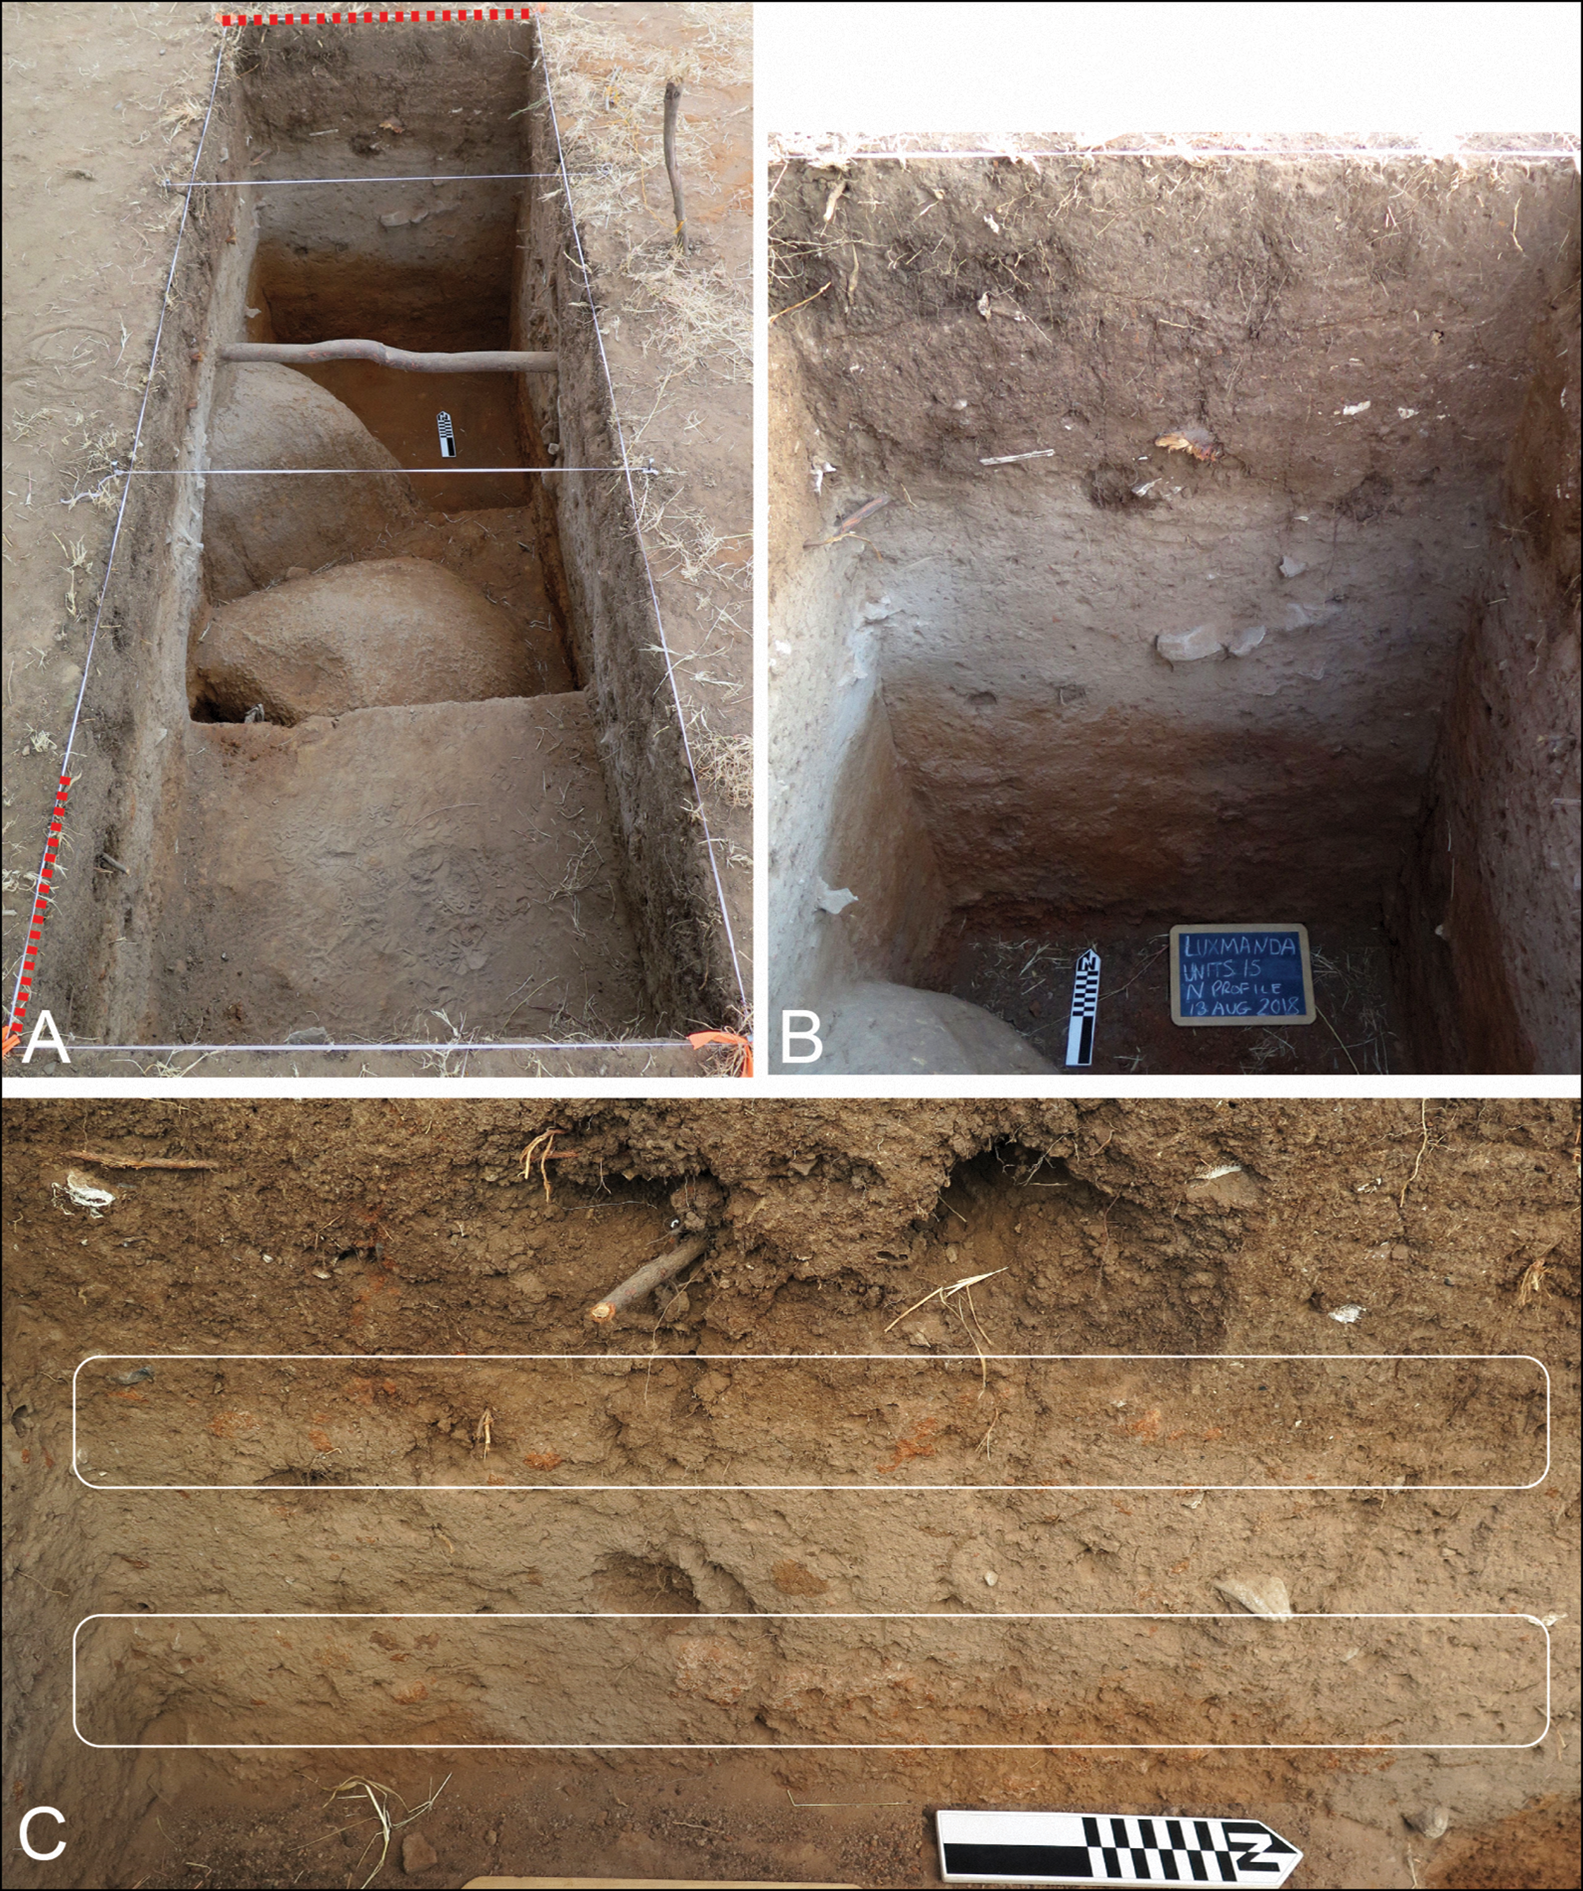
Units 15–17 (A), with red lines indicating Unit 15 north profile (B) and the southernmost part of Unit 17 west (C) profile. In A and B, emerging bedrock is visible. In C, two bands of compacted, daub-like sediment are indicated; these were also identified in patches elsewhere in the trench (figure credit: M. Prendergast).
The results from the three excavations within M1 are distinct not only in their stratigraphy, but also in their potential sources for bipolar anomalies. While we note a similarity in size between the anomalies of M1 with structures identified through excavation of postholes at Narosura (Odner Reference Odner1972), and although Units 15–17 did feature potential floors, the typically low-range magnetic enhancement of house floors does not explain the intense ±100nT peaks of these bipolar magnetic anomalies. The burning of wattle-and-daub or timber structures could create sufficient temperatures to induce thermoremanence, but we have found no clear evidence of burning in Units 15–17, 11, or 6–8. While the granitic rock surrounded by the natural matrix of LU3 in Units 15–17 might be a source of palaeomagnetic remanence, neither Units 6–8 nor 11 contain such outcrops from the bedrock. Moreover, low-amplitude magnetic readings with a similar form and size to those on the preserved pasture ground are visible in the tilled area immediately to the east (see Figure 5)—in one case contiguous with a high-amplitude anomaly. This high to low shift across the ploughing boundary suggests that, in at least one case, the source of an anomaly in M1 was damaged by modern ploughing, indicating a source in the upper sediments (thermoremanence) rather than additional buried boulders (palaeomagnetism).
Based on the presence of boulders in Units 15–17, the partial destruction of some of the magnetic anomalies in the plough zone and the slight differences in the form of anomalies within the cluster, we hypothesise that the clustered magnetic anomalies in M1 may have multiple sources related to both anthropogenic thermoremanence and palaeomagnetism. Although the areas so far opened through excavation are limited in extent, additional research, including an ongoing laboratory-based magnetic susceptibility study of samples taken from these excavation units, is in progress to elucidate the nature of M1.
Areas M2 and M3
M2 is a sub-circular anomaly, approximately 4m in diameter, located 10m west of M1. It is distinguishable by the random distribution of high-range magnetic readings in excess of ±100nT within its form, which are indicative of an assemblage of ferrous or magnetically remanent materials. M2 is located, like M1, on the preserved area of land amidst tilled fields. Pedestrian survey in 2015 showed no surface indications of a modern cause for this anomaly but did note a cluster of large stones embedded in the topsoil. Upon further inspection after clearing vegetation in 2018, this was denoted as Stone Feature 1 and became the locus for excavation Units 29–30.
Excavations revealed that the stones visible on the surface were part of a much larger buried assemblage of human-modified stones (Figure 9a–b), including large lower grinding stones and handstones. These are reported in greater detail by Prendergast et al. (Reference Prendergast, Grillo, Gidna and Mabulla2021). The stratigraphic components of Units 29–30 are analogous to those of Units 11 and 15–17. The stone cluster appears to be the cause of the complex magnetic disturbance of M2; their apparent remanent palaeomagnetism suggests that the stones are igneous, and therefore not immediately local to the site. Outcrops of volcanic material are, however, found approximately 9km south-east of Luxmanda, around Lake Balangida, and are not uncommon in the region.
A) Stone Feature 1 (approximately 18m2); B) excavations (Units 29–30) revealed large numbers of pounded, ground and pecked stones; C) unexcavated Stone Feature 2 (approximately 90m2) (figure credit: K. Grillo and M. Prendergast).

M3 is a larger, sub-circular anomaly approximately 10m in diameter, located around 75m north-east of M1 and with a similar disturbed pattern of magnetic measurements exceeding ±100nT. The anomaly maps onto another deliberately uncultivated grassy area in an otherwise tilled field, with large stones—similar to those in M2—embedded in the topsoil. Given its similarity to M2, we hypothesise that this again represents an archaeological assemblage of potentially igneous grinding stones. We have named this unexcavated feature Stone Feature 2 (Figure 9c; see also Prendergast et al. Reference Prendergast, Grillo, Gidna and Mabulla2021).
Area M8
M8, located around 20m north of M1 and in the same area of preserved land, represents a broad, approximately 20m-long linear anomaly of magnetic enhancement (averaging +25nT), surrounded by moderate negative areas (averaging −20nT), with a discrete intrusion of intense negative readings (−90nT) in the area of enhancement. In 2015, Units 9–10 (Figure 5) were excavated here to investigate the possibility of occupation or activity. These excavations revealed at least two baked or burned earth features with ash in their centres and associated burnt bone, interpreted as hearths. An infant burial was placed in the weathered bedrock subsoil below and slightly to the west of one of the hearths (Grillo et al. Reference Grillo2018). Expansion of this trench eastward in 2018 (Units 18–21) revealed multiple additional hearths at the same stratigraphic level. Above and around all of these features was a dense deposit of grey ash that is clearly related to the hearths, along with abundant domestic refuse, including pottery, lithics and animal bone (Figure 10). A thin, slightly compacted former ground surface was visible below this ashy, culturally rich deposit, at the same stratigraphic level as the hearths. This surface may have been the source of the negative magnetic anomaly for this area, which could represent the trapping of paramagnetic particles within a compacted matrix (see Schmidt Reference Schmidt, Gubbins and Herrero-Bervera2007).
Excavation in Units 18–19 (centre), with visible parts of Units 9–10 (left) and Units 20–21 (right). Multiple burned earth features, identified as hearths, are circled. Inset map shows profile of hearth in Unit 18 prior to removal for micromorphological analysis (figure credit: K. Grillo).

A second trench (Units 24–26), opened 3m to the north of the north-east corner of Units 18–21, in the central area of magnetic enhancement within M8, yielded no hearths nor any hearth-related ash or substantial burnt bone. The stratigraphy of the two trenches, however, is identical, and domestic refuse of similar kinds and abundance was found at approximately the same depth in both trenches. The magnetic enhancement of this area may be due to a ‘fermentation effect’ associated with the decay of organic materials (Schmidt Reference Schmidt, Gubbins and Herrero-Bervera2007), inferred from abundant faunal remains in Units 24–26. We hypothesise that Units 24–26 and 9–10/18–21 capture the same timeframe of occupation and reflect interrelated domestic activities. The M8 area therefore represents an activity zone.
Excavations outside of magnetic anomalies
The first test trenches excavated in 2013 (Units 1–5) were located based upon surface artefact densities, shovel test pits and observations during modern pit-latrine construction (Grillo et al. Reference Grillo2018). Units that were poor in cultural material (Units 3 and 5) were later found not to be located near any magnetic anomalies. Unit 4 (also poor in cultural material) was not covered by the magnetic survey and Unit 2 (with abundant midden deposits) was located across the eastern edge of the magnetic survey area. Unit 1 had abundant midden deposits but was located approximately 2m and 6m away from two small magnetic anomalies.
Recent tillage is an important factor potentially affecting both magnetometric and excavation results. This activity may have resulted in the dispersal of sediments, and may help explain why, in at least some of the 2013 units (e.g. Unit 5), most cultural materials were found near the surface, while in other units in which materials were found below surface (e.g. Unit 1), magnetic signals were weak or absent. In contrast, the 2015 survey revealed high magnetic anomalies principally in areas that had, at least in living memory, never been tilled (M1, M2, M8 and M3). These areas have revealed the richest archaeological records thus far recorded at Luxmanda. The comparison of excavations in 2013 and 2015, prior to and after magnetometric survey, demonstrates the value of geophysical survey in determining productive locations for further research.
Discussion
Taken alone, our fluxgate gradiometry results are often ambiguous, particularly given the lack of comparative geophysical data from other African pastoralist sites. Combined with the information from surface collection, auger survey and excavation, however, the geophysical data provide a robust foundation for future research and a means of generating further hypotheses about site structure and formation. Our gradiometry data, along with surface and subsurface archaeological and geoarchaeological evidence, are consistent with an understanding of Luxmanda as an internally heterogeneous site. Whether that diversity is the result of a durable spatial structure (e.g. a persistent layout) or temporal change (e.g. repeat occupations that overlap) must be clarified through further research. Three key inferences, however, can be made based on our present results.
First, there seem to be both areas of repetitive patterning of space and areas that are more distinct. The former comprise, most notably, the circular anomalies of M1, which we interpret as resulting from the presence of palaeomagnetic granitic boulders and thermoremanence. Some of these anomalies are consistent with habitation structures in terms of size, layout and stratigraphic features, although this interpretation remains provisional. The latter areas are characterised by M8, where archaeological evidence of domestic use is clearer, but where geophysical evidence suggests formation processes and a layout distinct from the M1 area. Inhabitants of Luxmanda apparently used space in ways that were sufficiently robust or repetitive to produce durable archaeological patterns—evident in distributions of magnetic anomalies, artefacts and sediment—but diverse enough that those patterns vary across the site.
Second, the stone features highlighted in M2 and M3 are unexpected at a pastoralist site, and raise questions explored elsewhere (see Prendergast et al. Reference Prendergast, Grillo, Gidna and Mabulla2021). Their distinctive magnetic properties indicate that they are unique within the surveyed area; if other such buried features were present, they would have been detected by the magnetic survey. Likewise, we can infer from negative evidence that other major anomalies reflecting ancient activities, such as those identified in M1 and M8, are relatively few within the site, and clusters of anomalies are rarer still. This may mean that the specific cultural activities and conditions (e.g. heating, organic decay) that produced anomalies did not occur elsewhere at Luxmanda. Alternatively, negative evidence may reflect decades- or centuries-old site disturbance. Agricultural activities have led to aeolian erosion and deflation of archaeological deposits, resulting in the dispersal of anomalous sediments.
Third, and finally, the geophysical data, surface artefact distributions and subsurface archaeological deposits do not map neatly onto each another. Surface distributions are apparently driven predominantly by deflation, while the density of subsurface material culture and the magnetic anomalies only generally relate to each other (i.e. both are present within the site but not outside it). There are high-density areas of subsurface material that appear to be unremarkable geophysically, and the areas of thermoremanence and magnetic enrichment in M1 and M8 are materially dense, but not uniquely so. Thus, not all activities that produced high artefact densities also produced magnetic anomalies and, probably, vice versa. Moreover, the types of anomalies noted in M1 and M8 may be fragile and vulnerable to deflation and dispersal.
Conclusion
Luxmanda is presently the most extensive Pastoral Neolithic site known in eastern Africa and provides an unparalleled opportunity to test ideas concerning ancient pastoralist settlement structure. These include spatial and temporal patterns in site formation, as well as the suitability of current archaeological methods for investigating such sites. Our geophysical survey at Luxmanda was experimental. Although it is theoretically possible that features of present-day pastoralist sites, such as livestock enclosures and gates, houses, hearths and refuse disposal areas, would be detectable via magnetometry, the method had not previously been applied and tested within the region or at sites of this date. Our results now show that fluxgate gradiometry is an effective method for defining areas of archaeological sites for further exploration, and that magnetic anomalies do correspond to distinctive nodes of subsurface anthropogenic activity.
A comparison of the results of magnetometry survey, surface collection, auger coring and formal excavation reveals spatial heterogeneity in activity areas at Luxmanda, and emphasises the deleterious effects of recent tillage and associated erosion. Whilst we were unable to identify some hypothesised features, we did encounter unexpected ones, such as the grinding-stone features that now challenge prior understandings of ancient pastoralist foodways (Prendergast et al. Reference Prendergast, Grillo, Gidna and Mabulla2021). Luxmanda serves as an important contrast to other well-documented Pastoral Neolithic sites, such as Narosura (Odner Reference Odner1972) and Ngamuriak (Robertshaw Reference Robertshaw1990), which yielded domestic structures and dung deposits, but no similar grinding equipment. Future excavations planned at Luxmanda—guided by the results presented here and elsewhere (Grillo et al. Reference Grillo2018)—may reveal additional features that contribute to produce a better understanding of Pastoral Neolithic intrasite and intersite diversity, advancing a step closer to ‘constructing community’ in the past (Gifford-Gonzalez Reference Gifford-Gonzalez2014).
A paradox lies at the heart of this research. Magnetic survey was effective at Luxmanda due to the presence of durable features that are surprising for a site occupied by an ostensibly highly mobile herding community. This highlights the importance of questioning our previous assumptions about pastoralist sites—specifically the supposition that they will be less archaeologically visible than those created by agriculturalists. In eastern Africa, geoarchaeological research has improved our ability to identify traces of ancient pastoralist occupation through the detection of dung deposits (Shahack-Gross et al. Reference Shahack-Gross, Marshall and Weiner2003; Shahack-Gross Reference Shahack-Gross2011). We now argue that geophysical survey has the potential to improve excavation strategies at Pastoral Neolithic sites—and at pastoralist sites globally—with a wide and perhaps unexpected range of occupational debris, thus improving our interpretations of past herding lifeways more generally.
Open-area excavations have illuminated the settlements of other mobile groups, including of foragers in South-west Asia and pastoralists in Central Asia (Maher et al. Reference Maher2012; Rouse & Cerasetti Reference Rouse and Cerasetti2014; Gardner & Burentogtokh Reference Gardner and Burentogtokh2018). Extensive, lateral excavation, however, often must be limited to areas of high archaeological potential. Furthermore, large-scale excavations cannot be conducted ethically without sufficient funding, time and physical space to allow for the responsible documentation, curation and publication of findings.
Our approach in conducting simultaneous geophysical survey and excavation has allowed us to tailor and target our investigations through a collaborative, iterative, in-field process of identifying and corroborating areas of archaeological interest. Notably, this method also facilitates the salvage of sites threatened by agricultural or construction activities by limiting the scope of excavations, whilst ensuring their efficacy.
The results of this study provide comparative archaeological and magnetometry data that can be used to identify loci for further investigation, such as areas of preserved cultural remains, potentially helping to establish the appropriate extent and scale of future excavations. This approach may be of value for the archaeology of mobile populations in other parts of eastern Africa and elsewhere around the world.
Acknowledgements
KMG and MEP co-supervised this research. Research permissions were granted by the Tanzania Commission for Science and Technology (2015-119-ER-2012-50, 2018-327-NA-2012-50) and the Antiquities Division of the Ministry of Natural Resources and Tourism. We thank our team members and the University of Wisconsin-La Crosse field school students for their contributions in the field. We are particularly grateful to our hosts in the village of Luxmanda.
Funding statement
Fieldwork in 2015 was supported by a Faculty Research Grant to KMG, with additional support from the College of Liberal Studies and Department of Archaeology at the University of Wisconsin-La Crosse. In 2018, fieldwork was supported by a National Geographic Society grant to MEP (NGS-196R-18), a Wenner-Gren Foundation award to KMG and a Palaeontological Scientific Trust grant to AOG.
Supplementary material
To view supplementary material for this article, please visit https://doi.org/10.15184/aqy.2021.59


 Open access