


After the seminal works of Modigliani and Miller (Reference Modigliani and Miller1958), Miller and Modigliani (Reference Miller and Modigliani1961) and Black (Reference Black1976), the most commonly cited arguments in favour of firms’ paying dividends are the reduction in agency costs (Easterbrook Reference Easterbrook1984; Jensen Reference Jensen1986) and the value of signalling (Bhattacharya Reference Bhattacharya1979; John and Williams Reference John and Williams1985; Miller and Rock Reference Miller and Rock1985). For recent years, Fama and French (Reference Fama and French2001) show that the proportion of firms paying cash dividends has sharply declined. Moreover, Brav et al. (Reference Brav, Graham and Harvey2005) show that recently US firms exhibited significant decoupling between earnings and dividends. Recently, the changing preferences of shareholders have been incorporated in the literature by Baker and Wurgler (Reference Baker and Wurgler2004a, Reference Baker and Wurgler2004b), who show that firms’ dividend policies during the period 1963–2000 catered to shareholders’ appetite, based on relative market valuations of (non-)dividend-paying stocks. Dividend policy has also been studied in a historical context. Dividend policy for British firms has been studied by Turner et al. (Reference Turner, YE and ZHAN2013) over the period 1825–70, while Braggion and Moore (Reference Braggion and Moore2011) investigate British firms over the period 1895–1905. Long-run evidence on dividend policies of Belgian firms over the period 1838–2012 has been provided by Moortgat et al. (Reference Moortgat, Annaert and Deloof2017).
This study investigates determinants of dividend policies for Dutch companies. We ask two questions. First, how did dividend policies evolve in the Netherlands over the course of the twentieth century? Second, how did the purpose of Dutch dividend policies change in this evolution? We describe the history of Dutch corporate finance and governance and examine the role of shareholder preferences in firms’ payout policies. We identify three distinct regimes of dividend policies in Dutch economic history and estimate models for each regime to assess the determinants of dividend policy and value effects of dividends. We apply data on Dutch non-financial corporations listed on the stock exchange of Amsterdam from 1903 to 2003. Studying Dutch dividend policy over an extended period is interesting for a variety of reasons. First, the Dutch economy is small and open and a price taker on global markets, so dividend policies should resonate with international practices. Second, the quality and availability of the data are good. While Turner et al. (Reference Turner, YE and ZHAN2013) and Braggion and Moore (Reference Braggion and Moore2011) study respectively 50 and 10 years, we study a period covering 100 years. Moortgat et al. (Reference Moortgat, Annaert and Deloof2017) cover a period of 174 years, but their analysis is primarily based on stock market data and does not use accounting data.
The main contribution of our article is to relate catering theory to the understanding of long-run dividend policy evolution. Baker and Wurgler (Reference Baker and Wurgler2004a, Reference Baker and Wurgler2004b) show that firms adjust their dividend payouts to short-term changes in the relative valuation of firms that do and do not pay dividends. In addition to this short-term catering practice, we document a more fundamental way of catering where firms adapt to long-term changes in shareholders’ preferences with regard to the dividend policies. We show that over time there is substantial time variation in dividend policies, which is consistent with managers of large firms who cater to shifts in shareholder preferences.
The remainder of this study is structured in the following manner. First, in Section i, we describe the institutional background of the Dutch corporate sector in order to document the three distinct dividend policy regimes and we define predictions for each of the three regimes. Section ii introduces the data set and methods. In Section iii we describe our empirical analyses of the determinants of dividends of the payout ratio, as well as the value-implications of dividend policy. Section iv concludes.
I
Characterised by a tradition of international trade and foreign investment, the Netherlands’ small, open economy experienced a long period of economic growth and international interconnectedness that lasted until 1914 (Sluyterman Reference Sluyterman2005). Neutrality during World War I posed both challenges and opportunities for Dutch firms, but the economy largely benefited and grew strongly after 1918 (Van Zanden Reference Van Zanden1998). Although some larger multinational firms were located in the Netherlands, the majority of public firms were relatively small, with predominantly family ownership and private investors (Westerhuis and De Jong Reference Westerhuis and De Jong2015). Notwithstanding a revision in 1928, the law governing financial reporting incorporated in the Commercial Code remained underdeveloped until the enactment of the Company Law in 1976. Prior to World War II, firms seldom disclosed more financial information than was required by law, and also held undisclosed reserves (Zeff et al. Reference Zeff, Van Der Wel and Camfferman1992).
The main purpose of dividends in the early twentieth century was twofold. First, dividends were a source of income for the shareholders. Many families and private investors would use the dividends for consumption and the remainder for reinvestment in other assets. Second, due to weak disclosure practices, dividends provided the most tangible evidence of firms’ performance. The practice of determining the annual dividend also reflects this dual purpose, as the dividend policy was predetermined in the company statutes, contracting the management to distribute cash to the owners (Koert Reference Koert1934). A typical statutory arrangement would distribute profits between reserves, to which an amount sufficient to meet a specified level would be allocated, and fixed payments, expressed as a percentage of their nominal equity value, made to shareholders (and directors). These practices originated in the eighteenth century (Koert Reference Koert1934). The remainder, defined as excess profits, was used to further augment reserves and dividends paid to shareholders and directors. Profits were thus a key determinant of dividend payout. Owing to the requirement to maintain reserves, however, profits did not necessarily correlate perfectly with payout ratio. A firm that reported a loss typically did not pay a dividend. A positive effect might be observed in cases where the accumulated reserves are deemed sufficient, leaving a greater portion of profits to be distributed as dividends. Clearly, firms distributed a large part of the profits to their owners, thereby informing investors about the firm's value.Footnote 1 Dividends were consequently perceived by shareholders to convey important information about firms’ earnings and financial prospects.Footnote 2
Koert notes that since the start of the twentieth century final decisions about profit distribution have been made at shareholder meetings (Koert Reference Koert1934, p. 122); in practice, such matters were determined by the largest shareholders, as dispersed and unorganised minority shareholders, typically more interested in short-term capital gains than in policies designed to strengthen firms or foster long-term growth, rarely attended such meetings. Koert concludes that the structure of dividends changed little between 1900 and 1930. In practice, liquid assets also had relevance as sources of cash for dividend payments. Financial markets and external financing were of limited importance during this period, firms relying largely on retained earnings to finance investment.Footnote 3 Cash was the prevailing type of dividend until World War II, while share repurchases and stock dividends played only on a minor role up to that point (Van Keep Reference Van Keep1950, p. 87).Footnote 4
Although taxation of dividends varied over this period (Brandsma Reference Brandsma1995), dividends were punished with low taxation and capital gains were exempt. In 1892, the Patentregt, dating from 1805, was split into the Wealth Tax Act (Wet op Vermogensbelasting 1892), with an initial fictional income tax of 4 per cent (levied on wealth in excess of 13,000 guilders at a maximum rate of 0.15% of the 4%), and Operating Tax Act (Wet op Bedrijfsbelasting 1893), which taxed dividend income at 2 per cent. This tax regime provided a minor disadvantage of dividends, as well as a double taxation for shareholders based on both fictional and actual dividend income (Brandsma Reference Brandsma1995). In 1914 the Income Tax Act (Wet op de Inkomstenbelasting 1914) replaced the 1892/3 acts and taxed wealth directly without fictional income. This law was complemented by a new dividend tax for corporations introduced in 1917 (Wet op de Dividend en Tantièmebelasting), which taxed dividend and bonus payouts moderately at 5 per cent (1917) to 12 per cent (1940), and lasted until 1940 (Brandsma Reference Brandsma1995). Even though the tax on dividends switched from shareholders to corporations, in the entire period dividends receive an unfavourable tax treatment when compared to untaxed capital gains. However, this tax was relatively low.
In Table 1 we present predictions for the dividend patterns and payout policies in the first period, and for the two subsequent regimes.
Dividend regimes

In the period 1903–38, labelled as the ‘statutory formula’ period, we expect firms to pay dividends when the profits allow them to do this. This implies that dividends are cyclical, i.e. in times of sufficient profitability most firms will pay dividends and distribute a high portion of the profits. Due to this cyclicality, the dividends will fluctuate with the business cycle. Firms reporting losses will not pay dividends, and the level of profitability affects dividends positively. Reserves are not used to pay dividends, while sufficient liquidity does have a positive effect on the probability of paying dividends, mainly for practical reasons. Because taxes are negligible we expect no effect from taxation on dividends. For shareholders, the dividends are a key source of information, and therefore firm values are strongly driven by dividend payments and the level of the dividends.
The Dutch economy experienced a period of stagnation from 1929 until World War II (Van Zanden Reference Van Zanden1998, p. 106), although it recovered somewhat after leaving the gold standard in 1936. In the 1930s, the profits of the firms dropped markedly and many firms reported losses. This implied that many firms ceased to pay dividends or had to cut dividends dramatically. Shareholders became aware that the policy of paying out a fraction of earnings negatively affected their income and thus consumption. After World War II, the Netherlands witnessed a period of strong growth (1945–73). In this period, the shareholder base of Dutch listed firms did not change, even though the rights of shareholders were gradually limited, because supervisory boards and employees became more powerful (Westerhuis and De Jong Reference Westerhuis and De Jong2015).
Dividend policy in the post-war years was largely determined by experiences in the 1930s, shareholders worldwide demanding dividends that could not be paid in the face of declining profits. This experience prompted a revision of ideas about dividend policy. US scholars and practitioners were the first to promote the notion of smoothing. Wilbur (Reference Wilbur1932) mentions that in the ‘generally depressed conditions … companies have been forced to revise established dividend policies’ (p. 373). He then argues that firms can benefit from stabilising dividends, by reducing dividends in times of high profits to be paid out in poor conditions, smoothing the dividends. The benefit is that this ‘creates a loyal group of shareholders’ (p. 377). Around the globe smoothing, a new dividend policy, was introduced: in the US by scholars such as Wilbur (Reference Wilbur1932) and Buchanan (Reference Buchanan1938) and in similar vein in the Netherlands by Van Berkum (Reference Van Berkum1943). Under this regime firms pay stable dividends, where changes in earnings are gradually incorporated in dividends.
Firms operating under the new policy tend to hesitate to increase dividends in the wake of increases in profits that may not be sustainable; dividends are smoothed when adjustments in response to changes in earnings occur with a delay (Lintner Reference Lintner1956).Footnote 5 The notion of smoothing was articulated in the Netherlands initially by Van Berkum (first in 1943 and again in Reference Van Berkum1948). Smoothing policies, clearly described in seminal work by Van Keep (Reference Van Keep1950), soon became the dominant recommended policy in Dutch academic literature (De Lange Reference De Lange1957; Meij and Snel Reference Meij and Snel1964; Bouma Reference Bouma1980). Firms in a smoothing regime build reserves by retaining profits, rendering dividends more predictable and less dependent on short-term changes in earnings, and forestalling discontinuation in the event losses are incurred. Van Keep (Reference Van Keep1950) justified smoothing on the basis of such positive effects as rendering shareholders more loyal and less speculative and enhancing firms’ creditworthiness and liquidity. Dividend policy was, during this period, even referred to as reservation policy (reserveringspolitiek).Footnote 6
Dividends were taxed and constrained in a variety of ways during this period (Brandsma Reference Brandsma1995). A 1941 resolution (Besluit op de Dividendbeperking 1941) imposed a tax on corporations that paid out more than 6 per cent on paid-in capital. This resolution was replaced in 1950 by a dividend limitation (Besluit op de Dividendbeperking 1950) that remained in place until 1953. In 1953, the Dutch Social-Economic Council concluded that the limitations were not effective in influencing dividend payouts (SER 1953). The Dutch government responded to the oil crisis in 1974 by capping dividends at the maximum of the percentage of the previous year or average over the past five years (Machtigingswet Inkomensvorming 1974).Footnote 7 Dividends were taxed as income of the shareholders, while capital gains remained untaxed. The Wet op Dividendbelasting, introduced in 1965 and revised in 1969, increased the withholding tax from 15 per cent to the internationally customary 25 per cent. The dividend taxes were first withheld as 15 per cent of the payout by the corporations and later settled with other sources of income. When compared to capital gains, dividends were taxed at the marginal rate of private investors, while for corporations owning shares this disadvantage of dividends did not exist.
The quality of financial reporting improved with the enactment, in 1971, of the law on external financial reporting (Wet op de Jaarrekening van Ondernemingen). In an effort to smooth reported profits as well as dividends, firms were also managing their earnings (Hoogendoorn Reference Hoogendoorn1985).
The second regime in 1948–83 is labelled ‘smoothing’ and we predict that firms aim to pay a dividend every year and keep the level constant. As summarised in Table 1, we expect a high probability that firms will pay a dividend, and that the dividends will be more stable. As a result, firms will be conservative in paying more dividends when profits rise, and rather add profits to the reserves. Therefore dividends will be lower. Dividends are also reduced due to various constraints and the negative tax treatment. When firms report a loss the chances of paying dividends are reduced. Compared to the previous regime, profits will be less important, due to the smoothing, while reserves now become a key driver of dividends. Firms were building reserves with the explicit purpose of paying dividends in times of insufficient profits. Consistent with dividends as evidence of long-term value, in this episode firms paying a dividend still sell at a significant premium. Annual dividends are not related to the earnings of that year, but the long-term developments of dividends will inform investors about the management perspective on firm value.
Since the 1980s, Dutch firms have been increasingly influenced by international developments. Foreign investors increased their holdings in Dutch firms, and Dutch firms expanded internationally. Following the recessions in the 1970s and early 1980s, the Dutch economy grew hand-in-hand with the world economy, exerting pressure on collaborative structures evolved in the 1960s and 1970s that married capital and labour (De Jong et al. Reference De Jong, RÖell and Westerhuis2010). The influx of foreign shareholders and the ideology of shareholder value maximisation imported from Anglo-Saxon countries during this period focused attention on dividend policies that could help firms maximise stock prices by minimising agency and information costs.
It is instructive to briefly sketch academic developments in dividend policies in the United States. Miller and Modigliani argued in Reference Miller and Modigliani1961 that dividend policy is irrelevant to firm value under stringent efficient-market assumptions. Later theorists argued that dividends are relevant to shareholder value, giving rise to the theoretical notions of moral hazard agency and adverse selection signalling. The moral hazard agency argument (Jensen and Meckling Reference Jensen and Meckling1976; Grossman and Hart Reference Grossman and Hart1980; Easterbrook Reference Easterbrook1984; Jensen Reference Jensen1986) holds that managers are inclined to act out of self-interest at the expense of shareholders, and that the agency costs of this behaviour can be reduced via dividends, that is, firms should pay out, to prevent managers from wasting, excess cash flows. Managers cash constrained after dividend payouts are consequently forced to approach the capital market for additional funding, a disciplining role that results in free cash flow having a positive effect on dividends as firms return high earnings to the financial markets. Concurrently, alternative disciplinary devices reduce the need for dividends, such as leverage, ownership and board structures. Signalling theory maintains that firms can convey to financial markets valuable signals about future prospects (Spence Reference Spence1974; Bhattacharya Reference Bhattacharya1979; Miller and Rock Reference Miller and Rock1985). As the dividend decision is related to information asymmetry between managers and outside shareholders, so the (in)tangibility of assets relates to information asymmetry, tangible assets being easier to value objectively. Interestingly, the emphasis of signalling theory is not on the level of dividend vis-à-vis profits, but on the decision whether to pay a dividend.
Anglo-Saxon theories promulgated by financial economists strongly influenced Dutch executives as well as academics’ research and teaching. Duffhues (Reference Duffhues1997), for example, in several chapters of his widely used textbook discusses modern dividend theories absent from the previous generation of textbooks such as Bouma (Reference Bouma1980). In the Netherlands from the 1980s onwards, dividend policies, among others, served to reduce principal–agent costs. In addition, firms aimed to signal the value of their companies by paying out dividends.Footnote 8
While shareholders were satisfied with the smoothed dividends in the 1950s until the 1970s, in the 1980s the shareholder base of Dutch firms started to change markedly, bringing new preferences for firm dividend policies. In the 1980s Dutch institutional investors changed their portfolios to include more stock holdings, compared to their traditional focus on government debt. In addition to the Dutch pension funds, mutual funds, banks and insurance companies, also international institutional investors entered the Dutch market. De Jong, Röell and Westerhuis (Reference De Jong, RÖell and Westerhuis2010) describe this transition and show that from hardly any international ownership in the early 1980s, foreign institutional investors owned 37 and 75 per cent of large Dutch firms in 1995 and 2005, respectively. For these investors, dividends are costly, as they incur transaction costs to reinvest dividends to maintain their positions. Moreover, the investors are mainly oriented towards shareholder value creation, not at the cash flows from their investments. The disclosure quality of financial reports had improved from the 1970s onwards. With the international investors, Anglo-Saxon ideas about shareholder value creation became prevalent, in particular ideas about agency theory (Jensen and Meckling Reference Jensen and Meckling1976; Grossman and Hart Reference Grossman and Hart1980; Easterbrook Reference Easterbrook1984; Jensen Reference Jensen1986) and signalling (Spence Reference Spence1974; Bhattacharya Reference Bhattacharya1979; Miller and Rock Reference Miller and Rock1985). These ideas were adopted by Dutch investors and managers (Duffhues Reference Duffhues1997).
In Table 1 we describe our predictions for the third regime, ‘agency and signalling’. We predict dividend policy to be characterised by high propensity to pay dividends (a positive signal and reducing agency costs), low dividend payouts and low variation in dividend payments, because of the low levels of dividends. We expect dividends to become symbolic in nature and earnings and dividends to be decoupled as Anglo-Saxon ideas permeated through the Dutch economy. Firms reporting losses are less likely to pay a dividend, but profits are no longer key determinants. There will still be a minor role for reserves and liquidity to maintain the dividends. We expect a limited positive effect of paying a dividend, while the level has no value-relevance.
II
Our sample is composed of Dutch non-financial corporations listed on the stock exchange of Amsterdam from 1903 to 2003. Collecting firm data for one year per five-year period excluding World War II yields 20 cross-sections with five-year intervals. Financial and non-financial data were procured from the following sources. The Gids bij de Prijscourant contains share and dividend information for all securities listed on the Amsterdam exchange. The Van Oss Effectenboek, a contemporary investor manual published annually from 1903 until 1978, includes balance sheets, profit and loss statements, share information, directors’ names, and information on distribution of profits. The Tabellen der Laagste en Hoogste Koersen provides information on stock prices and dividends. For the period 1977 to 2003, we consulted a database of exchange-listed firms of the Centraal Bureau Statistiek. Our sample, limited by the inclusion only of firms for which complete information is available for the variables in our analyses for a given year, firms during the early part of the twentieth century disclosing on a voluntary basis, and some providing only limited financial data, includes 3,638 firm-year observations for 704 unique firms.Footnote 9
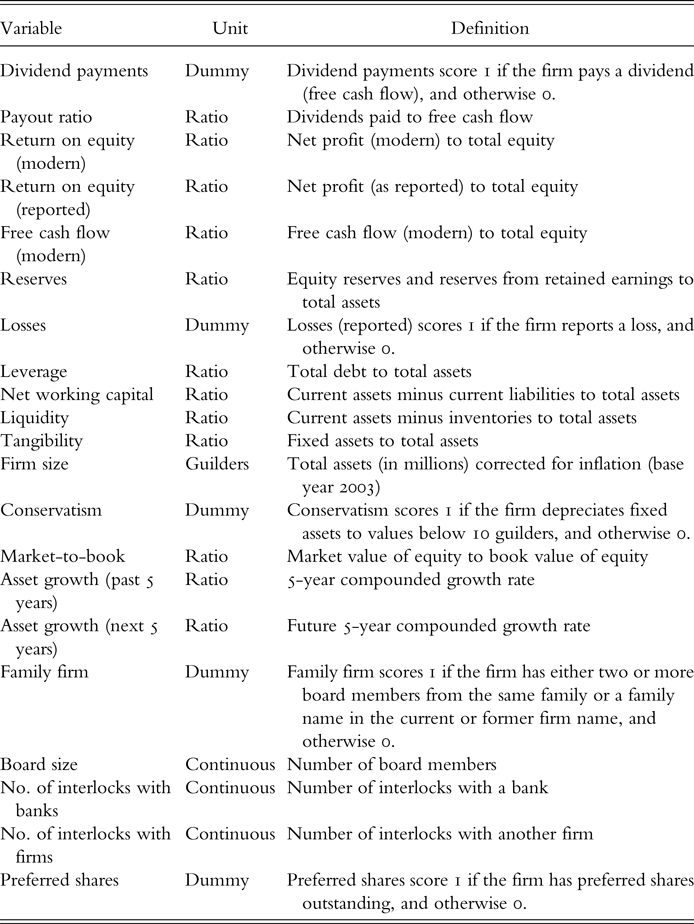
We now describe the variables in our study (a detailed description of the can be found in the Appendix). To facilitate comparison over the twentieth century, we standardised balance sheets and profit and loss statements and transformed all accounting information to modern financial statement structures (for detailed descriptions see Westerhuis and De Jong Reference Westerhuis and De Jong2015; Colvin et al. Reference Colvin, De Jong and Fliers2015). The most significant adjustment relates to the nature of early balance sheets, which were compiled before distributing profits. These as well as profit and loss statements are transformed into post-distribution statements, following the description of profit distribution in Van Oss Effectenboek, which yield net income and also affect reserves by adding retained earnings.
The dividend measure used in the study is dividend payments, an indicator variable assigned a value of one for a firm that pays a cash or choice dividend, and zero otherwise. Stock dividends are thus excluded. The dividends in a given year are the cash dividends paid out over the profits of that year, i.e. we match profits and dividends although the dividends are paid in the year after the profits are realised.Footnote 10 Payout ratio is defined as the amount of cash or choice dividend scaled by free cash flow. The latter metric, according to modern standards, is net income plus depreciation. We opt for this denominator in order to include the amount of cash available for dividend payments. Following standard conventions in the literature, payout ratio is capped at one, which value is also assigned when loss-incurring firms pay dividends. Because published profits (without transformation) as well as economic profitability (with transformation) may have relevance for firms and investors, we include both reported and modern profits.
Firms’ reserve position becomes an important resource when profits are insufficient for dividend payments. During the first half of the twentieth century, many firms held hidden reserves by depreciating assets at a rate that exceeded their decreasing economic value, a conservative practice that yielded deflated asset values and underestimation of equity reserves.Footnote 11 Although we cannot measure the actual value of assets, taking recourse to the practice of openly setting minimal and unrealistic values, such as 1 guilder for a factory, we construct an indicator variable Conservatism for firms that value at least one asset at less than 10 guilders.
Firms with preferred shares can pay dividends to both ordinary and preferred shareholders. The probability of dividend payouts tends to be increased by the expectations of preferred shareholders and, when applicable, given the cumulative nature of dividends, we include an indicator variable for firms with preferred shares. We also include as a control variable for family firms a dummy variable that takes the value of one if the name of a family is present in the firm name or the board includes two or more members from the same family. We acknowledge the limitation of this metric in that control of a firm can also be exercised through a given family's ownership of shares. Ownership data for Dutch firms are, however, available only from 1992.
Our analyses are formulated to identify reasons for paying, and determinants of levels of, dividends. Binomial choice models are employed to understand firms’ decisions to pay or not to pay a dividend, for each of the three periods.Footnote 12, Footnote 13 Our logit model, in reduced form, is:
 $$Log_e\displaystyle{{\pi _{i,t}\lpar {Propensity\; to\; pay} \rpar } \over {1-\pi _{i,t}\lpar {Propensity\; to\; pay} \rpar }} = \; \alpha _i + \; \beta _nX_{i,t}$$
where Propensity to pay is the choice variable that indicates whether a firm pays dividends, and X i,t is a vector of explanatory variables. All logit models include corrections for unobserved industry-specific and year-specific effects. Although we do not present results on the industry and year effects, these are important controls, for example for changes in tax and reporting laws that affect all firms alike. We report average marginal effect and standard errors are clustered at the firm level. OLS regressions are used to explain cross-sectional variation in dividend payouts. The dependent variable is the dividend payout ratio. These models are as follows:
 $$Payout\; ratio_{i,t} = \; \alpha _i + \; \beta _nX_{i,t} + \; \varepsilon _{i,t}$$
where Payout ratioi,t is the firm's payout ratio, that is, dividend payment to free cash flow, and X i,t is a vector of explanatory variables. All OLS models include corrections for unobserved industry and year effects, and standard errors are clustered at firm level.Footnote 14 We assess the relevance of our models across periods by reporting both the AIC information criterion (Akaike Reference Akaike1974) and (pseudo or adjusted) R-squared statistics.Footnote 15
To compare the relevance of specific explanatory variables over three time periods, we need to assess the relative explanatory power of the models. To measure the importance of dominant practices, we estimate the same model for each of the three periods, and use Shapely variance-decomposition algorithms to attribute portions of the models’ explanatory power to specific factors. This methodology is commonly used in household finance (see Sastre and Trannoy Reference Sastre and Trannoy2002; Bourguignon et al. Reference Bourguignon, Robilliard, Robinson, Kehoe, Srinivasan and Whalley2005; and, of course, Shapley Reference Shapley, Kuhn and Tucker1953) and has recently been employed in economic history by Colvin et al. (Reference Colvin, De Jong and Fliers2015).
III
The results of our analyses are presented in three parts. We first present descriptive statistics, then estimate the determinants of the dividend policies, and conclude with an analysis of the value-relevance of dividends. Table 2 and Figure 1 describe the evolution of dividend policies over the period 1903–2003.
Dividend payments and payout ratio

Descriptive statistics of dividend policy and profitability measures

Notes: This table contains descriptive statistics for Dutch non-financial firms listed on the stock exchange of Amsterdam during the period 1903–2003, which consists of 20 cross-sections of five-year intervals. For each cross-section, we report the number of observations and the fraction or mean for all variables mentioned on the top row of the table. For the profitability variables, we mention the return on equity (modern), return on equity (reported), free cash flow (modern) and losses (reported). The dividend policy measures are separated for dividend payments and payout ratio. Dividend payments consist of (1) firms that pay dividends, which are firms that pay dividends, (2) firms that start paying dividends are firms that did not pay in the previous period but do in this period and (3) firms that quit paying dividends are firms that did paid in the previous period but do not in this period. Payout ratio consists of payout ratio for dividend payers and payout ratio for the full sample. Definitions of the variables are provided in Table A1 in the Appendix.
The fraction of dividend-paying firms and payout ratio for both the full sample and dividend-paying firms is shown as well as the percentages of firms that initiate or discontinue dividend payments. For 1903, for example, for which we have 82 firm-years, reported return on equity was, on average, 5 per cent, which equals the average return on equity after correction to modern standards, and free cash flow, on average, 7 per cent of the book value of equity. Thirteen per cent of firms reported a loss, 56 per centpaid a dividend, and the average payout ratio for the full sample (only dividend-paying firms) was, on average, 37 per cent (65 per cent), of free cash flow. In 1908, 14 per cent of firms with information for both years initiate, and 2 per cent discontinue, dividend payments, and the remaining 84 per cent of the sample make no adjustment to dividend policy.
Figure 1, which graphically summarises the evolution of the fraction of dividend-paying firms and average payout ratio, reveals some striking movement. For example, we see upward movement in the percentage of dividend-paying firms (to 74 per cent) until 1918 followed by a decline (27 per cent) until 1933 as the effect of the Great Depression is clearly evident in only one in four firms paying a dividend, which is evidence of the cyclicality of dividends in the first period. Post-war we see a rapid increase (back to 74 per cent in 1948) followed by continued upward movement (88 per cent) until 1963. Some variation is observed, but the norm is to pay a dividend. Payout ratio is relatively high between 1908 and 1938, ranging from 53 and 66 per cent for dividend-paying firms, fairly constant between 1948 (36 per cent) and 1963 (37 per cent), and drops to the lowest average payout ratio in the century in 1983 (19 per cent) before resuming modest upward movement from 1988 (20 per cent) to 2003 (26 per cent).
The descriptive statistics are consistent with the predictions of the three regimes we have identified. Until the 1940s, with exception of the 1930s economic crisis, dividend-paying firms are numerous and pay out most of their profits. With the post-World War II emphasis on smoothing policies, most firms pay dividends. By the late 1980s, dividend paying seems almost symbolic, with many firms paying modest dividends. Taxation does not seem to influence long-term dividend trends. In the years before World War II dividend taxes gradually increased from 2 to 12 per cent for all shareholders. After the war, higher income tax rates applied for private investors, while most corporate shareholders faced no tax disadvantage. These tax rates cannot explain the strong reduction in dividends in the 1930s, as well as relatively high dividends in the 1950s and 1960s, compared to subsequent decades.
Table 3 and Figure 2 document the volatility of profitability and dividends over time. Panel A of Table 3 reports per period the mean values for payout and profitability measures for the five pooled cross-sections.
Standard deviation of profitability and dividends

Volatility and distribution of profitability and dividends
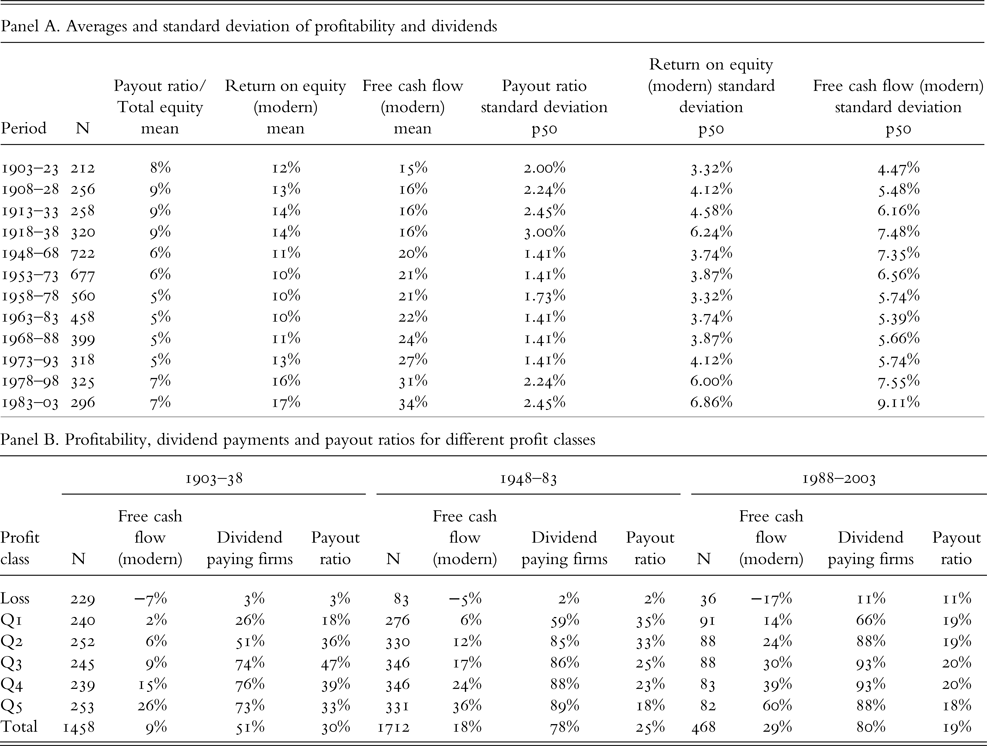
Notes: This table contains descriptive statistics for Dutch non-financial firms listed on the stock exchange of Amsterdam during the period 1903–2003, which consists of 20 cross-sections of five-year intervals. Panel A reports the number of observations and the mean and the median of the standard deviation for payout and profitability measures per five-period window (each window is a pooled cross-section). For these five-period windows, we calculate the standard deviations for each firm and present the median of these standard deviations, i.e. to be included in this analysis we require at least two firm-year observations per cross-section. Payout ratio/total equity is defined as (dividends paid to free cash flow) scaled by total equity. Panel B reports for the periods 1903–38, 1948–83 and 1988–2003, per profit class the number of observations, the mean of free cash flow (modern), the fraction of firms that pay dividends (compare to dividend payments) and the mean of payout ratio. Profit classes are created based on free cash flow (modern), i.e. (1) the class ‘loss’ consists of observations which have a free cash flow (modern) less than zero, (2) the remaining observations with free cash flow (modern) of zero and larger are added to the quintiles ‘Q1’ to ‘Q5’ according to the size of their free cash flow (modern). In order to account for trends in profitability, we add observations to a profitability group on a yearly basis, which explains why the number of observations is not constant across quintiles. Note that the payout ratio is set to one in cases where a firm with a loss pays a dividend, which explains why the fraction of firms that pay dividends equals the payout ratio for loss-making firms. Definitions of the variables are provided in Table A1 in the Appendix.
For each firm, we calculate, and present the median of, these standard deviations for the five-period windows (at least two firm-year observations per cross-section are required to be included in this analysis). Lower values imply that firms smooth their dividends and profits. It should be noted that these descriptives are an illustration of our arguments. Ideally, smoothing is measured using annual data, and our five-year intervals serve as an approximation that has to be interpreted with care.
For the period 1903–23, using data for 1903, 1908, 1913, 1918 and 1923, we obtain an average payout of 8 per cent of equity, a return on equity of 12 per cent, and a free cash flow of 15 per cent, the latter two according to modern standards, with median values of standard deviations of 2.00, 3.32 and 4.47 per cent, respectively. Our findings for median volatilities are summarised in Figure 2, in which we observe median values of the standard deviations of payout, return on equity and free cash flow to have increased until 1938, and values reaching a high towards the end of the first period, which corresponds to the turbulent years before World War II. Increasing volatility in earnings was passed to investors in dividend policies that did not yet incorporate smoothing and dividends followed the business cycle. It is interesting to note that in the recession of the 1970s and early 1980s we do not witness a similar increase in volatility. As mentioned, these results need to be interpreted with care, because we rely on five-year intervals.Footnote 16
To show the effects of losses and profits on dividends, panel B of Table 3 reports, for each period, the percentage of firms that pay dividends and payout ratio for different profitability groups. We first create profitability groups based on free cash flow values. The first group, ‘loss’, consists of observations that have incurred a loss. The remaining observations are assigned to quintiles, with observations grouped according to increasing free cash flow values. Because we account for trends in profits by adding observations annually to a profitability group, the number of observations is not constant across quintiles. Per period average free cash flow, percentage of dividend-paying firms and payout ratio are reported for each profitability group. The payout ratio is set to one in cases where a firm with a loss pays a dividend, which explains why the fraction of firms that pay dividends equals the payout ratio for loss-making firms.
The percentage of dividend-paying firms increases with profitability up to 1938, the payout ratio until quintile three, and then decreases. The more profitable a firm, the more likely it is that it will pay dividends, which is line with typical statutory arrangements. The fact that payout ratio is increasing with profitability can be partially explained by firms’ endeavour to pay promised dividend amounts and statutory requirements to add to reserves. Moving through the quintiles for the period 1948–83, we observe an increasing fraction of dividend-paying firms, and increase in payout ratio only until the second quintile, with increasing profitability. These findings are in line with expectations based on dividend smoothing, where dividends tend to be paid by most firms. For the period 1988–2003, we find the percentage of dividend-paying firms to be high and payout ratio low independent of profitability group; even 11 per cent of loss-incurring firms, compared to 2–3 per cent in earlier periods, pay dividends. Dividend policy is clearly largely independent of profitability or profitability levels during this period. In summary, the descriptive statistics show that there is merit in subdividing the twentieth century into separate regimes with respect to dominant practices regarding corporate dividend policy. Subsequently studying the determinants of dividend policy will help to reinforce the shifts between these regimes.
To better understand the determinants of dividend payments, we first undertake a descriptive analysis of each of the three periods. Table 4 reports mean and median values for our variables, while Table 5 presents results based on comparing the dividend policy determinants for paying and non-paying firms; that is, we provide the means and results of t-tests based on the means.
Descriptive statistics for different time periods

Notes: This table contains descriptive statistics for Dutch non-financial firms listed on the stock exchange of Amsterdam during the period 1903–2003, which consists of 20 cross-sections of five-year intervals. For the periods 1903–38, 1948–83 and 1988–2003, we report per variable the mean and median. Definitions of the variables are provided in Table A1 in the Appendix.
Differences between firms that pay dividends and those that do not pay dividends

Notes: This table contains descriptive statistics for Dutch non-financial firms listed on the stock exchange of Amsterdam during the period 1903–2003, which consists of 20 cross-sections of five-year intervals. For the periods 1903–38, 1948–83 and 1988–2003, we report per variable the mean for dividend payers and non-payers. Definitions of the variables are provided in Table A1 in the Appendix.
The results in Table 4 demonstrate that over time the firms have become more profitable, levered and larger, while the fraction of family firms has fallen, in particular in the final period. Because these characteristics are potentially determinants of dividend policy, it is important to control for these differences in multivariate models. Table 5 reveals that firms that do and do not pay dividends differ in many respects, in all three periods. Again, this is a reason to conduct multivariate models and focus the tests of our predictions also on the regression models, rather than bivariate comparisons. Results of multivariate analyses are reported in Table 6. Table 6 elucidates the question of why firms pay dividends, panel A reporting regression coefficients and p-values per variable and numbers of observations, pseudo R-squared, and AIC information criterion per model. Panel B reports the differences between the three subsamples and panel C reports the results of the Shapely variance-decomposition based on the logit regressions in panel A, showing each variable's contribution to the model's overall explanatory power.
Why do firms pay a dividend?

Why do firms pay a dividend? (continued)

Why do firms pay a dividend? (continued)

Notes: This table presents the results of the logit regressions for the periods 1903–38, 1948–83 and 1988–2003 for Dutch non-financial firms listed on the stock exchange of Amsterdam during the period 1903–2003, which consists of 20 cross-sections of five-year intervals. The explained variable is dividend payments. In panel A, we report per variable the regression coefficient and the p-value and per model the number of observations, the pseudo R-squared and the AIC-information criterion. Panel B contains the results of the Shapely variance decomposition based on the logit regressions in panel A, i.e. it shows the contribution of each variable and the sum of the fixed effects to the overall explanatory power of the model. Definitions of the variables are provided Table A1 in the Appendix. In order to avoid biased standard errors, we estimate our models by applying a logit regression method with firm clustered standard errors, including industry and year dummies. The intercept is included in the model but not reported in the table. P-statistics are included in parentheses. Estimated coefficients marked with ***, ** or * are significant at the 1%, 5% or 10% level, respectively (two-sided). Panel C shows combined period logit regressions and depicts the interaction effects between period dummies and the variables of interest. We combine 1903–38 with 1948–83 and 1948–83 with 1988–2003. We subsequently interact our variables of interest with regime dummies (i.e. a variable equal to 1 if an observation is from the period 1948–83 or 1988–2003). We subsequently test the difference between coefficients from the different regimes. We present average marginal effects and test the difference of these marginal effects at the 25th, 50th and 75th percentile of each variable. For the calculation of the appropriate marginal effects we use the delta method, for the test of difference in coefficients we report the chi-squared test statistic. For the OLS-regressions the test for difference in coefficients follows a chi-distribution; we report these test statistics in square brackets.
Table 6 shows the average marginal effects for the determinants of the decision to pay dividends across the distribution of each variable.Footnote 17 For the period 1903–38, we find the decision to pay dividends to be determined, as expected, largely by profitability; that is, we estimate a significant positive relation for free cash flow and significant negative effect of reported losses, both at the 1 per cent level. In other words, until the 1940s Dutch firms paid dividends according to shareholder demands, i.e. when profits were sufficient and refrained from paying dividends when losses were incurred. Reserves were not used to pay dividends when profits were insufficient. In line with the notion that cash is needed to pay dividends, we observe a significant positive effect for liquidity on the decision to pay dividends (significant at the 1 per cent level). These results are consistent with the notion of dividends being determined by statutory arrangements. We find that for each additional percentage point of free cash flow to total assets, that is, moving from 7 to 8 per cent, the average firm is 120 per cent more likely to pay a dividend, while a firm that reports a loss is 50 per cent less likely than the average firm to do so. We control for other variables and find that size and net working capital also influence dividend policies.Footnote 18
The results of the variance-decomposition, also reported in panel B, show the free cash flow and loss variables contribute two-thirds of the explanatory power of the model during this period (24% of the R2 of 36%). Overall, our results for the first period are in line with firms meeting shareholders’ demands for dividends as fraction of earnings and relatively high payouts, which can be used for consumption and as credible evidence on firm profitability.
For the period 1948–83, the two profitability variables are similar in both sign and significance level. According to panel C we find a significantly lower value for the coefficient of free cash flow, however, and the added value of this variable is also much lower according to the variance-decomposition. Our finding that reserves increase the likelihood that a firm will pay a dividend (significant at the 1 per cent level) can be explained by the introduction of smoothing to dividend policy, which views reserves of previously retained earnings as an additional source of dividend payments. As mentioned before, in this period, dividend policy was referred to as reservation policy, in line with shareholders’ changed demands for stable instead of high payouts. The change in the coefficient for reserves between the first and second period is significant at the 1 per cent level (panel C). We find that for each additional percentage point of reserves relative to firm assets, the average firm is about 60 per cent more likely to pay a dividend. Panel B shows that the free cash flow, loss and reserves variables contribute most to the explanatory power of the model during this period. For our control variables we find again that larger firms pay more dividends.
From 1988 to 2003, profitability still influences the decision to pay dividends, but now through only the negative effect of losses. That firm profitability no longer yields a significant effect is striking and consistent with the idea of earnings decoupling. As mentioned before, disclosure has improved and the shareholder base of Dutch firms is now comprised of (international) institutional investors, with less appetite for dividends. As in the previous period, we find reserves to be positively related to the decision to pay dividends (significant at the 1 per cent level). The significant (at the 10 per cent level) positive sign for liquidity during this period can be explained by free cash flow theory, in which liquidity represents actual cash, that is, cash not yet used in a project, with a positive net present value, that should be returned to the firm's shareholders. For the control variables we find that large firms, family firms and firms with less leverage are more inclined to pay dividends.Footnote 19 Panel B shows an increase in the contributions of firm size, free cash flow, losses, and reserves to the explanatory power of the model during this period.
We find in panel B of Table 6 that the determinants of the choice to pay dividends or not to pay dividends significantly changed from 1903–38 to 1948–83. These changes are substantially less significant for the second regime shift. However, this is largely due to the fact that in the last period paying a dividend became the norm. This finding is consistent with catering towards the new owners, and in particular a confirmation of earnings decoupling in the regime shift between 1948–83 and 1988–2003.
Although our main goal is to explain why firms pay dividends, Table 7 responds to the question of the amounts of dividend payments across the three periods.
How much dividend do firms pay?

How much dividend do firms pay? (continued)

Notes: This table presents the results of the OLS regressions for the periods 1903–38, 1948–83 and 1988–2003 for Dutch non-financial firms listed on the stock exchange of Amsterdam during the period 1903–2003, which consists of 20 cross-sections of five-year intervals. The explained variable is payout ratio. Where both dividends paid profits should be larger than zero.
In panel A, we report per variable the regression coefficient and the p-value and per model the number of observations, the R-squared, the adjusted R-squared and the AIC-information criterion. The last two columns highlight the statistical difference between the periods, based on regressions using interaction effects. Panel B contains the results of the Shapely variance decomposition based on the OLS regressions in panel A, i.e. it shows the contribution of each variable and the sum of the fixed effects to the overall explanatory power of the model. Definitions of the variables are provided in Table A1 in the Appendix. In order to avoid biased standard errors, we estimate our models by applying an OLS regression method with firm clustered standard errors, including industry and year dummies. The intercept is included in the model but not reported in the table. P-statistics are included in parentheses. Estimated coefficients marked with ***, ** or * are significant at the 1%, 5% or 10% level, respectively (two-sided).
The variance-decomposition in panel B shows the largest contribution to the explanatory power of the model for payout ratio to be from free cash flow, followed by tangibility. We observe an expected negative relationship (significant at the 5 per cent level) between free cash flow and payout ratio, because the ratio scales by free cash flow and dividends do not increase proportionally to free cash flow. Our finding that leverage decreases payout ratio (significant at the 1 per cent level) suggests that commitments to pay increased interest and face value make managers cautious about simultaneously increasing payouts. We find tangibility to have a negative relation with payout ratio (significant at the 5 per cent level), which reflects a firm's commitment of more capital to financing fixed assets, an important consideration, especially during periods of considerable investment. For the 1948–83 period, panel B shows the largest contribution to the explanatory power of the model for payout ratio to be made by free cash flow, followed by tangibility, firm size and leverage. Liquidity was of little importance during this period. We find that dividend payout decreases with firm size (significant at the 5 per cent level, and the difference between the coefficient of the first and second period is significant at the 1 per cent level), especially in the post-war period characterised by heavy investments in rebuilding firms and the economy. A significantly negative (at the 5 per cent level) relationship is observed between free cash flow and payout ratio. The fact that an increase in reserves reduces the payout ratio leads us to assume an inverse causality, that dividends decrease reserves. Our finding that leverage decreases payout ratio (significant at the 1 per cent level) suggests, as noted above and not surprising during a period in which dividend smoothing was perceived as extremely important, that commitments to pay increased interest and face value makes managers cautious about simultaneously increasing payouts. We find that tangibility decreases the payout ratio (significant at the 5 per cent level). Firm size, leverage and net working capital were no longer significant, and profitability was no longer relevant to explaining payout ratio, in the 1988–2003 period. Our finding that reserves increased payout ratio (significant at the 5 per cent level) suggests that firms used reserves to boost dividends during this period, and our finding that liquidity increased payout ratio (significant at the 5 per cent level) can be explained, as noted above, by free cash flow theory, in which liquidity represents cash not yet allocated to a project, with a positive net present value, that should be returned to firm shareholders. Tangibility has a significant (at the 5 per cent level) negative relation with payout ratio. Increasing tangibility increases long-term capital commitments, but reduces information asymmetry about the use of capital and consequently the need for signalling. Panel B acknowledges tangibility to be the most important variable in this period and contribute most to the model's explanatory power. So diminished was the importance of free cash flow that dividends could be considered to be decoupled from profitability.
Our analyses thus far have explained how changes in shareholder preferences shape dividend policies using a set of variables based on three distinct practices that dominated the twentieth-century Dutch economy. These analyses approach dividend policy from the perspective of corporate decision-makers, but dividend policy is also reflected upon by shareholders via the stock market valuation of firms (Baker and Wurgler Reference Baker and Wurgler2004a, Reference Baker and Wurgler2004b). We measure the relation between dividend policy and market valuation using the dividend payment dummy and payout ratio in each of the five-year intervals over 1903–2003, and the market-to-book ratio of equity five years later, i.e. over 1908–2008. This lead–lag structure ensures that the dividend payments over year t, which will be publicly announced in year t + 1, can be incorporated in the market valuations (measured in year t + 5). We obviously lose observations, due to the absence of market value information five years after the year over which the dividend was paid.
We measure the market value of equity relative to book value. For the period before 1973, we calculate the firm's stock price as the average of its highest and lowest quotation in a particular year.Footnote 20 For the period after 1973, we use the year-end stock price of the firm as found in Reach or Datastream. These stock prices are then multiplied by the number of shares outstanding (obtained from the same source) and divided by the book value of the firm's equity. Although shareholder value creation became a key goal of firms in the 1980s, market valuation is a meaningful measure of shareholder perceptions of dividends in the entire twentieth century.
The effect of dividend policy on firm value is investigated in Table 8, which presents the five-year forward relation between dividend policy and market valuation. Panel A investigates the effect of dividend payments, while panel B examines the effect of payout ratio for dividend-paying firms.
Market price consequences of dividends

Market price consequences of dividends (continued)

Notes: This table presents the results of the OLS regressions and a long-term event study for the periods 1903–38, 1948–83 and 1988–2003 for Dutch non-financial firms listed on the stock exchange of Amsterdam during the period 1903–2003, which consists of 20 cross-sections of five-year intervals. The explained variables are market-to-book or changes in market-to-book. We summarise the OLS regression results for market-to-book, i.e. we report per variable the regression coefficient and the p-value, and per model the number of observations, the R-squared, the adjusted R-squared. Definitions of the variables are provided in Table A1 in the Appendix. The dependent variable is the five-year lead of the firm's market-to-book ratio. In order to avoid biased standard errors, we estimate our models by applying an OLS regression method with firm clustered standard errors, including industry and year dummies. The intercept is included in the model but not reported in the table. P-statistics are included in parentheses. Estimated coefficients marked with ***, ** or * are significant at the 1%, 5% or 10% level, respectively (two-sided). Panel A highlights the effect for the decision to pay dividends and panel B shows the effect for dividend payers and their choice in payout ratio.
For the period 1903–38, during which dividends were dependent on statutory arrangements and firm profits, we find a significant (at the 1 per cent level) positive effect of the decision to pay dividends and payout ratio on market-to-book valuation. The economic effects are large, showing that paying a dividend corresponds with an increase in value by 25.4 per cent of book equity. We argue that Table 8 reports the firm characteristics of the shares that are in relatively high demand by investors. That is firms with a higher market valuation relative to their book value have seen an increase in demand for their share (i.e. higher price), when they paid a dividend during the first regime. More precisely, firms that paid a dividend during this period were characterised by an increase in demand for their shares (i.e. higher price). Paying dividends thus provides information about firm performance, and the fraction of distributed earnings increases firm value. This finding is intuitive since any disclosure of financial information during this period was fully voluntary.
Results for the 1948–83 period are consistent with the notion of smoothing dividends and heavy investment after World War II by firms with limited access to capital. Recalling that financial reporting improved significantly after 1970, we find dividend payments to continue to have a significant positive and the payout ratio to now have a significantly smaller, yet still positive, effect on market-to-book. Whether or not dividends are paid thus provides information about firm performance. Similarly, dividend amounts become less informative about firm value with smoothing, but still have a positive effect on value.
For the period 1988–2003, we find no significant relation between the decision to pay dividends or between the payout ratio and market-to-book. Tables 1 and 2 reported the fraction of dividend-paying firms to be high and payout ratio low. This explains the insignificance of dividend payments and payout ratio, paying a small dividend having become the norm, but also having become a symbolic action with little informational value regarding a firm's prospects. Paradoxically, signalling theory has boosted the number of dividend-paying firms such that signalling no longer discriminates the quality of firms.Footnote 21
We conclude from the foregoing results that dividend policy has a significant effect on firm valuation, and, most importantly, that the results for the different periods are consistent with the changing shareholders’ preferences.
IV
We attempt to understand the dividend policies of Dutch firms over the course of the twentieth century by answering three related questions. Why do firms pay dividends? In what amounts do firms pay dividends? What are the value effects of dividend policies? We find the determinants of the answers to these questions are by no means stable over time.
Our study documents significant changes in dividend policies over the course of the twentieth century, where firms cater to the demands of shareholders. We identify three distinct dividend policy regimes, and each regime is dictated by shareholders preference and an economic logic that fits with its day and age. The fraction of dividend-paying firms is volatile and payout ratio high in the pre-war years, because shareholders as residual claimants receive most of the net profits. In the post-war period, we observe stable dividend policies and somewhat diminished dividend payments, where shareholders become more distant to the firms and prefer a smooth income stream from their holdings. From the early 1980s onward, dividend payments seem to be the norm, the amount of profits distributed much smaller, while shareholders become more interested in stock returns and dividend payments become more symbolic.
Although our analyses cover a lengthy period, we acknowledge the limitation of relying on data from a single country. We nevertheless believe our results contribute to debates about long-term developments in dividend polices. We recognise that our findings are perhaps difficult to relate to previous historical and contemporary literature because of differences in data, time span and methodology. However, our analysis for the most recent period is consistent with observations of symbolic dividends and earnings decoupling (Zajac and Westphal Reference Zajac and Westphal2004; Brav et al. Reference Brav, Graham and Harvey2005). More profoundly, our finding strongly relates to the catering effects documented by Baker and Wurgler (Reference Baker and Wurgler2004a, Reference Baker and Wurgler2004b), who show that dividend policies during the period 1963–2000 followed shareholders’ appetite for catering based on relative market valuations of (non)dividend-paying stocks. This conclusion also yields questions for further research. For example, do shareholders or firm managers take the initiative to adjust dividend policies? Which firms are early adopters of the new policies and which firms are late or even non-adopters of the changes in dividend policy? These questions can only be answered with additional data and analyses using a higher frequency of observations.
Appendix
Variable descriptions and definitions


 Open access