

The recent escalating obesity trend in man is due to an imbalance between energy intake and energy expenditure(1, Reference Mokdad, Ford, Bowman, Dietz, Vinicor, Bales and Marks2). Energy intake is influenced by the effect of food's energy density, total energy content and feeding frequency and the extent to which these alter satiety. Of these factors, feeding frequency has received least attention. Epidemiological evidence in human subjects indicates increasing trends in recent years of dietary snacking and increased meal frequency(Reference Samuelson3, Reference Berteus-Forslund, Torgerson, Sjostrom and Lindroos4) and such studies show positive relationships between snacking and increased energy intake and BMI(Reference Berteus-Forslund, Torgerson, Sjostrom and Lindroos4), illustrating the potential importance of investigating feeding frequency.
Several gastrointestinal peptides are involved in metabolic processes and are dysregulated in states of metabolic disease(Reference Woods5–Reference Moran and Kinzig7). One of these peptides, ghrelin, an orexigenic hormone released by the stomach prior to feeding, has also been implicated in the control of fuel metabolism, appetite and pancreatic insulin release, factors quite central to the onset of metabolic disease(Reference Kojima, Hosoda, Date, Nakazato, Matsuo and Kangawa8). In 2002, Sugino et al. reported the effects of meal frequency on ghrelin responses in sheep(Reference Sugino, Yamaura and Yamagishi9). Increased meal frequency decreased ghrelin responses during the day; however, energy intake was not controlled between the different feeding regimens, thus complicating the interpretation of their findings(Reference Sugino, Yamaura and Yamagishi9).
Various eu- and hyperglycaemic clamp studies in human subjects demonstrate that postprandial ghrelin suppression appears to be dependent on insulin release(Reference Flanagan, Evans, Monsod, Rife, Heptulla, Tamborlane and Sherwin10–Reference Saad, Bernaba, Hwu, Jinagouda, Fahmi, Kogosov and Boyadjian12) and in insulin-withdrawn type 1 diabetics, postprandial ghrelin suppression is not apparent(Reference Murdolo, Lucidi and Di Loreto11). In insulin-resistant states, such as obesity and type 2 diabetes mellitus (T2DM), where fasting ghrelin is down regulated(Reference Tschop, Weyer, Tataranni, Devanarayan, Ravussin and Heiman13), the magnitude of the postprandial ghrelin suppression is also smaller(Reference McLaughlin, Abbasi, Lamendola, Frayo and Cummings14). This is surprising, given the hyperinsulinaemia that prevails in such states, and suggests that insulin sensitivity may be important to ghrelin responses. The effects of feeding frequency on concomitant insulin and ghrelin responses are not currently known. Therefore, the present study investigated the effects of meal frequency during equi-energetic feeding regimens upon the responses of insulin and ghrelin.
Experimental methods
Study participants
Following ethical approval from The School of Sport and Exercise Sciences Safety and Ethics Subcommittee, five lean male volunteers, aged 24 (sem 2) years, body mass 75·7 (sem 3·2) kg, with BMI 23·8 (sem 0·8) kg/m2, were recruited from the local community. All volunteers were assessed by a general health questionnaire and provided informed written consent prior to commencing the study. A dietary record was taken for the day preceding the first test and volunteers were instructed to refrain from consuming alcohol, caffeine and from any exercise for 24 h prior to each trial. The dietary record was for the purposes of diet replication before each subsequent trial.
Study design
Participants were studied in a reclined position for the duration of all trials (although habitual activity for toilet visits was permitted) and each completed three 8 h dietary interventions, separated by at least 5 d, in a randomized cross-over design: a fasting control trial (FAST); a low-frequency meal trial (LOFREQMEAL); a high-frequency meal trial (HIFREQMEAL). The meals provided in the trials had a macronutrient composition intended to replicate typical foods eaten during the day: 64 % carbohydrate (1·93 g/kg per LOFREQMEAL, 0·32 g/kg per HIFREQMEAL); 23 % fat (0·30 g/kg per LOFREQMEAL, 0·05 g/kg per HIFREQMEAL); 13 % protein (0·42 g/kg per LOFREQMEAL, 0·07 g/kg per HIFREQMEAL). This provided approximately 66 % of the daily recommended intake (6·98 MJ (1667 kcal) of recommended 10·5 MJ (2500 kcal) for a 70 kg man)(15), the final 33 % being an evening meal of the volunteers' choice after completion of each trial. Trial meals consisted of white bread, Nutrigrain bars, apples and cheddar cheese. The total energy intake was identical in each trial; however, the number of meals was varied, as explained later.
Fasting control trial
Volunteers arrived in the laboratory at 08.00 hours following a 12 h overnight fast. An intravenous cannula (BD Venflon, Oxford, UK) was inserted into an antecubital vein and a fasting blood sample was taken. Venous blood samples (3 ml) were drawn from the intravenous line every 10 min until t = 8 h, to be later analysed for insulin and ghrelin concentrations. During the trial the cannula was kept patent with 3 ml flushes of 0·9 % NaCl(aq) isotonic saline (Baxter Healthcare, Northampton, UK) following each blood-letting. Each participant was given 14·3 ml/kg water to consume ad libitum throughout the trial. This volume of water corresponded to 1 litre per 70 kg body mass, which was considered appropriate for the intervention.
Low-frequency meal trial
The experimental protocol for this trial was identical to FAST, except at t = 0 and 4 h participants consumed a 4·95 g/kg mixed meal (composition described earlier). Subjects were given 15 min to ingest each meal. Subjects were again asked to consume 14·3 ml/kg water ad libitum throughout the trial.
High-frequency meal trial
This trial was identical to FAST and to LOFREQMEAL, except that 0·825 g/kg mixed meals were administered every 40 min throughout the trial commencing at t = 0 min, making a total of twelve meals. Participants were given 5 min to finish their meals. Again, the same volume of water was provided for ingestion ad libitum.
In the feeding frequency literature, there is no consistency in the number or composition of meals administered. The only available 1 d intervention by Bertelsen et al. used an 8 h period, so that was replicated here(Reference Bertelsen, Christiansen, Thomsen, Poulsen, Vestergaard, Steinov, Rasmussen, Rasmussen and Hermansen16). The choice of two and twelve meals was made in relation to the range of meal frequencies in the available publications(Reference Bertelsen, Christiansen, Thomsen, Poulsen, Vestergaard, Steinov, Rasmussen, Rasmussen and Hermansen16–Reference Jenkins, Wolever and Vuksan22): one to three (low-frequency) v. six to seventeen (high-frequency).
Blood sampling and analysis
Blood samples were collected into plain tubes (BD Vacutainers, Oxford, UK) for insulin analysis, sodium fluoride tubes for glucose analysis (BD Vacutainers) and into EDTA tubes (BD Vacutainers) for ghrelin analysis. EDTA tubes were pre-treated with 30 μl apoprotinin (Sigma, UK) per 300 μl plasma. All samples were kept on ice at 4°C for no more than 30 min prior to plasma/serum separation. Vacutainers were centrifuged at 3000 g for 10 min at 4°C and their plasma/serum constituent separated and stored in 1·5 ml microtubes (Eppendorf UK Ltd, Cambridge, UK) at − 70°C for later analysis. Insulin concentrations were determined using a commercially available two-site direct-sandwich ELISA assay (DRG Instruments GmbH, Germany) (SI units; μU/ml × 6·945 = pmol/l). Glucose was measured via an automated spectrophotometric assay (Cobas Mira). Ghrelin was measured by a competitive 125I-peptide RIA on unextracted plasma using a commercially available kit (Phoenix Peptides, CA, USA). Intra-assay CV were 5·34, 5·16 and 3·66 % for insulin, glucose and ghrelin respectively.
Statistical analysis
Data are expressed as means with their standard errors of the mean and significant differences were accepted at P < 0·05. Raw data were tested for normality and analysed by two-way (trial × time) repeated measures ANOVA. Main effects were analysed using Bonferroni post hoc tests. Raw insulin, glucose and ghrelin data were converted to area under the curve (AUC) values by the trapezoidal method and trials were compared using one-way ANOVA. Fasting ghrelin concentrations in each trial were also compared using one-way ANOVA to assess the effect the presentation of different sized meals in LOFREQMEAL and HIFREQMEAL may be having. These analyses were carried out with SPSS for Windows 12.0.1 (SPSS Inc., Chicago, IL, USA).
In order to analyse the ghrelin response patterns in each of the three trials, and highlight the differences otherwise not detected by ANOVA, a pulse analysis was performed using Cluster 8, a sub-program of Pulse_XP (Pulse_XP, VA, USA), to identify peaks and nadirs in the ghrelin data(Reference Veldhuis and Johnson23). Cluster 8 is a statistically based peak detection algorithm, which locates significant increases and decreases of hormone concentrations within a data series. Cluster 8 does not assess hormone–hormone interaction but determines whether the data series of a single hormone represents pulsatile secretion rather than assay noise, providing information about the pulse characteristics: number of peaks; number of nadirs; peak duration and height; area under the peak; nadir width. Changes in pulse characteristics under different conditions may then be studied(Reference Veldhuis and Johnson23). Pulse analysis and peak detection is an important phenomenon in endocrine systems as it is thought that endocrine glands signal to their target tissues via episodic hormonal secretion(Reference Veldhuis and Johnson23–Reference Meneilly, Veldhuis and Elahi25). Pulse analysis of the insulin data was not possible due to the irregular sampling frequency (see Fig. 1), upon which the software cannot work.
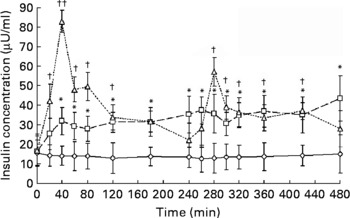
Serum insulin responses to meal ingestion. The three trials, fasting control trial (FAST; –⋄–), high-frequency meal trial (HIFREQMEAL; –□–) and low-frequency meal (LOFREQMEAL; - -△- -), represent 8 h intervention periods where no meals, twelve meals or two meals were ingested, respectively. Meals within trials were equi-energetic and total energy consumption between HI- and LOFREQMEAL was identical. Data differed from baseline (t = 0 min) at many time points: all except t = 20 min in HIFREQMEAL; and all except t = 180, 240, 260 and 480 min in LOFREQMEAL (*P < 0·05; †P < 0·05; ††P < 0·01). No differences were found during FAST (P>0·05). A main effect of trial and further post hoc analysis indicated that LOFREQMEAL and HIFREQMEAL were significantly different to FAST (P < 0·05) but not to one another (P = 0·13). Data represent means with standard errors of the mean.
In order to examine the relationships between insulin and ghrelin responses, a time-series analysis was applied(Reference Box, Jenkins and Reinsel26, Reference Carroll27). Pearson correlation coefficients (r) were calculated between insulin and ghrelin concentrations synchronized in time in each trial. Such analysis was carried out because previous publications have shown that changes in insulin concentrations appear to regulate changes in ghrelin concentrations(Reference Flanagan, Evans, Monsod, Rife, Heptulla, Tamborlane and Sherwin10–Reference Saad, Bernaba, Hwu, Jinagouda, Fahmi, Kogosov and Boyadjian12, Reference Mohlig, Spranger, Otto, Ristow, Tschop and Pfeiffer28). In addition, to investigate any possible time delay between such relationships, correlations were made between insulin values and the ghrelin values measured 10, 20, 30, 40, 50, 60 and 70 min later. This was carried out because Cummings et al. showed that the postprandial fall in ghrelin appears to be delayed after the rise in insulin(Reference Cummings, Purnell, Frayo, Schmidova, Wisse and Weigle29). Furthermore, in other examples of endocrine system synergy (e.g. ghrelin and growth hormone(Reference Peino, Baldelli and Rodriguez-Garcia30)), there is often a time delay between such responses. These analyses were repeated for glucose and insulin, and glucose and ghrelin responses. The 70 min period was chosen in retrospect as, by examining the ghrelin/insulin profiles, a 70 min delay captured the largest postprandial changes in insulin and ghrelin. Note that due to the irregular sampling of insulin (see Fig. 1), the correlations between insulin and ghrelin were performed between 15 data points only, at t = 0, 20, 40, 60, 80, 120, 180, 240, 260, 280, 300, 320, 360, 420 and 480 min. This reduces the power of this analysis compared with a more frequent insulin sampling rate, where more data points would be available to investigate these correlations.
Results
Glucose responses
Plasma glucose responses are displayed in inset graphs on the time-series analysis. Two-way ANOVA indicated a main effect of time (P < 0·01), trial (P < 0·01) and a time × trial interaction (P < 0·05). In FAST, glucose demonstrated a non-significant decrease with time, and in HIFREQMEAL plasma glucose reached a sustained day-long plateau of 6·83 (sem 0·28) mmol/l. Area under the glucose response curves were elevated in HI- (3232 (sem 130) mmol/l × 8 h) and LOFREQMEAL (3131 (sem 177) mmol/l × 8 h) trials compared with FAST (2115 (sem 143) mmol/l × 8 h), although the two meal trials were not different to each other (P>0·05).
Insulin responses
Fig. 1 shows serum insulin responses during the three trials. Two-way ANOVA revealed a main effect of time (P < 0·01), trial (P < 0·01) and a time × trial interaction (P < 0·01). During the HIFREQMEAL, serum insulin concentrations reached a plateau (mean concentration, 33·9 (sem 7·7) μU/ml) during the 8 h intervention period. During FAST, insulin steadily decreased over time from 15·6 (sem 6·5) to 12·7 (sem 6·9) μU/ml (P>0·05).
Area under the insulin response curves for the 8 h periods were increased in LOFREQMEAL and HIFREQMEAL by 172 (sem 37) % (17·9 (sem 2·6) × 103 μU/ml × 8 h) and 142 (sem 18) % (15·9 (sem 3·3) × 103 μU/ml × 8 h) respectively when compared with FAST (6·58 (sem 4·06) × 103 μU/ml × 8 h) (P < 0·05), but no differences were found between the two meal trials (P = 0·18; Fig. 2).
Area under the insulin response curves (AUC) following meal ingestion. The three trials depicted on the x-axis are described in brief in Fig. 1. Total insulin responses (AUC) for the 8 h period were greater in the high-frequency meal trial (HIFREQMEAL) and low-frequency meal trial (LOFREQMEAL) than in the fasting control trial (FAST) (*P < 0·05) but not different from one another (P = 0·18). Data represent means with their standard errors of the mean.

Ghrelin responses
Fig. 3 illustrates the plasma ghrelin concentrations. Analysis revealed a main effect of time (P < 0·01), trial (P < 0·01) and a time × trial interaction (P < 0·01). During FAST, ghrelin steadily increased with time from 253 (sem 9) to 315 (sem 9) pmol/l, reaching significance at several time points (P < 0·05) (see Fig. 3). No differences were found between fasting pre-prandial ghrelin concentrations (P>0·05), although the comparison between fasting ghrelin in LOFREQMEAL and HIFREQMEAL approached statistical significance (P = 0·08). Compared with FAST (140 (sem 5) × 103 pmol/l × 8 h), total area under the ghrelin response curves for the 8 h intervention periods was decreased by 19·4 (sem 6·4) % (113 (sem 10) × 103 pmol/l × 8 h) and 20·2 (sem 4·5) % (112 (sem 9) × 103 pmol/l × 8 h) during LOFREQMEAL and HIFREQMEAL respectively (P < 0·05), but no differences were found between the two meal trials (P>0·05; Fig. 4).
Plasma ghrelin responses to meal ingestion. The three trials, fasting control trial (FAST), the high-frequency meal trial (HIFREQMEAL) and the low-frequency meal trial (LOFREQMEAL), represent 8 h intervention periods where no meals, twelve meals or two meals were ingested, respectively (as indicated by ↓ ). Data differed from baseline (t = 0 min) at many time points in FAST and LOFREQMEAL (*P < 0·05; **P < 0·01), no change from baseline was found in HIFREQMEAL (P>0·05). A main effect of trial and further post hoc analysis revealed that LOFREQMEAL and HIFREQMEAL were different from FAST (P < 0·01) but not different from one another (P>0·05). No differences were found between fasting (pre-prandial) ghrelin concentrations in each trial (P>0·05). However, LOFREQMEALv. HIFREQMEAL approached significance (P = 0·08). Pulse analysis revealed different numbers of significant peaks and nadirs between trials, illustrating the difference in ghrelin secretion patterns during the different feeding interventions. The flat line inserts are arbitrary representations of the significant peaks and nadirs during the trial. Data are expressed as means with their standard errors of the mean.

Area under the ghrelin response curves following meal ingestion. The three trials depicted on the x-axis are described in brief in Fig. 3. Total ghrelin responses for the 8 h period were lower in the high-frequency meal trial (HIFREQMEAL) and the low-frequency meal trial (LOFREQMEAL) than the fasting control trial (FAST) (*P < 0·05) but not different from one another (P>0·05). Data represent means with their standard errors of the mean.

Ghrelin pulse analysis
The flat line inserts on Fig. 3 illustrate the significant peaks and nadirs from the pulse analysis, showing that ghrelin exhibited four peaks and four nadirs during FAST, one peak and two nadirs during LOFREQMEAL and four peak and five nadirs during HIFREQMEAL. Table 1 shows additional information generated by the pulse analysis.
(Values are means with their standard errors of the mean)
* For details of diets and procedures, see Experimental methods.
† The fasting control trial (FAST), the low-frequency meal trial (LOFREQMEAL) and the high-frequency meal trial (HIFREQMEAL) represent the same trials as described in Fig. 3. Ghrelin responses between LOFREQMEAL and HIFREQMEAL were distinct as depicted by the different number of significant peaks and nadirs, and different peak and nadir characteristics.
Insulin–ghrelin relationships
Fig. 5 indicates the temporal relationship between the two hormones during the three trials. In FAST there was a negative correlation between insulin and ghrelin concentrations (P < 0·05). During LOFREQMEAL, there was no direct correlation (simultaneous insulin and ghrelin values, see insulin leads ghrelin by 0 min on Fig. 5) between insulin and ghrelin; however, there was a negative correlation when insulin led ghrelin responses by 20, 40 and 50 min (P < 0·05). During HIFREQMEAL no significant relationship existed between insulin and ghrelin responses (all time delays; P>0·05).
Relationships between insulin and ghrelin responses. The three panels represent the time-series analysis in each trial. Correlation coefficients were calculated for relationships between insulin and ghrelin responses over the 8 h period. These were calculated when the two variables were synchronized in time (insulin correlated with simultaneous ghrelin value, see ‘insulin leads ghrelin by 0 min’) and relationships were also assessed between the insulin concentrations and the ghrelin concentrations observed 10, 20, 30, 40, 50, 60 and 70 min later. The insert graph on each panel illustrates the trends in ghrelin (—, pmol/l) and insulin (- - - -, μU/ml) concentrations in the corresponding trial. During the fasting control trial (FAST; (A)) there was a negative relationship between insulin and ghrelin (*P < 0·05; **P < 0·01). During the low-frequency meal trial (LOFREQMEAL; (B)), there was a negative correlation between insulin and ghrelin responses, reaching significance when insulin led ghrelin by 20, 40 and 50 min (*P < 0·05). During the high-frequency meal trial (HIFREQMEAL; (C)) there were no significant associations between insulin and ghrelin (P>0·05).

Glucose–insulin relationships
Fig. 6 indicates the temporal relationship between glucose and insulin responses in the different trials. No relationship was evident in FAST (P < 0·05). During LOFREQMEAL there was a positive correlation between glucose and insulin. This existed when the two variables were synchronized in time (simultaneous insulin and ghrelin values, see insulin leads ghrelin by 0 min on Fig. 6) and when there was a 10 min time delay between glucose and insulin responses (P < 0·05). During HIFREQMEAL a significant relationship existed between glucose and insulin responses when synchronized in time (P < 0·05).
Relationships between glucose and insulin responses. The insert graph on each panel illustrates the trends in glucose (—, mmol/l) and insulin (- - -, μU/ml) concentrations in the corresponding trial. No glucose–insulin relationship existed during the fasting control trial (FAST; (A)) (P>0·05). During the low-frequency meal trial (LOFREQMEAL; (B)) there was a positive correlation between glucose and insulin responses, reaching significance when glucose and insulin were synchronized in time and when glucose led insulin by 10 min. Glucose and insulin responses were also correlated when synchronized in time during the high-frequency meal trial (HIFREQMEAL; (C)) (*P < 0·05; **P < 0·01).

Glucose–ghrelin relationships
Fig. 7 indicates the temporal relationship between glucose and ghrelin during the three trials. During FAST and HIFREQMEAL, no significant correlations existed between glucose and ghrelin concentrations (P>0·05). During LOFREQMEAL, a significant relationship between the two variables was found when glucose responses led ghrelin responses by at least 30 min (P < 0·05).
Relationships between glucose and ghrelin responses. The insert graphs illustrate the trends in glucose (—, mmol/l) and ghrelin (- - -, pmol/l) concentrations in the corresponding trial. No significant glucose–ghrelin relationships existed during the fasting control trial (FAST; (A)) or the high-frequency meal trial (HIFREQMEAL; (C)) (P>0·05). During the low-frequency meal trial (LOFREQMEAL; (B)) there was a negative correlation between glucose and ghrelin responses, reaching significance when glucose led ghrelin by at least 30 min (*P < 0·05; **P < 0·01).

Discussion
The present data demonstrate that whilst the insulin and ghrelin responses to different feeding frequency regimens are quite different (Fig. 1, Fig. 3, Table 1), such feeding patterns have no effect on the total (AUC) day-long responses when energy load is controlled (Figs. 2 and 4). During a period of prolonged fasting, it was clear that insulin and ghrelin concentrations have an inverse relationship (Fig. 5, FAST). The present study also illustrates that, during a period of low-frequency meal ingestion, insulin concentrations are inversely related to ghrelin concentrations (Fig. 5, LOFREQMEAL), but that when the same total energy load is consumed in smaller individual meals across the day, this insulin–ghrelin relationship is not observed (Fig. 5, HIFREQMEAL).
The time-series analysis of the two hormones was carried out to investigate the effects of meal frequency on the insulin–ghrelin association reported in the literature(Reference Flanagan, Evans, Monsod, Rife, Heptulla, Tamborlane and Sherwin10–Reference Saad, Bernaba, Hwu, Jinagouda, Fahmi, Kogosov and Boyadjian12, Reference Mohlig, Spranger, Otto, Ristow, Tschop and Pfeiffer28). During a period of fasting, the present data show that insulin falls slightly and ghrelin rises slightly with time, causing an inverse correlation between the two variables (Fig. 5, FAST). During a period of low-frequency feeding (two meals in 8 h), the results illustrate that although there is an insulin–ghrelin relationship, there is a delay (of approximately 20 min) between responses of the two hormones (Fig. 5, LOFREQMEAL). No significant correlation exists when no time-delay between the hormones' concentrations is applied (i.e. correlation of insulin with simultaneous ghrelin values, see insulin leads ghrelin by 0 min, LOFREQMEAL on Fig. 5). This illustrates that nutrient-induced rises in insulin may cause postprandial ghrelin suppression with a 20 min delay. Further evidence of an insulin–ghrelin relationship is shown by correlation of the magnitude of postprandial insulin and ghrelin changes (percentage change to peak/nadir from baseline for insulin and ghrelin: r 0·61, P < 0·05). Finally, during a period of high-frequency meal ingestion (twelve meals in 8 h), either the hormone–hormone interaction is lost or insulin does not fluctuate sufficiently to influence ghrelin. However, during FAST where changes in insulin concentrations are small (Fig. 1), there is a significant relationship between the two hormones (Fig. 5, FAST), illustrating that only small changes in insulin are required for effects on ghrelin. Thus, it is more likely that high-frequency meal ingestion actually reduces the insulin–ghrelin interaction. Whilst these are novel findings, these analyses are only correlations from which exact causality cannot be determined and, due to the irregular insulin sampling frequency, the loss of power associated with fewer time points being analysed means that such interpretations must be made with caution and may indeed explain the loss of significant hormonal relationships in HIFREQMEAL. An improved study design would be to measure insulin and ghrelin regularly and frequently at identical intervals. Despite this, several studies have documented that insulin is required for postprandial ghrelin suppression(1–Reference Saad, Bernaba, Hwu, Jinagouda, Fahmi, Kogosov and Boyadjian12, Reference Mohlig, Spranger, Otto, Ristow, Tschop and Pfeiffer28, Reference Lucidi, Murdolo, Di Loreto, De Cicco, Parlanti, Fanelli, Santeusanio, Bolli and De Feo31–Reference Anderwald, Brabant, Bernroider, Horn, Brehm, Waldhausl and Roden33). Additionally, reduced insulin-stimulated ghrelin suppression has been demonstrated in T2DM patients, illustrating the importance of insulin in regulating ghrelin(Reference Anderwald, Brabant, Bernroider, Horn, Brehm, Waldhausl and Roden33). The exact importance of an insulin–ghrelin relationship is unclear, but with insulin's known involvement in metabolic flux and ghrelin's implications with orexigenic neuropeptide networks(Reference van der Lely, Tschop, Heiman and Ghigo34), mitochondrial lipid metabolism gene expression(Reference Barazzoni, Bosutti and Stebel35) and fuel substrate selection(Reference Wortley, Anderson and Garcia36), such a relationship may provide a useful avenue for metabolic research. The current findings indicate that high-frequency feeding may be detrimental to insulin's control of ghrelin responses, a problem seen in T2DM patients(Reference Anderwald, Brabant, Bernroider, Horn, Brehm, Waldhausl and Roden33). However, with only correlation analyses to make this interpretation, suggesting that increased feeding frequency contributes to metabolic disease would be purely speculative and further work would be required to explore this concept.
We also performed time-series analyses on glucose–insulin and glucose–ghrelin relationships (Figs. 6 and 7). First, these data confirm that during feeding, insulin responds quickly to glucose fluctuations, perhaps with a slight time delay (see Fig. 6 (B)). Second, it is clear from Fig. 7 (B) that glucose may indeed influence ghrelin responses following low-frequency feeding. However, the time delay in this response is longer than that of the insulin–ghrelin relationship (Fig. 5 (B)), suggesting it is indeed the insulin response to nutrients that affects ghrelin.
The expense of ghrelin measurement limited this study to five subjects, thus reducing the statistical power of the data, potentially masking some group differences (e.g. HIFREQMEALv. LOFREQMEAL insulin AUC). Earlier work by Jenkins et al. showed that sipping glucose reduces insulin AUC across the day in healthy individuals compared with a bolus ingestion of glucose(Reference Jenkins, Wolever and Ocana37). The present work showed no differences in insulin responses between meal-feeding groups. We employed a mixed-meal design; thus, the addition of other macronutrients besides carbohydrates to the orally ingested load may differentially influence gastrointestinal and pancreatic responses (such as nutrient absorption and hormonal release), possibly explaining why Jenkins et al. found an effect on insulin AUC, but we did not. This is a phenomenon that warrants further attention, particularly in disease groups where such mechanisms may be altered. A recent study in sheep used the same sample size as the present study to show that increased feeding frequency decreased total ghrelin (AUC) responses(Reference Sugino, Yamaura and Yamagishi9). In contrast, the current findings do not show differences in day-long AUC insulin or ghrelin responses. There is a confounding factor in one experimental group of the work by Sugino et al., in that the ad libitum fed sheep consumed more energy (167 % of that consumed by the other groups); thus, it is not possible to determine if the difference between that group and the others is due to feeding frequency or energy consumed. However, Sugino's other groups (twice and four times feeding per d) were given the same energy as each other, but the AUC for ghrelin were significantly different. This is in contrast to the present study, where feeding frequency did not significantly alter ghrelin AUC. This could be due to a difference between the species, so future work should preferably be conducted in human subjects. Alternatively, it could be due to Sugino's sheep being accustomed to specific feeding patterns, which was not the case with these subjects. Sugino state their sheep were ‘trained to the assigned feeding regimen… for at least 10 days’. Since the pre-prandial surges in ghrelin are thought to be induced by the anticipation of the meal, it could be that training to a particular feeding pattern could alter the pre-prandial surges in ghrelin. Our human subjects were not trained to any particular feeding pattern, which might explain the difference between the findings of the present study and that of Sugino's group.
In the current study, it is evident that some difference may exist between fasting ghrelin concentrations prior to meal ingestion (Fig. 3). The comparison between HIFREQMEAL and LOFREQMEAL approached significance (P = 0·08), and therefore it may be that a larger energy load presented to an individual may cause a larger pre-prandial ghrelin surge. Pre-prandial ghrelin surges, triggered by visual or olfactory stimuli, are likely to provide a meal initiation signal that activates orexigenic neuropeptide pathways in the hypothalamus(Reference Meier and Gressner38, Reference Seoane, Lopez, Tovar, Casanueva, Senaris and Dieguez39). Current evidence shows energy-dependent postprandial ghrelin suppression(Reference Callahan, Cummings, Pepe, Breen, Matthys and Weigle40), but an energy-dependent effect on the pre-prandial ghrelin surge would be a novel finding. In retrospect, more pre-prandial measures in the hour before feeding would have allowed greater insight into pre-prandial ghrelin changes. A further limitation of the current study is that only total ghrelin was measured in the blood samples. Ghrelin is secreted from oxyntic glands of the stomach as an acylated (at serine-3) and a desacylated form; the acylated form is thought to be the biologically active peptide(Reference Kojima, Hosoda, Date, Nakazato, Matsuo and Kangawa8). However, there is good evidence that the ratio of the two forms remains constant throughout the day in rats(Reference Murakami, Hayashida, Kuroiwa, Nakahara, Ida, Mondal, Nakazato, Kojima and Kangawa41). Although human experimental work appears to support the rodent data, showing the acylated and desacylated balance is maintained in the postprandial period(Reference Hotta, Ohwada, Katakami, Shibasaki, Hizuka and Takano42), their dataset has fewer sampling points to make the comparison, so this is an area that warrants further investigation.
Similar to pre-prandial rises in ghrelin, the exact importance of the postprandial ghrelin decline is unknown, but again it may be involved in satiety regulation. Recent work implicating ghrelin with adipogenesis and metabolic flux(Reference Barazzoni, Bosutti and Stebel35, Reference Wortley, Anderson and Garcia36, Reference Thompson, Gill, Davies, Loveridge, Houston, Robinson and Wells43), suggests that this peptide, like insulin, may also be involved with postprandial nutrient storage and oxidation. Changes in typical ghrelin responses in the postprandial period may therefore disrupt such systems. Although the current study shows that total ghrelin responses (AUC) are not altered by feeding frequency, the pulse analysis (Fig. 3, flat-line, and Table 1) reveals clear differences in the ghrelin response pattern between trials. Thus, further research in this area is required to establish the importance of such changes in ghrelin secretion. A loss of insulin-regulated ghrelin fluctuations due to high-frequency feeding may affect ghrelin's control of satiety and metabolic flux, yet this is speculative and further work is required. Additionally, the data in Table 1 confirm previous findings that showed pulsatile ghrelin responses during a fasting period with similar peak characteristics to those found here(Reference Koutkia, Canavan, Breu, Johnson and Grinspoon44), yet pulsatility during feeding periods has not been reported in human subjects before and so the present data add new information to this limited evidence base.
Within each trial, meals were equi-energetic and total energy consumption between the meal trials was also equal, controlling total energy intake. In a free-living environment, data suggest that increased meal frequency, or snacking, is correlated to increased energy intake and that snacks are generally high-sugar or high-fat foods(Reference Paik and Yearick45–Reference Hampl, Heaton and Taylor47). Our meals derived 13 % total energy from free sugars and 23 % from fats, perhaps not representative of a true snack. However, the definition of ‘snack’ also causes problems for such investigations. Is a snack a smaller portion of a typical meal taken more frequently throughout the day or does a snack represent a high-sugar/high-fat food taken between meals in addition to typical meals(Reference Drummond, Crombie and Kirk48, Reference Gatenby49)? The two definitions could change both the research design and the subsequent results. Here, a snack was chosen to represent a smaller-sized portion of a meal that was eaten more frequently throughout the day. In this approach we were able to isolate the effect of feeding frequency from the combination of factors involved in a free-living situation, such as feeding frequency and high-energy density of the snacks consumed. If high-sugar or high-fat snacks were eaten in addition to usual meals, resulting in a hyper-energetic energy intake, it is probable that increased insulin and decreased ghrelin trends would be seen. This is speculative, however, and further work is needed to answer that question.
These data are recorded from lean healthy volunteers, so care must be taken in predicting the outcome in a patient group. The current literature is mixed with regard to the efficacy of increased feeding frequency (or snacking) regimens in causing or treating metabolic anomalies. A number of studies report a positive impact of increased meal frequency on factors such as lipaemia, thermogenesis and fasting glycaemia(Reference Bertelsen, Christiansen, Thomsen, Poulsen, Vestergaard, Steinov, Rasmussen, Rasmussen and Hermansen16, Reference Jenkins, Wolever and Vuksan22, Reference LeBlanc, Mercier and Nadeau50), whilst other studies show the opposite(Reference Farshchi, Taylor and Macdonald19, Reference de Bont, Romsos, Tsai, Waterman and Leveille51, Reference Molon-Noblot, Keenan, Coleman, Hoe and Laroque52) and further data show that no differences exist(Reference Garrow, Durrant, Blaza, Wilkins, Royston and Sunkin53, Reference Verboeket-van de Venne and Westerterp54). The observation in the present study that increased feeding frequency may disrupt the insulin–ghrelin relationship may be relevant to diminished regulation of ghrelin seen in insulin resistance. This is relevant to the increased snacking habits seen in our society(Reference Samuelson3, Reference Berteus-Forslund, Torgerson, Sjostrom and Lindroos4); however, these suggestions require further investigation. The current study provides the only such data in human subjects and therefore further work is prudent, particularly regarding the long-term effect of meal frequency. Also, given the inconclusive evidence in the literature regarding feeding frequency and its metabolic implications, large randomized, controlled trials are required to resolve speculation that the current increases in snacking habits contribute to the escalating obesity and T2DM epidemic.
Acknowledgements
The authors wish to thank Professor Doug Carroll for his help with statistical analyses. The authors have no conflicts of interest to declare. The study was carried out with support from the University-derived research budgets of A. K. B., A. E. J. and A. A. T.


