


1. Introduction
Engine components are usually exposed to cyclic loadings at elevated temperatures, such as pistons and cylinder heads. In these parts, aluminum-silicon alloys have been widely used, due to their proper mechanical and fatigue properties, as advantages of the material. Therefore, to design such engine components, knowing the cyclic behaviors of such materials is essential for engineers. However, aluminum alloys have low strength at high temperatures as a disadvantage that should be improved. There are various approaches for such an objective and one of the reinforcing methods is the addition of nano-particles.
Research studies on cyclic behaviors of aluminum alloys have been widely published since 2010. As an example, Song et al. (Reference Song, Kong, Ran and She2011) investigated the cyclic stress–strain behavior and the low-cycle fatigue (LCF) lifetime of the cast A356 aluminum alloy. They reported the cyclic hardening behavior for the material. Similar to this work, presenting the cyclic behavior of aluminum alloys could be found in the literature by Azadi (Reference Azadi2013), Azadi and Shirazabad (Reference Azadi, Bahmanabadi, Gruen and Winter2013), Do Lee and Yoo (Reference Do Lee and Yoo2014), Kim et al. (Reference Kim, Sung, Han, Park and Lee2015), Azadi (Reference Azadi2017), and Azadi et al. (Reference Azadi and Shirazabad2020). Branco et al. (Reference Branco, Costa, Borrego, Wu, Long and Zhang2019) studied the strain ratio influence on the cyclic deformation behavior of the 7050-T6 aluminum alloy. Their results illustrated that the material depicted cyclic strain-softening, which increased when the strain ratio increased and the strain amplitude decreased. Cai et al. (Reference Cai, Geng and Zhang2018) presented the temperature-dependent cyclic behaviors and the material microstructure of the AlSi10Mg(Cu) aluminum alloy. They claimed that Mg-Si precipitates were the reason for cyclic hardening in the as-received alloy, due to the pinning effect. Li et al. (Reference Li, Li, Liang, Che, Zhan and Huang2018) investigated the influence of isothermal and non-isothermal aging on the LCF behavior of the forged Al-Cu-Mg-Si aluminum alloy. They demonstrated that the material exhibited cyclic stability, compared to cyclic hardening of the heat-treated samples.
2. Objective
As a conclusion on the literature review, the effect of different parameters such as the strain amplitude and the strain rate were studied on cyclic hardening/softening of aluminum alloys. In this research, the temperature effect was also added as a novelty. Besides, a heat-treated nano-composite, as a newly developed material, was suggested for engine pistons. Then, its cyclic hardening/softening was measured during strain-controlled fatigue testing, compared to that of the aluminum alloy. Such a casted aluminum alloy has been widely used in engine pistons.
3. Methods
The chemical composition of the piston aluminum-silicon alloy, which is used in this research, was included 13% wt. Si, 1% wt. Cu, and 1% wt. Mg. Aluminum bars were melted at 700°C and then, the nano-composite was fabricated by adding 1% wt. of pre-heated (at 400°C) nano-clay-particles (montmorillonite K 10) into the aluminum matrix. This job was done 2 g by 2 g (to avoid the gas accumulation in the melt), with the stir-casting process. All casted cylinders were left in the free air at 23°C, to be quenched.
The LCF standard specimens were machined and then, a T6 heat treatment, including solutioning at 500°C for 1 hour, water quenching, and aging at 300°C for 2 hours, was done on the material. More details of the sample production process could be found in Azadi et al. (Reference Azadi and Shirazabad2020).
LCF testing was done under strain-controlled loading conditions, with the 10 kN servo-hydraulic Instron device. The mechanical strain amplitude was 0.20%, 0.25%, 0.30%, 0.35%, 0.40%, and 0.45%. The temperature was 25°C, 200°C, 250°C, and 300°C. It should be noted that the strain amplitude and temperature were constant during the tests. The strain rate was 1%/s and the strain ratio was −1, based on the E606 ASTM standard. The specimens were heated up using a 10-kW medium frequency generator for high temperature During LCF testing, the temperature was measured using 3 K type thermocouples. The strain was also measured by Instron room-temperature and MTS high-temperature extensometers for LCF tests at room and elevated temperatures, respectively. In addition to the fatigue test, the uniaxial tensile tests were performed to investigate the material properties of the samples at different temperatures using the 100 kN servo-hydraulic Instron device, based on the E8M ASTM standard. More details of testing could be found in Azadi et al. (Reference Azadi and Shirazabad2020).
4. Results and discussion
To investigate the amount ( $ {A}_{\mathrm{H}/\mathrm{S}} $
) and the rete (
$ {A}_{\mathrm{H}/\mathrm{S}} $
) and the rete ( $ {R}_{\mathrm{H}/\mathrm{S}} $
) of cyclic hardening/softening of the material under LCF tests, Equations (1) and (2) were used, respectively,
$ {R}_{\mathrm{H}/\mathrm{S}} $
) of cyclic hardening/softening of the material under LCF tests, Equations (1) and (2) were used, respectively,
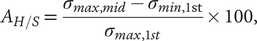 $$ {A}_{H/ S}=\frac{\sigma_{max, mid}-{\sigma}_{min,1\mathrm{st}}}{\sigma_{max,1 st}}\times 100, $$
 $$ {R}_{H/ S}=\frac{A_{H/ S}}{N_{f, mid}}, $$
where $ {\sigma}_{max} $
is the maximum stress and
$ {\sigma}_{max} $
is the maximum stress and $ {N}_{\mathrm{f}, mid} $
is the mid-life cycle of the specimen.
$ {N}_{\mathrm{f}, mid} $
is the mid-life cycle of the specimen.
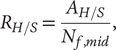
The Ramberg–Osgood relation was used as follows:
 $$ \varepsilon =\frac{\sigma }{E(T)}+{\left(\frac{\sigma }{k\prime (T)}\right)}^{\frac{1}{n\prime (T)}} $$
where $ \varepsilon $
and
$ \varepsilon $
and $ \sigma $
are the total strain amplitude and the stress amplitude at mid-life cycle,
$ \sigma $
are the total strain amplitude and the stress amplitude at mid-life cycle, $ k^{\prime }(T) $
and
$ k^{\prime }(T) $
and $ n^{\prime }(T) $
are temperature-dependent material properties or constants.
$ n^{\prime }(T) $
are temperature-dependent material properties or constants.
It should be noted that in this article, the word “AlSi” indicated the unreinforced specimen, and the word “AlSi_N_HT6” indicated the reinforced specimen.
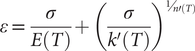
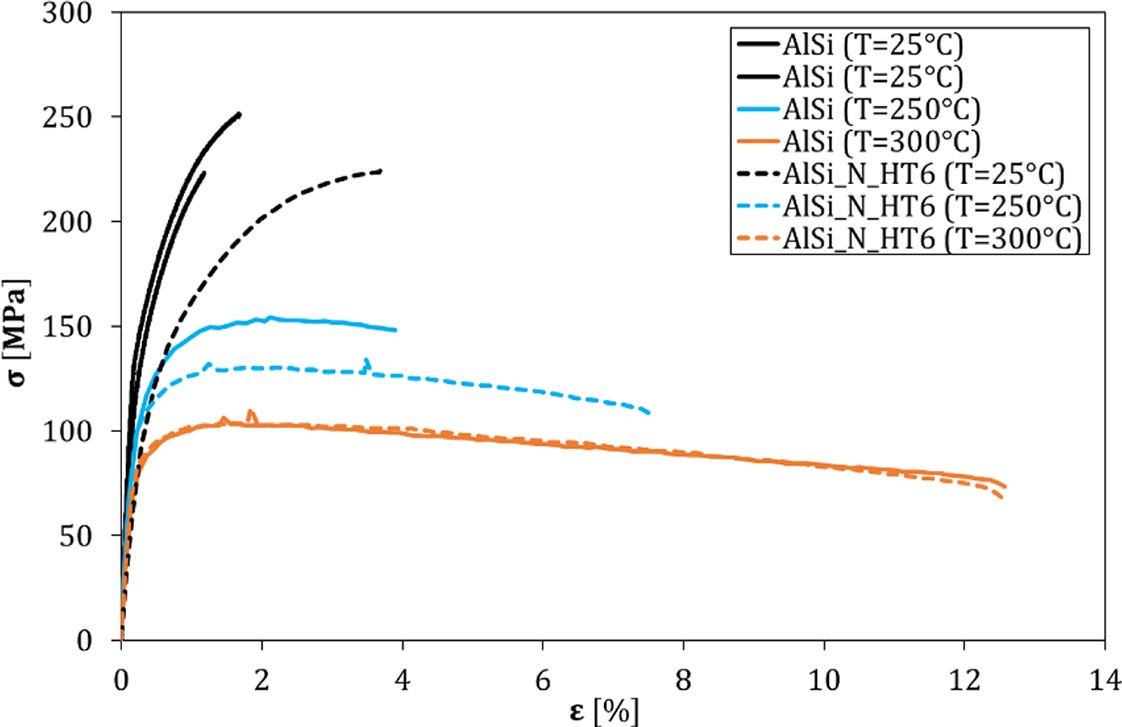
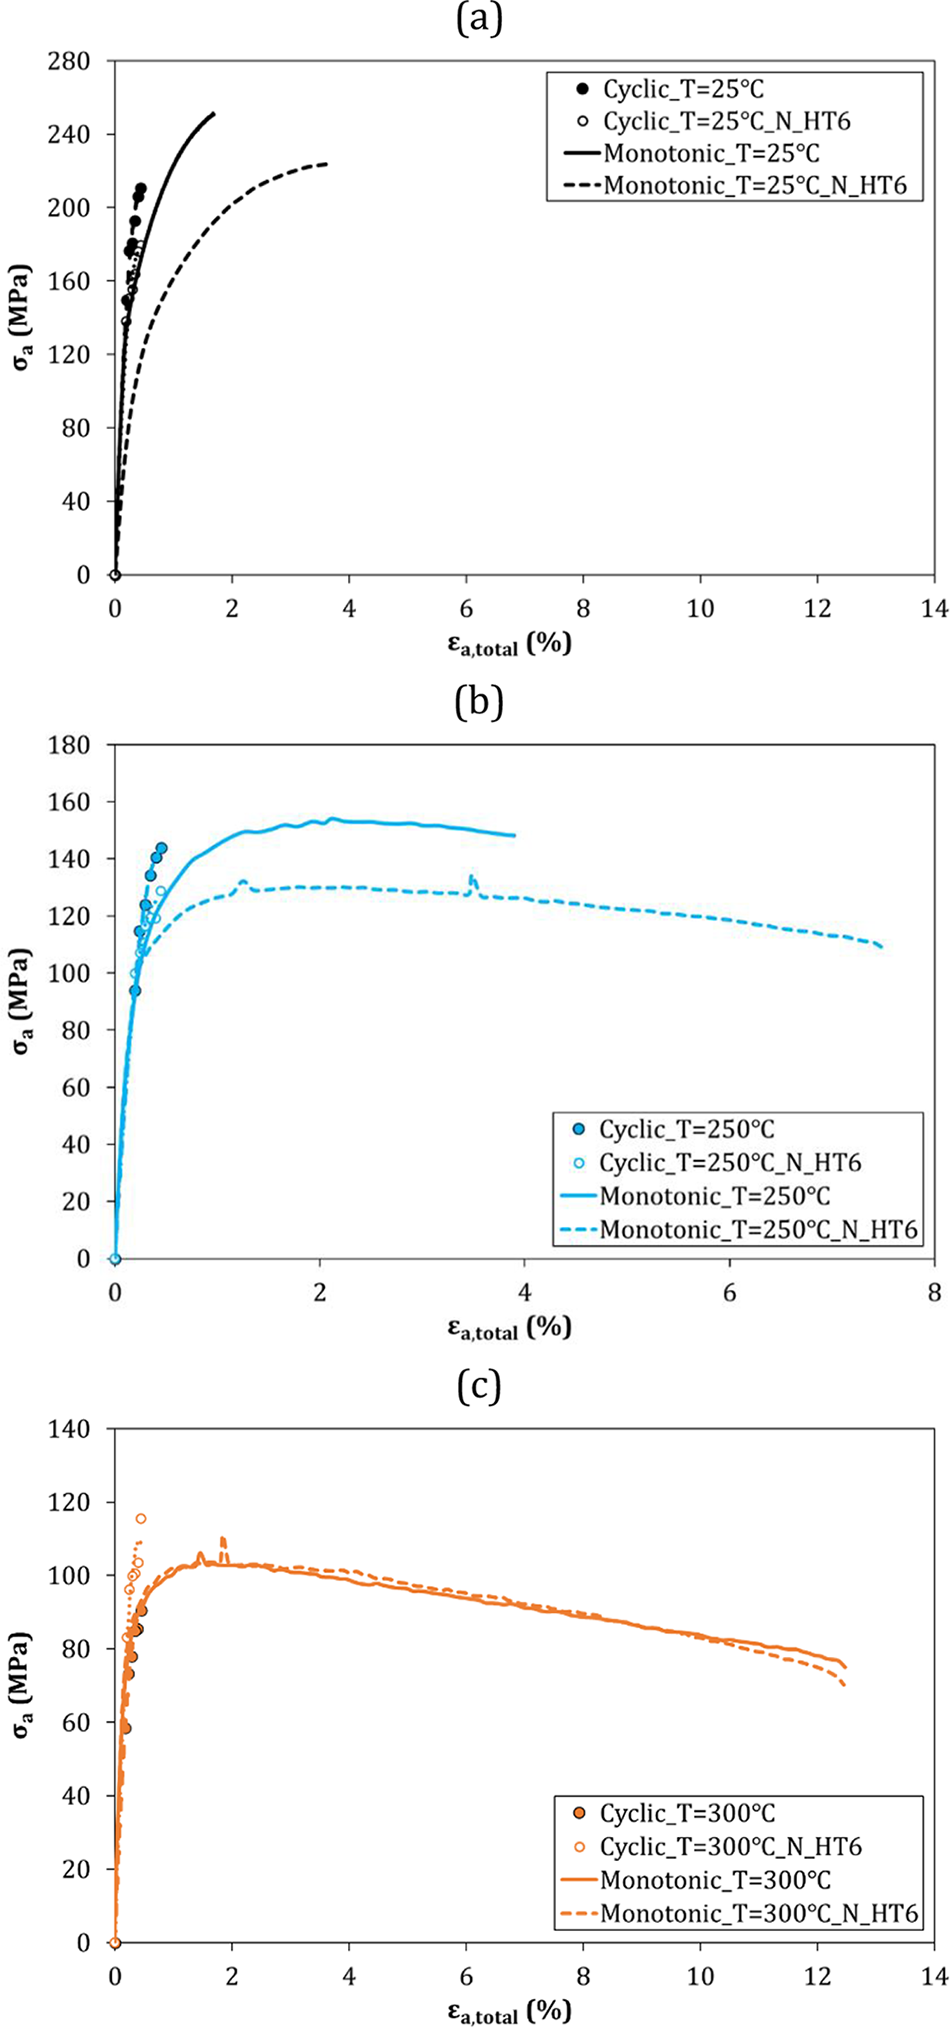
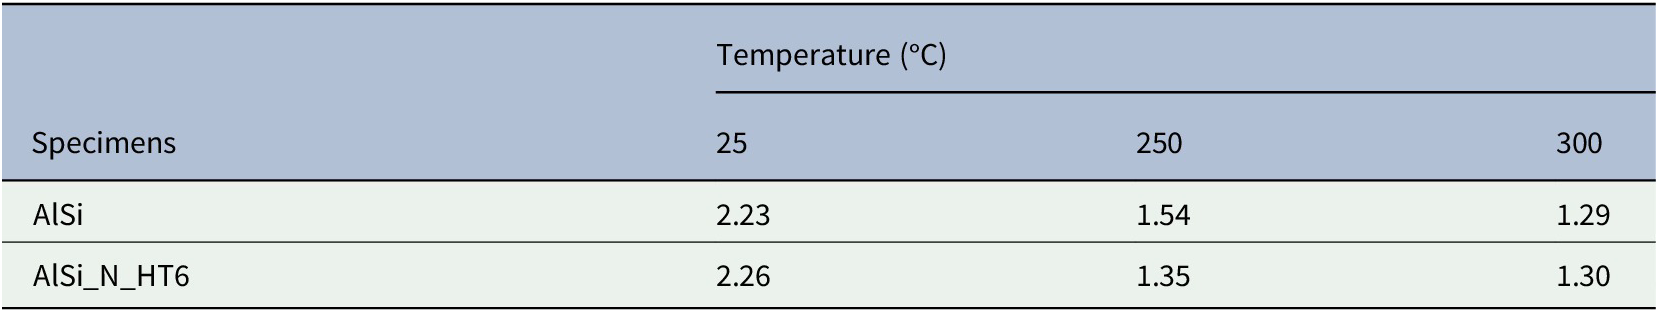
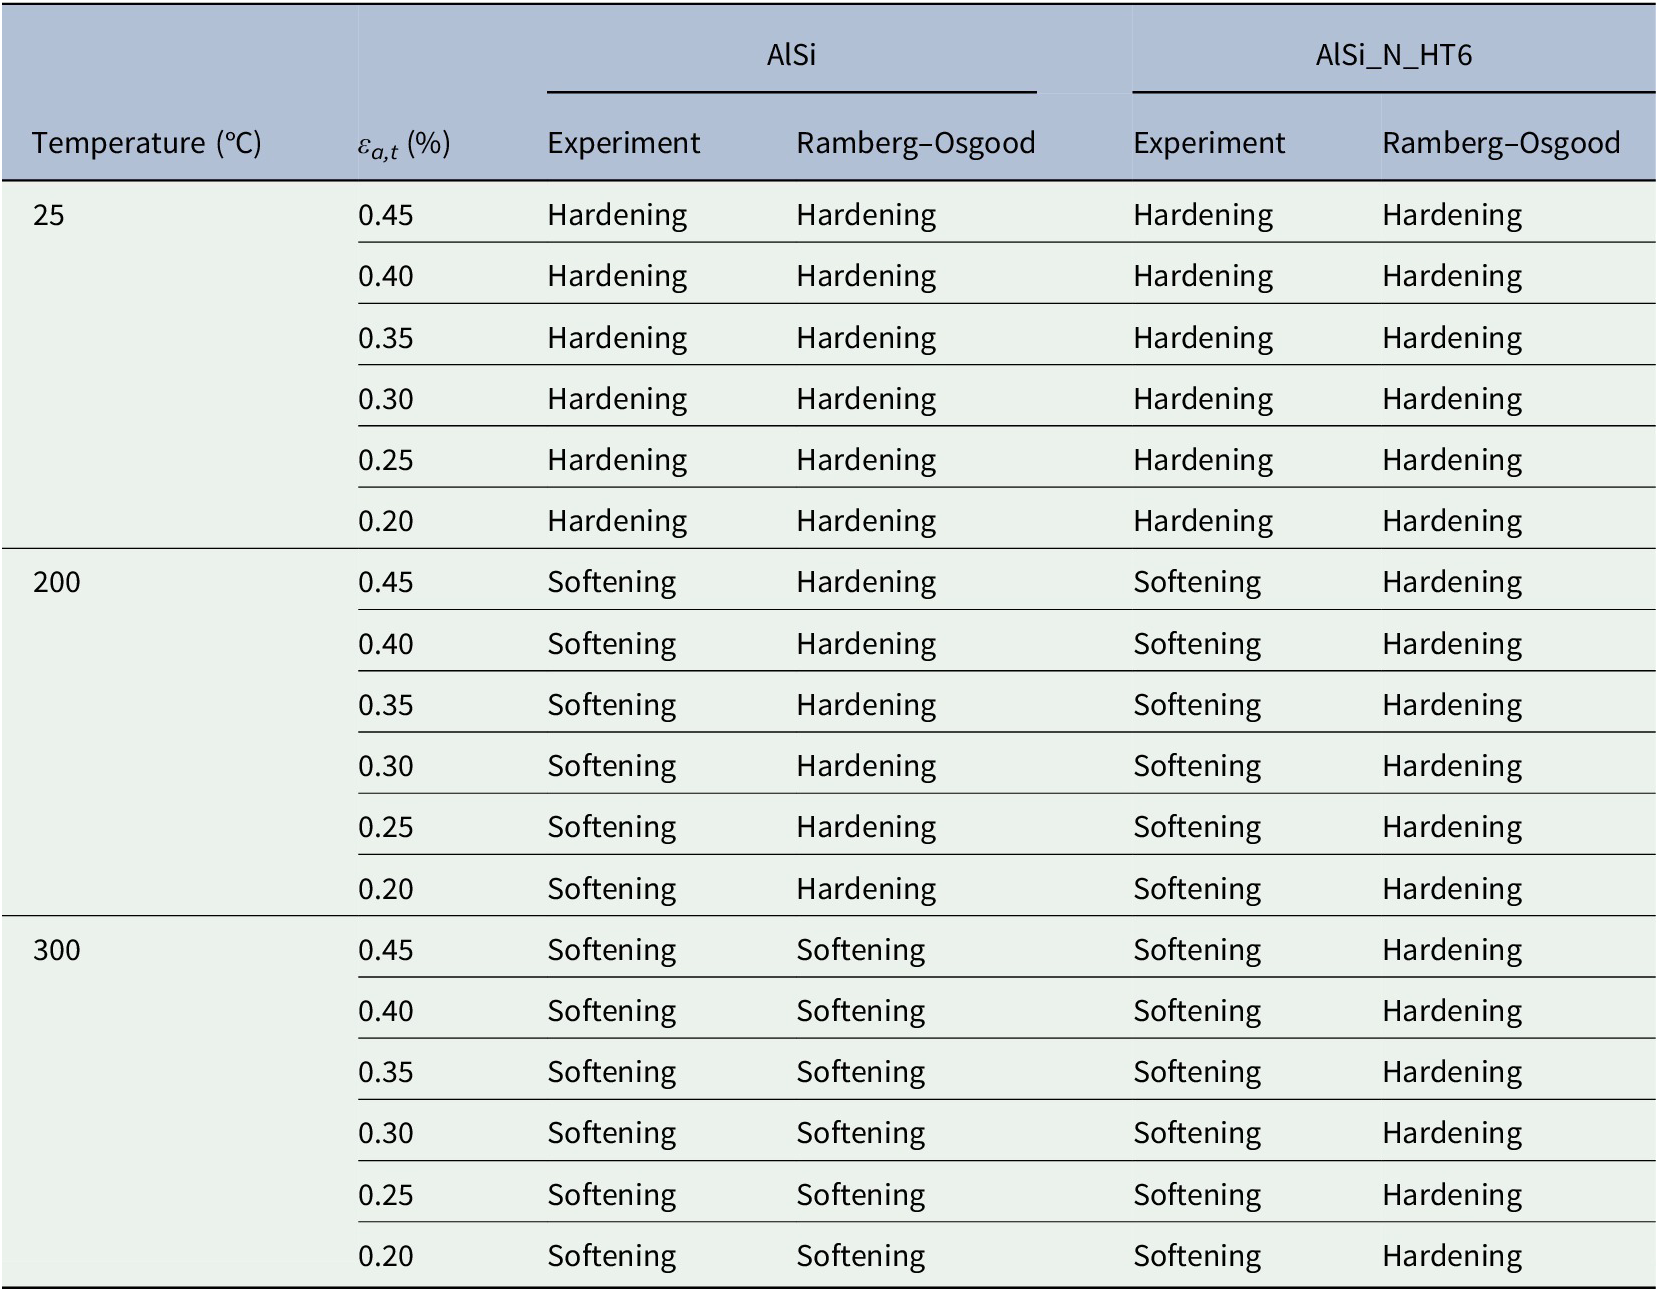
Figures 1 and 2 depict material properties for AlSi_N_HT6 and AlSi samples under tensile loadings. If the Ultimate tensile strength (UTS) over the Yield strength (YS) is greater than 1.4, the cyclic hardening trend will occur and then, if such a ratio is less than 1.2, the cyclic softening behavior will occur. The ratio of the UTS to the YS for strengthened and un-strengthened samples at various temperatures is represented in Table 1.
The uniaxial tensile test results for the AlSi_N_HT6 and AlSi specimens at various temperatures.
The Ramberg–Osgood relation for AlSi_N_HT6 and AlSi at the temperature of (a) 25°C, (b) 250°C, and (c) 300°C.
The ratio of the UTS to YS for both samples at various temperatures
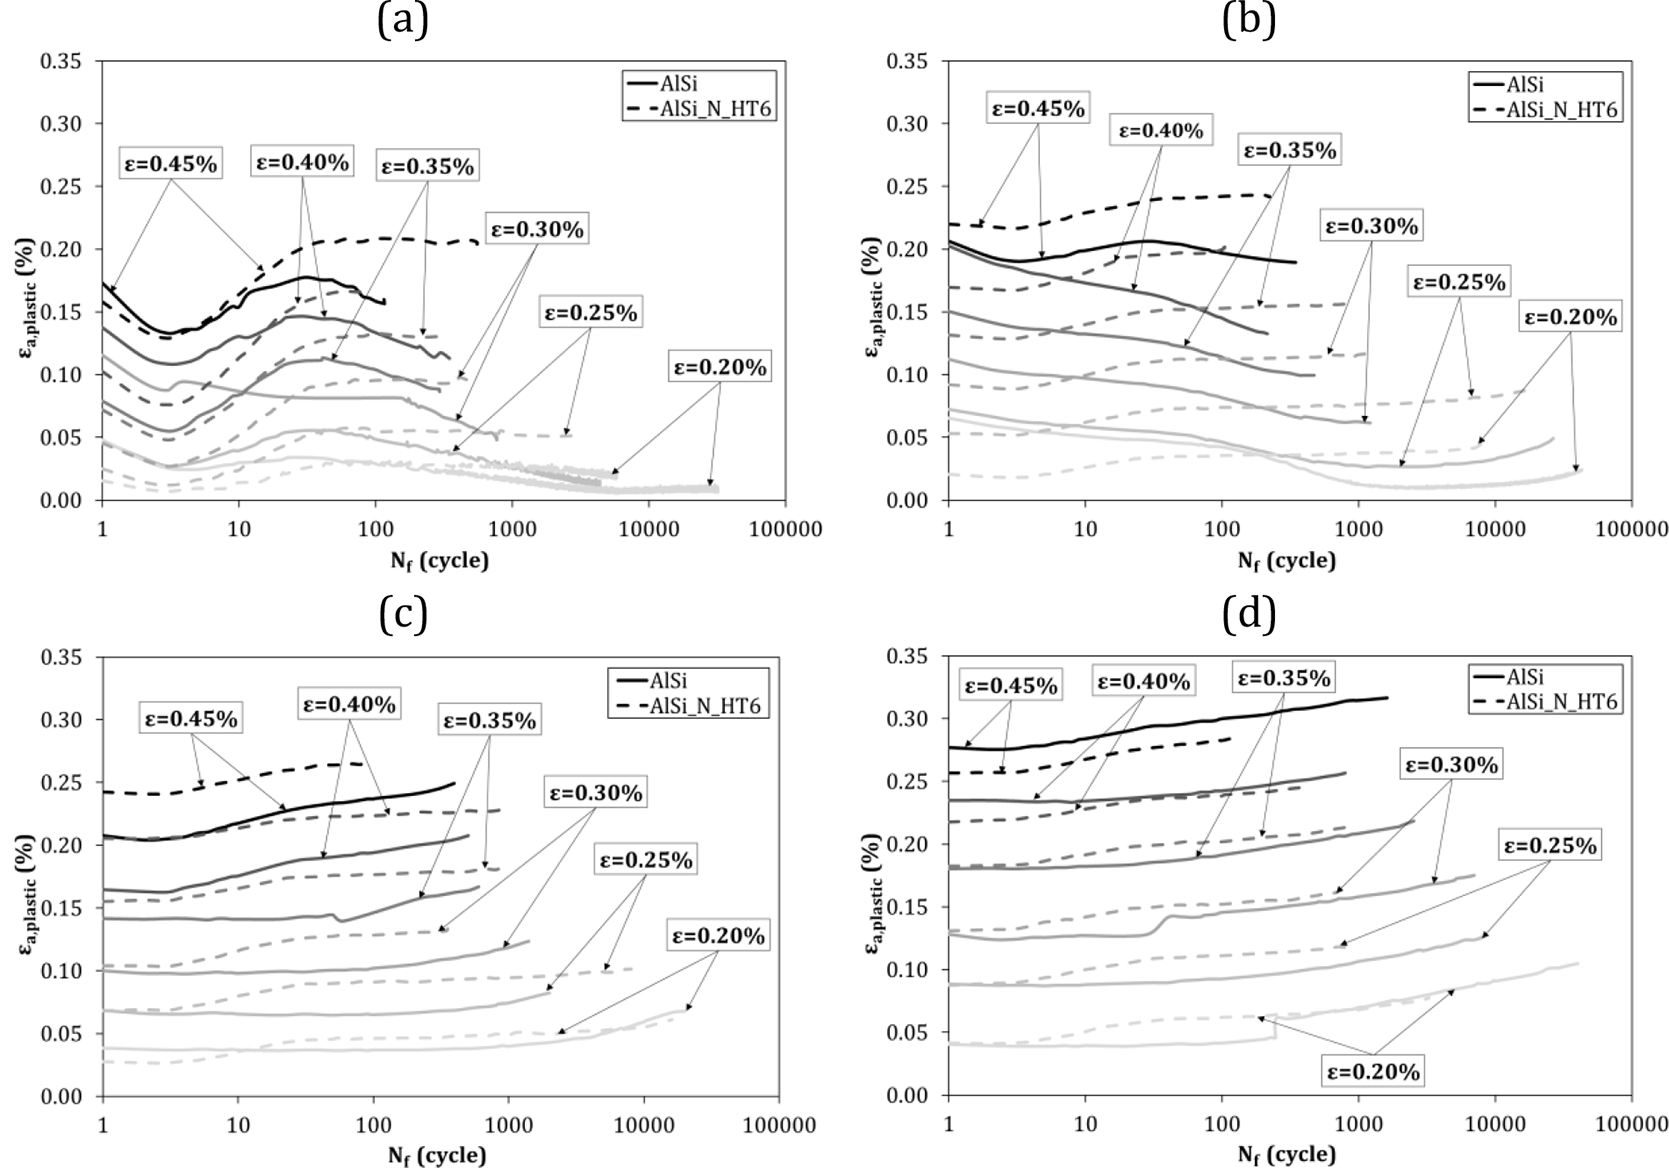
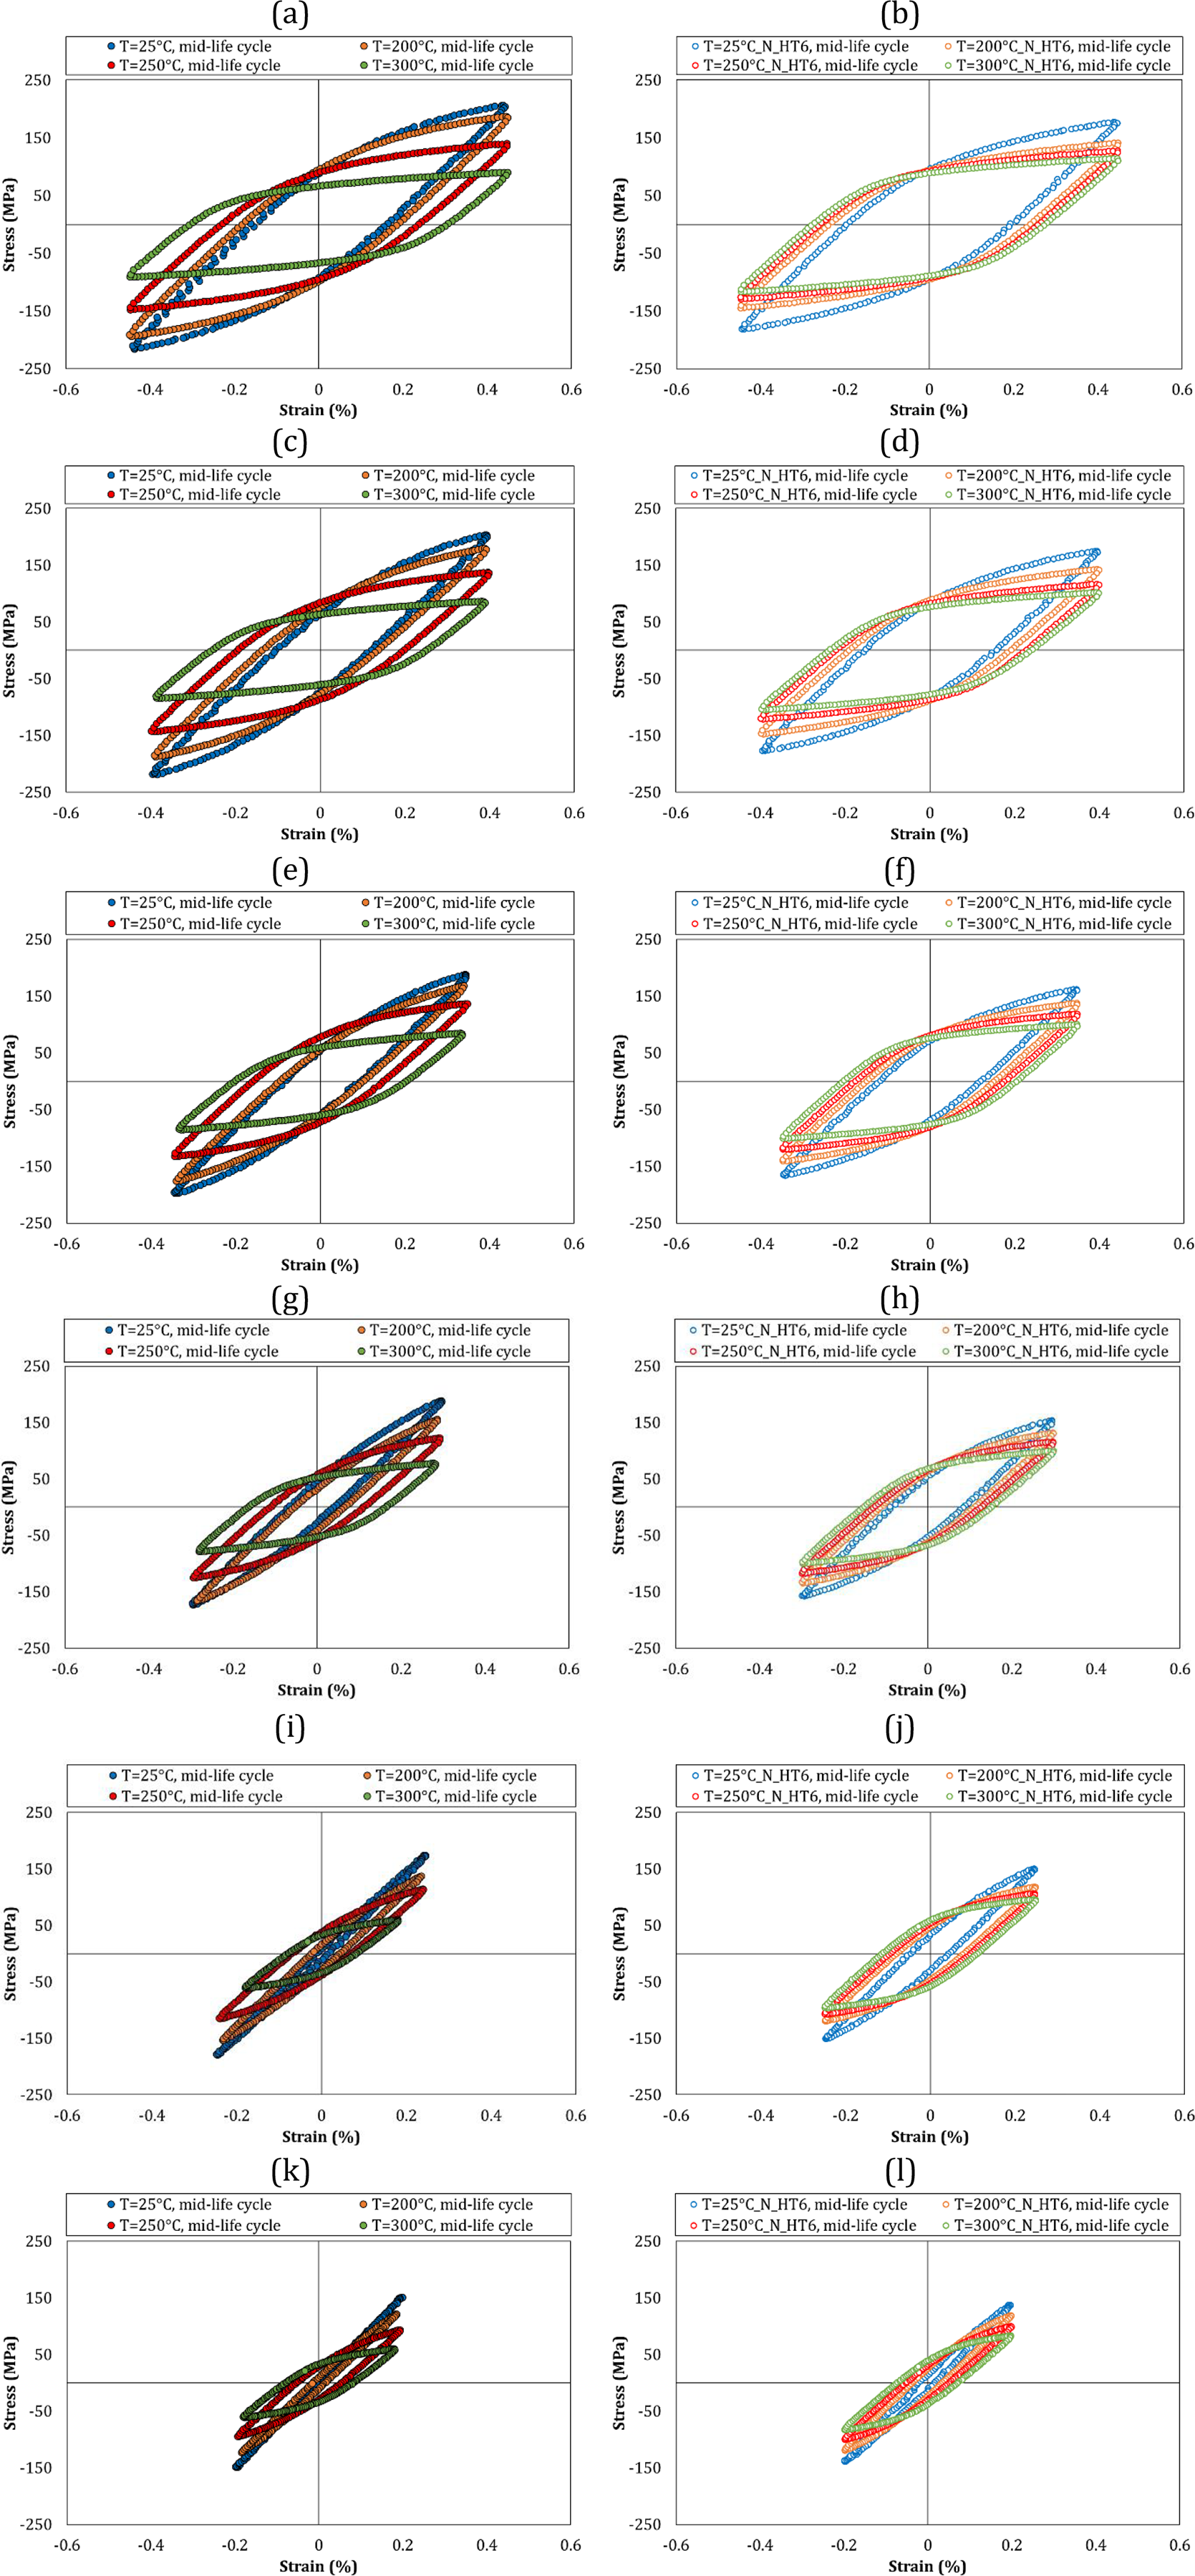
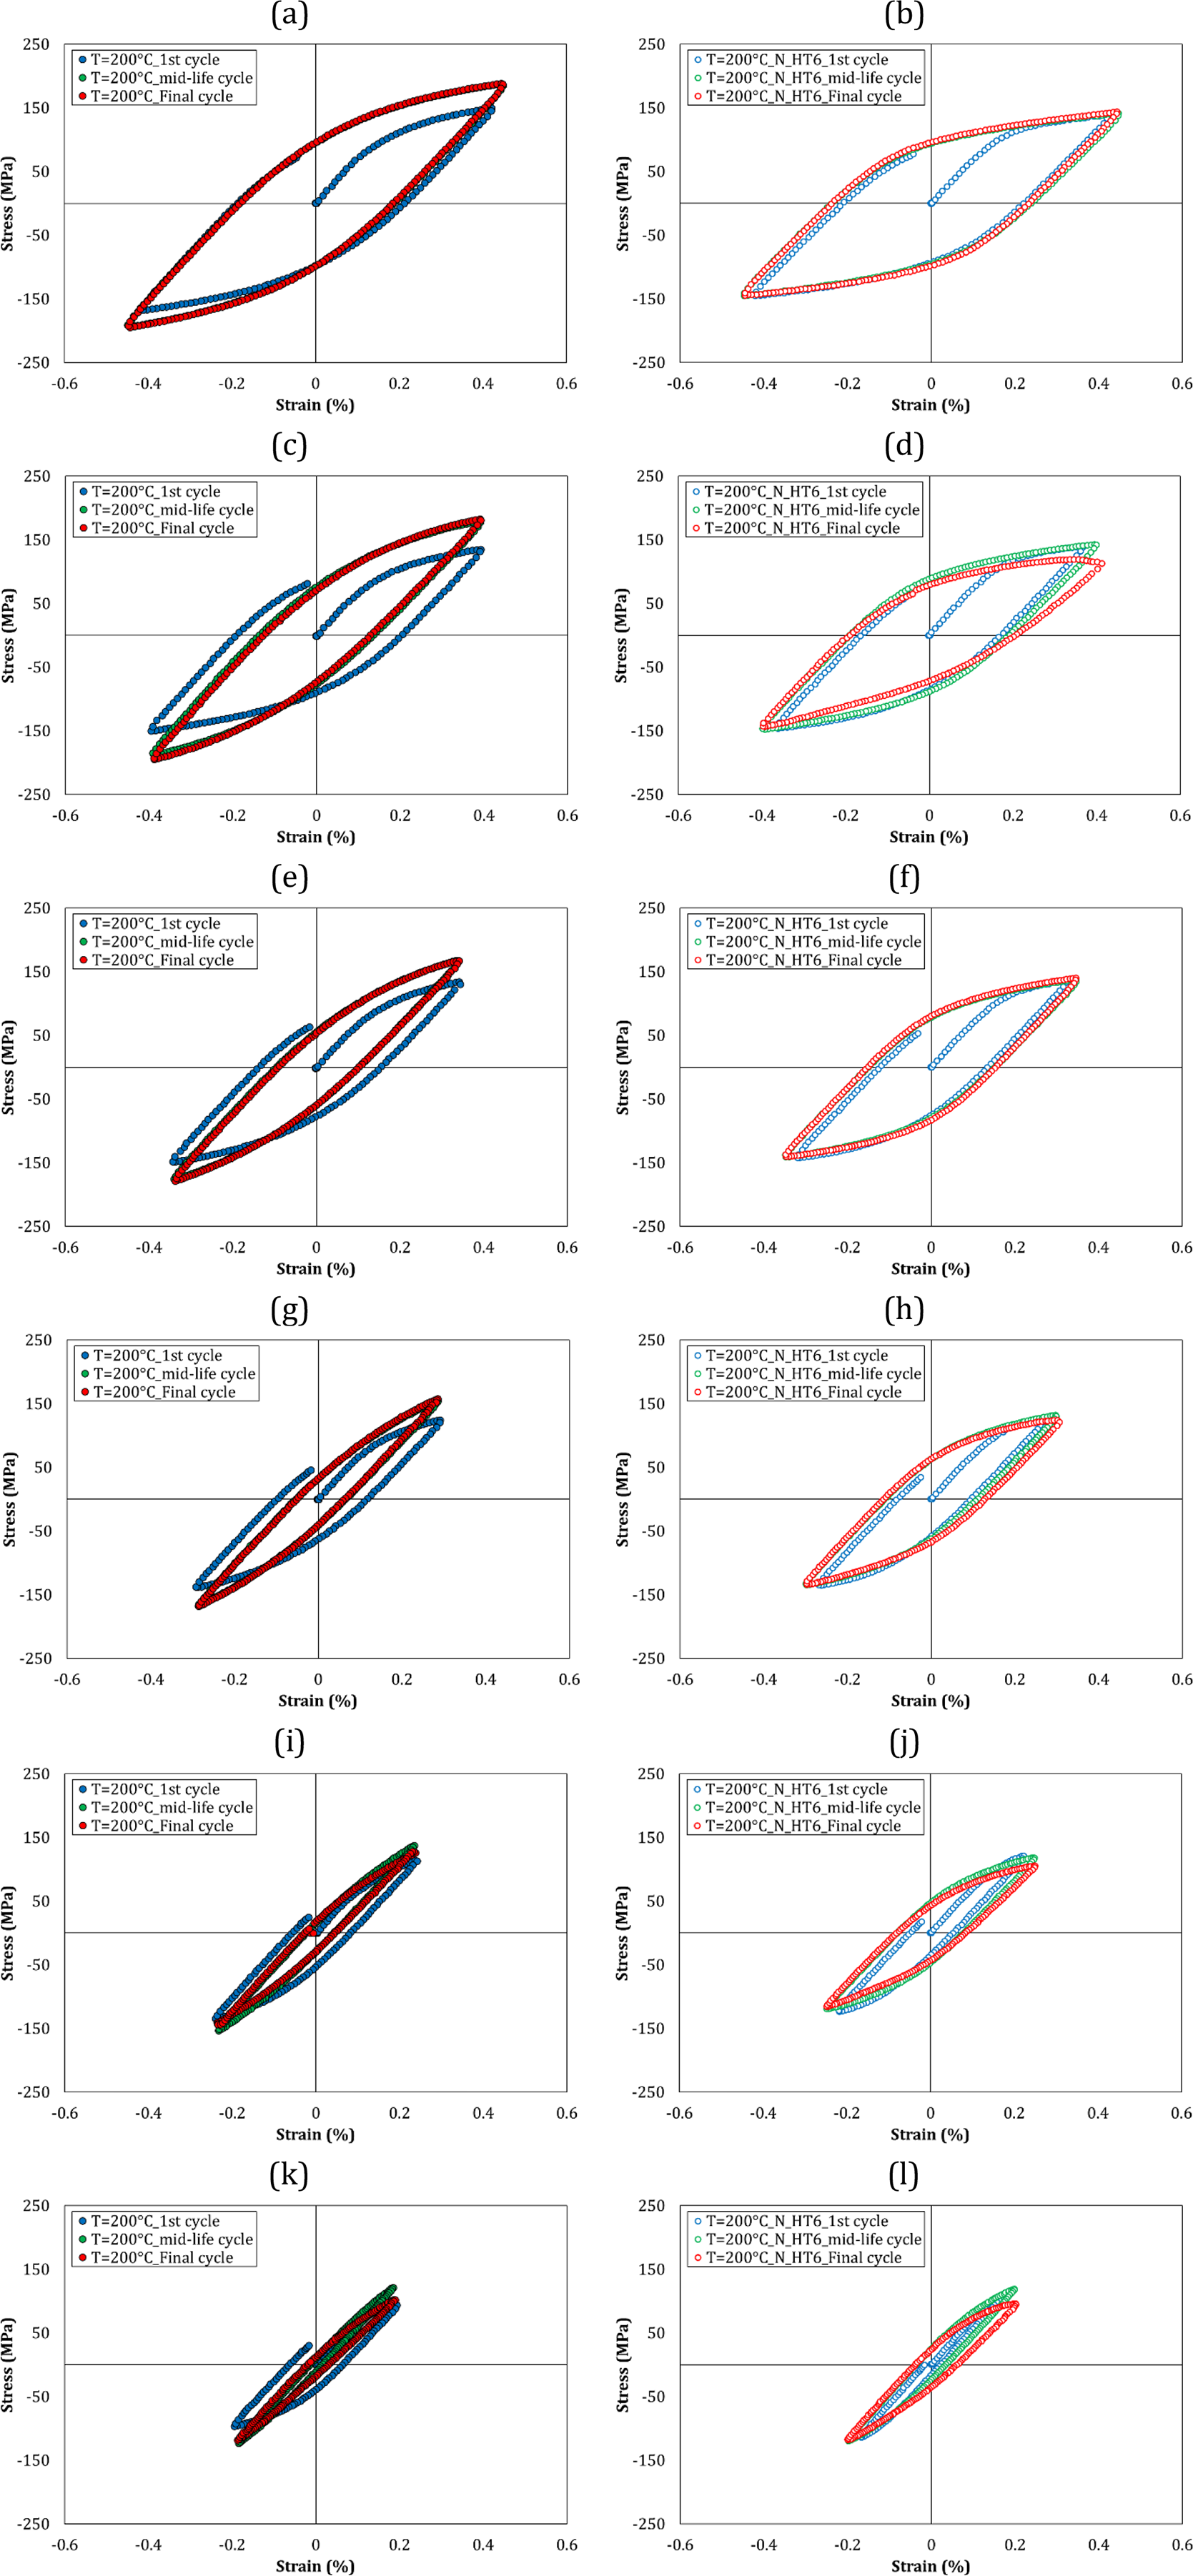
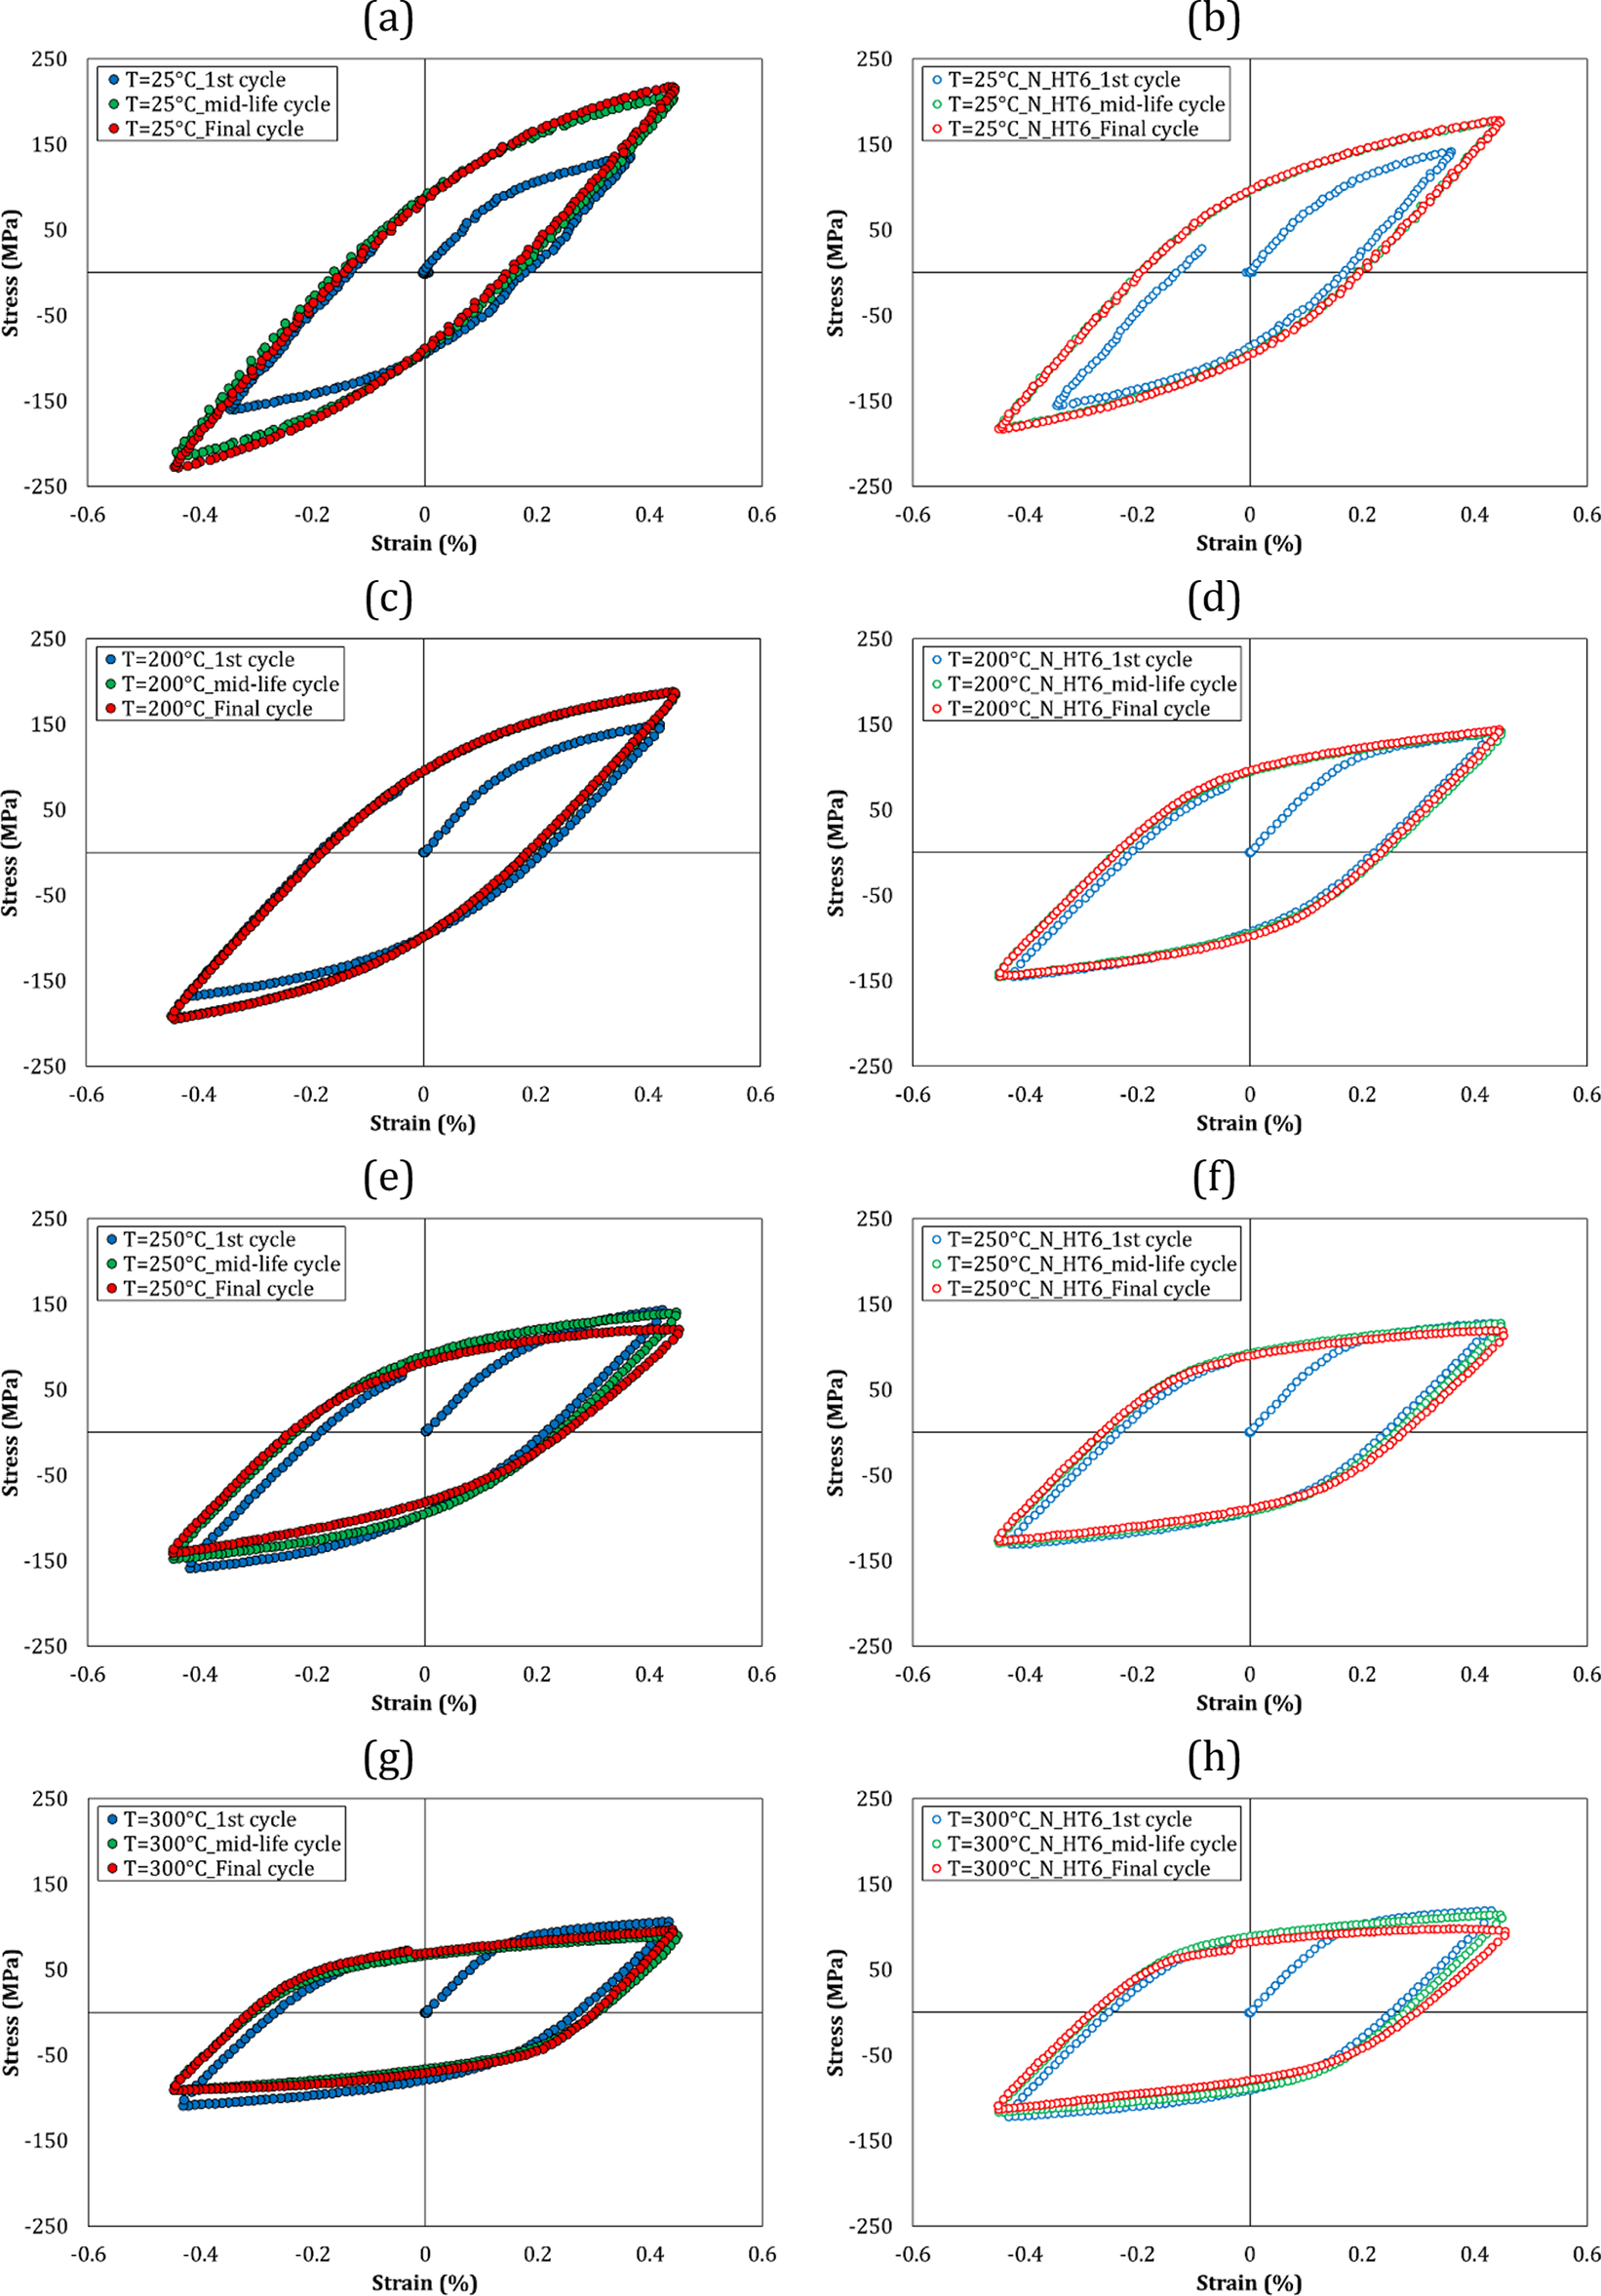
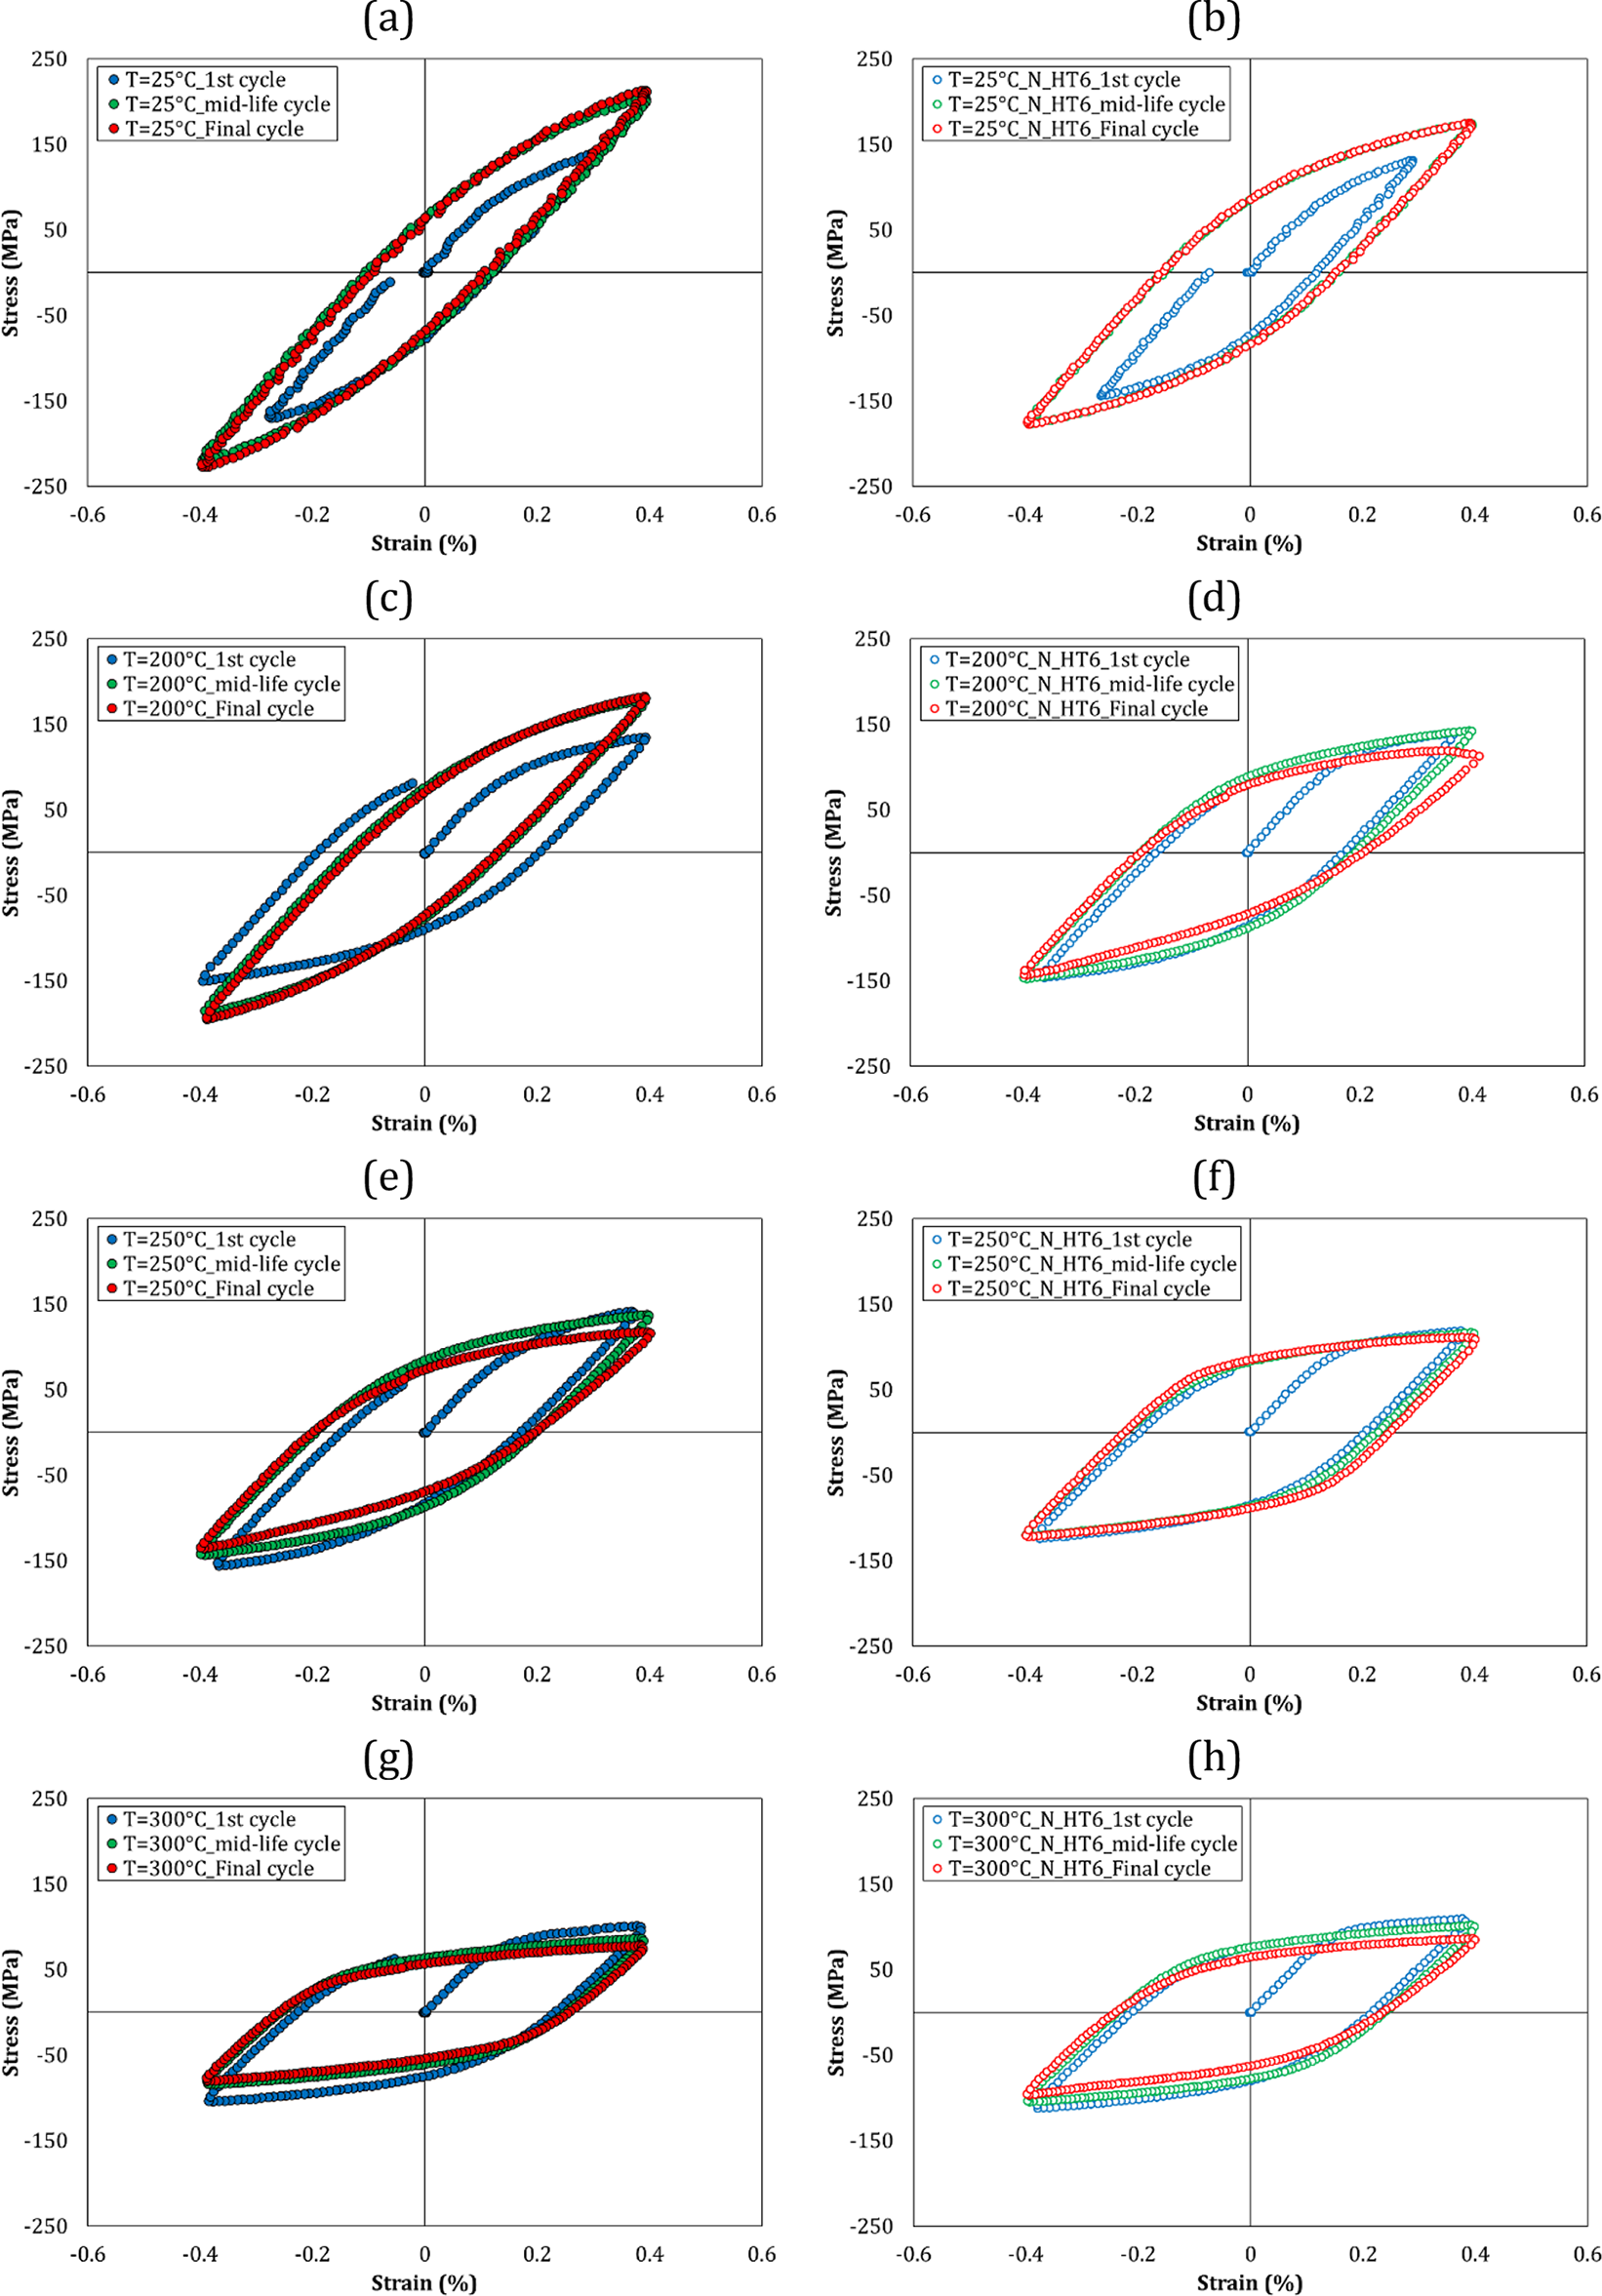
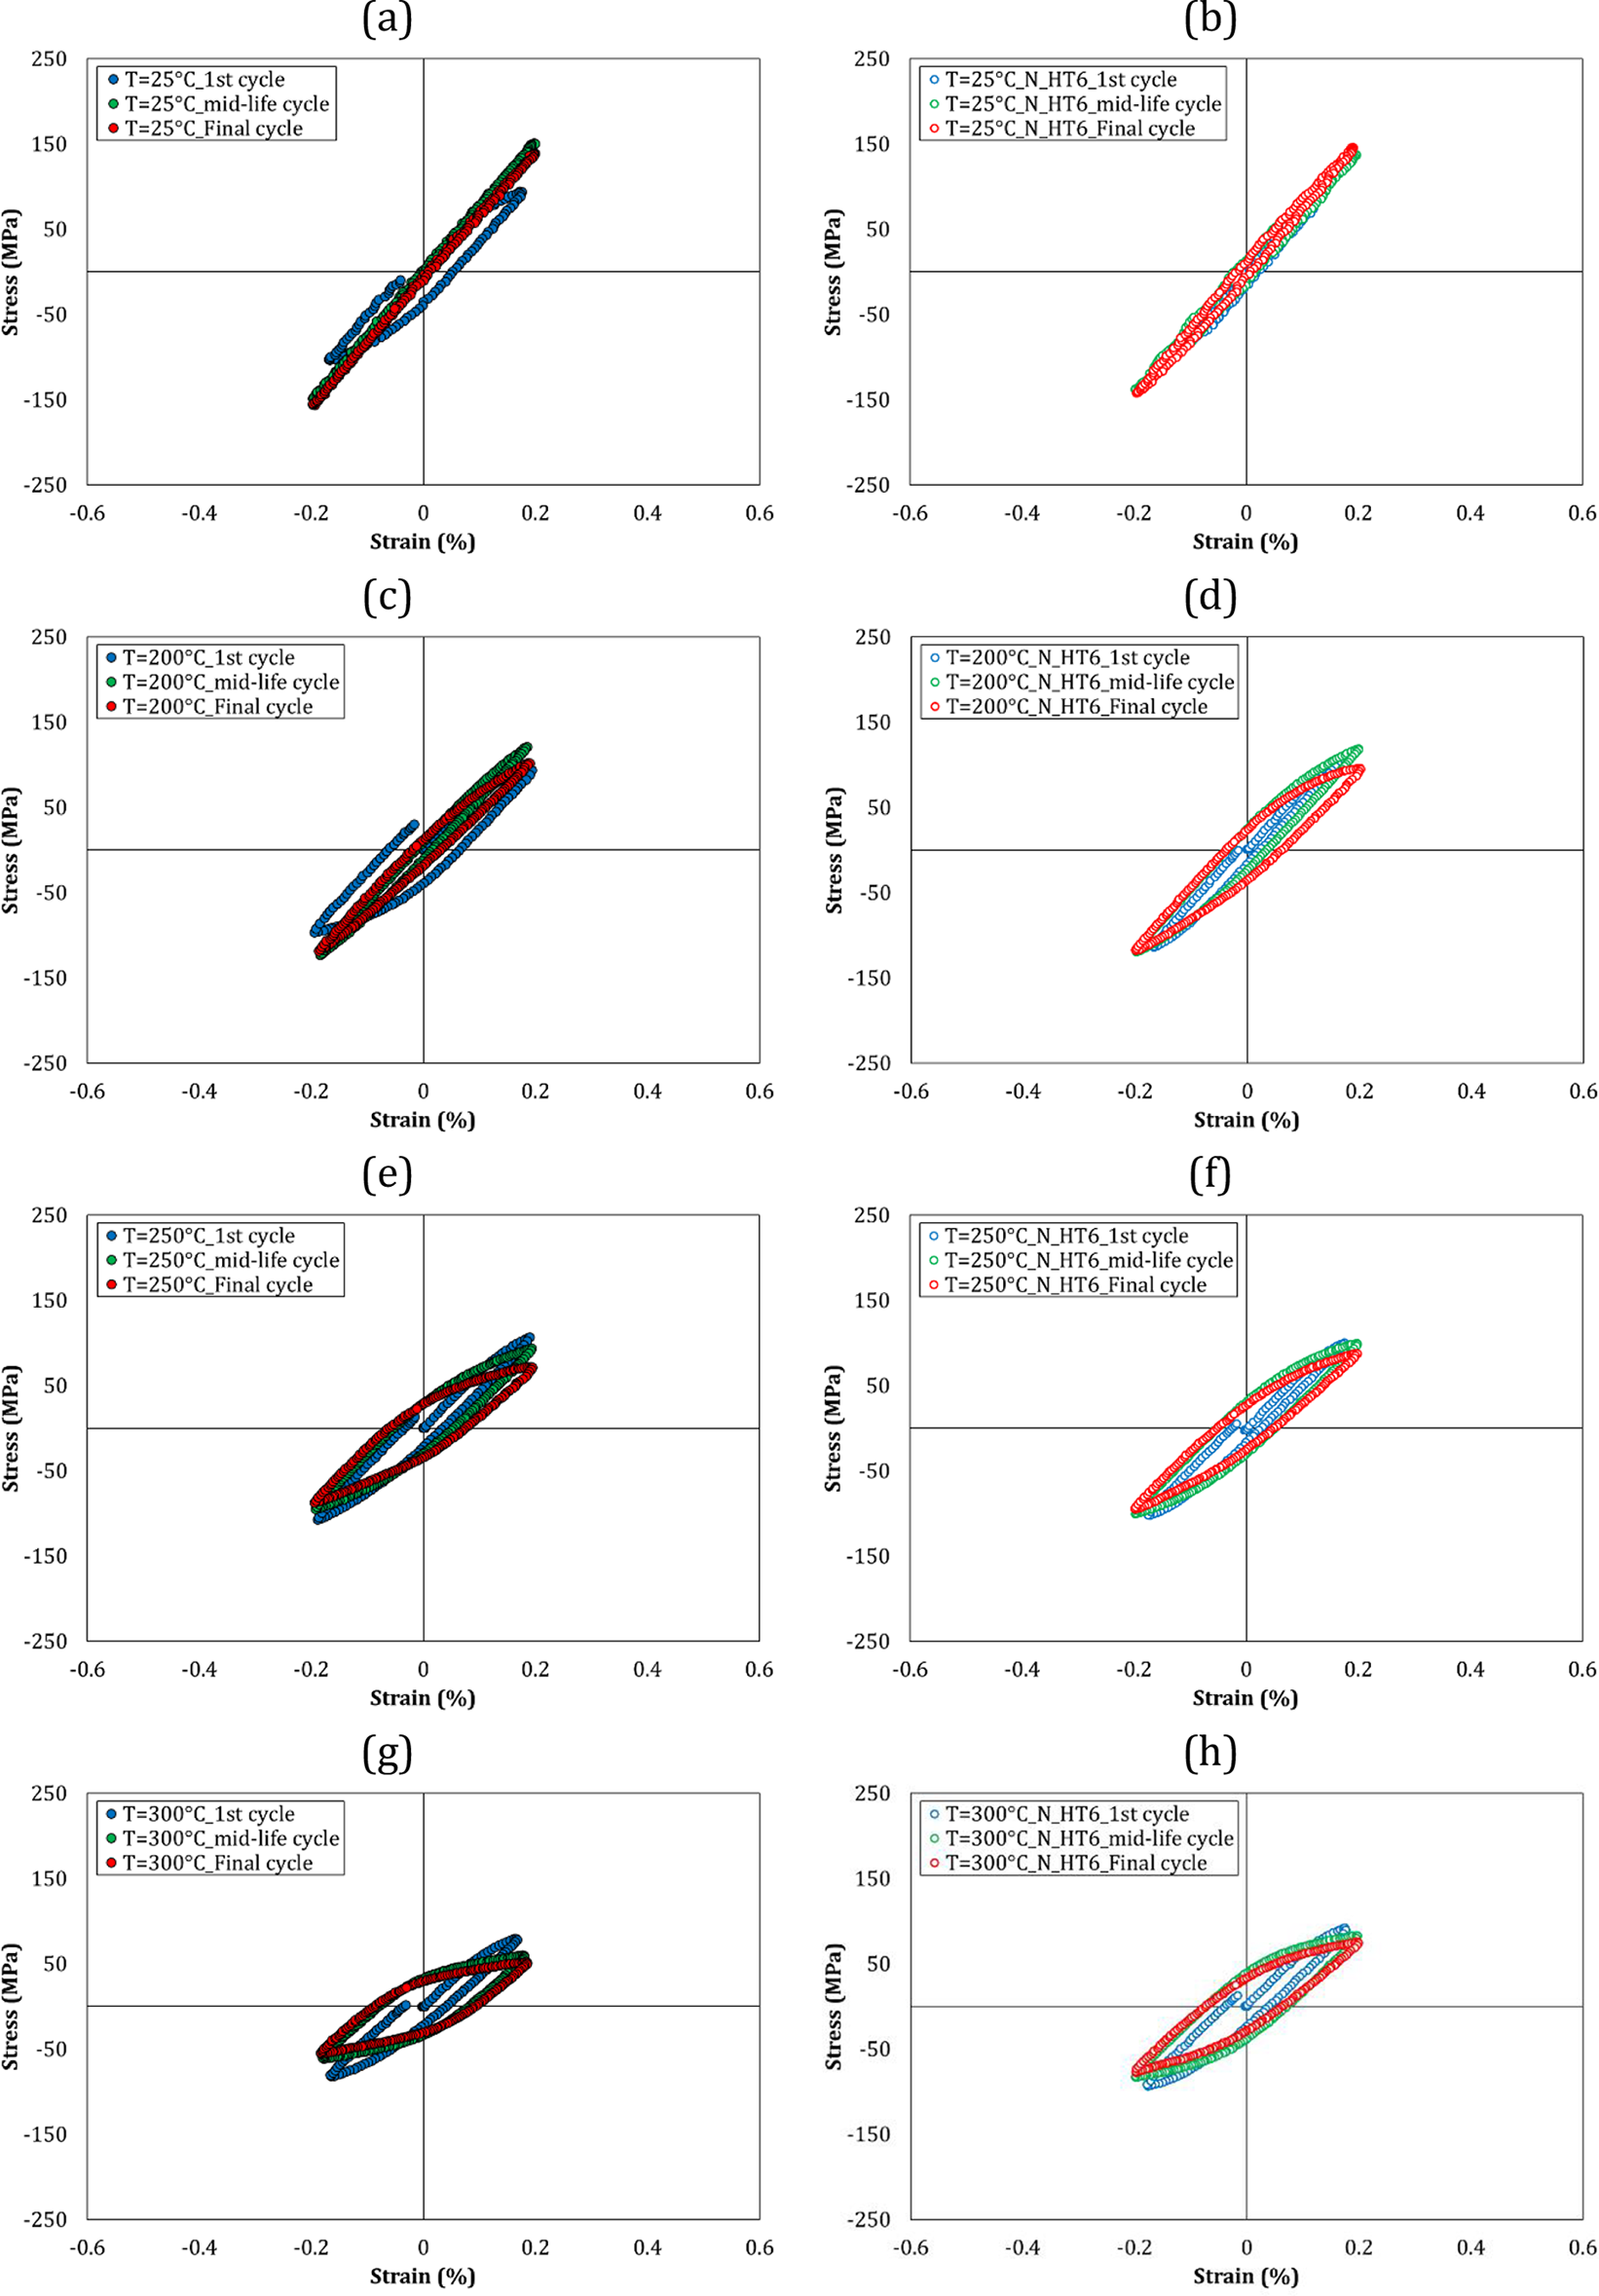
In the second section, cyclic behaviors of materials are represented in Figures 3–17. Stress enhancing during cycles at room temperature was observed, which demonstrated the cyclic hardening behavior for both AlSi_N_HT6 and AlSi. Moreover, the AlSi sample exhibited the cyclic hardening trend at 200°C. However, at this temperature, cyclic softening was seen in AlSi_N_HT6. The cyclic hardening amount was lower at lower values of the strain amplitudes. It seems that the temperature influence was more effective than the total strain amplitude influence to change from the cyclic hardening behavior to the cyclic softening trend. It should be noted that the cyclic trend had no change by strain amplitude enhancing. Besides, the strain changes the cyclic hardening/softening amount. Increasing the temperature caused an increase in the plastic strain amplitude of the specimen. According to Azadi and Shirazabad (Reference Azadi, Bahmanabadi, Gruen and Winter2013), the temperature increase led to having the over-aging phenomenon in the material, which enhanced the plastic strain and decreased the strength.
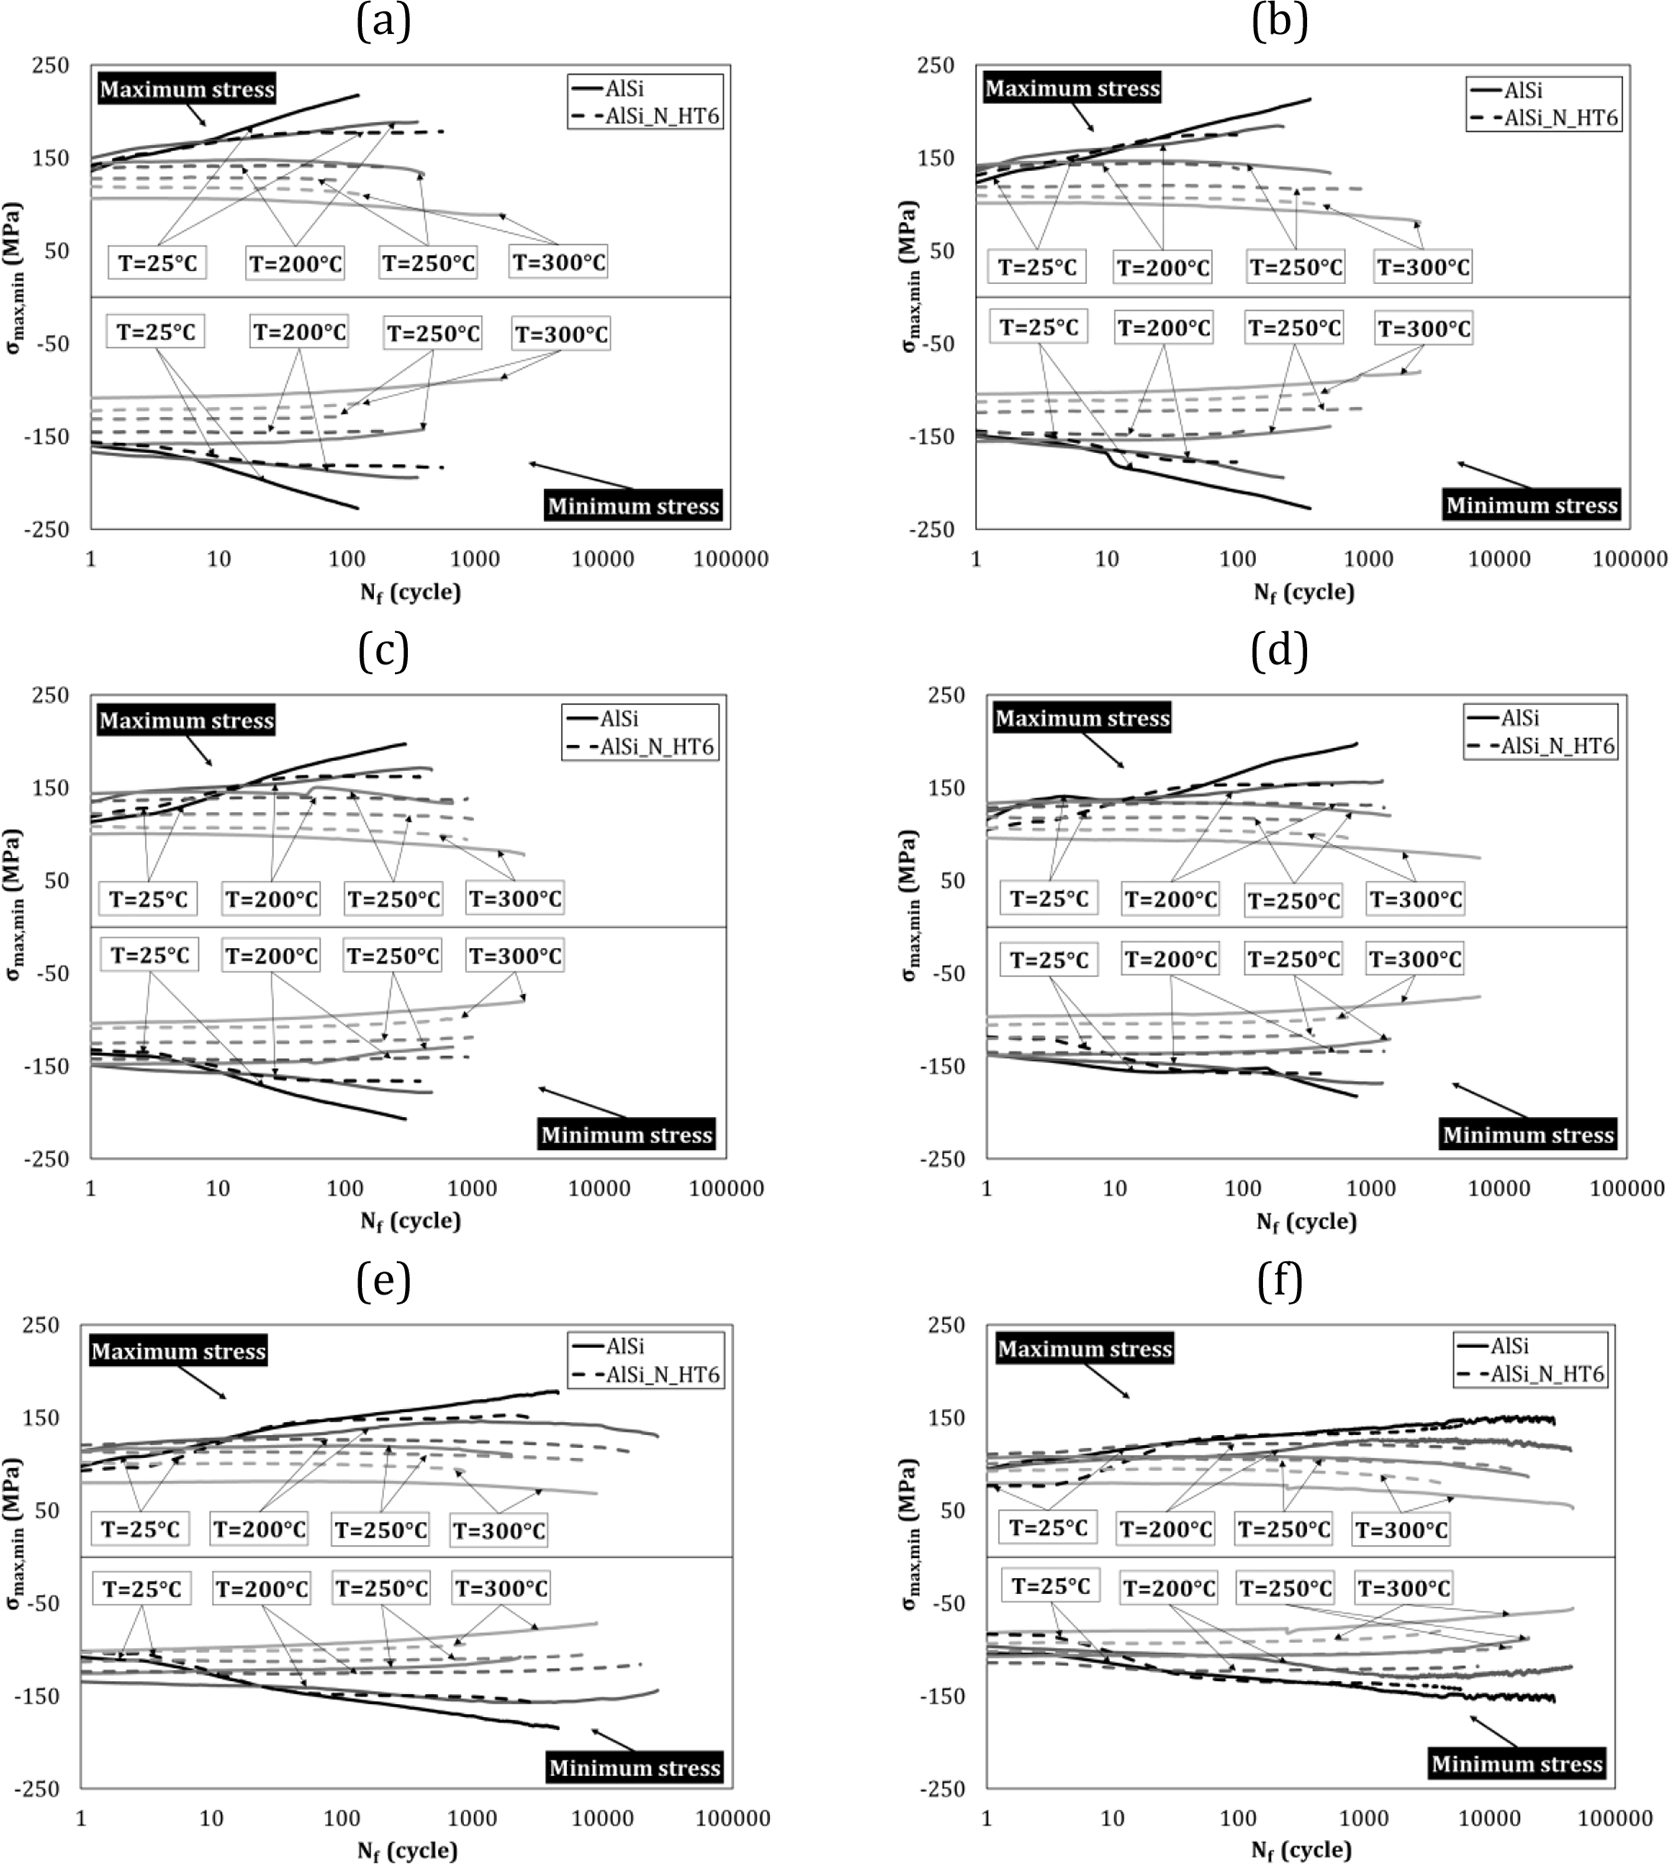
The maximum stress and the minimum stress during cycles for (a) AlSi at 25°C, (b) AlSi_N_HT6 at 25°C, (c) AlSi at 200°C, (d) AlSi_N_HT6 at 200°C, (e) AlSi at 250°C, (f) AlSi_N_HT6 at 250°C, (g) AlSi at 300°C, and (h) AlSi_N_HT6 at 300°C.
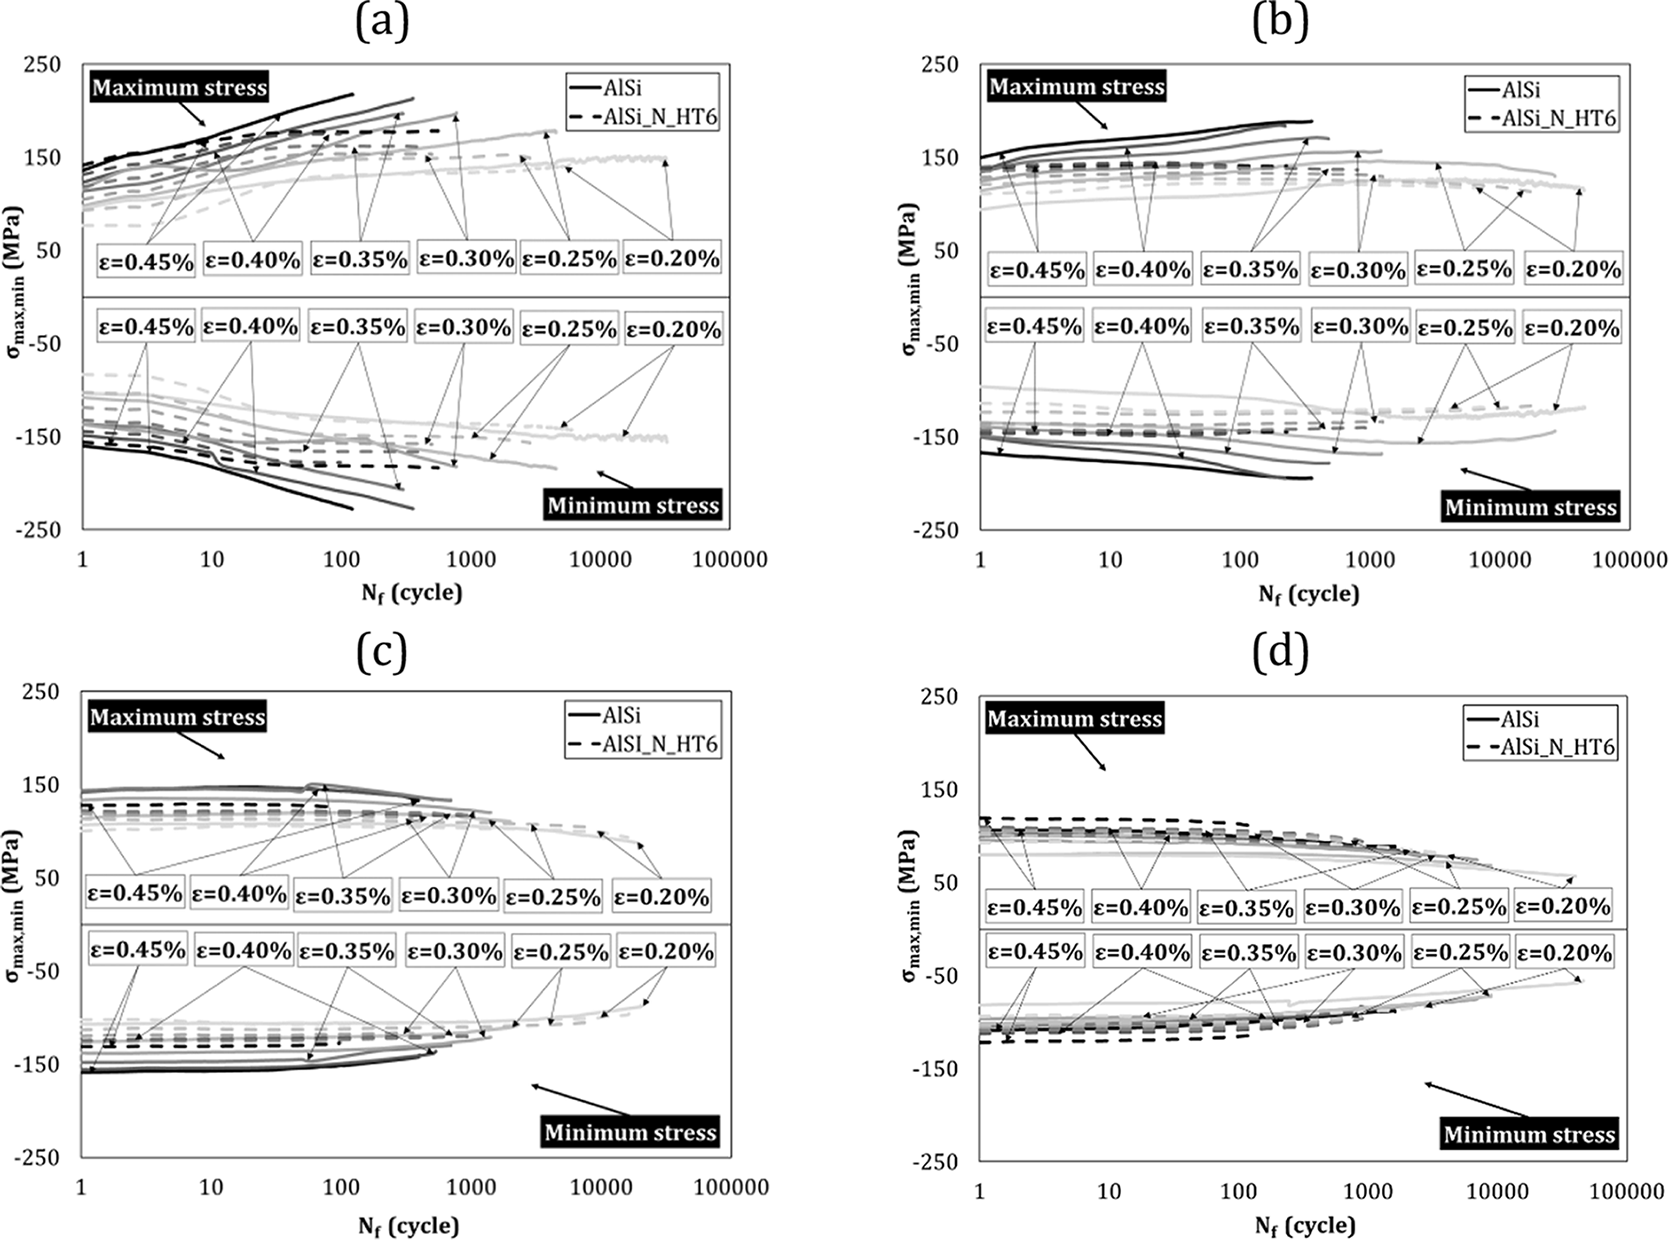
The maximum stress and the minimum stress during cycles under (a) 0.45% for AlSi, (b) 0.45% for AlSi_N_HT6, (c) 0.40% for AlSi, (d) 0.40% for AlSi_N_HT6, (e) 0.35% for AlSi, (f) 0.35% for AlSi_N_HT6, (g) 0.30% for AlSi, (h) 0.30 for AlSi_N_HT6, (i) 0.25% for AlSi, (j) 0.25% for AlSi_N_HT6, (k) 0.20% for AlSi, and (l) 0.20% for AlSi_N_HT6 of the total strain amplitude.
The amplitude of the plastic strain during cycles at the temperature of (a) 25°C for AlSi, (b) 25°C for AlSi_N_HT6, (c) 200°C for AlSi, (d) 200°C for AlSi_N_HT6, (e) 250°C for AlSi, (f) 250°C for AlSi_N_HT6, (g) 300°C for AlSi, and (h) 300°C for AlSi_N_HT6.
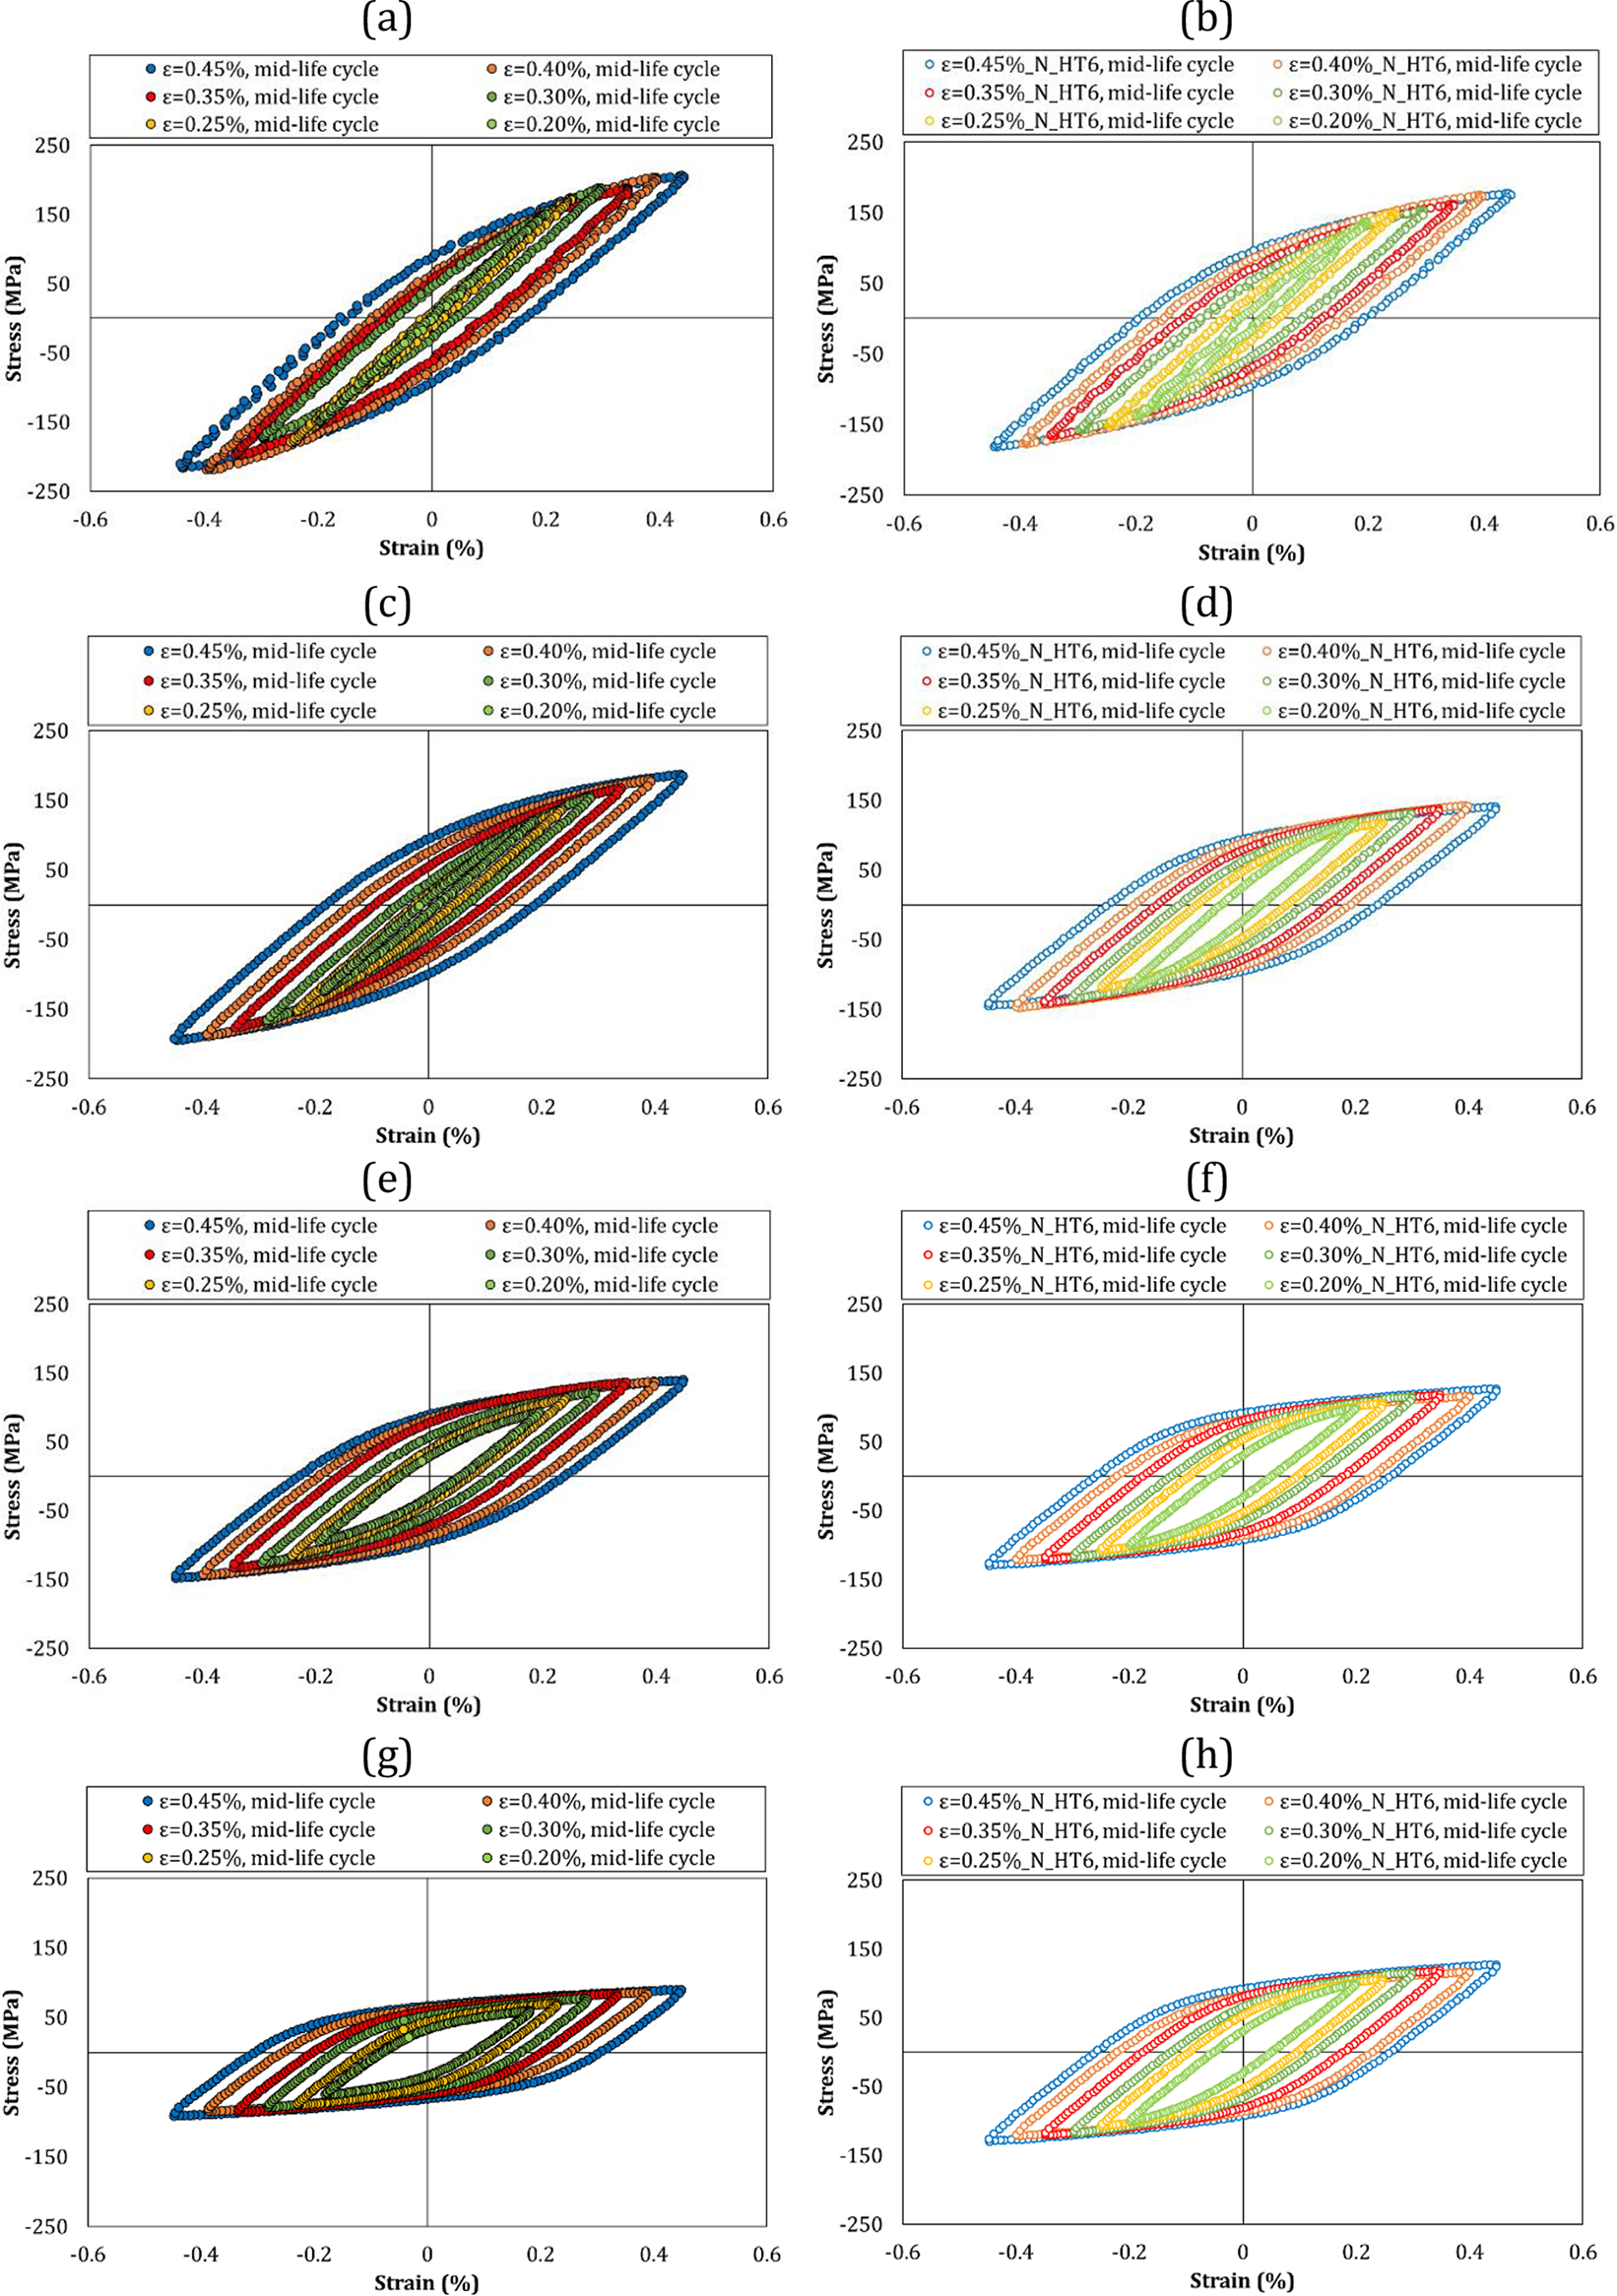
The effect of the total strain amplitude on the hysteresis loop at the temperature of (a) 25°C for AlSi, (b) 25°C for AlSi_N_HT6, (c) 200°C for AlSi, (d) 200°C for AlSi_N_HT6, (e) 250°C for AlSi, (f) 250°C for AlSi_N_HT6, (g) 300°C for AlSi, and (h) 300°C for AlSi_N_HT6.
The temperature effect on the hysteresis loop under the strain amplitude of (a) 0.45% for AlSi, (b) 0.45% for AlSi_N_HT6, (c) 0.40% for AlSi, (d) 0.40% for AlSi_N_HT6, (e) 0.35% for AlSi, (f) 0.35% for AlSi_N_HT6, (g) 0.30% for AlSi, (h) 0.30% for AlSi_N_HT6, (i) 0.25% for AlSi, (j) 0.25% for AlSi_N_HT6, (k) 0.20% for AlSi, and (l) 0.20% for AlSi_N_HT6.
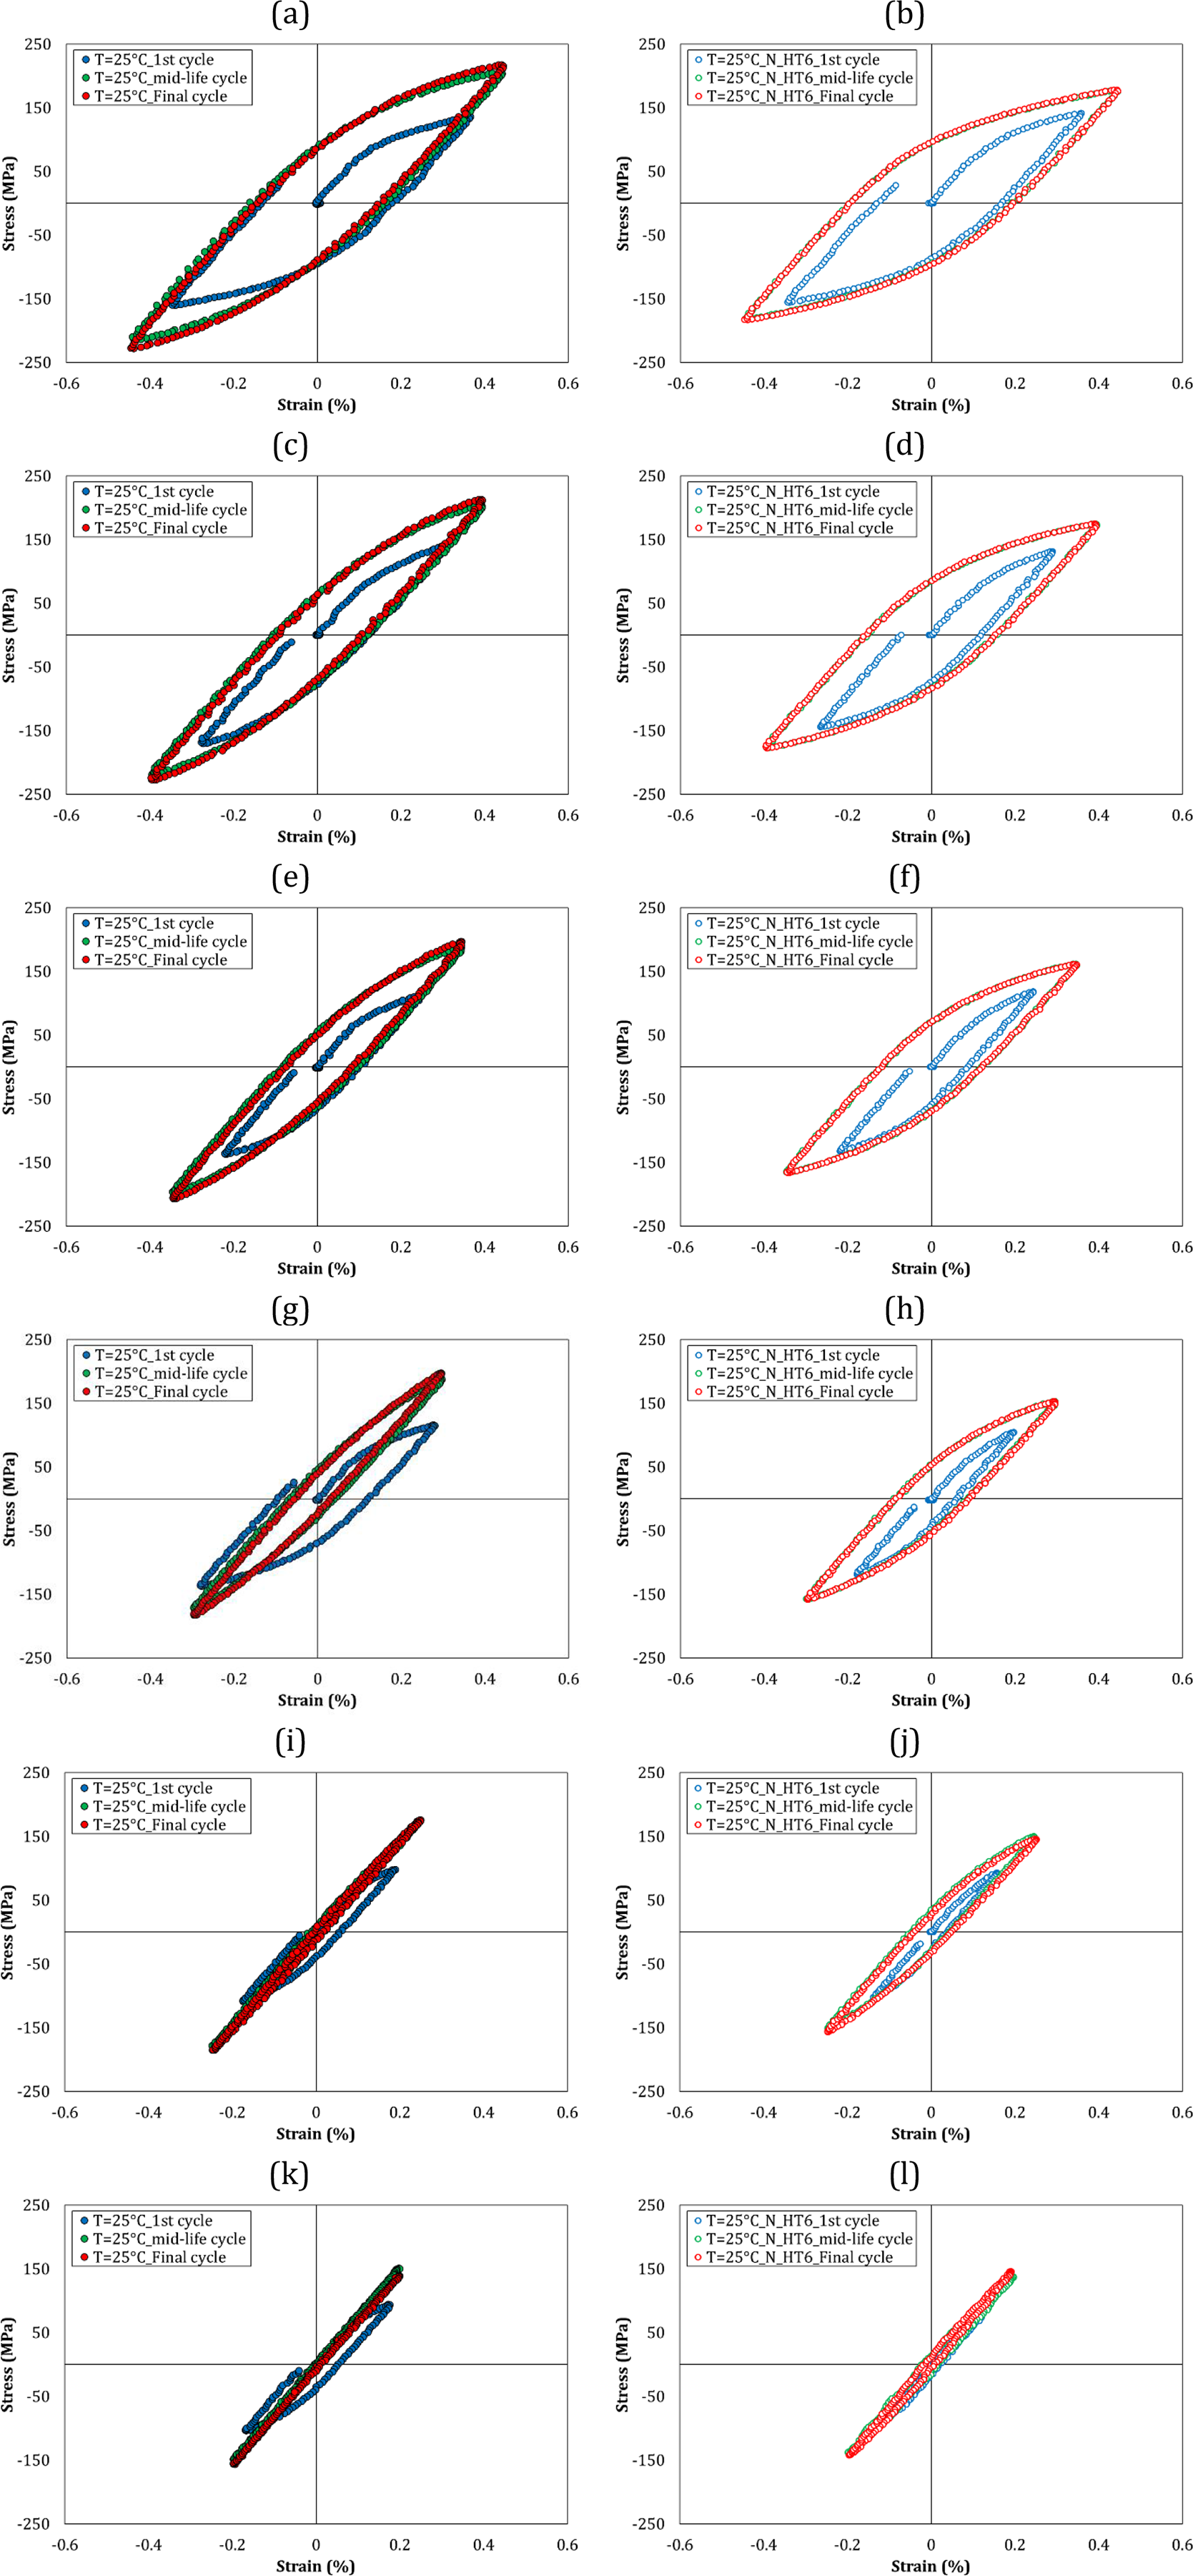
The stress–strain hysteresis for the first cycle, the mid-life cycle and the final cycle at 25°C and at the strain amplitude of (a) 0.45% for AlSi, (b) 0.45% for AlSi_N_HT6, (c) 0.40% for AlSi, (d) 0.40% for AlSi_N_HT6, (e) 0.35% for AlSi, (f) 0.35% for AlSi_N_HT6, (g) 0.30% for AlSi, (h) 0.30% for AlSi_N_HT6, (i) 0.25% for AlSi, (j) 0.25% for AlSi_N_HT6, (k) 0.20% for AlSi, and (l) 0.20% for AlSi_N_HT6.
The stress–strain hysteresis for the first cycle, the mid-life cycle and the final cycle at 200°C and at the strain amplitude of (a) 0.45% for AlSi, (b) 0.45% for AlSi_N_HT6, (c) 0.40% for AlSi, (d) 0.40% for AlSi_N_HT6, (e) 0.35% for AlSi, (f) 0.35% for AlSi_N_HT6, (g) 0.30% for AlSi, (h) 0.30% for AlSi_N_HT6, (i) 0.25% for AlSi, (j) 0.25% for AlSi_N_HT6, (k) 0.20% for AlSi, and (l) 0.20% for AlSi_N_HT6.
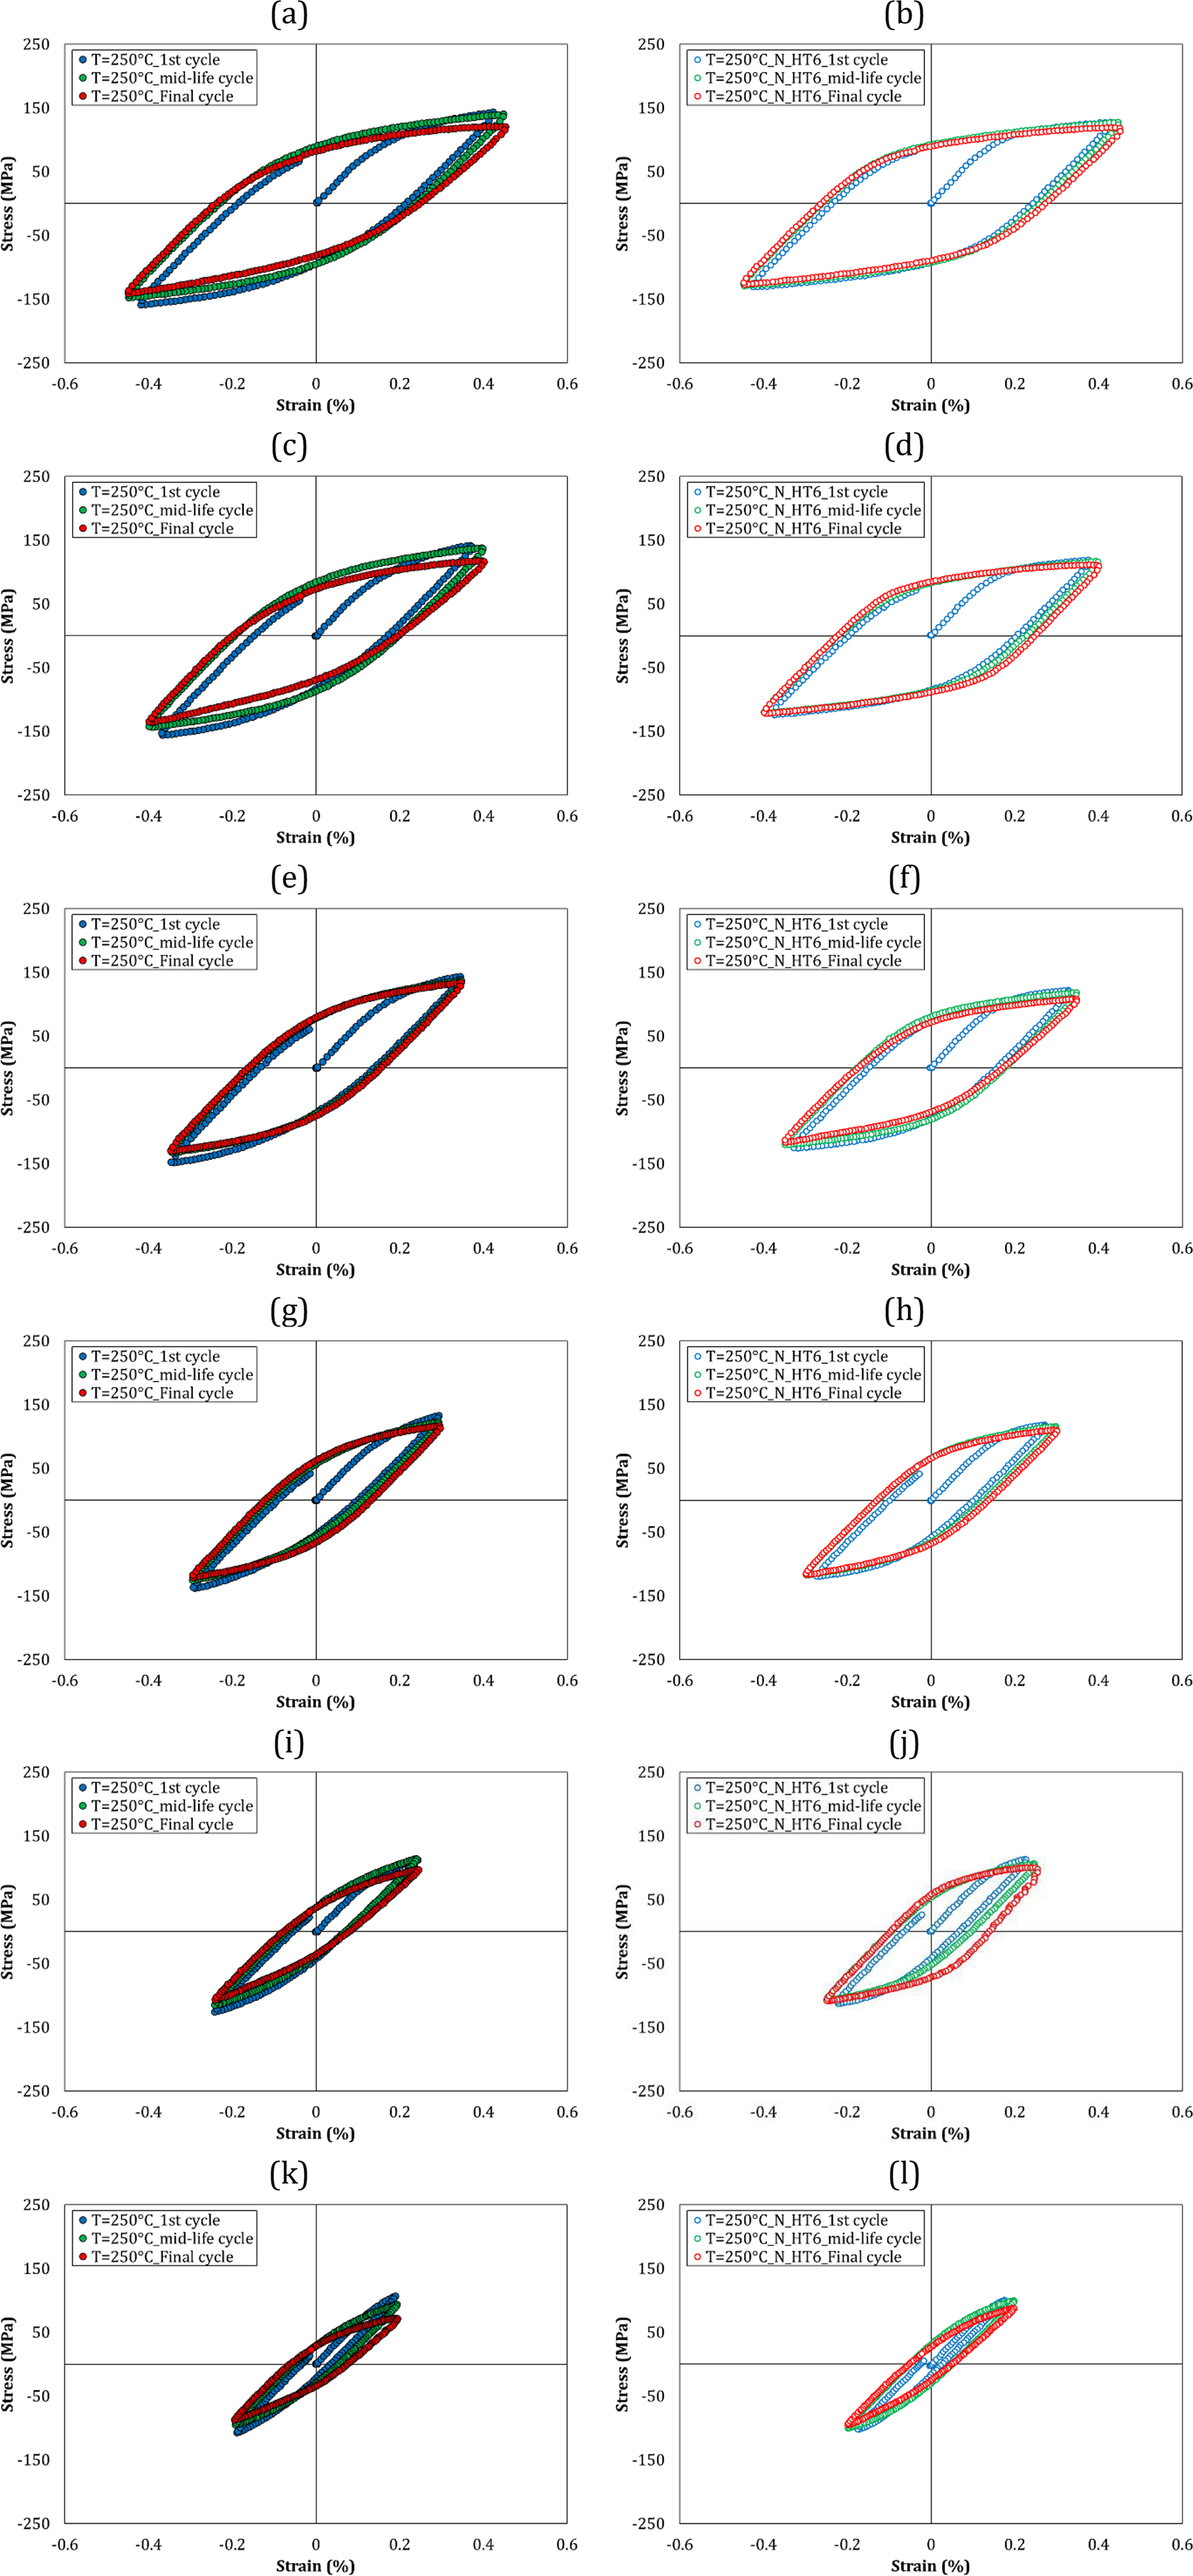
The stress–strain hysteresis for the first cycle, the mid-life cycle and the final cycle at 250°C and at the strain amplitude of (a) 0.45% for AlSi, (b) 0.45% for AlSi_N_HT6, (c) 0.40% for AlSi, (d) 0.40% for AlSi_N_HT6, (e) 0.35% for AlSi, (f) 0.35% for AlSi_N_HT6, (g) 0.30% for AlSi, (h) 0.30% for AlSi_N_HT6, (i) 0.25% for AlSi, (j) 0.25% for AlSi_N_HT6, (k) 0.20% for AlSi, and (l) 0.20% for AlSi_N_HT6.
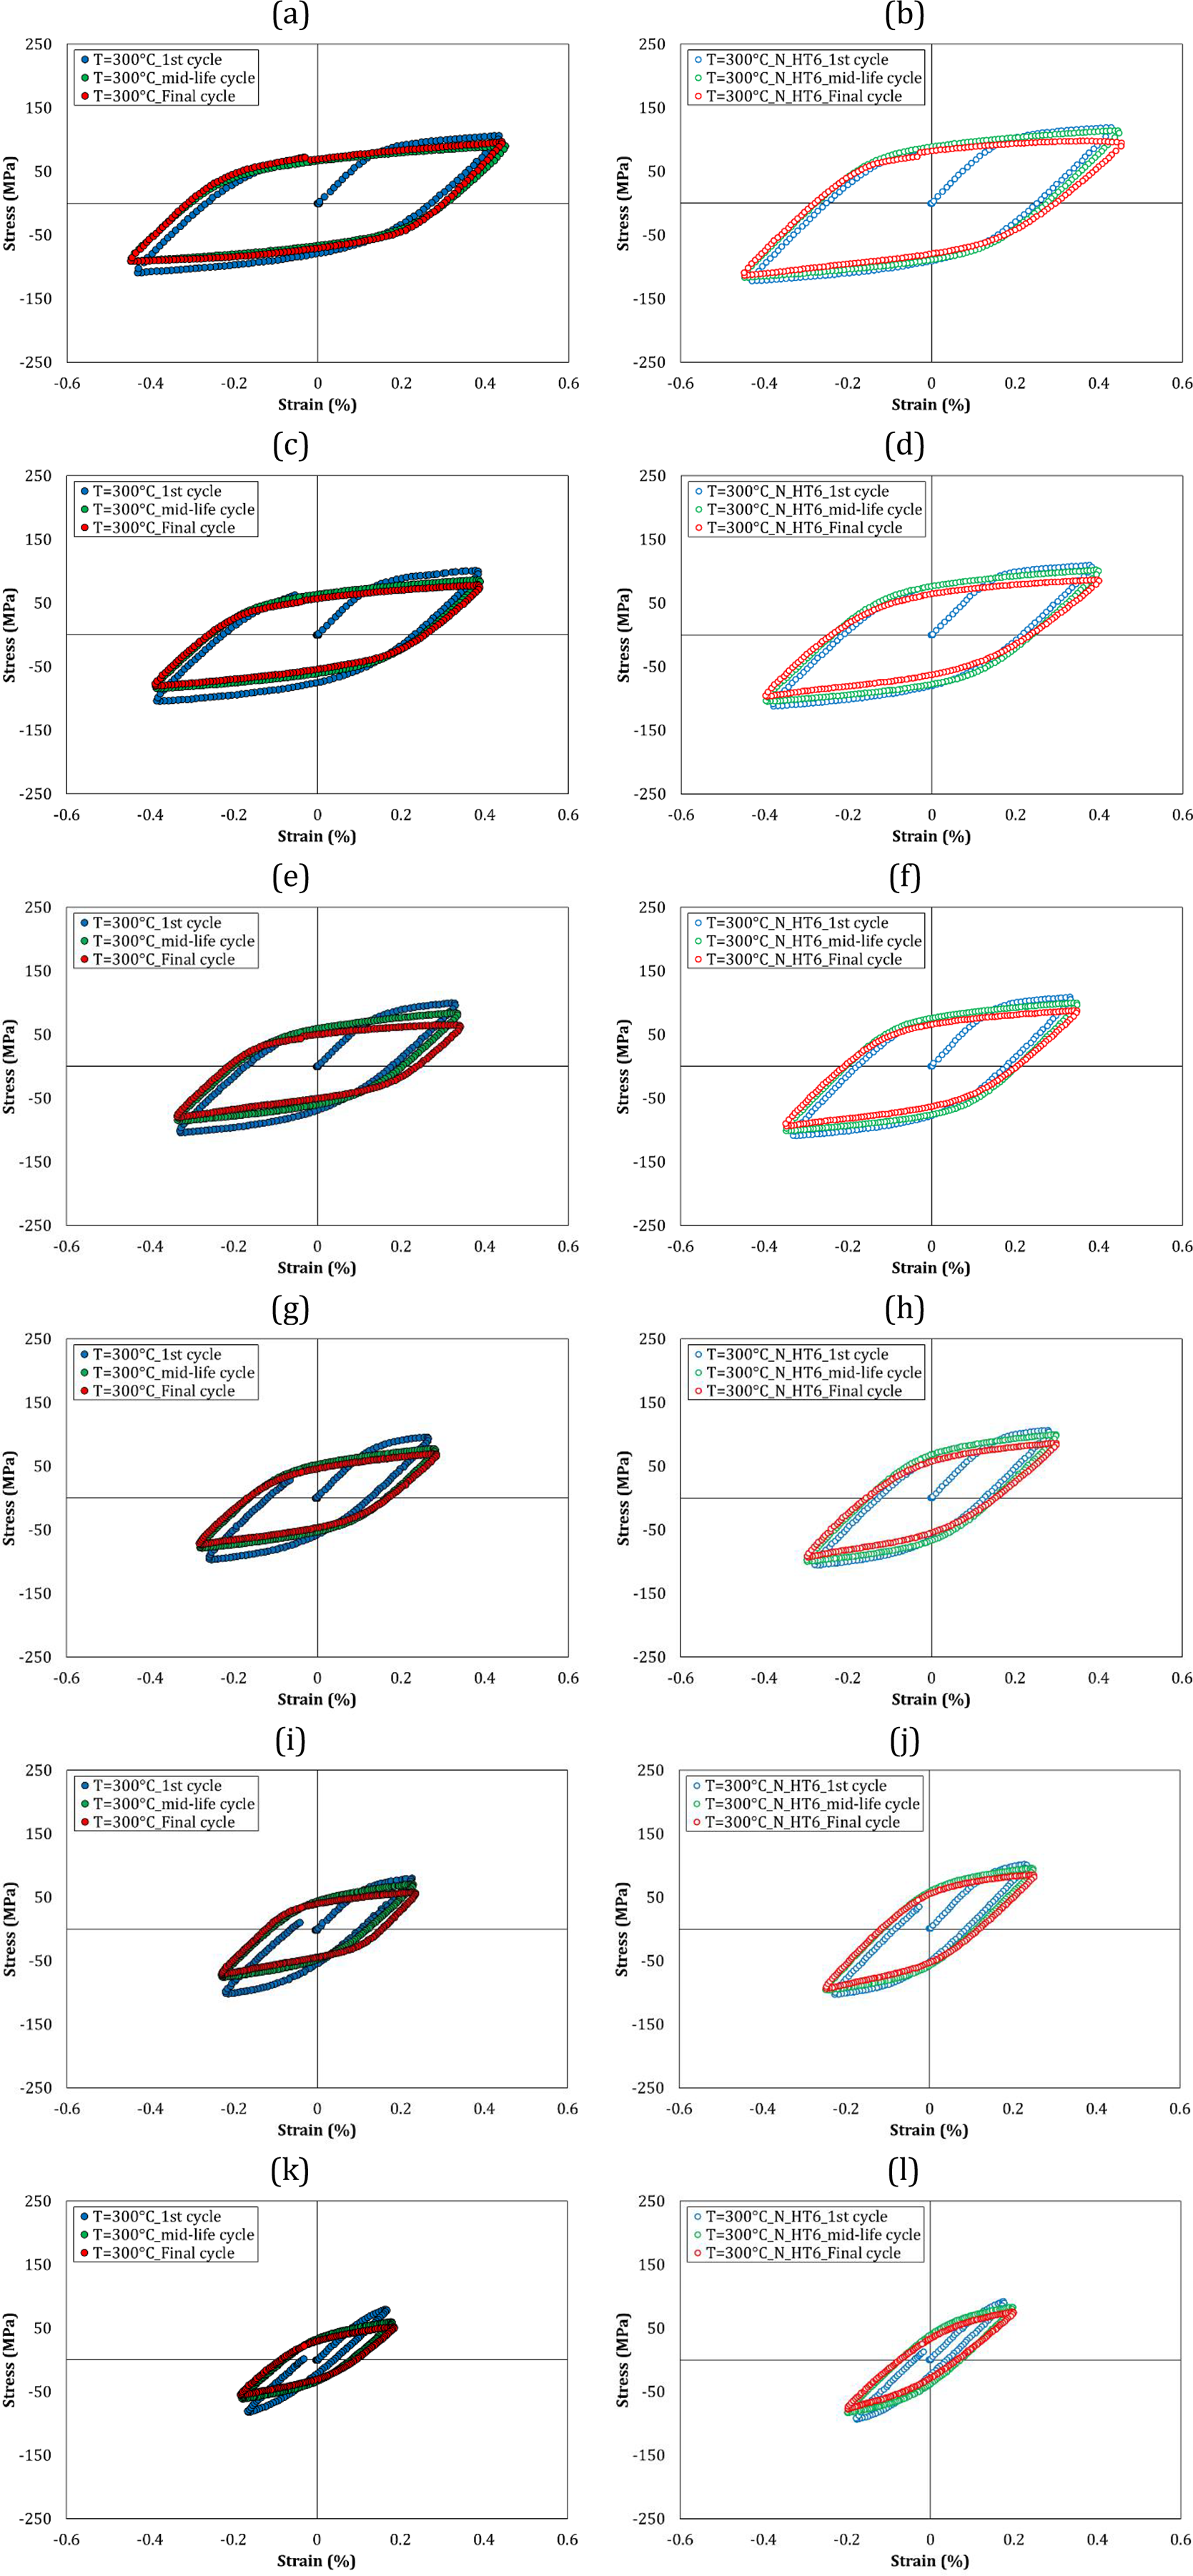
The stress–strain hysteresis for the first cycle, the mid-life cycle and the final cycle at 300°C and at the strain amplitude of (a) 0.45% for AlSi, (b) 0.45% for AlSi_N_HT6, (c) 0.40% for AlSi, (d) 0.40% for AlSi_N_HT6, (e) 0.35% for AlSi, (f) 0.35% for AlSi_N_HT6, (g) 0.30% for AlSi, (h) 0.30% for AlSi_N_HT6, (i) 0.25% for AlSi, (j) 0.25% for AlSi_N_HT6, (k) 0.20% for AlSi, and (l) 0.20% for AlSi_N_HT6.
The stress–strain hysteresis for the first cycle, the mid-life cycle and the final cycle at the total strain amplitude of 0.45% and at the temperature of (a) 25°C for AlSi, (b) 25°C for AlSi_N_HT6, (c) 200°C for AlSi, (d) 200°C for AlSi_N_HT6, (e) 250°C for AlSi, (f) 250°C for AlSi_N_HT6, (g) 300°C for AlSi, and (h) 300°C for AlSi_N_HT6.
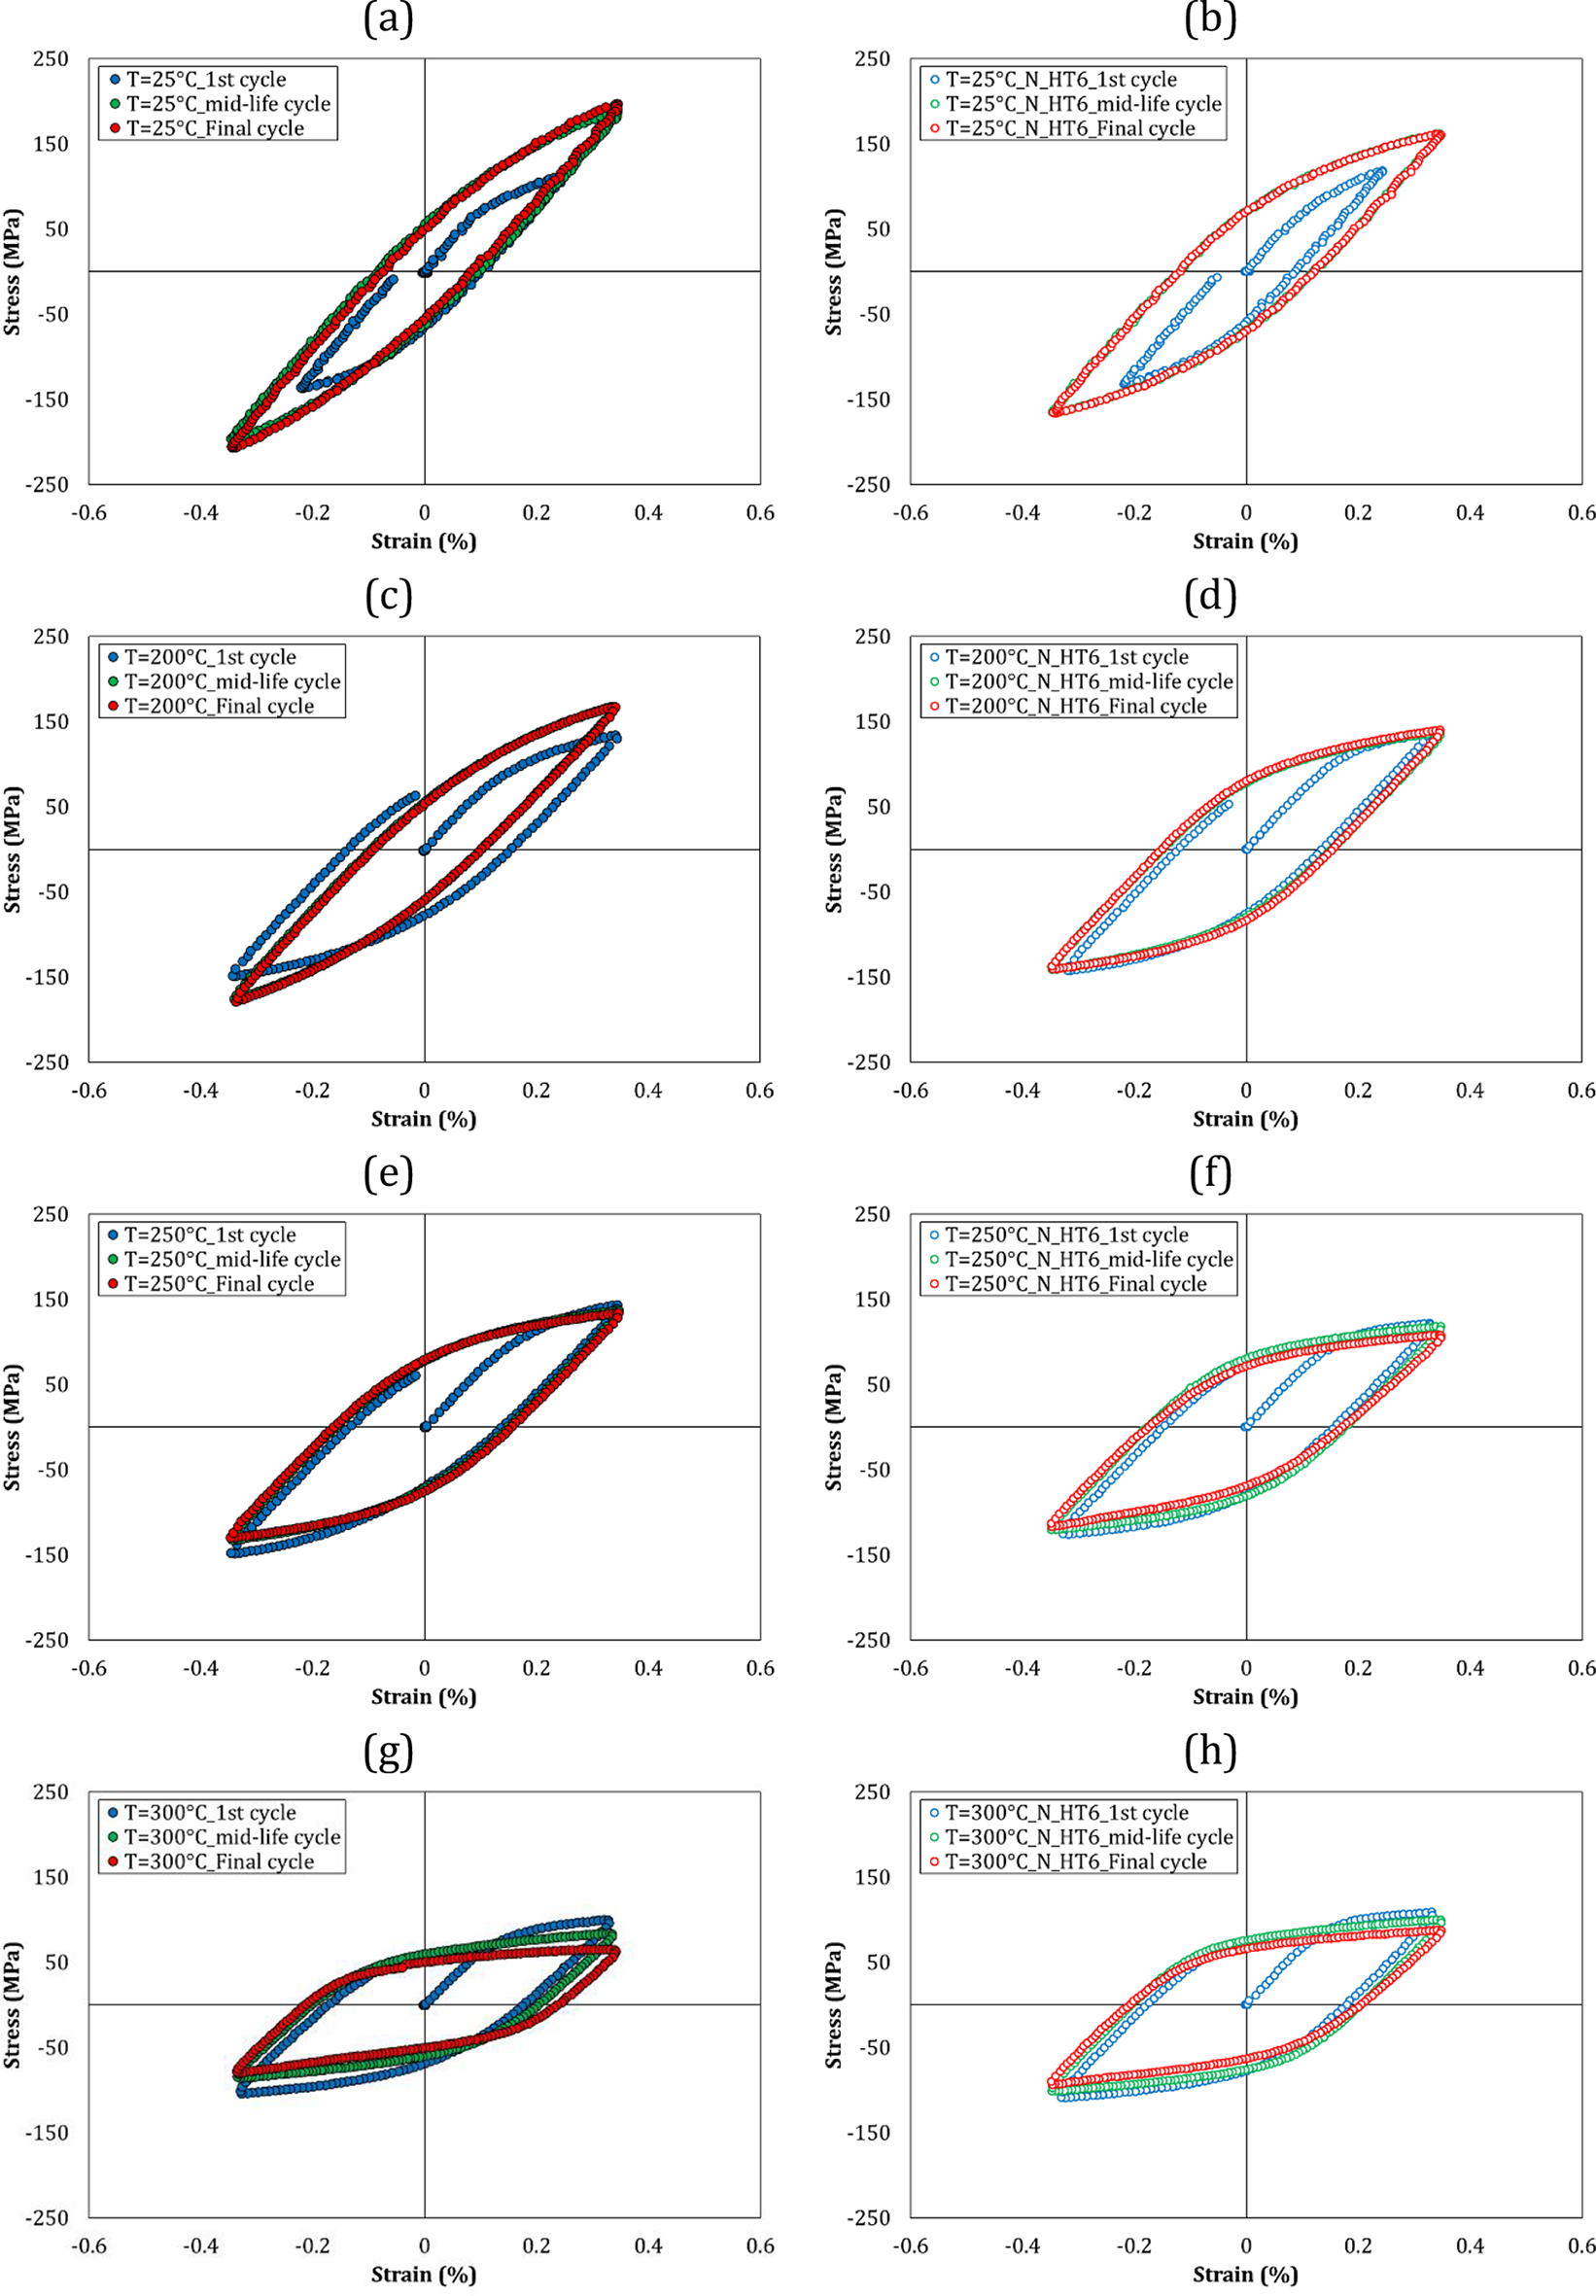
The stress–strain hysteresis for the first cycle, the mid-life cycle and the final cycle at the total strain amplitude of 0.40% and at the temperature of (a) 25°C for AlSi, (b) 25°C for AlSi_N_HT6, (c) 200°C for AlSi, (d) 200°C for AlSi_N_HT6, (e) 250°C for AlSi, (f) 250°C for AlSi_N_HT6, (g) 300°C for AlSi, and (h) 300°C for AlSi_N_HT6.
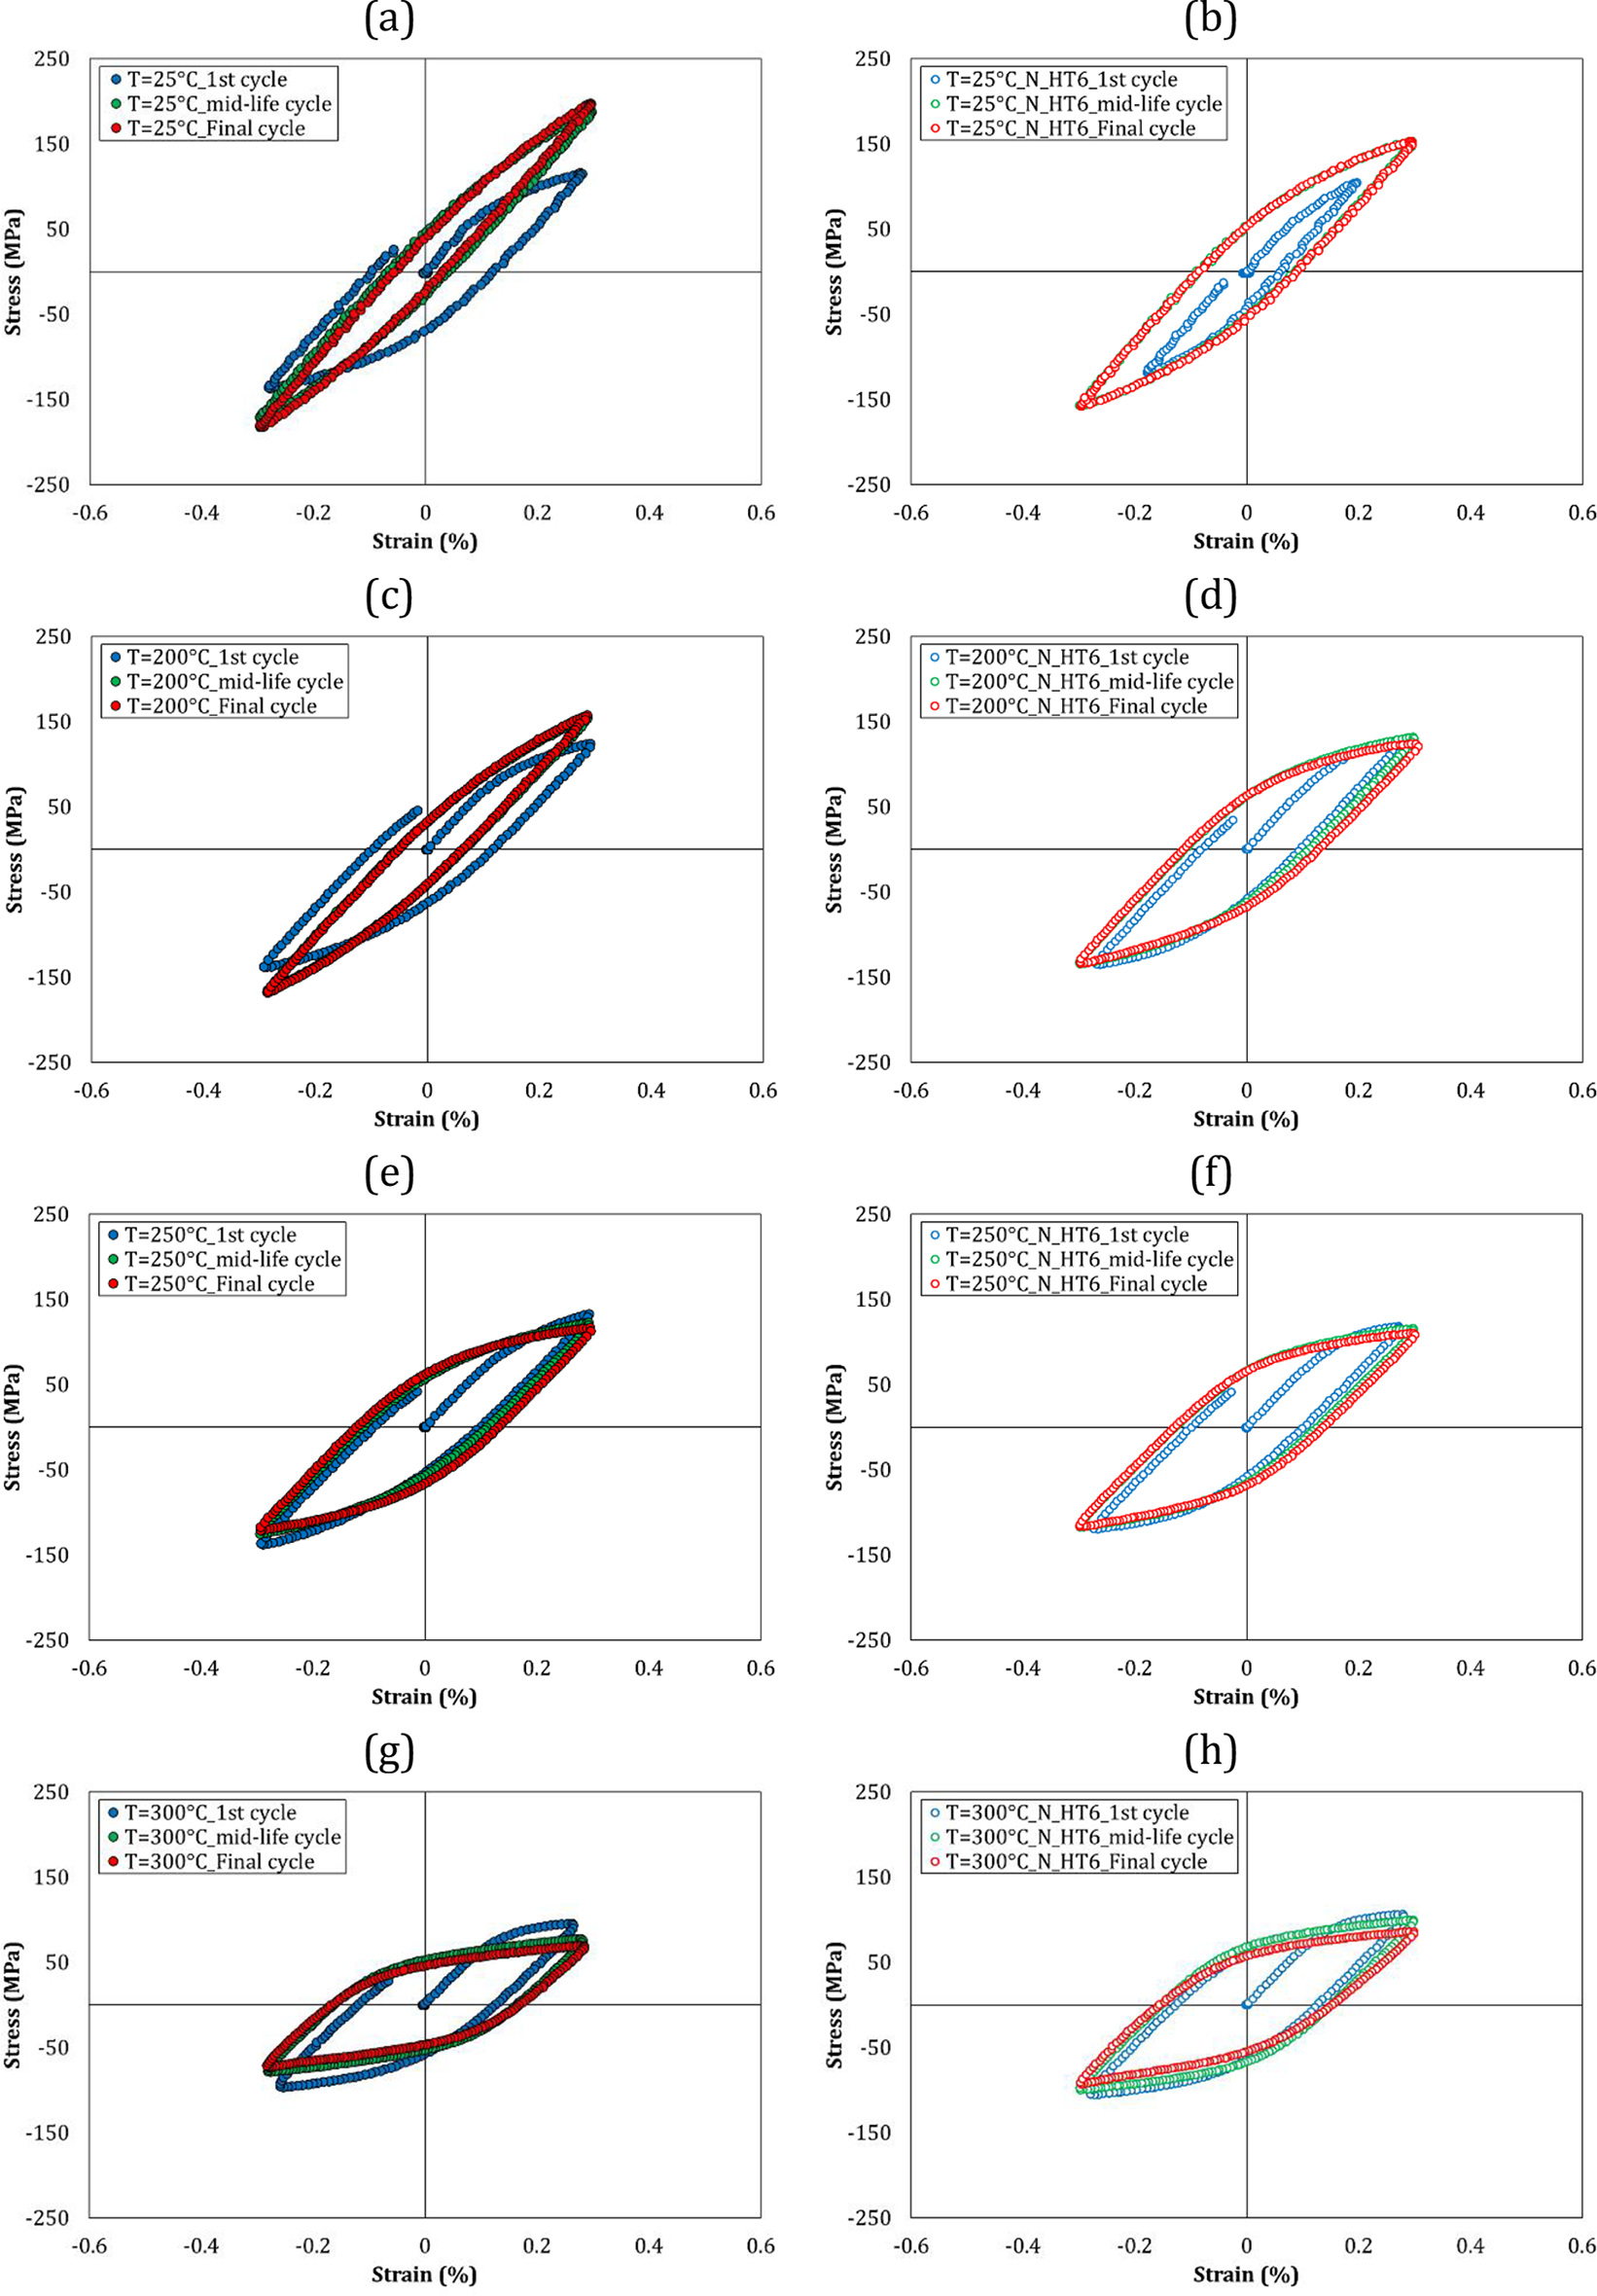
The stress–strain hysteresis for the first cycle, the mid-life cycle and the final cycle at the total strain amplitude of 0.35% and at the temperature of (a) 25°C for AlSi, (b) 25°C for AlSi_N_HT6, (c) 200°C for AlSi, (d) 200°C for AlSi_N_HT6, (e) 250°C for AlSi, (f) 250°C for AlSi_N_HT6, (g) 300°C for AlSi, and (h) 300°C for AlSi_N_HT6.
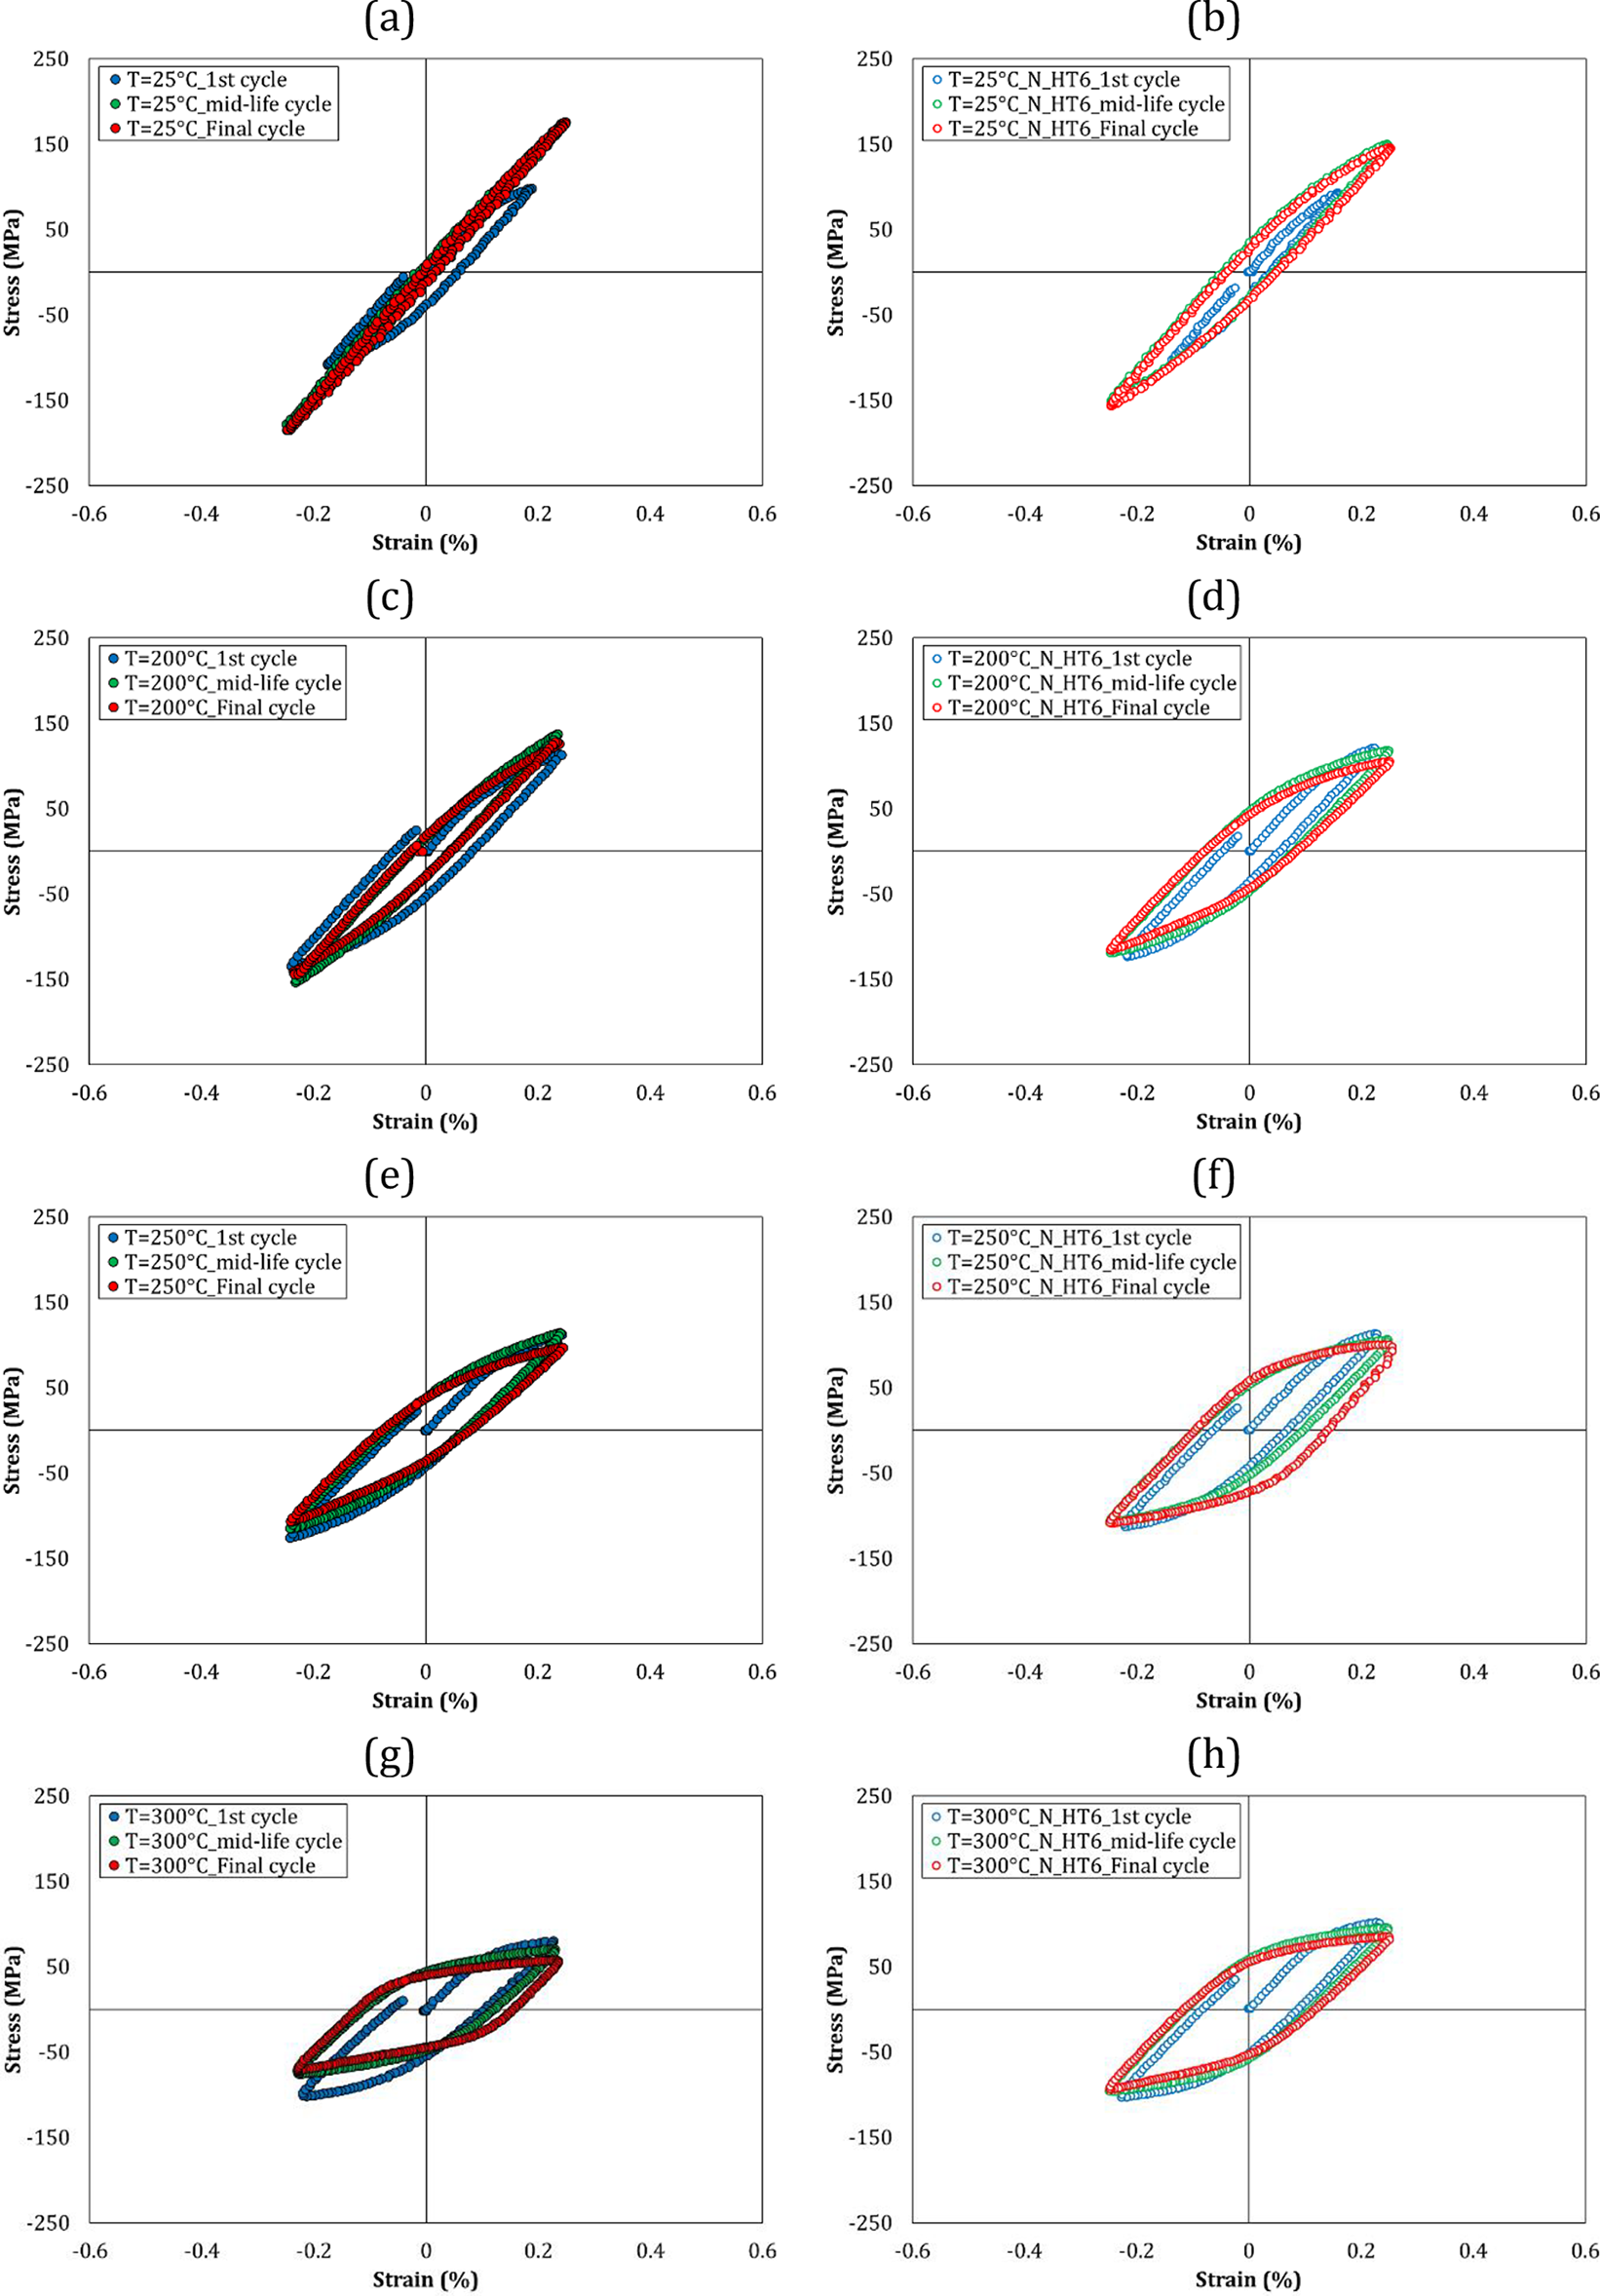
The stress–strain hysteresis for the first cycle, the mid-life cycle and the final cycle at the total strain amplitude of 0.30% and at the temperature of (a) 25°C for AlSi, (b) 25°C for AlSi_N_HT6, (c) 200°C for AlSi, (d) 200°C for AlSi_N_HT6, (e) 250°C for AlSi, (f) 250°C for AlSi_N_HT6, (g) 300°C for AlSi, and (h) 300°C for AlSi_N_HT6.
The stress–strain hysteresis for the first cycle, the mid-life cycle and the final cycle at the total strain amplitude of 0.25% and at the temperature of (a) 25°C for AlSi, (b) 25°C for AlSi_N_HT6, (c) 200°C for AlSi, (d) 200°C for AlSi_N_HT6, (e) 250°C for AlSi, (f) 250°C for AlSi_N_HT6, (g) 300°C for AlSi, and (h) 300°C for AlSi_N_HT6.
The stress–strain hysteresis for the first cycle, the mid-life cycle and the final cycle at the total strain amplitude of 0.20% and at the temperature of (a) 25°C for AlSi, (b) 25°C for AlSi_N_HT6, (c) 200°C for AlSi, (d) 200°C for AlSi_N_HT6, (e) 250°C for AlSi, (f) 250°C for AlSi_N_HT6, (g) 300°C for AlSi, and (h) 300°C for AlSi_N_HT6.
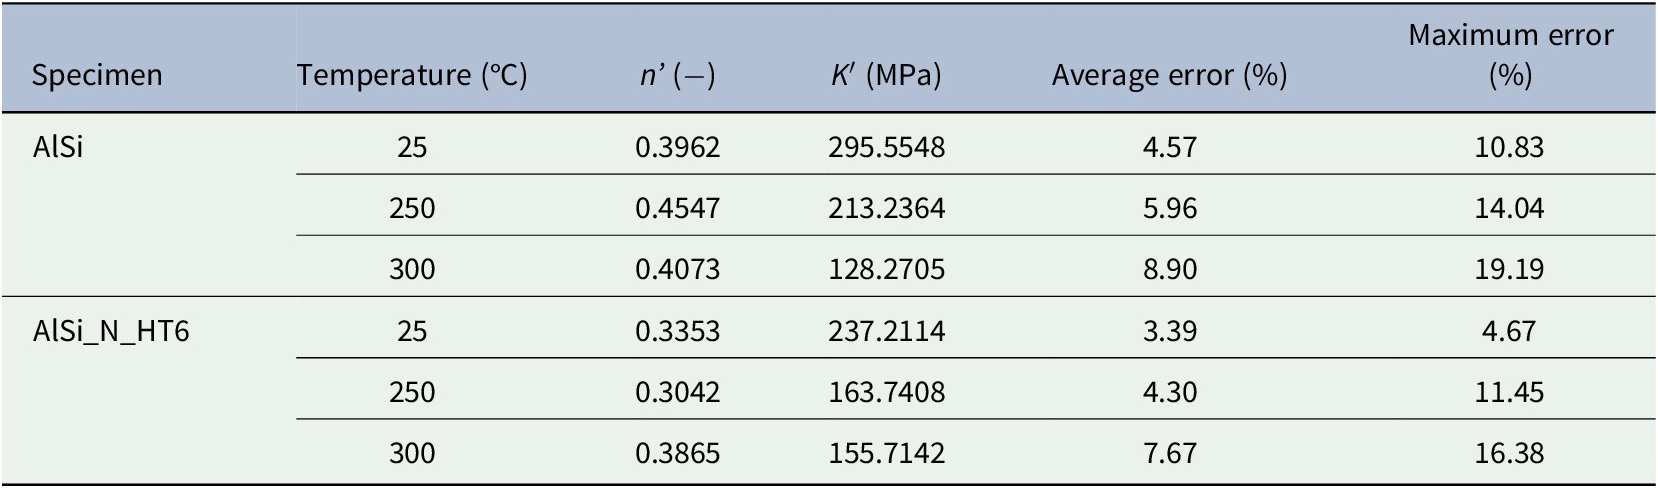
The Ramberg–Osgood relation was used to investigate the cyclic behavior of the AlSi and the AlSi_N_HT6 samples so that the details could be seen in Table 2. There were differences between the cyclic behavior of AlSi at 250°C and also for AlSi_N_HT6 at 250°C and 300°C. As the Ramberg–Osgood equation used experimental data of the mid-life cycle for evaluating the cyclic behavior and thus, there could be some differences between the cyclic behavior by the raw experimental results and the Ramberg–Osgood equation. Material constants are represented in Table 3. As it can be seen in this table, by increasing the temperature, the average error and the maximum error gradually increased. One possible reason could be based on higher variations of fatigue testing data for standard samples, due to the microstructural changes under higher temperatures. However, the main concern for such changes in the relative error could be mentioned due to the scatter-band of experimental fatigue data.
The cyclic behavior of AlSi and AlSi_N_HT6 using Ramberg–Osgood equation
The Ramberg–Osgood parameters
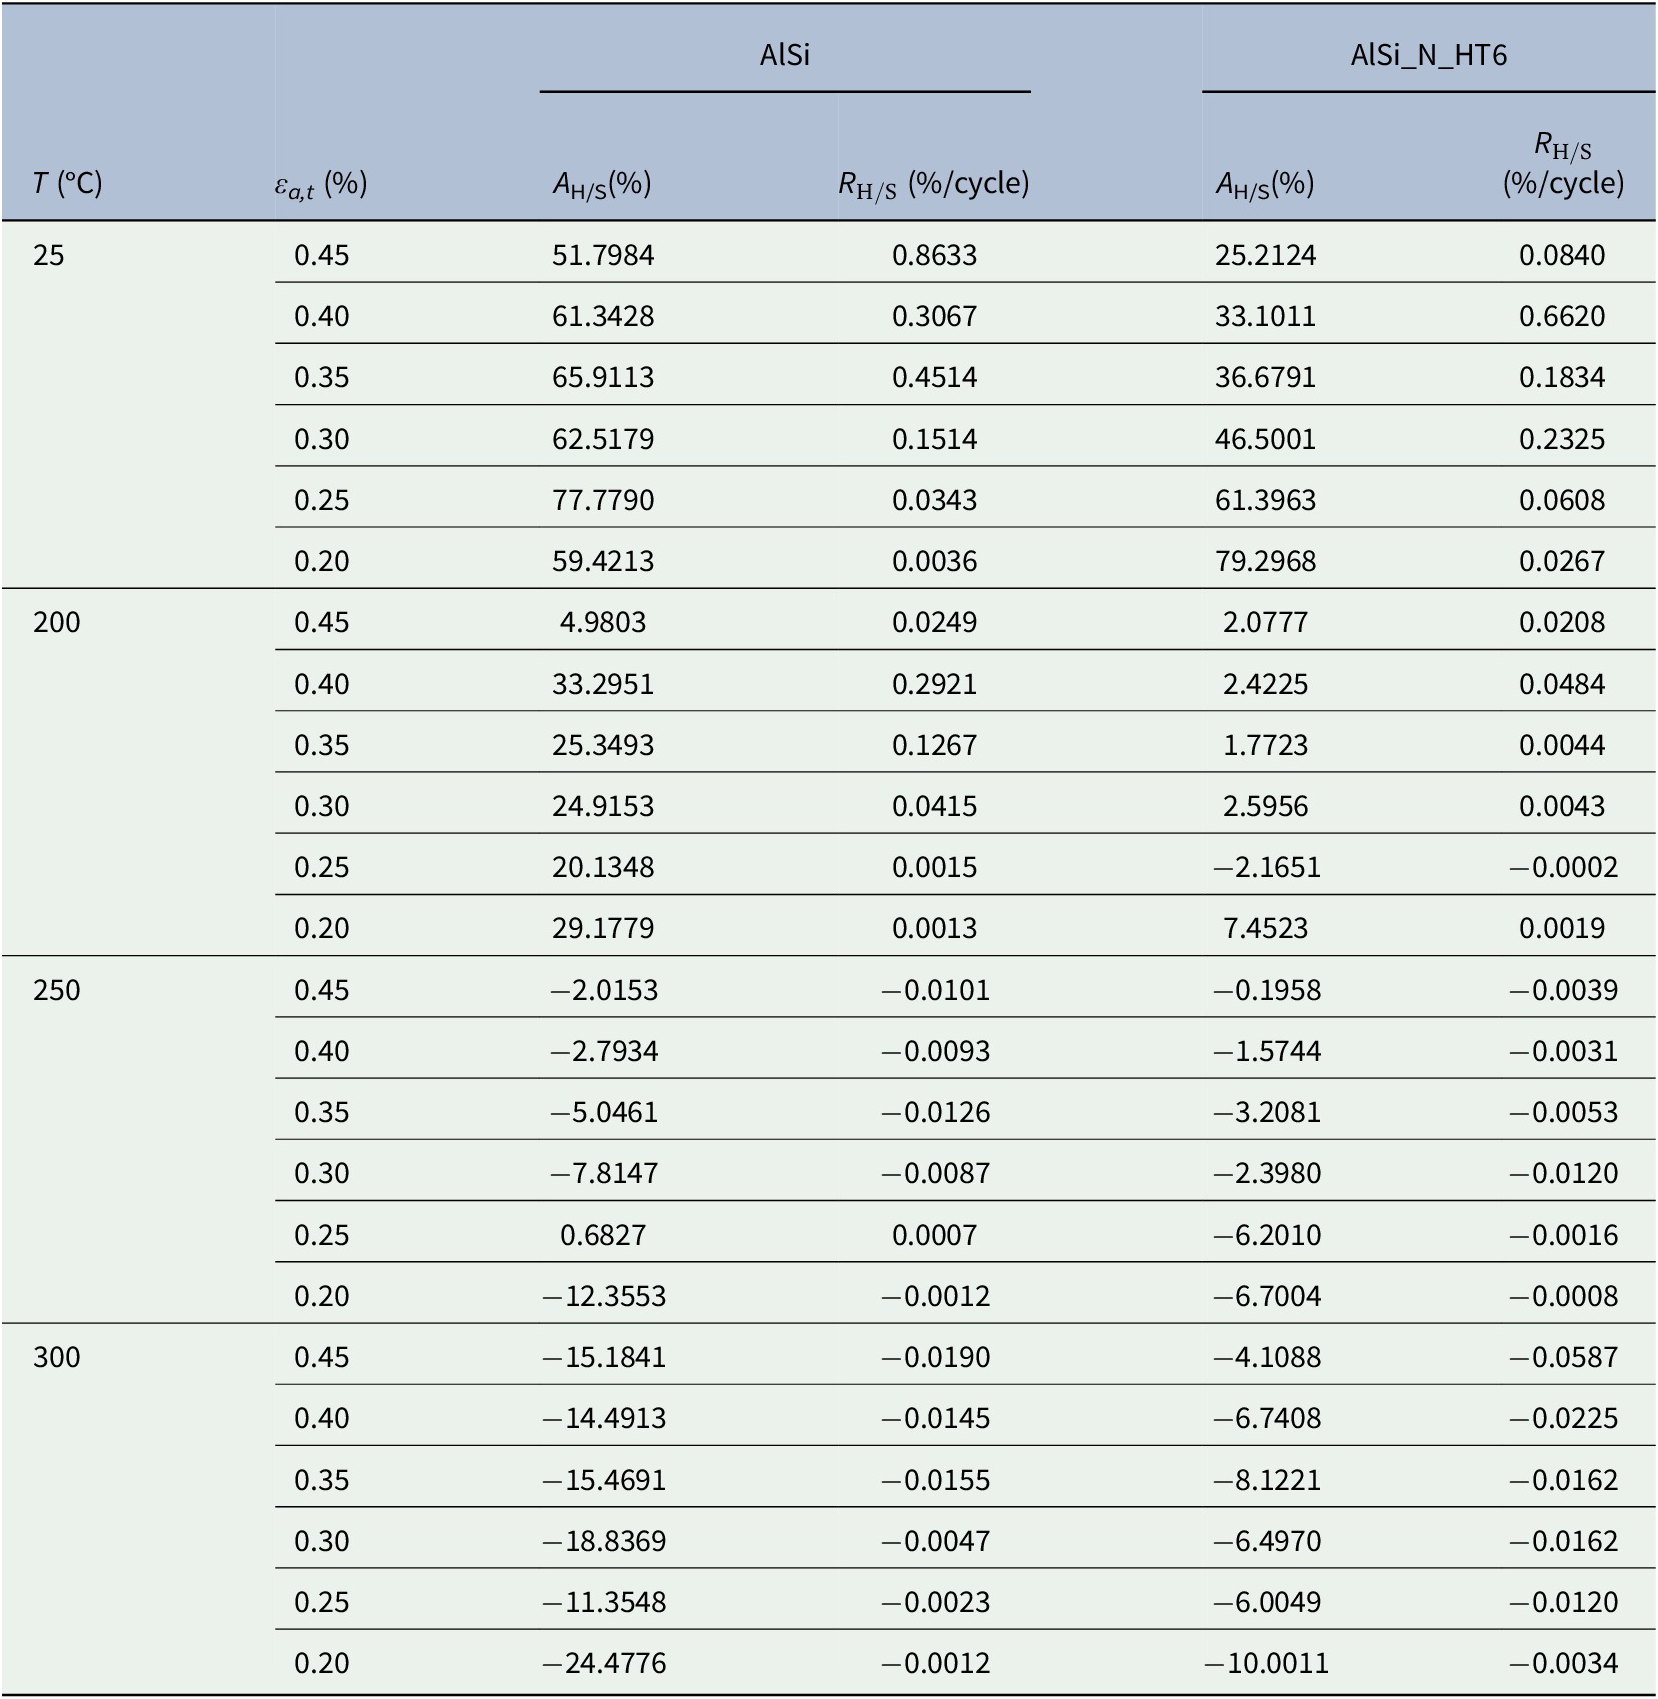
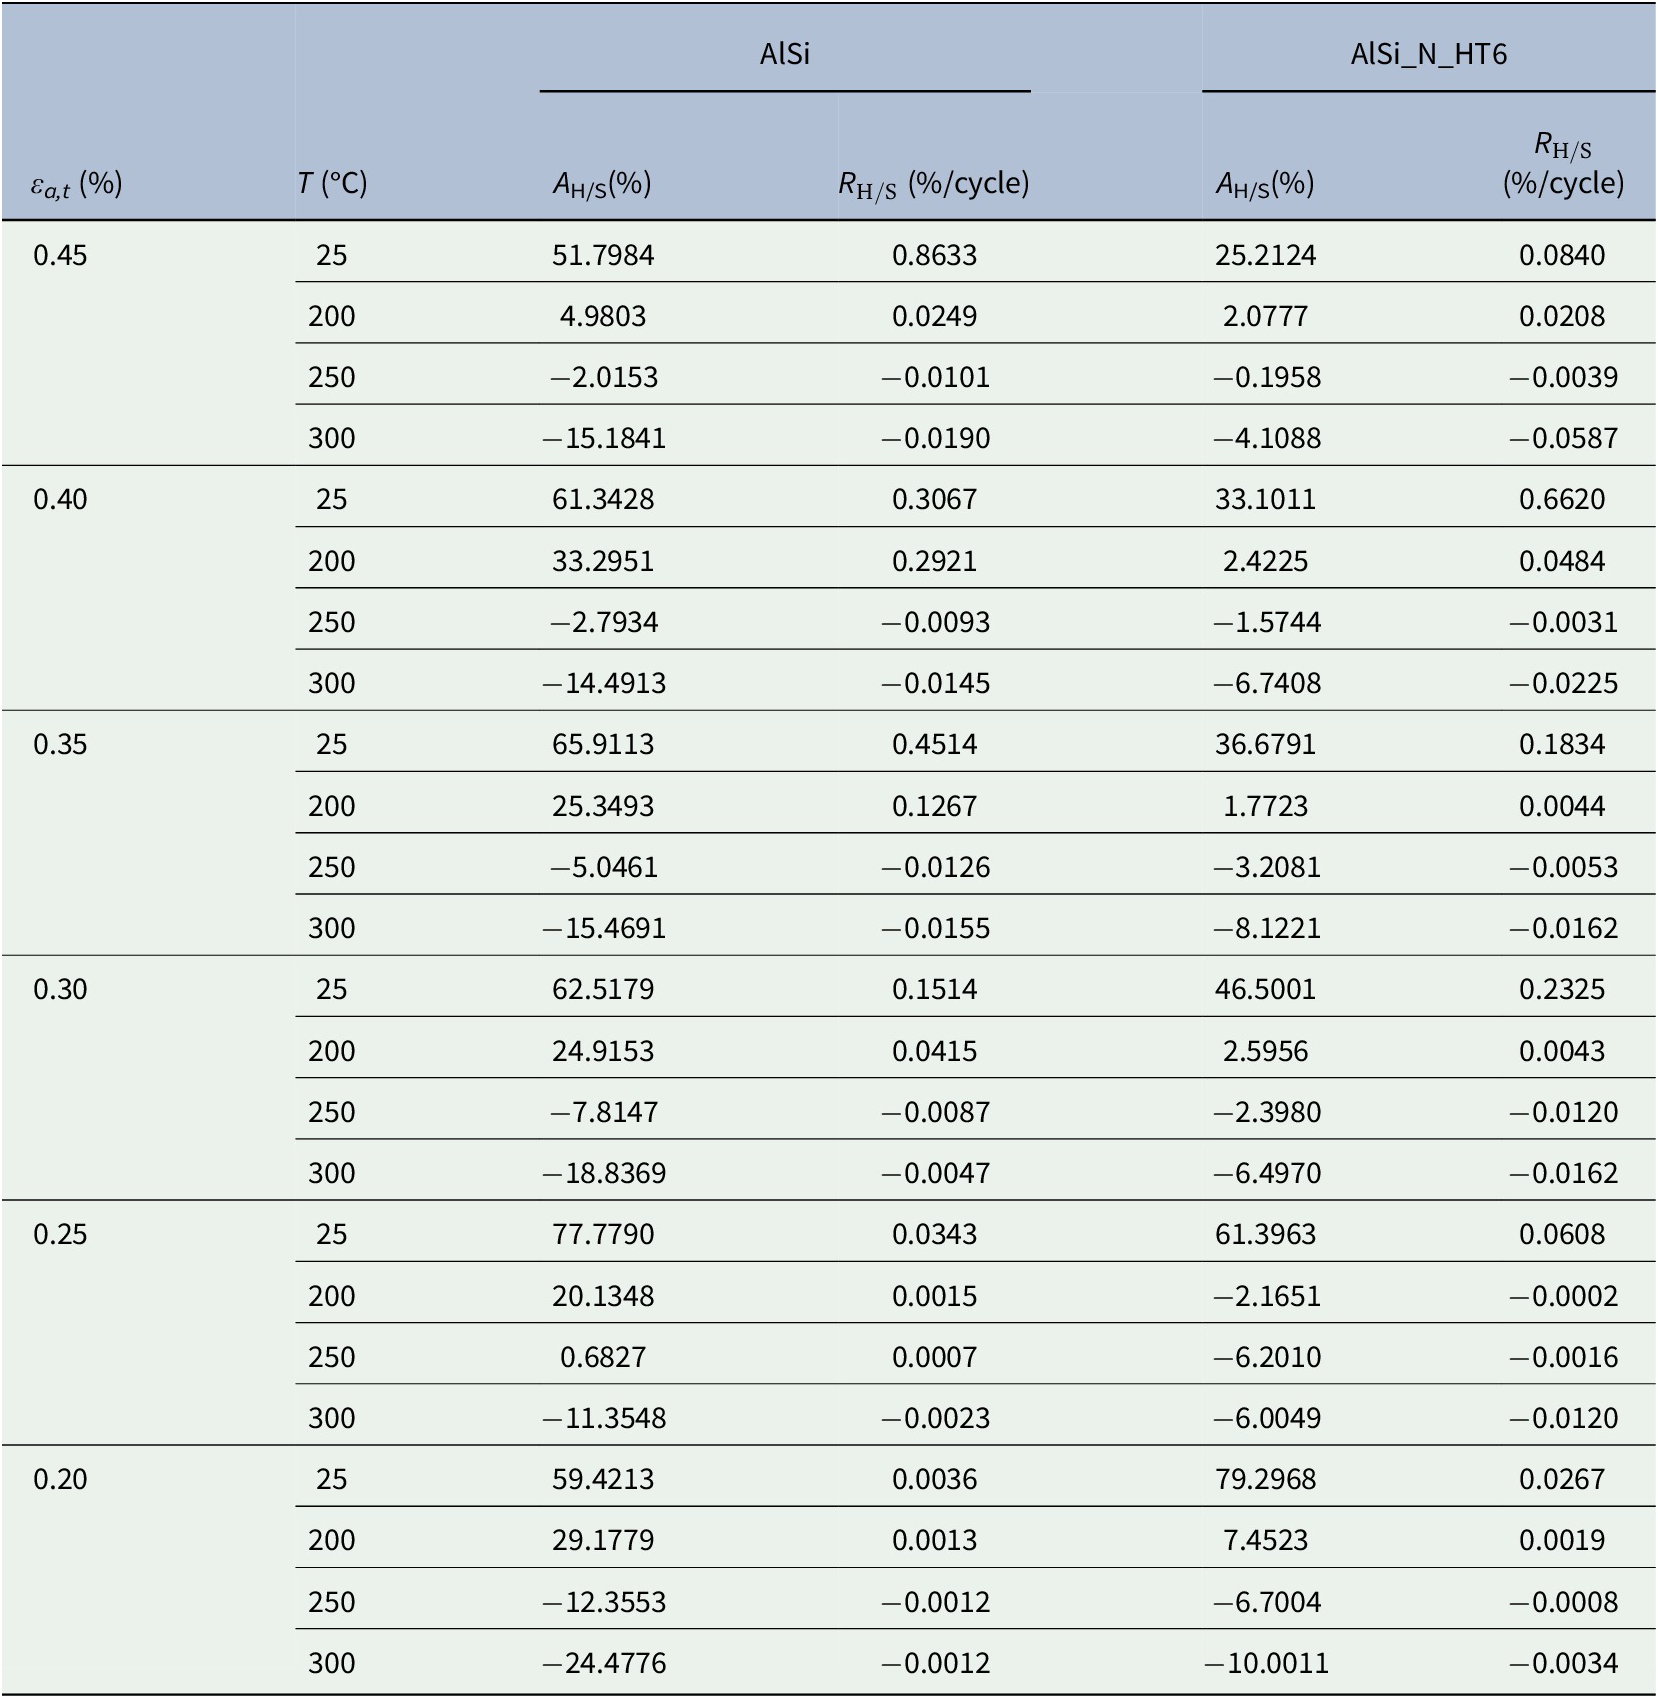
The amount and the rate of cyclic hardening/softening for AlSi_N_HT6 and AlSi at various values of strain amplitudes and different temperatures are represented in Tables 4 and 5. Finally, the next step in this project is to model the cyclic behavior of the studied materials. Such this research was done by Felfeli et al. (Reference Felfeli, Azadi and Farrahi2015). They used four plasticity approaches to simulate stress–strain behaviors of aluminum alloys, at various strain rates (Felfeli et al., Reference Felfeli, Azadi and Farrahi2015).
The amount and the rate of the cyclic hardening/softening behaviors, separately at various temperatures
The amount and the rate of the cyclic hardening/softening behaviors, separately at various values of the total strain amplitude
5. Discussion
As seen, the stress increase during cycles occurred at room temperature, known as the cyclic hardening behavior for both AlSi_N_HT6 and AlSi. Moreover, the AlSi sample exhibited the cyclic hardening trend at 200°C. However, at this temperature, cyclic softening was seen in AlSi_N_HT6. As reported in the literature (Fan et al., Reference Fan, Liu, He and Chen2015), the cyclic hardening amount was lower at lower values of the strain amplitudes. For AlSi_N_HT6, this cyclic hardening was due to the effect of the stress transfer between the soft matrix and brittle particles (Luk et al., Reference Luk, Mirza, Chen, Ni, Xiao and Ma2015). When the temperature changed to 250°C and 300°C, the stress decreased during cycles. In other words, at high temperatures, the cyclic softening trend was seen for both AlSi_N_HT6 and AlSi. For the base material, agreed results by Guo et al. (Reference Guo, Zhang, Li and Wang2017) were represented. The cyclic softening behavior in the material was affected by the temperature and also the strain amplitude (Liu et al., Reference Liu, Zhang, Zuo, Xiong, Ren and Volinsky2013).
As another comparison, AlSi_N_HT6 had higher plastic strains than that of the AlSi sample, which is due to the heat-treating process (Azadi & Shirazabad, Reference Azadi, Bahmanabadi, Gruen and Winter2013). As another reason, the plasticity of the base metal was increased by the reinforcing phase. As reported by Luk et al. (Reference Luk, Mirza, Chen, Ni, Xiao and Ma2015), the reason for the AlSi_N_HT6 cyclic hardening trend could be the stress transfer, which would be occurred between the soft aluminum matrix and brittle nano-particles.
6. Conclusions
Highlighted experimental results in this research are as follows:
-
• The temperature had more effects than that of the total strain amplitude on cyclic behaviors.
-
• As the strain amplitude decreased, the rate of cyclic hardening/softening also decreased.
-
• The amount of the cyclic hardening trend at 25°C was higher than that of its trend at 200°C.
-
• Increasing the temperature led to a decrease in the amount of cyclic hardening. In other words, increasing the temperature caused to increase in the amount of cyclic softening
-
• The rate of cyclic hardening decreased and the rate of cyclic softening increased by an increase in the temperature.
For further investigations, describing precipitates in the material microstructure will be studied under various strains and temperatures of fatigue testing. Moreover, material science should be generally considered for describing the differences in LCF lifetimes between two different materials. By presenting such a description, the reinforcing role of nano-particles could be found in the base material. This job will be presented by authors in the other researches, besides this data-in-brief article.
Acknowledgments
This research is financed by the Austrian Agency for International Cooperation in Education and Research (OeAD) and the Ministry of Science, Research and Technology of Iran, and also Kharazmi University in Iran, through the IMPULSE funding program. In addition, authors tend to thank the Motorsazi Pooya Neyestanak (MPN) Company, in Iran for casting and raw materials.
Supplementary Materials
To view supplementary material for this article, please visit http://doi.org/10.1017/exp.2021.32.
Data availability statement
The data that support the findings of this article are available based on the request from the corresponding author. In general, the data are not publicly available due to the privacy of research participants.
Conflict of interest
For this research, there is no conflict of interest for all authors.
Authorship contributions
Conceptualization, M.A., G.W.; Data curation, H.B., B.S.; Formal analysis, H.B.; Funding acquisition, M.A., F.G.; Investigation, M.A., H.B.; Methodology, M.A., G.W.; Project administration, M.A., F.G.; Resources, M.A., F.G.; Software, H.B., G.W., B.S.; Supervision, M.A., F.G.; Validation, M.A, G.W.; Visualization, M.A., F.G.; Writing–original draft, H.B.; Writing–review & editing, M.A., B.S.


 Open access
Comments
Comments to the Author: This experimental study offers very useful results for the characterisation of the cyclic behaviour of the subject matter alloys. It can enrich the published literature in this area. The research has been conducted correctly but English requires drastic improvement, specifically in relation to syntax, grammar and accurate use of language in many instances - i.e. ‘enhancement of temperature’ should be ‘increase of temperature’, ‘effect of temperature was higher…’, ‘Researches about cyclic behaviors’ should be ‘research studies on …’, etc etc. The poor use of English affects greatly the readability of this paper. Also, the authors are requested to clarify/amend the following issues:
• The methodology section should be expanded to include further details on the test configuration, material, etc. It is currently very briefly, lacking important information.
• Figure 3 and 4 should be broken down to separate figures, showing clearly the different features and avoid using the strain level ‘boxed’ indicators.
• Figure 6, 7, 8, 9, 10, 11, 12, 13, 14, 15, 16 and 17: Using circles for the data points makes visualisation difficult. Please use dots or dashes instead.
• Table 3 results: Can the authors please comment (add further details in the paper) on the increasing Average Error% with the increase of temperature? For example, is there an influence of the Ramberg-Osgood parameters’ choice?
• Table 4 and 5: Is four decimal points’ accuracy necessary? If yes please justify, if not please reduce to two decimals.
• The results are very lightly discussed in many instances, despite the extensive array of data presented in the paper. The authors should expand the discussion throughout. That includes expanding the discussion on limitations.
• Many of the bullet points in the Conclusions section are unclear - i.e. ‘Under the same strain amplitude, the amount of cyclic hardening decreased by temperature increasing.’ which is the same strain amplitude in this case?). The authors are requested to rewrite this section.