





The Dietary Guidelines for the Brazilian Population (DGBP), published in 2014 by the Ministry of Health, provide recommendations for a healthy and sustainable diet for the Brazilian population. They serve as a tool to support health education and communication initiatives and to guide public health policies on food and nutrition. They introduced important conceptual innovations by pioneering the use of the Nova classification system as the basis for their recommendations and by adopting a qualitative approach, without guidelines regarding portion sizes and recommended energy or nutrient intake values(1). The Nova classification system groups foods into four categories according to industrial processing: natural or minimally processed foods, processed culinary ingredients, processed foods and ultra-processed foods (UPF)(Reference Louzada, Canella and Jaime2,Reference Monteiro, Cannon and Levy3) .
The DGBP’s main recommendations are to base the diet on a variety of natural or minimally processed foods, predominantly plant-based foods and part of the traditional Brazilian dietary pattern and to avoid the consumption of UPF(1). These recommendations are strongly supported by evidence of the impact of industrial food processing on health, the environment and local food culture(Reference Louzada, Canella and Jaime2,Reference Lane, Gamage and Du4,Reference Monteiro, Louzada and Steele-Martinez5) .
For epidemiological surveillance, research, and assessment of public policy impact, it is crucial to evaluate the extent to which population diets align with dietary recommendations. To this end, indices have been developed to measure adherence to national dietary guidelines using diet-quality indicators(Reference Kennedy, Ohls and Carlson6–Reference Hendrie, Baird and Golley15).
There is increasing recognition of the energy contribution of UPF as an important diet-quality indicator(Reference Lane, Gamage and Du4,Reference Monteiro, Louzada and Steele-Martinez5,Reference Louzada, Cruz and Silva16,Reference Vandevijvere, Monteiro and Krebs-Smith17) . In Brazil, the share of UPF in the diet has been used to monitor changes in the population’s eating patterns and to assess the impact of these changes on the population’s health conditions(Reference Louzada, Cruz and Silva16,Reference Levy, Andrade and Cruz18) . However, there is no indicator that measures adherence to the entire set of DGBP dietary recommendations. Therefore, this study aims to describe the development and evaluation of the Brazilian Dietary Guidelines Adherence Score (BraScore), a novel index that assesses adherence to the DGBP.
Methods
This section is divided into two parts: the first describes the development of the BraScore; the second details the procedures for assessing validity and reliability (in terms of internal consistency).
Development of the BraScore
The BraScore was developed in four stages: (1) defining guiding principles; (2) defining food components; (3) defining minimum and maximum quantities and cut-off points and (4) content validation.
Defining guiding principles
The BraScore was developed by a team from the Centre for Epidemiological Research in Nutrition and Health at the University of São Paulo (NUPENS/USP), including researchers who also contributed to the development of the DGBP. During the development of the BraScore, additional external researchers, experts in instrument development and food consumption, were also consulted. The BraScore was inspired by the methods used to develop existing indexes, particularly the Healthy Eating Index (HEI)-2015 and the Healthy Eating Food Index (HEFI)-2019(Reference Reedy, Lerman and Krebs-Smith10,Reference Brassard, Elvidge Munene and St-Pierre11,Reference Brassard, Elvidge Munene and St-Pierre19) .
The BraScore is based on the DGBP recommendations, which were developed from evidence on the impacts of food on health and environmental sustainability, and also consider healthy food practices already incorporated into Brazilian culture(1).
The BraScore aims to provide a score that measures adherence to the DGBP dietary recommendations. The higher the score, the better the adherence and, consequently, the diet quality. The index can be applied to food consumption data collected from 24-h dietary recalls (24HR), food records or quantitative FFQ.
Defining the food components
The first stage of development aimed to identify the food items that should be included in the BraScore. To this end, we first conducted a systematic reading of Chapters 2 and 3 of the DGBP to identify recommendations on the consumption of food groups.
Chapter 2 of the DGBP provides recommendations regarding food choices based on the Nova classification system, which divides all foods into four groups. The first group, comprising natural or minimally processed foods (such as rice, beans, tubers, roots, fruits, vegetables and fresh meat), should be the basis of the diet, emphasising plant-based foods. The second group, which includes processed culinary ingredients (such as sugar, salt and oil), should be used in small quantities, particularly to prepare and season natural or minimally processed foods. The third group, processed foods (such as fresh bread, processed cheeses, fruit preserves and canned vegetables), can be part of a healthy dietary pattern, as long as they are consumed in moderation. Finally, the fourth group, UPF (such as ready-to-eat meals, soft drinks, packaged snacks and margarine), should be avoided. Definitions and examples of each of the four groups can be found in Appendix 1 (1,Reference Martinez-Steele, Khandpur and Batis20) .
Chapter 3 presents recommendations on how to combine foods into meals. Examples of healthy meals (breakfast, lunch, dinner and snacks) are provided, which reflect healthy eating habits practised by a part of the Brazilian population. Furthermore, the chapter addresses recommendations for subgroups of natural or minimally processed foods. The DGBP recommend, for example, limiting meat consumption, especially red meat, and values the consumption of beans, which are present in one of the most traditional dishes in Brazil, as well as a diversity of fruits and vegetables(1).
Following the systematic reading of these chapters, we listed all recommendations, regardless of whether they referred to foods that should be consumed, limited or avoided. The list of foods covered in these recommendations was then discussed with the team, who evaluated their relevance for inclusion as components of the index to assess adherence to the DGBP.
The BraScore is an index designed to assess adherence to the Dietary Guidelines for the Brazilian Population. The recommendations of the Guidelines are structured around food groups rather than specific nutrients (such as added sugar or sodium). For this reason, all components of the BraScore are food-based, rather than nutrient-based.
Defining the minimum and maximum quantities and cut-off points
In the second stage, quantitative criteria for evaluating the components were established. At this stage, we faced the challenge of translating qualitative recommendations, expressed in terms such as ‘prefer’, ‘limit’ and ‘avoid’, into measurable criteria. To address this, criteria were established based on recommendations from the scientific literature and analyses of usual dietary intake from the most recent representative nutrition survey, the individual food consumption module of the 2017–2018 Household Budget Survey (Pesquisa de Orçamentos Familiares – POF)(21).
First, a literature scan was carried out to identify cut-off points for the index components. The search of the scientific literature involved articles in indexed journals, official documents from government organisations, other dietary guidelines, guidelines from the World Health Organization (WHO), the Food and Agriculture Organization of the United Nations (FAO) and the EAT-Lancet Commission, in addition to the review of other validated indices that aim to assess the diet quality of different populations.
In situations where there was no quantitative recommendation in the literature (e.g. for the processed and UPF components) or where the recommendations were not aligned with the DGBP (e.g. for beans, whose international recommendations are considered very low compared with Brazilian dietary patterns), data from analyses of food consumption in the 2017–2018 POF were used(21).
In brief, the 2017–2018 POF used a complex, two-stage sampling design, with census tracts at the first stage and households at the second. Food consumption data were collected using 24HRs administered on two non-consecutive days to individuals aged ≥ 10 years by trained interviewers, employing the automated multiple-pass method. Information was collected on all foods consumed the day before the interview, along with quantities in household measures, the type and method of preparation, as well as foods commonly added to preparations, such as sugar and olive oil(21).
The culinary preparations reported in the 2017–2018 POF were disaggregated into their underlying ingredients, using standardised recipes from the Brazilian Food Composition Table (Tabela Brasileira de Composição de Alimentos - TBCA) of the University of São Paulo, Food Research Centre, version 7.0 (available at: https://www.fcf.usp.br/tbca). Subsequently, the quantities consumed were converted into energy, using information from the aforementioned table.
The food and beverages consumed were classified according to industrial food processing, in accordance with Nova classification system and the respective subgroups of interest(Reference Monteiro, Cannon and Levy3,Reference Martinez-Steele, Khandpur and Batis20,Reference Cruz, Andrade and Rauber22) .
Analyses of food consumption data from the 2017–2018 POF were conducted to identify percentile distributions the minimum and maximum quantities consumed by individuals who were the highest and lowest consumers of each food component (depending on the direction of the recommendation: encouragement or discouragement of consumption). For these analyses, we applied the National Cancer Institute (NCI) method to estimate the usual food intake. The NCI method corrects for intra-individual variability present in data derived from 24HR, accounting for the complex survey design in representative samples. This method separately models the probability of consumption and the amount consumed on consumption days, allowing estimation of the usual intake distribution. Further details on the NCI method can be found elsewhere(Reference Dodd, Guenther and Freedman23–Reference Tooze, Kipnis and Buckman25).
Finally, the scoring system was defined to assign greater weight to the components aligned with the two main recommendation of the DGBP: to prefer natural or minimally processed foods and to avoid UPF(1). These two dimensions are central to the Guidelines and supported by the strongest evidence for both human and planetary health(Reference Monteiro, Louzada and Steele-Martinez5,Reference Rockstrom, Thilsted and Willett26) . The ‘to be limited’ components reflect qualifying recommendations – foods that can be present in the diet but in smaller amounts – and therefore received less weight in the overall score(1). The definition of the scores also considered the index’s ability to differentiate individuals with varying levels of adherence. Several scenarios of the BraScore composition and distribution of scores were simulated to support the final decision on the scoring system.
Content validity
An expert panel was convened to assess whether the BraScore was adequately constructed in accordance with the DGBP dietary recommendations. Fourteen experts from across Brazil, with expertise in food consumption and the DGBP, were invited to the panel. The experts were invited by email and, after accepting, completed a questionnaire on the Google Forms platform. The experts analysed the BraScore with regard to the relevance of the components to assess adherence to the DGBP, the range of scores, the cut-off points for minimum and maximum scores and the applicability of the index.
Changes were made to the index based on the responses, and the instrument underwent a new evaluation by the team. One change made following expert suggestions was the removal of the whole grains and nuts and seeds components from the index, given the very low consumption of these food groups in the Brazilian population (with most individuals reporting zero intake). Conversely, the diversity component was included, which contemplates those food groups. Detailed results of the expert panel stage can be found in Appendix 2.
Construct validity
The procedures for this stage of BraScore validation were inspired by the methodology described by Reedy and colleagues for the HEI-2015(Reference Reedy, Lerman and Krebs-Smith10). Construct validity was assessed in five stages using data from two 24HRs collected in the 2017–2018 POF among individuals aged ≥ 10 years. The objective of this phase was to verify how well the BraScore evaluates the theoretical concept or construct: adherence to the DGBP recommendations.
To estimate the usual intake of dietary components, we applied a multivariate approach based on Markov Chain Monte Carlo methods, developed as an extension of the NCI method. This technique uses a multipart nonlinear mixed model with correlated random effects, allowing the simultaneous estimation of the usual intake distribution of multiple food groups. The model accounts for the episodic consumption of certain components, within-person variability, relevant covariates (such as sex, age, income and day of the week), nuisance effects (e.g. interview sequence), skewness and random measurement error. This approach was originally proposed by Zhang et al. (2011) for applications such as the computation of the HEI(Reference Reedy, Lerman and Krebs-Smith10,Reference Zhang, Midthune and Guenther27) .
For the application of the technique, the food groups that compose the index were decomposed into sixteen variables. The diversity component was derived from seven variables representing the intake of seven food groups (in total grams), and an additional nine variables represented each of the remaining BraScore components. Four variables were classified as daily-consumed: vegetables (% of total energy intake), cooking salt (g/2000 kcal of energy intake derived from natural or minimally processed foods and processed culinary ingredients), whole grains (g) and other vegetables (g). While twelve were considered episodically consumed, as more than 10 % of the 24HR reported zero intake. The episodically consumed variables included: legumes (% of total energy intake), fruits (% of total energy intake), red meat (% of total energy intake), other animal-based foods (% of total energy intake), processed foods (% of total energy intake), table sugar (% of energy intake derived from natural or minimally processed foods and processed culinary ingredients), UPF (% of total energy intake), nuts and seeds (g), dark green leafy vegetables (g), fruits, vegetables and vegetables rich in vitamin A (g), other fruits (g) and other vegetables (g).
The following analyses, conducted to evaluate the construct validity of the index, are described below.
-
Is the BraScore independent of the total energy intake?
The BraScore score is not expected to be strongly correlated with total energy intake. To verify whether the index assesses adherence to DGBP patterns, regardless of energy intake(Reference Reedy, Lerman and Krebs-Smith10), Pearson’s linear correlation analysis was performed. The correlation of each component individually, and the total BraScore, with the total energy intake were evaluated.
-
Does the BraScore present more than one pattern of components combination capable of explaining the data variation?
Multiple combinations of the components are expected to explain the variability in the data. To verify whether a single combination of components can explain the variance in the data, principal component analysis was applied. In other words, if only a single combination were able to yield a high BraScore value, this would indicate that only a particular pattern would be suitable to achieve high adherence to the DGBP recommendations (which is not ideal). The number of patterns was identified by analysing eigenvalues > 1.
-
Does the BraScore vary sufficiently among individuals?
The index is expected to exhibit variability across the population, assigning different scores according to the degree of adherence to the DGBP recommendations. Means, percentiles and their respective se for the total BraScore and each component were described, along with the histogram analysis.
-
Is the BraScore able to distinguish adherence to the DGBP between population groups?
According to the literature, in the Brazilian population some groups are expected to have higher scores, such as older adults and residents of rural areas(Reference Louzada, Cruz and Silva16,Reference Levy, Andrade and Cruz18) . For this analysis, we applied the population ratio method(Reference Freedman, Guenther and Krebs-Smith28), following the methodology described by Brassard and colleagues (2022)(Reference Brassard, Elvidge Munene and St-Pierre19). This approach requires fewer computational resources than others and was suitable for comparing population categories. We evaluated differences by sex (male and female), life stage (adults and elderly) and area of residence (urban and rural). For this analysis, we included individuals aged ≥ 19 years.
-
Is the BraScore able to assign high scores to diets planned by nutritionists according to the DGBP recommendations?
Healthy diets, planned according to the DGBP recommendations, are expected to receive high scores in the BraScore. To assess this capability, three registered nutritionists were requested to create a complete one-day diet plan based on the DGBP. Subsequently, the BraScore was applied to those diet plans to assess their potential to generate high scores. The diets can be found in the Appendix 3.
Reliability (internal consistency)
The different components of an instrument are expected to produce cohesive results. Reliability was assessed using the greatest lower bound (GLB) coefficient, which estimates reliability based on the inter-item covariance matrix. It ranges from 0 to 1 and is preferable to Cronbach’s α when items contribute unequally to the total score(Reference Jackson29,Reference Trizano-Hermosilla and Alvarado30) . Additionally, correlations between components were analysed using Pearson’s linear correlation analysis.
All statistical analyses were conducted using SAS Enterprise Guide, version 8.6 and RStudio, version 9.2.
Results
Description of the BraScore
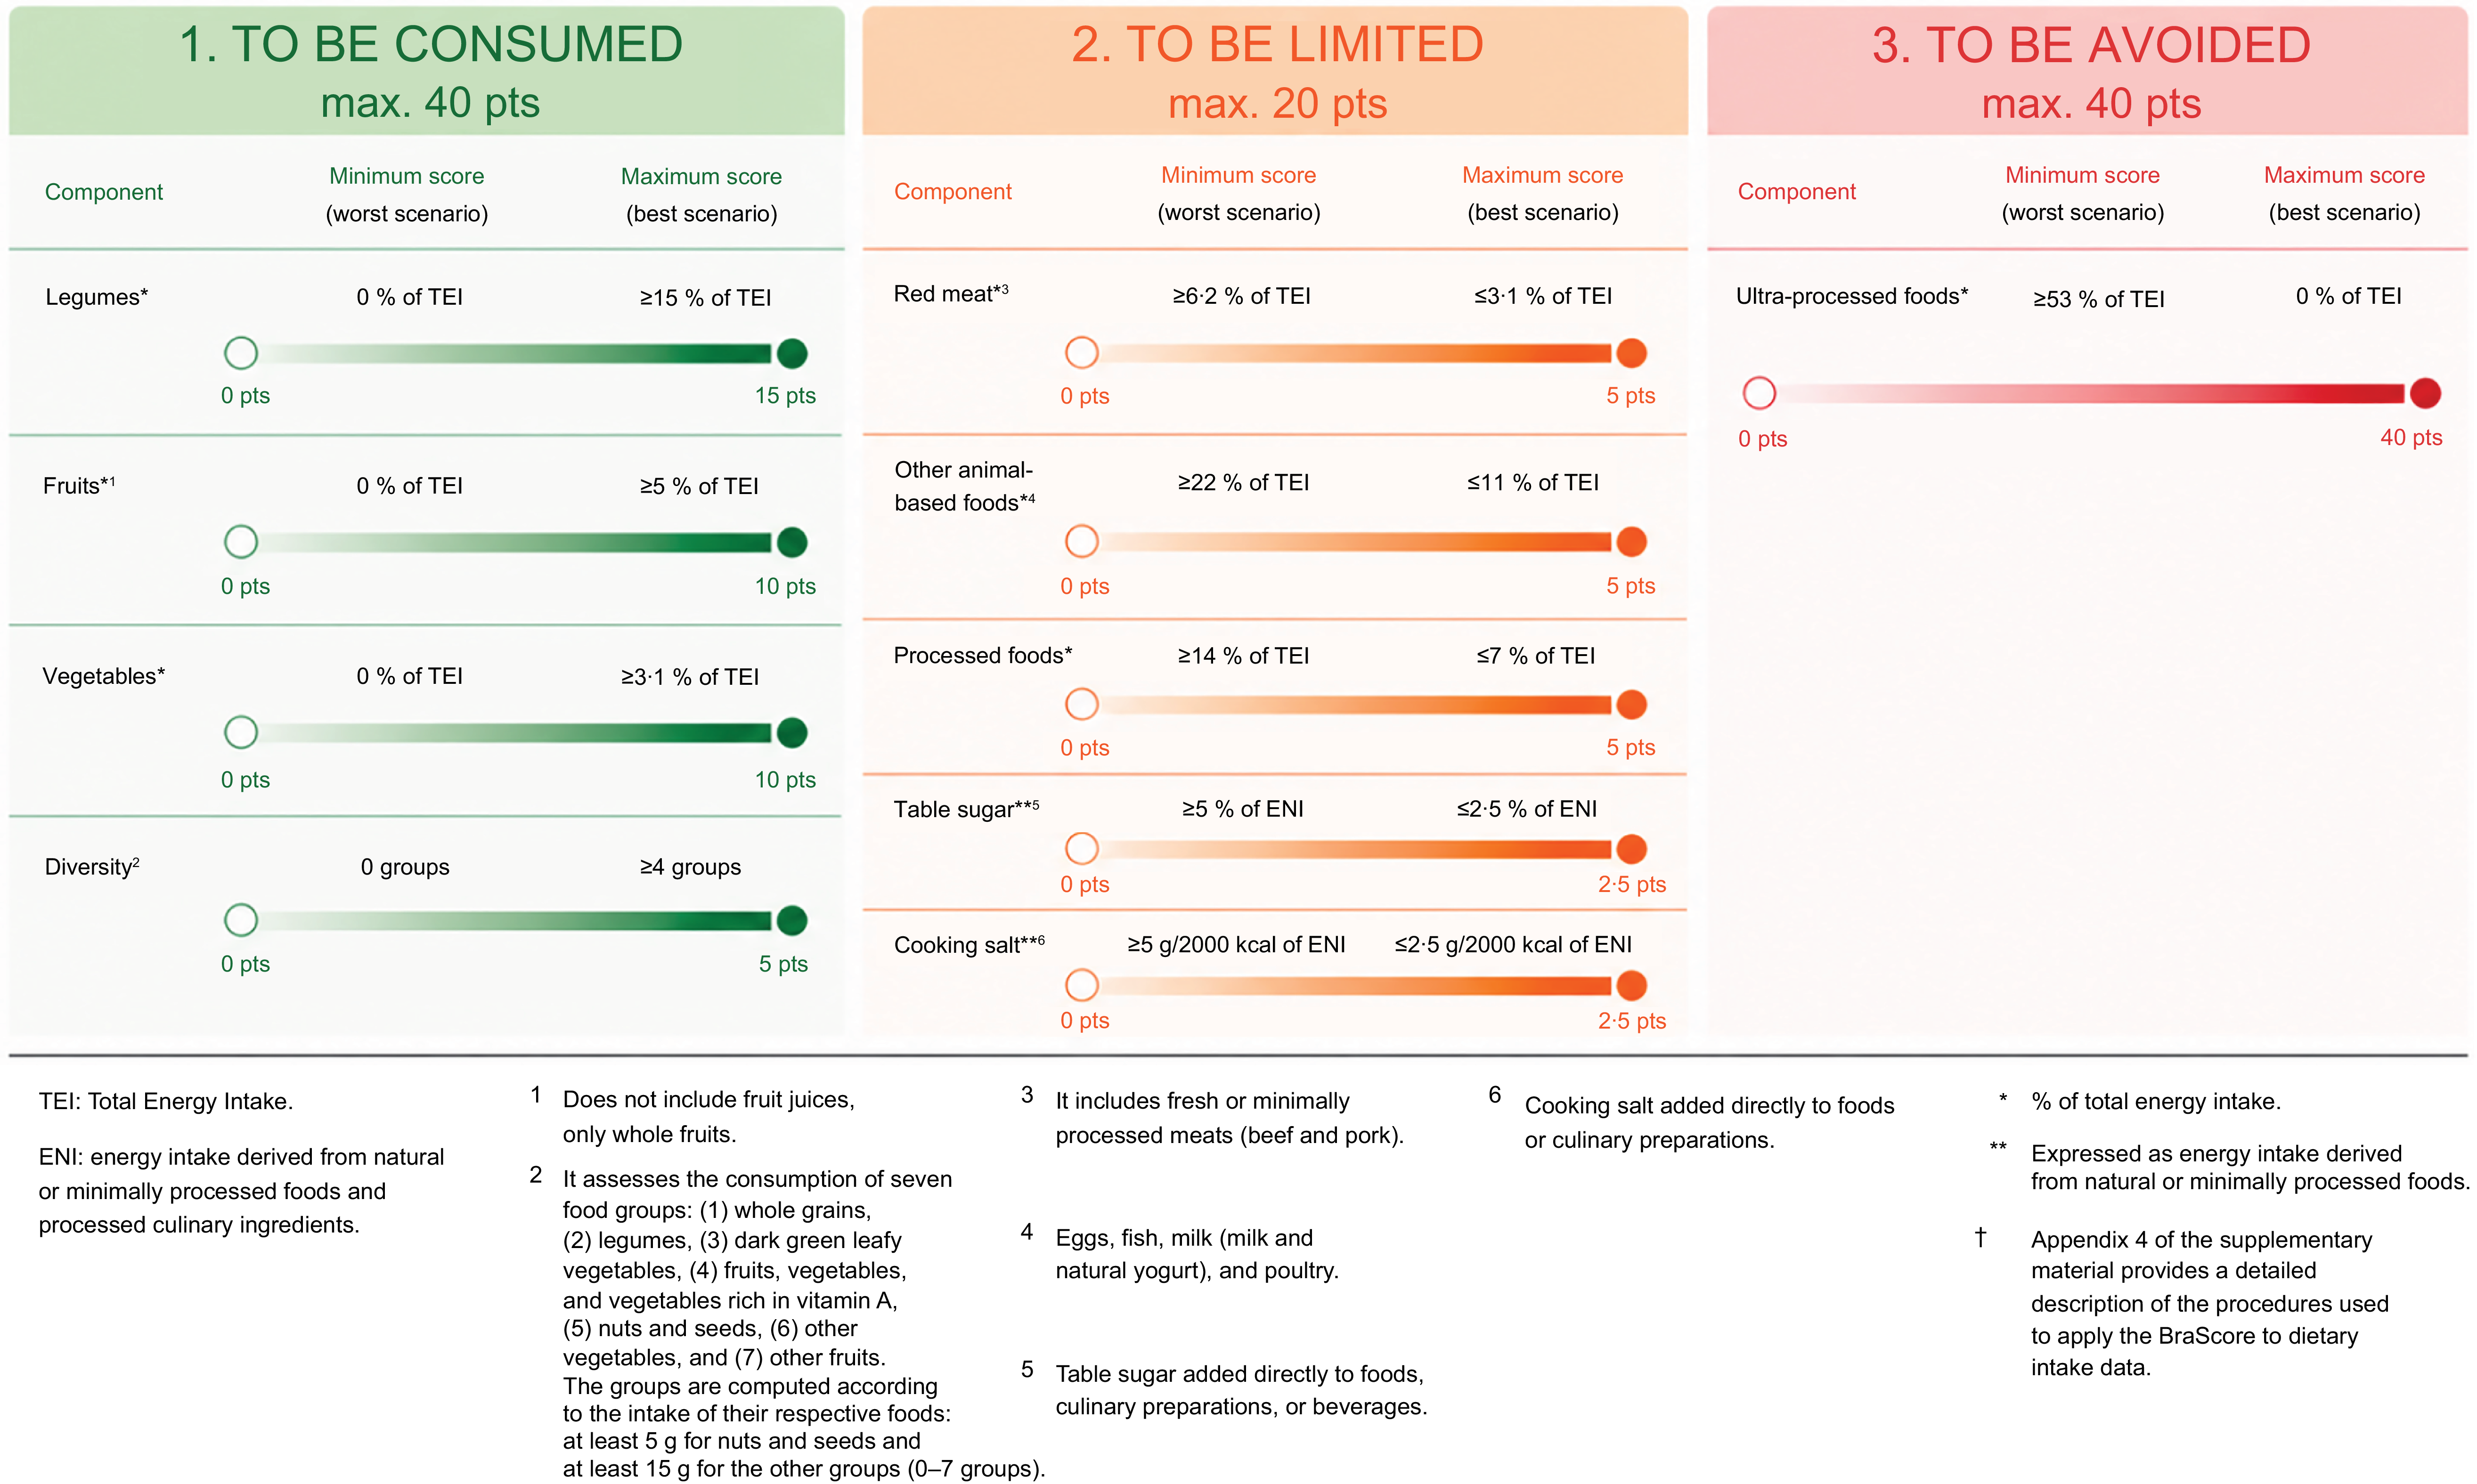
The final version of the BraScore has ten components divided into three dimensions: ‘to be consumed’: (1) legumes, (2) fruits, (3) vegetables, (4) diversity), ‘to be limited’: (5) red meat, (6) other animal-based foods, (7) processed foods, (8) table sugar, (9) cooking salt), and ‘to be avoided’: (10) UPF. The scores range from 0 to 100.
The consumption of the components is evaluated relative to total energy intake (the sum of all calories (in kcal) from all food items and beverages reported in the dietary assessment instrument, excluding alcoholic beverages). Most of the components are evaluated as percentage of total energy intake, except for the ‘diversity’ component, which is evaluated using a count of food groups ranging from 0 to 7. The ‘table sugar’ component is evaluated based on the percentage of energy intake derived from natural or minimally processed foods and processed culinary ingredients, and the ‘cooking salt’ component is evaluated based on grams per 2.000 kcal of energy intake from natural or minimally processed foods and processed culinary ingredients. The table sugar and cooking salt components assess the consumption of these items as processed culinary ingredients, as defined by the Nova classification system. Added sugar and sodium that are part of processed and UPF are not evaluated separately because they are intrinsically accounted for within those respective food group components. This approach avoids double counting and maintains consistency with the food-based framework of the DGBP.
For all components, intermediate consumption levels between the minimum and maximum criteria are scored proportionally to the amount consumed. The ‘to be consumed’ and ‘to be avoided’ dimensions have the same weight (40 points each). The ‘to be limited’ dimension scores up to 20 points.
Appendix 4 describes the step-by-step application of the BraScore to food consumption data. Below, we present a detailed description of each component. Then, in Figure 1, we present the criteria for minimum and maximum scores and the respective scores for each component.
Components of the BraScore and their criteria for minimum and maximum scores†. Brazil, 2024.

To be consumed (from the natural or minimally processed foods group)
-
Legumes (0–15 points)
This component evaluates the consumption of legumes (e.g. beans and lentils). The criterion for the maximum score is equivalent to the consumption value at the 75th percentile (15 % of total energy intake) among Brazilians who do not consume UPF. International recommendations, such as those from the EAT-Lancet, were considered low for the Brazilian context, considering that they are designed for populations whose legume consumption is much lower than that of Brazilians. Therefore, international recommendations were considered too low and unable to discriminate between high and low consumers, since a large part of the Brazilian population would easily reach the maximum value. The minimum score is assigned for zero intake.
-
Fruits (0–10 points)
This component assesses the consumption of whole fruits, fresh or dried (e.g. apples and bananas), excluding juices. The criterion for the maximum score is equivalent to the EAT-Lancet recommendation (5 % of total energy intake)(Reference Willett, Rockstrom and Loken31). The minimum score is assigned for zero intake.
-
Vegetables (0–10 points)
This component evaluates the consumption of vegetables (e.g. lettuce, pumpkin and onion). The criterion for the maximum score is equivalent to the EAT-Lancet recommendation (3·1 % of total energy intake)(Reference Willett, Rockstrom and Loken31). The minimum score is assigned for zero intake.
-
Diversity (0–5 points)
This component was adapted from the Minimum Dietary Diversity for Women (MDD-W) developed by FAO(32). The food groups that make up the diversity component belong to the group of natural or minimally processed foods: (1) whole grains; (2) legumes; (3) dark green vegetables; (4) fruits and vegetables rich in vitamin A; (5) nuts and seeds, (6) other vegetables and (7) other fruits. They are evaluated dichotomously. The nuts and seeds group is scored as consumed when at least 5 g of these foods are consumed. Similarly, each of the other six groups is scored as consumed when at least 15 g of the respective foods are consumed. As a result, the diversity component can range from 0 to 7 food groups.
For the diversity component, the maximum score is assigned when ≥ 4 groups are consumed, and the minimum are assigned when no group is consumed.
To be limited
-
Red meat (from the natural or minimally processed foods group) (0–5 points)
This component evaluates the consumption of red meat (beef and pork). The criterion for the maximum score for the red meat component is equivalent to the upper limit of the EAT-Lancet recommendation (28 g/d or 60 kcal/d, which means 3·1 % of total energy intake)(Reference Willett, Rockstrom and Loken31). For the minimum score, consumption equal to or greater than twice the EAT-Lancet recommendation for the maximum score was adopted.
-
Other animal-based foods (from the natural or minimally processed foods group) (0–5 points)
This component evaluates the combined consumption of eggs, fish, milk (full-fat, skimmed or semi-skimmed versions of milk and natural yoghurt) and poultry. The criterion for the maximum score is equivalent to the EAT-Lancet recommendation (i.e. the sum of the recommended intakes for the four subgroups that make up this component, totalling 11 % of total energy intake)(Reference Willett, Rockstrom and Loken31). The criterion for the minimum score is twice this value, not based on an external recommendation, but defined empirically to ensure an adequate scoring range reflecting the distribution of consumption in the Brazilian population.
-
Processed foods (0–5 points)
This component evaluates the consumption of processed foods (e.g. fresh bread, cheeses, fruits preserved in syrup, vegetables preserved in oil and canned fish). Considering that there are no specific recommendations for processed foods, the 75th percentile among individuals who do not consume UPF but consume processed foods was used as the reference for the minimum score, corresponding to 14 % of total energy intake. Half of this value was used as the criterion for the maximum score (7 % of total energy intake).
-
Table sugar (0–2·5 points)
This component evaluates the consumption of sugar used in handmade preparations, such as cakes, as well as sugar used to sweeten beverages like coffee, tea, and 100 % fruit juices. The scoring criteria for this component are based on the energy intake of table sugar in relation to the energy intake derived from natural or minimally processed foods and processed culinary ingredients (groups 1 and 2 of the Nova classification). The criterion for the score for the table sugar component was adapted from the EAT-Lancet recommendation for added sugar intake (120 kcal for a total energy intake of 2.500 kcal, corresponding 4·8 % of total energy intake)(Reference Willett, Rockstrom and Loken31) and the WHO’s maximum suggested intake of free sugar (5 % of total energy intake)(33). The value used for the maximum score criterion in our index is approximately half of the recommendation/suggestion of EAT-Lancet and WHO (2·5 % of energy intake derived from natural or minimally processed foods and processed culinary ingredients), considering that table sugar is a part, but not all, of added sugar or free sugar (which would also include sugar added by the food industry into products or the sugar naturally present in fruit juices). The criterion for the minimum score (5 % of energy intake derived from natural or minimally processed foods and processed culinary ingredients) is equivalent to twice the value established for the maximum score.
-
Cooking salt (0–2·5 points)
This component evaluates the consumption of salt used in culinary preparations (e.g. rice and salads). The scoring criteria for this component are based on the amount of cooking salt in relation to the energy intake derived from natural or minimally processed foods and processed culinary ingredients. The criterion for the maximum score for the cooking salt component was adapted from the WHO recommendation for sodium intake (5 g of salt or 2.000 mg of sodium per day)(34) and corresponds to half of this recommendation (2·5 g per 2.000 kcal of energy intake derived from natural or minimally processed foods and processed culinary ingredients), considering cooking salt is part, but not all, of the sodium in the diet. The criterion for the minimum score is equivalent to the WHO recommendation value (5 g per 2.000 kcal of energy intake derived from natural or minimally processed foods and processed culinary ingredients).
To be avoided
-
UPF (0–40 points)
Given that there is no recommendation for the consumption of UPF in the scientific literature, non-consumption was adopted as the criterion for maximum score. For the minimum score criterion, the 99th percentile of usual consumption (53 % of total energy intake) in the Brazilian population was used.
Construct validity
-
Is the BraScore independent of total energy intake?
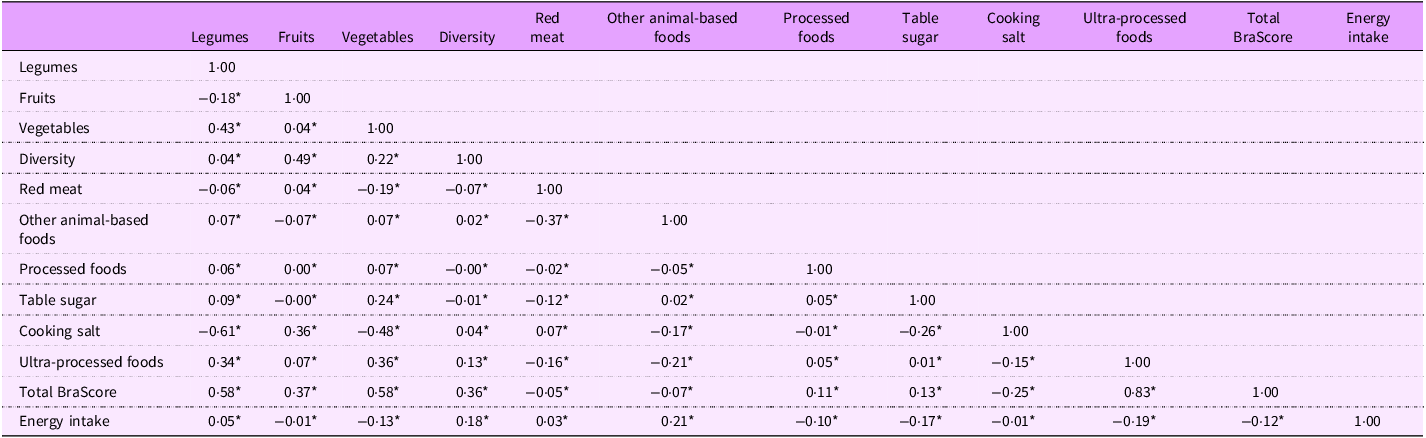
Table 1 presents the correlation analyses of the BraScore components with total energy intake. Weak correlations were found, ranging from –0·19 for UPF to 0·21 for other animal-based foods, while for the total score the coefficient was –0·12.
-
Does the BraScore present > 1 pattern of component combination capable of explaining the variation in the data?
Estimated correlations between the points of the BraScore and of its components with total energy intake (kcal). Brazil, 2017–2018

* P < 0·01.
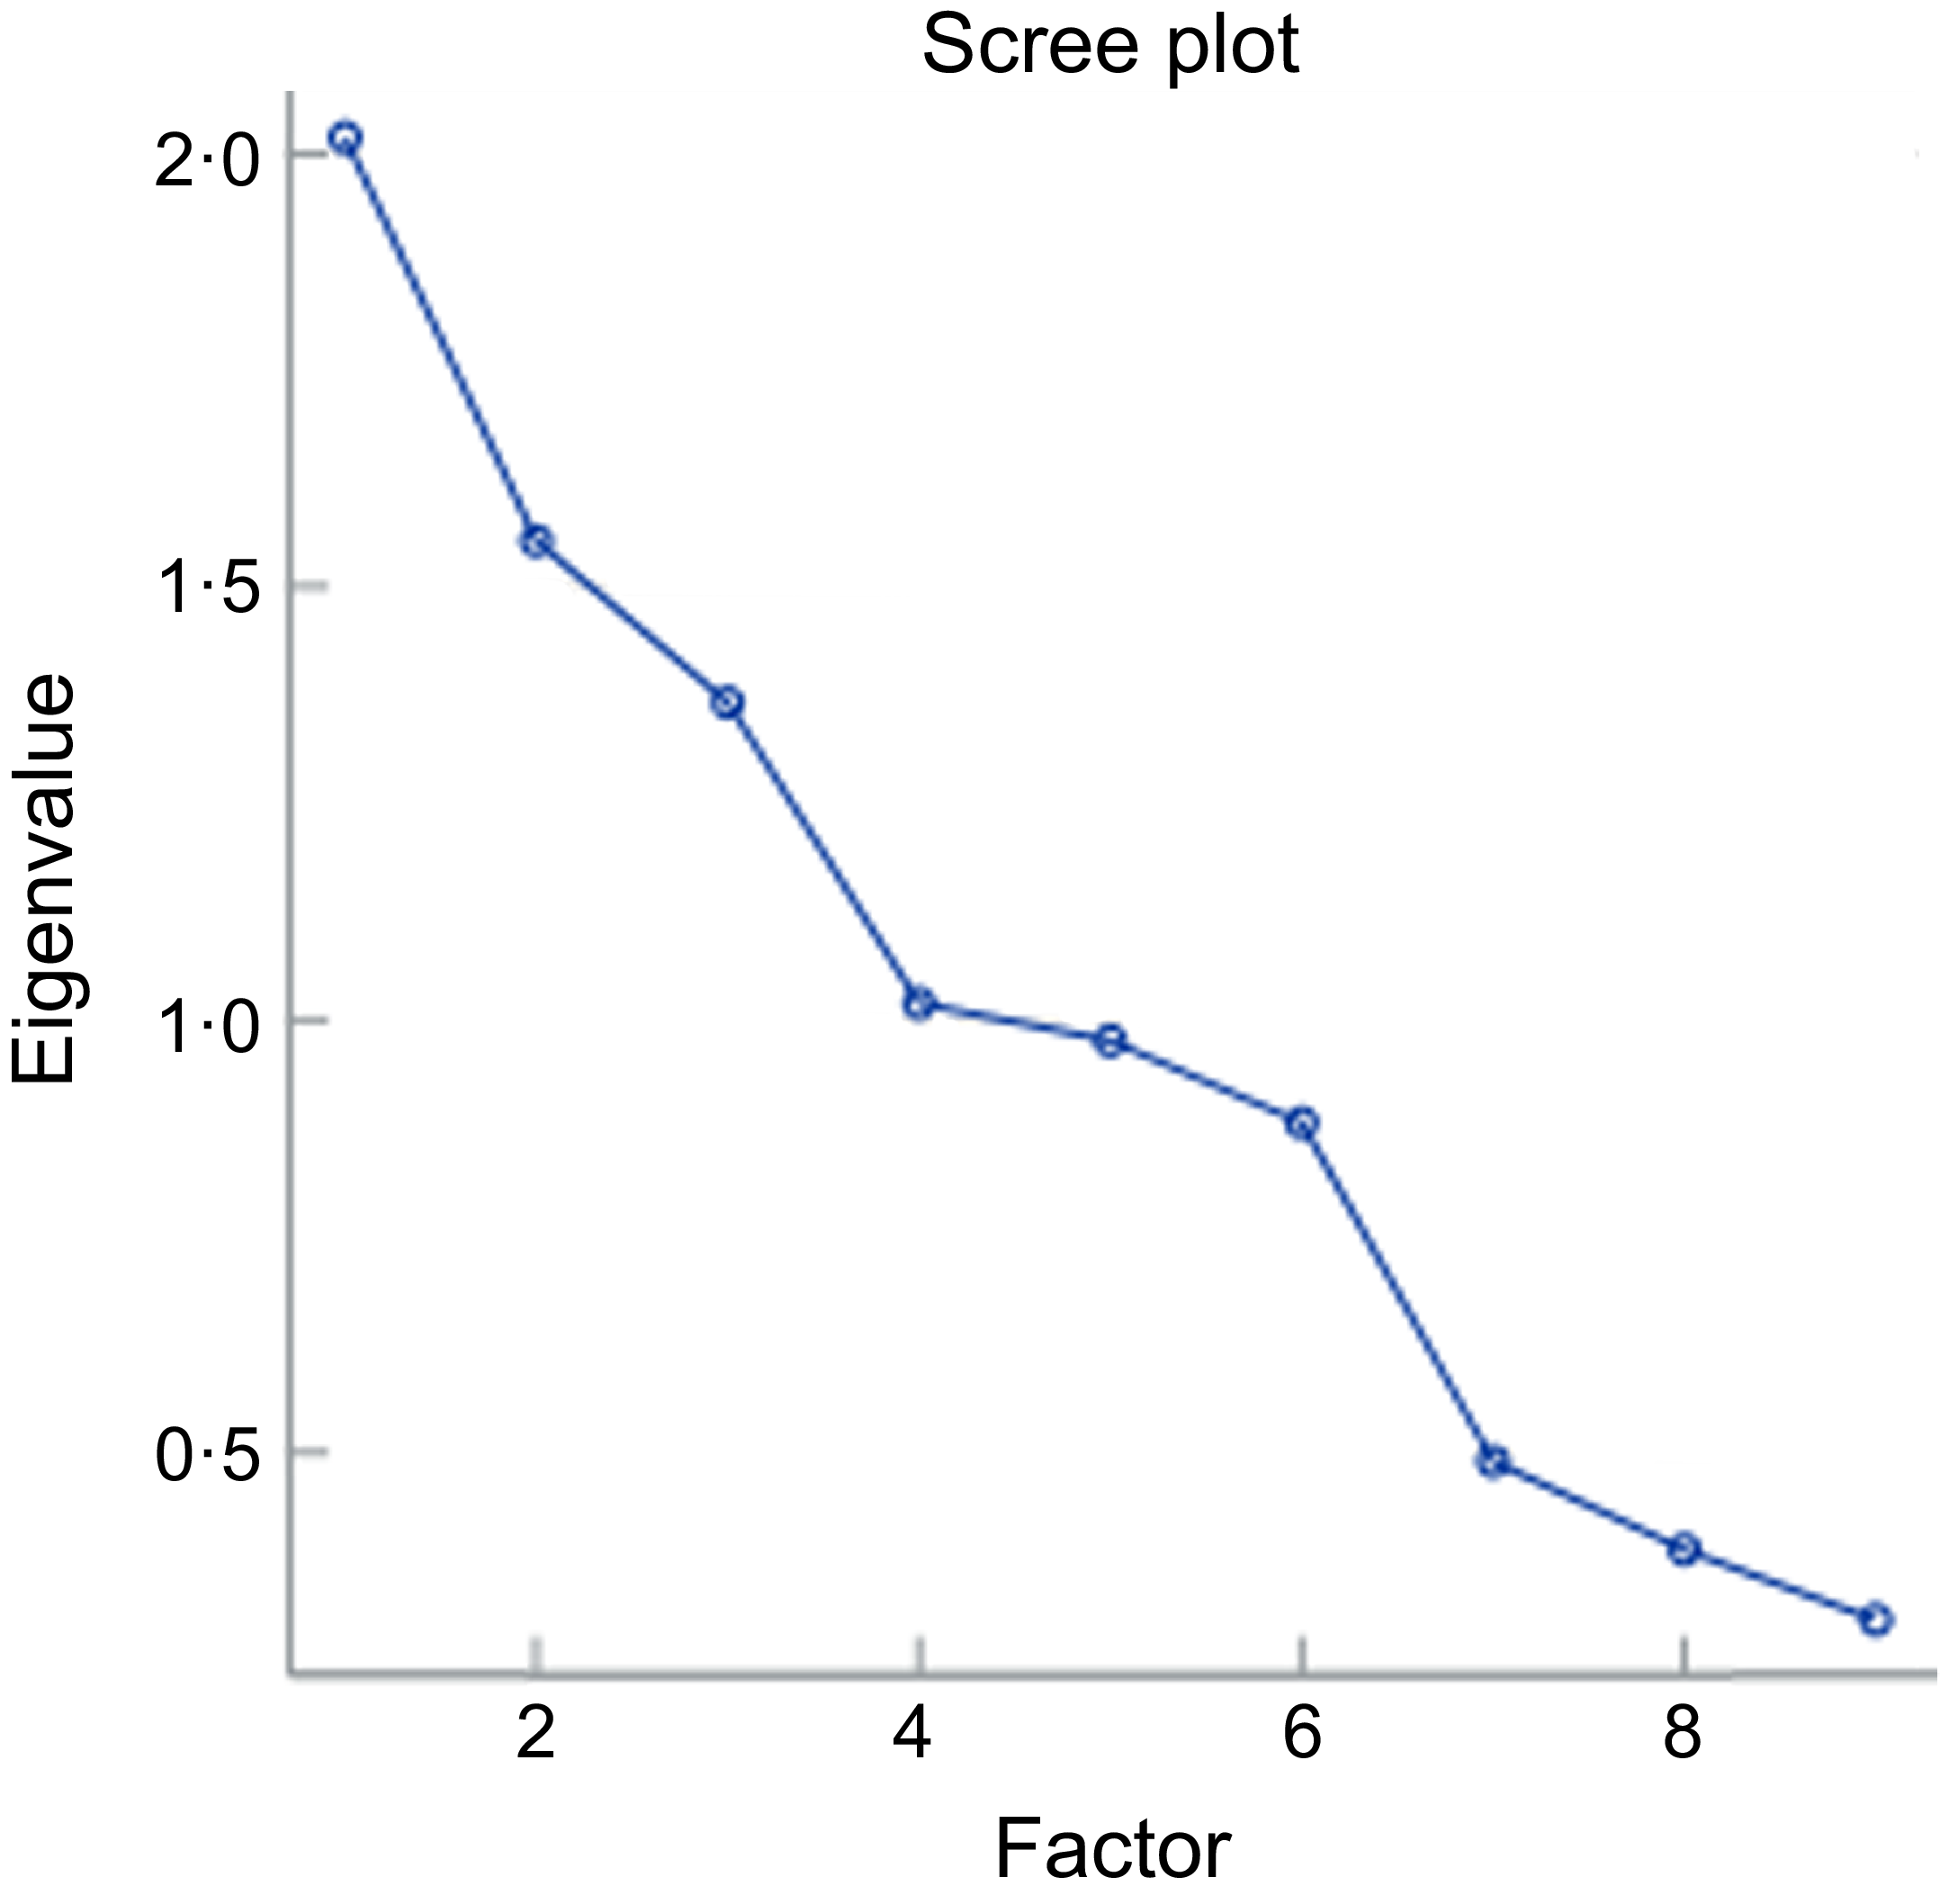
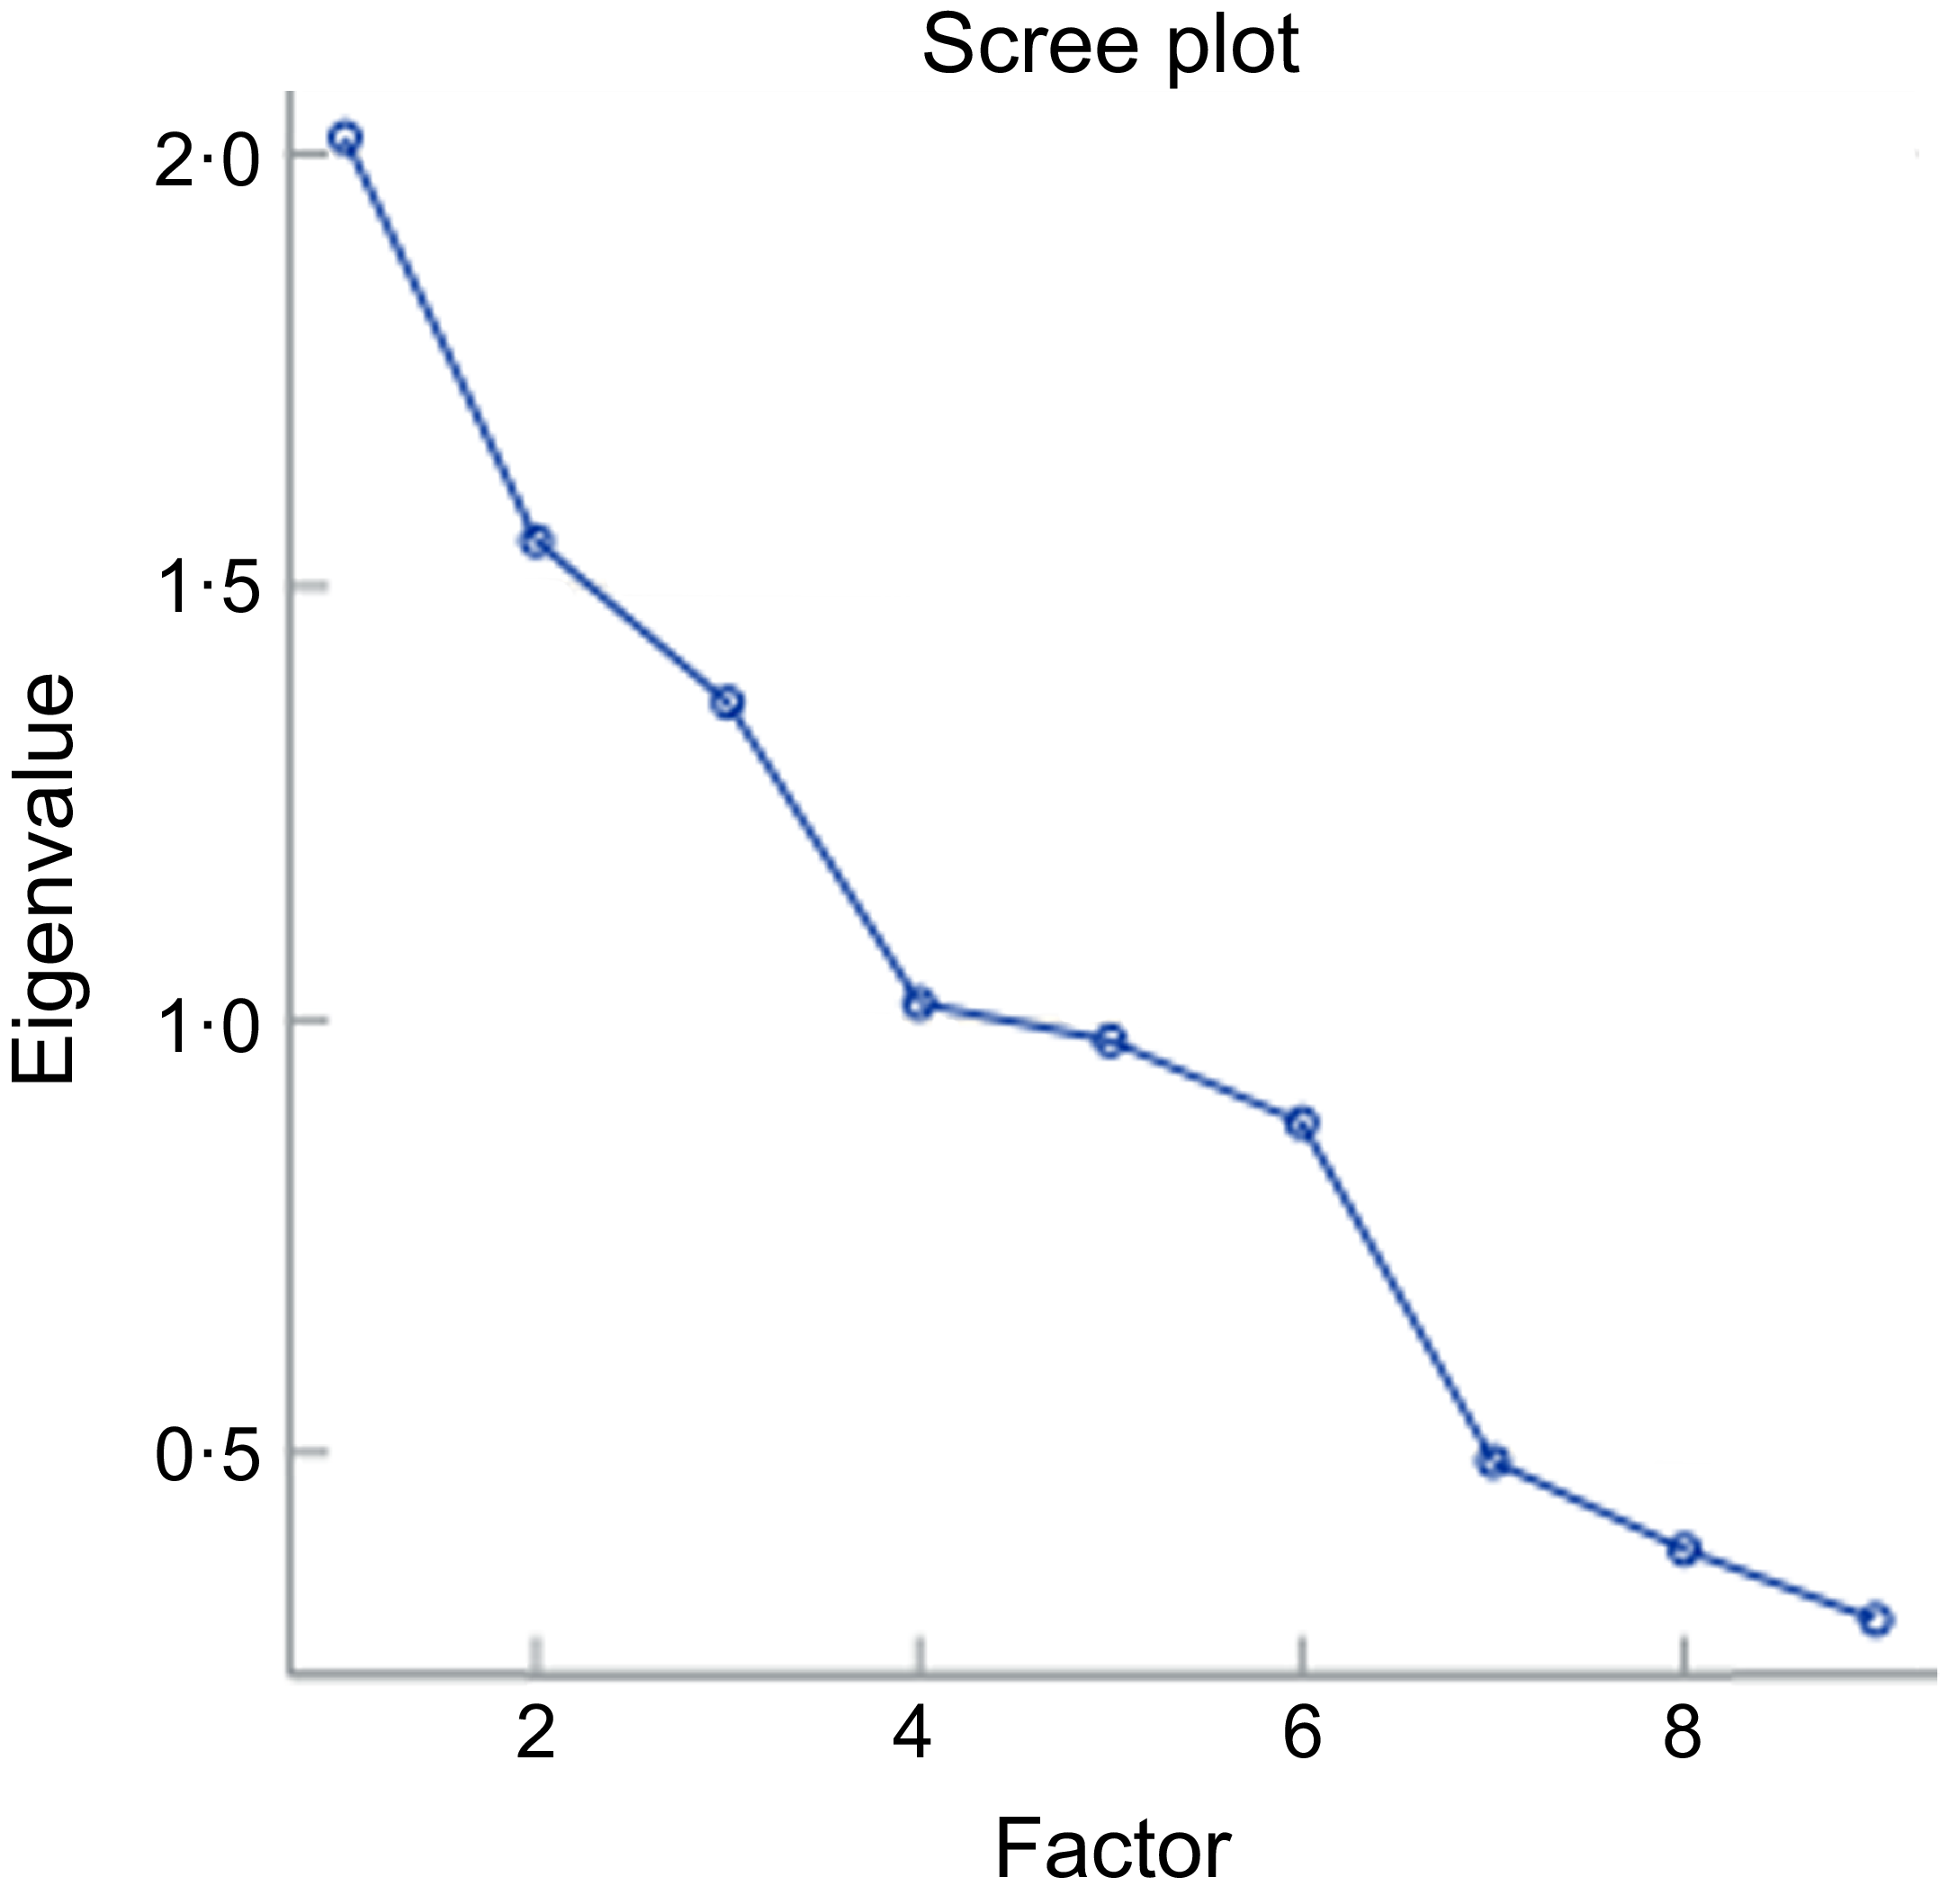
Principal component analysis showed that there is no single pattern that explains the variability of the data (Figure 2). Observing the Scree plot graph, it was possible to note that the BraScore presented four patterns with eigenvalues > 1.
-
Does the BraScore vary sufficiently among individuals?
Scree plot from principal components analysis of the BraScore on data of the Brazilian population aged 10 years old and older. Brazil, 2017–2018.
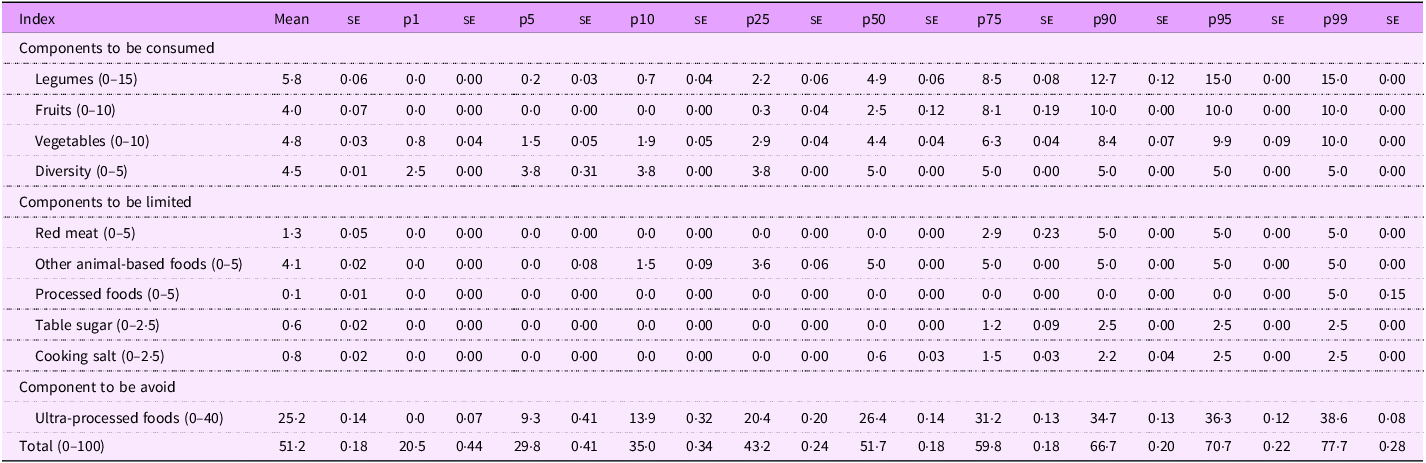
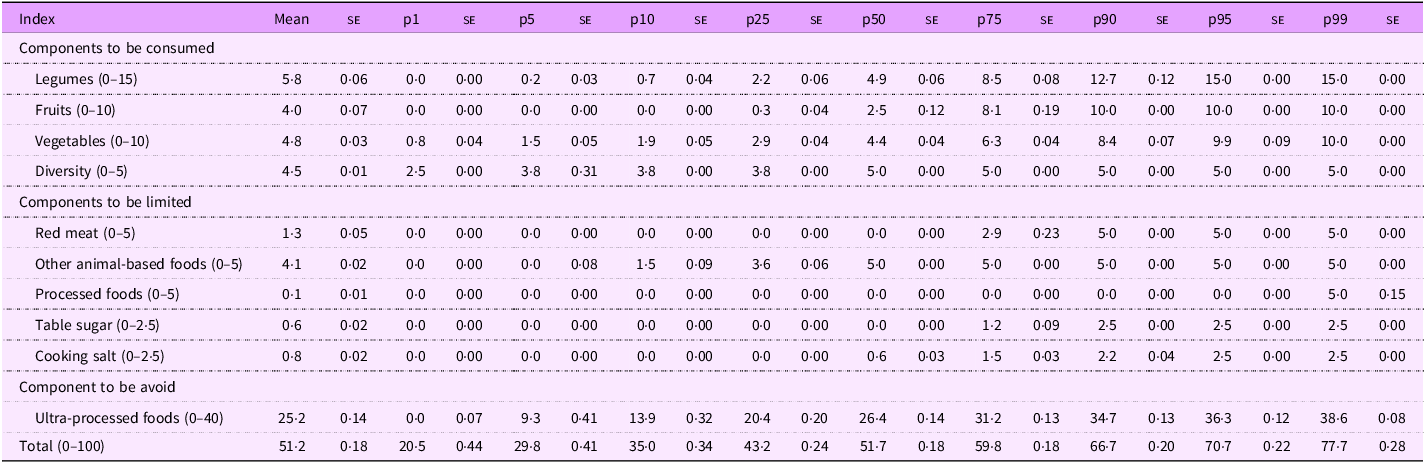
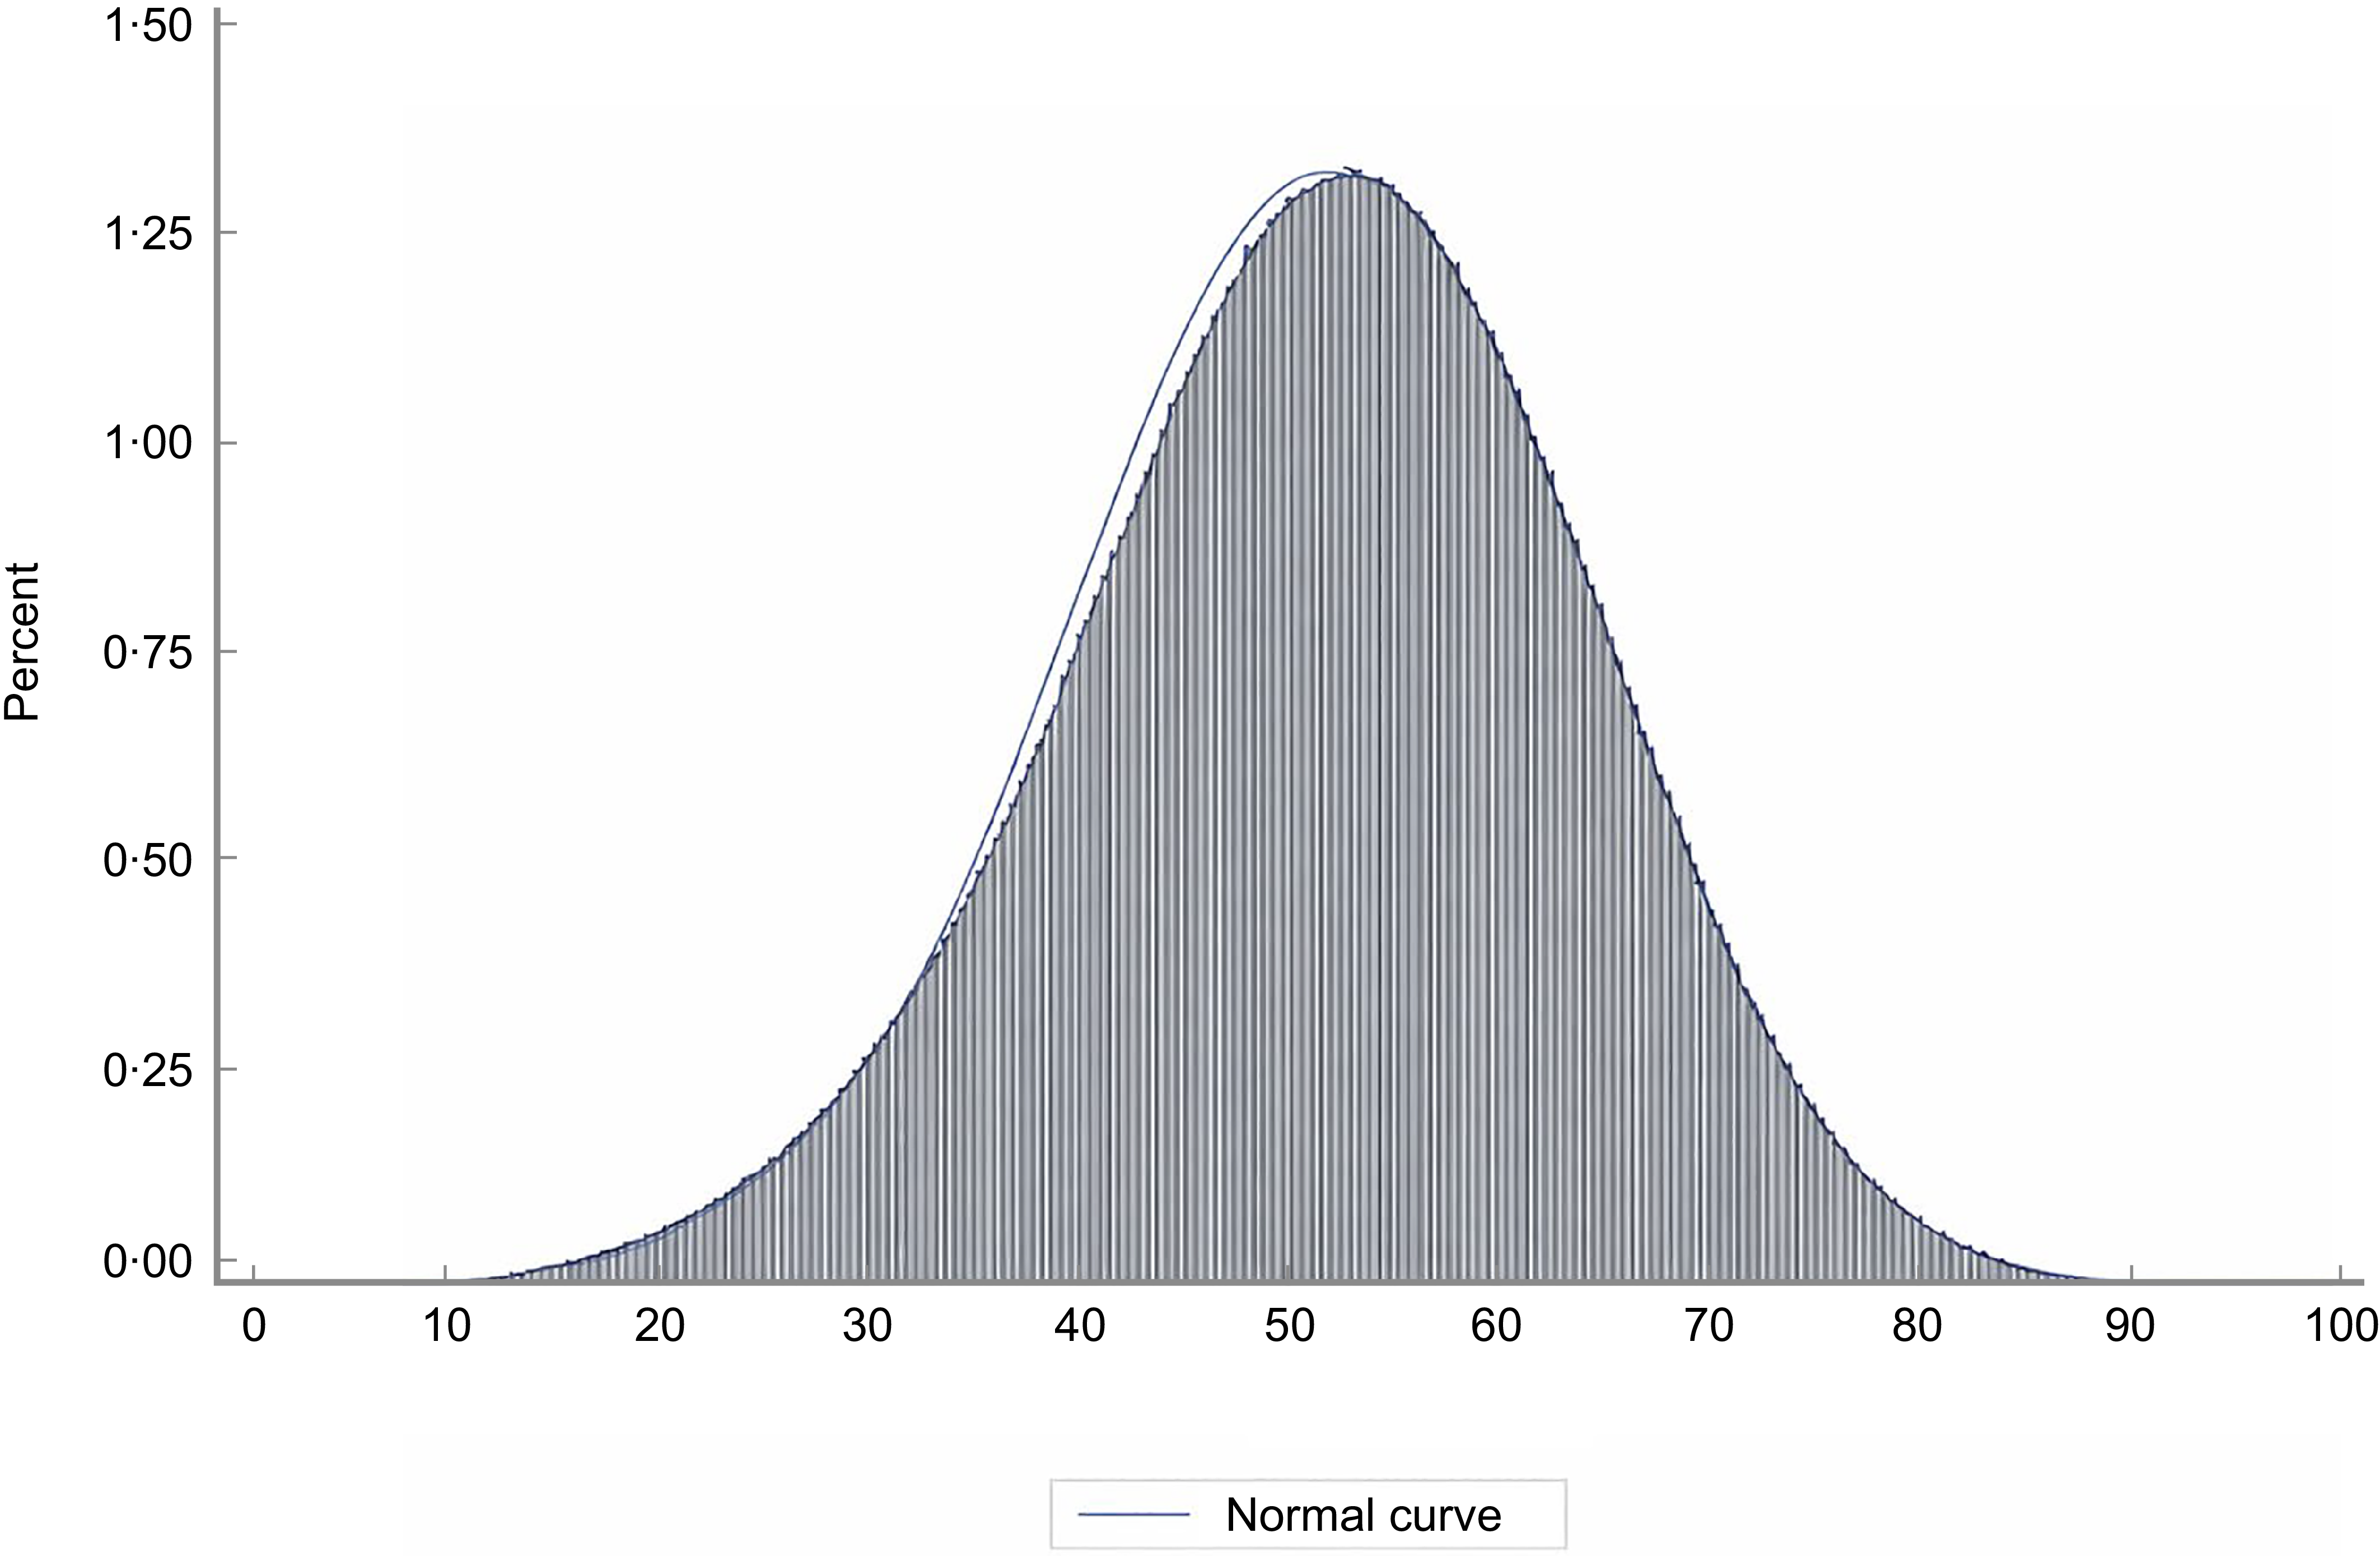
The mean BraScore in the Brazilian population was 51·2 (± 0·18) points, with a median of 51·7(± 0·18) (Table 2). The histogram showed a normal distribution (Figure 3). All components varied across their respective scoring ranges. Variability was observed for the total BraScore, ranging from 20·5(± 0·44) points (1st percentile) to 77·7 (± 0·28) points (99th percentile).
-
Is the BraScore able to distinguish the quality of diet between population groups?
Estimated means, percentiles (p), and corresponding standard errors (se) of the components and total BraScore. Brazil, 2017–2018
Distribution of the total BraScore among Brazilians aged 10 years and older. Brazil, 2017–2018.

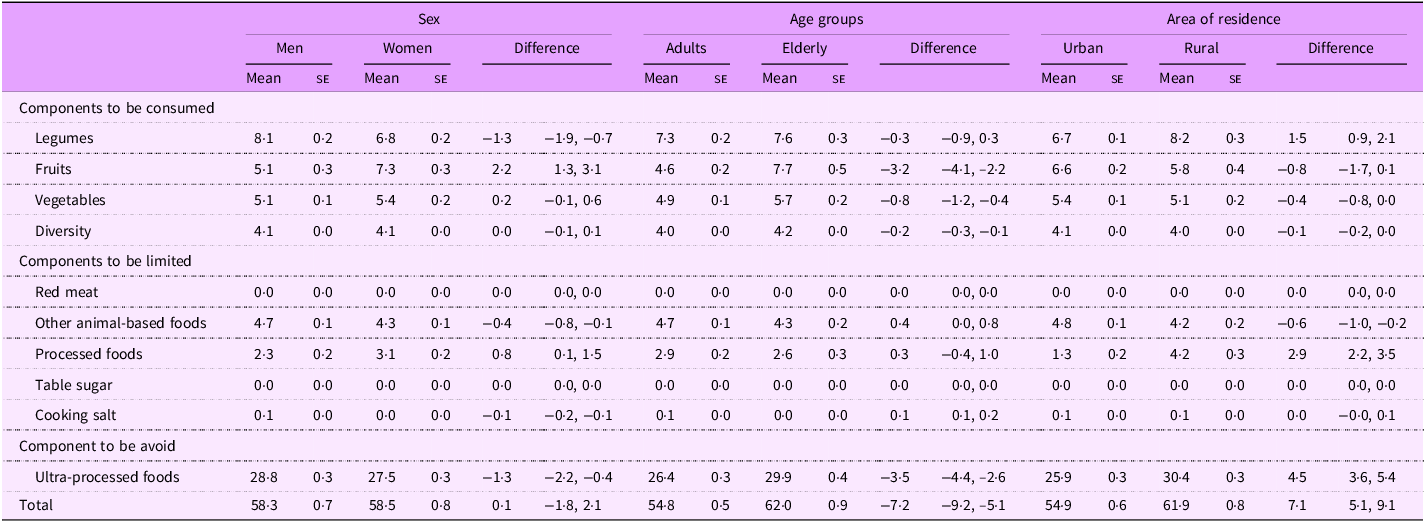
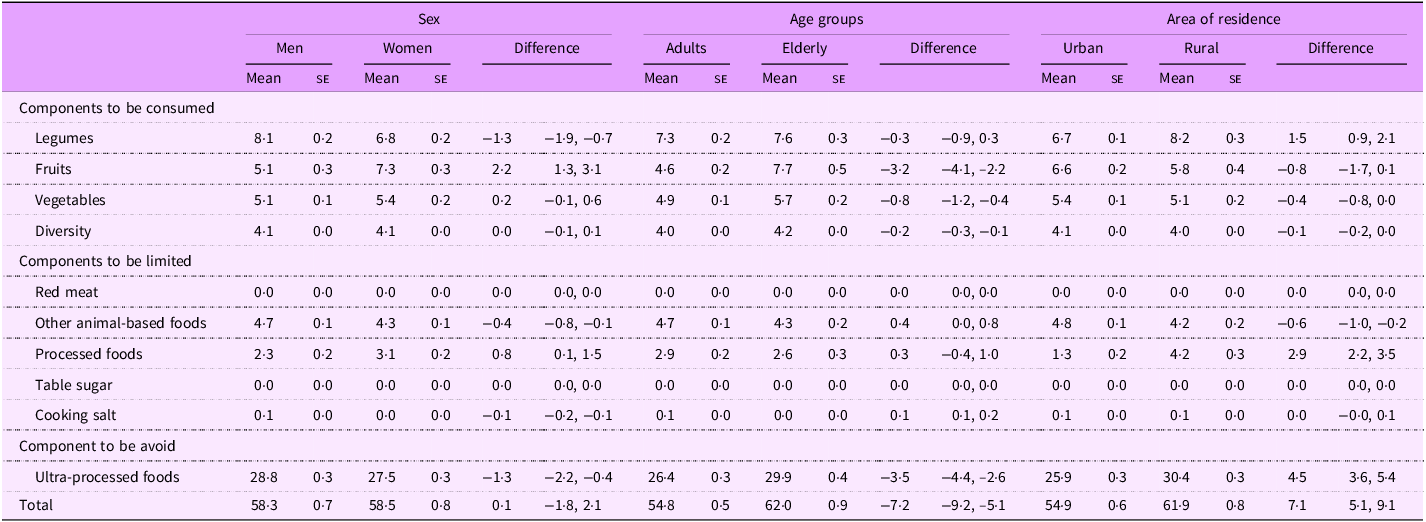
There was no difference in BraScore by gender (58·3 ± 0·7 points for men and 58·3 ± 0·8 points for women). The mean BraScore increased with age, being 7·2 points higher among older adults (54·8 ± 0·5 in adults compared with 62·0 ± 0·9 in older adults). The score was also 7·1 points higher among individuals living in rural areas (61·9 ± 0·8) compared with those living in urban areas (54·9 ± 0·6) (Table 3).
-
Is the BraScore able to generate high scores for diets planned by nutritionists according to the DGBP recommendations?
Estimated means of the BraScore among Brazilians adults aged 19 years and older, by sex, age groups and area of residence. Brazil, 2017–2018
Long description
The table presents estimated means of the BraScore among Brazilian adults aged 19 years and older, categorized by gender, age groups, and area of residence. The table has 12 rows and 15 columns. Column headers include Sex, Age groups, and Area of residence, with sub-columns for Mean, SE (Standard Error), and Difference. Row labels include Components to be consumed, Components to be limited, and Components to be avoided. Each row provides specific data points for these categories. Notable trends include higher BraScores among older adults and those living in rural areas. Specific values and differences are detailed in the table.
The meat-free diet scored 97·6 points, the diet with red meat and eggs in main meals (lunch and dinner) scored 84·6 points and the diet with fish and red meat in the main meals scored 95 points (Appendix 4).
Reliability (internal consistency)
GLB analysis generated a coefficient of 0·6, which we considered acceptable. Pearson’s linear correlation analyses (Table 1) showed that, in general, the components presented weak to moderate correlations with each other, for example, between processed foods and cooking salt the coefficient was −0·01, whereas between diversity and fruits it was 0·49. Correlations with the total score were moderate with vegetables (0·58) and diversity (0·58) and high for UPF (0·83).
Discussion
Our study described the development of the BraScore, a tool designed to assess adherence to the DGBP dietary recommendations. Using a multiphase methodology, validation analyses demonstrated that the BraScore has robust performance in assessing this adherence. The analyses showed that the index is independent of energy intake, does not have a single pattern that can explain the variation in the data, exhibits variability across the Brazilian population, distinguishes population groups, generates high scores for diets planned by nutritionists, and shows low to moderate correlations between components of the index, with acceptable reliability.
Correlation analyses between components and total energy intake revealed that the BraScore is independent of total energy intake. This was expected, as most components are evaluated as percentage of energy intake rather than absolute terms. This means that diets with higher total energy intake do not obtain higher scores simply because they provide more energy. Other dietary indices constructed using relative measures (e.g. percentage of energy or density per 1.000 kcal) have also reported a slightly inverse relationship with total energy intake(Reference Looman, Feskens and de Rijk35–Reference McNaughton, Ball and Crawford37). Principal component analysis indicates that no single combination of components explained the variability in the data, suggestion multiple possible combinations. Similar results were found in the development of other indices that assess adherence to different dietary guidelines(Reference Reedy, Lerman and Krebs-Smith10,Reference Brassard, Elvidge Munene and St-Pierre19,Reference Cacau, De Carli and De Carvalho38,Reference Cacau, Marcadenti and Bersch-Ferreira39) .
Percentile distribution analyses showed that the index effectively distinguishes the population. This analysis also revealed that only 10 % of the Brazilian population scores above seventy-five points. In other words, only a very small part of the population is able to adhere to the dietary recommendations. In this regard, some challenges in the Brazilian diet are mainly related to adhering to the recommended food intake outlined by the DGBP. The median consumption scores for the ‘to be consumed’ components fall below desirable levels, indicating low intake of these foods. The most concerning component is fruits, for which the median score was zero. Compared with Brazil, the USA, Australia and Canada achieved better results in adherence to vegetable and fruit consumption, based on indices that assessed compliance with their respective dietary guidelines(Reference Reedy, Lerman and Krebs-Smith10,Reference Brassard, Elvidge Munene and St-Pierre19,Reference McNaughton, Ball and Crawford37) .
Analyses according to sociodemographic strata showed that the BraScore is capable of differentiating population groups. In contrast to our findings (no difference by sex), other indices show that women usually have higher scores than men(Reference Brassard, Elvidge Munene and St-Pierre19,Reference Looman, Feskens and de Rijk35,Reference Cacau, De Carli and De Carvalho38,Reference Cacau, Marcadenti and Bersch-Ferreira39) . However, differences by age and area of residence were observed: the older adults and rural residents scored higher on the BraScore, reflecting diets more aligned with the DGBP. A previous study in the Brazilian population showed that the consumption of UPF was higher among younger individuals and those living in urban areas(Reference Louzada, Cruz and Silva16). Furthermore, data from the NutriNet-Brasil study, using the same three dimensions as the BraScore, show similar results across socio-demographic strata(Reference Gabe, Costa and Dos Santos40).
The BraScore’s performance in diets based on the DGBP and planned by nutritionists yielded high scores, similar to those found in the HEI-2015 validation study(Reference Reedy, Lerman and Krebs-Smith10). In studies validating diet quality indices, Cronbach’s α is commonly used to assess internal consistency(Reference Guenther, Reedy and Krebs-Smith7,Reference Brassard, Elvidge Munene and St-Pierre19,Reference Cacau, De Carli and De Carvalho38,Reference Cacau, Marcadenti and Bersch-Ferreira39) . In this study, we chose to use the GLB because the BraScore does not meet the tau-equivalence assumption of alpha, as its components do not contribute equally to the total score and have distinct weights. The GLB provides a more realistic lower-bound estimate of reliability under congeneric models and potential asymmetries, making it more appropriate for the multidimensional and weighted structure of the index(Reference Trizano-Hermosilla and Alvarado30). It is important to note that both statistical analyses – Cronbach’s α and GLB – are appropriate for unidimensional instruments, whereas diet, as a construct, is inherently multidimensional. Accordingly, reliability coefficients are not expected to be very high. Analyses of correlations between components showed weak to moderate correlations, with the highest values between the diversity, fruits and vegetables components, which was expected because both include fruit and vegetable intake in their calculation.
Positive correlations were observed between most components and the total score, indicating that higher consumption levels were associated with higher scores for the respective components and the overall score. In principle, all components would be expected to show a positive correlation with the total score, indicating that higher component scores are associated with a higher overall score. Importantly, a higher score does not reflect greater consumption of components to be limited or avoided, but rather better adherence to the established criteria. However, for red meat, other animal-based foods and cooking salt, we observed weak negative correlations. Counterintuitively, in Brazil, the consumption of these ‘to be limited’ components appears to be associated with behaviours that increase the overall score, such as lower intake of UPF and higher consumption of beans.
This study presents strengths and limitations. Among the strengths, we highlight the use of a robust methodology, a predefined defined analysis plan and a scoring method in which intermediate consumption levels between the minimum and maximum criteria are scored proportionally to the amount consumed, in contrast to other indices with dichotomous scoring(Reference Herforth, Wiesmann and Martinez-Steele41). Furthermore, the use of different analytical approaches to evaluate the construct validity of the BraScore is another strong point.
As for limitations, the challenge of establishing reference values for the consumption of food groups, given the qualitative nature of the DGBP recommendations. To address this, scientific literature and analyses of usual food consumption of the Brazilian population were used. It is also necessary to consider the biases inherent to 24HR data (under- and overestimation of some food groups, discrepancies between actual and standardised recipes and differences between the actual nutrient composition and the values reported in the Tabela Brasileira de Composição de Alimentos). These biases were minimised through the use of validated 24HR, administered by trained interviewers, in addition to quality control procedures employed during the data collection and processing phase, in which inconsistent records were imputed.
The BraScore can be applied to food consumption data collected from different instruments, such as 24HR or quantitative FFQ. To be applied correctly, it is essential that food consumption data are classified according to the Nova classification system and that they include information on the energy intake of the groups present in the index, obtained by food composition table. Furthermore, natural or minimally processed plant foods must be quantified according to the groups present in the diversity component and their respective quantities (in grams). It is also necessary to estimate the approximate consumption in grams of cooking salt from culinary preparations or added directly to ready-made foods. Although some degree of misclassification is inevitable, the use of standardised recipes remains the most widely accepted and methodologically appropriate approach for estimating these foods consumption in epidemiological studies.
An initiative in nutrient profiling system, named Food Compass, also incorporated food processing as one of its dimensions. Originally developed to score individual foods and beverages, it combines traditional nutrient-based metrics with broader components, including processing characteristics, within a unified algorithm. Although UPF are negatively scored, unprocessed or minimally processed foods are not positively rewarded(Reference O’Hearn, Erndt-Marino and Gerber42).
In 2019, the ‘How is your diet?’ scale was developed to assess adherence to the Brazilian Dietary Guidelines’ recommendations related to eating practices (e.g. cooking and household organisation). Unlike the BraScore, this scale does not quantitatively assess food consumption but rather the frequency of such practices(Reference Gabe and Jaime43).
The BraScore demonstrates potential alignment with the principles of the EAT-Lancet, which also emphasises the consumption of predominantly plant-based foods, moderate intake of animal-based foods and low consumption of added sugar(Reference Rockstrom, Thilsted and Willett26,Reference Willett, Rockstrom and Loken31) . The findings of this study corroborate previous study, which revealed that UPF consumption is inversely associated with the EAT-Lancet diet(Reference Cacau, Souza and Louzada44). This convergence reinforces the potential utility of the BraScore as a tool not only for assessing adherence to the DGBP but also for exploring synergies with broader dietary frameworks. The BraScore was designed for the Brazilian context, but it can serve as inspiration for adaptation in other contexts, aligning components and cut-offs points with local dietary guidelines and empirical intake distributions. Components tied to Brazilian patterns, such as legumes, processed foods and UPF, should be recalibrated using local data. Compared with widely used diet quality indices (e.g. HEI/AHEI and EAT-Lancet adherence scores), the BraScore retains a component-based, density-scaled approach but uniquely incorporates degree of processing, including an explicit ‘to be avoided’ dimension for UPF.
The BraScore offers a distinct perspective among dietary quality indices by incorporating principles that are still not widely represented in most existing tools. First, it is explicitly grounded in the Dietary Guidelines for the Brazilian Population, which are food-based and emphasise the degree of food processing rather than relying primarily on nutrient-based recommendations. These guidelines are internationally recognised as pioneering and have influenced other countries in the development and revision of their own dietary guidelines(Reference Jaime and Braga45). Second, the BraScore incorporates the Nova classification, allowing it to capture the role of UPF as well as other food groups defined by the level of processing in shaping overall diet quality, a dimension that is not fully addressed by many other indices. Third, it was developed and validated using Brazilian population data, which enhances its contextual relevance and applicability for monitoring and evaluating dietary patterns in Brazil. In this sense, the BraScore constitutes a tool for food and nutrition surveillance, which is one of the main guidelines of the National Food and Nutrition Policy (Política Nacional de Alimentação e Nutrição), guiding the actions of the Unified Health System (Sistema Único de Saúde)(Reference Gabe, Tramontt and Jaime46). Additionally, it is consistent with the recommendations of the International Network for Food and Obesity/Non-communicable Diseases Research, Monitoring and Action Support (INFORMAS), which advocates for the use of standardised indices to monitor and benchmark population diet quality globally(Reference Vandevijvere, Monteiro and Krebs-Smith17). Finally, by combining components to be encouraged, limited and avoided, the BraScore provides a comprehensive assessment of diet quality aligned with public health priorities in the country.
In conclusion, this work described the construction and validation process of the BraScore (Brazilian Dietary Guidelines Adherence Score) and showed that this index performs well in assessing adherence to the Dietary Guidelines for the Brazilian Population. Some scientific gaps remain to be addressed in future studies, including evaluating the predictive validity of the BraScore – its ability to predict health outcomes; establishing cut-off points (to classify low, medium and high adherence) and assessing its performance in children aged 2–10 years.
Supplementary material
For supplementary material accompanying this paper visit https://doi.org/10.1017/S1368980026102936
Acknowledgements
We thank the researchers from the Centre for Epidemiological Research in Nutrition and Health (NUPENS/USP) who participated in meetings during the development phase and the external researchers who took part in the expert panel phase. We especially thank researcher Giovanna Calixto Andrade, who provided support with the statistical analyses during the manuscript revision process. Additionally, we thank the School of Public Health – USP, particularly the Department of Nutrition, for their technical support.
Financial support
This work was supported by the São Paulo Research Foundation (FAPESP), grant number 2021/14782-7 and 2023/14865-5. FAPESP had no role in study design, data collection and analysis, decision to publish or preparation of the manuscript.
Competing interests
There are no conflicts of interest.
Authorship
T.N.S. and M.L.C.L. designed research and conducted research; T.N.S. analysed data; T.N.S. wrote the paper. T.N.S. had primary responsibility for final content. All authors read and approved the final manuscript.
Ethics of human subject participation
This study was conducted according to the guidelines laid down in the Declaration of Helsinki, and all procedures involving research study participants were approved by the Research Ethics Committee of the School of Public Health of the University of São Paulo (CAAE: 60682822.0.0000.5421). Written informed consent was obtained from all subjects/patients.


 Open access

