


Given high prevalence of dietary-related chronic diseases (e.g. type 2 diabetes, CVD and hypertension)(1–Reference Godfrey, Cordova-Marks and Jones3) in American Indian/Alaska Native (AI/AN) populations, nutrition has long been a focus of health research among these communities. Much of this research, however, has been ‘problem-focused,’ contributing to deficit-based narratives that permeate public health research and practice(Reference Hyett, Gabel and Marjerrison4–Reference Fogarty, Lovell and Langenberg6). This deficit-oriented approach tends to overemphasise quantifying prevalence of chronic disease and poor dietary patterns, with insufficient recognition of context and root causes, including the central role of settler colonialism, in creating and perpetuating health inequities(Reference Fogarty, Lovell and Langenberg6–Reference Foley and Schubert8). Deficit-based discourse and research contribute to a narrow understanding of AI/AN health, often framing AI/AN peoples, their bodies and their diets as problems to be fixed through Western intervention(Reference Chittleborough, Delbridge and Coveney7,Reference Hay9) . Despite the negative framing of AI/AN nutritional health, AI/AN communities hold profound place-based knowledges, intergenerational food knowledges and food values informed by their worldviews that contribute to nutrition and overall health(Reference DeBruyn, Fullerton and Satterfield10–Reference Isaac, Finn and Joe12). In response, AI/AN and other Indigenous communities have long called for strengths-based approaches to health(Reference Fogarty, Lovell and Langenberg6,Reference O’Keefe, Maudrie and Cole13–Reference Brough, Bond and Hunt16) and, more specifically, to nutrition(Reference Chittleborough, Delbridge and Coveney7,Reference Foley and Schubert8) . This shift towards strengths-based approaches is especially critical for AI/AN communities, whose cultural food knowledges, food practices and intergenerational food wisdom are deeply intertwined with health but have largely been overlooked by Western nutrition measurement(Reference Isaac, Finn and Joe12,Reference Maudrie, Nguyen and Wilbur17,Reference Joseph and Turner18) . These strengths, grounded in cultural traditions and worldviews, offer protective factors that may transform how AI/AN health is understood and addressed(Reference DeBruyn, Fullerton and Satterfield10,Reference Satterfield19–Reference Maudrie, Colón-Ramos and Harper21) .
Nutrition research in AI/AN communities has relied largely on existing quantitative measures such as 24-h dietary recalls(Reference Johnson, Nobmann and Asay22), FFQ(Reference Estradé, Trude and Pardilla23) and other forms of diet questionnaires, largely developed by and validated in non-Native populations(Reference Slattery, Murtaugh and Schumacher24). Despite their utility in facilitating cross-culture comparisons or identifying nutritional deficiencies, these measures do not capture the complexity of AI/AN nutrition, Indigenous food systems, values or the cultural and community strengths that can act as facilitators of nutrition(Reference Bryant, Bolt and Botfield5,Reference Milburn25,Reference Lemke and Delormier26) . Recognising and measuring these strengths could provide valuable insights to inform public health practice and interventions and ground these efforts in AI/AN worldviews and contexts(Reference Bryant, Bolt and Botfield5,Reference Milburn25,Reference Lemke and Delormier26) .
To address these limitations, new nutrition-focused measures are needed that capture the unique cultural strengths and worldviews of AI/AN communities. In response to this need, we collaborated with two urban AI/AN communities to develop strengths-based Indigenous nutrition measures that reflect the holistic nature of traditional food systems, the importance of relational and inter-generational food knowledges and the cultural food values of AI/AN peoples. These measures were co-created through an iterative community-based participatory research approach, ensuring that the developed items resonated with the health priorities and values of our partner urban AI/AN communities(Reference Maudrie, Caulfield and Nguyen27). Based on Community Research Council (CRC) feedback, the scales were developed based on the Indigenous Nourishment Model, a conceptual framework which represents four main domains of nourishment (Physical, Spiritual, Emotional and Relational) and the complex relationships between these holistic nourishment needs(Reference Maudrie, Clyma and Nguyen11). The development process included extensive qualitative feedback to ensure the scales were culturally relevant and had strong face validity for urban AI/ANs (see Maudrie et al., 2024 for more details(Reference Maudrie, Caulfield and Nguyen27). The purpose of the current study is to evaluate the psychometric properties of the Indigenous Nourishment Scales and explore their relationships with other holistic health constructs in a sample of adult urban AI/ANs.
Methods
Study setting and design
This Community-Based Participatory Research research took place in partnership with two urban Native health organisations, Native American Lifelines in Baltimore, Maryland and Native American Community Clinic in Minneapolis, Minnesota, including CRCs in both communities. CRCs were formed by partner organisations and consisted of AI/AN adults with varied lived experiences and expertise. CRCs participated in measure development, as shown in Figure 1, and met regularly to inform recruitment strategies, study implementation and interpretation of research findings. Ethical approval was received from the Johns Hopkins Bloomberg School of Public Health Institutional Review Board (IRB00026314), and community approvals were obtained through ongoing involvement of partner organisations and letters of support. This manuscript describes the evaluation of the validity of three nutrition measures in a sample of 249 urban AI/AN adults developed as part of a larger exploratory sequential mixed methods research study (Figure 1). Sample size was partially determined based on recommendations for exploratory factor analysis (EFA), which generally suggest a minimum of 5–10 participants per item or a minimum of 200 participants. We aimed to meet these methodological guidelines while balancing feasibility within the context of a community-based study conducted in partnership with two urban AI/AN communities. The final sample of 249 participants met recommended thresholds for EFA and reflects the practical considerations of conducting research in community settings with limited access to large sampling frames. The current study took place from May 2024 to July 2024.
Mixed methods study design.

Measures
The Indigenous Nourishment Scales are composed of three separate scales(Reference Maudrie, Caulfield and Nguyen27). The first scale, Relationships with Food consisted of nine items with seven response options ranging from never (0) to always (6) aimed to gather a holistic view on an individual’s relationship with food. Example items from this scale include: ‘Sharing food is a way I strengthen or build my relationship with others,’ ‘I feel connected to plants, animals, waters and others through the foods I eat’ and ‘The foods I eat spiritually nourish me.’ The second scale, Indigenous Food Values and Beliefs consists of thirteen items paired with a seven-point Likert scale ranging from strongly disagree (0) to strongly agree (6). These items ask about food beliefs related to Indigenous cultures and traditions and include items like, ‘I feel a responsibility to pass on traditional/ancestral food knowledge to future generations’ and ‘I think of plants and animals as my relatives.’ The third scale, Indigenous Foodways Access and Participation Inventory, consists of sixteen items that assess the access to various Indigenous foodways practices and participation in those practices. Access items assessed satisfaction with access to various Indigenous foodways in the last year with a seven-point Likert scale ranging from very dissatisfied (0) to very satisfied (6) and included items like: ‘In the last year, how satisfied were you with your ability to share food with others outside your household?’ and ‘In the last year, how satisfied were you with your access to traditional/ancestral foods?.’ Participation items assessed how frequently in the last year individuals participated in various Indigenous food practices and included items like: ‘In the last year, how often did you participate in Indigenous foodways (e.g. hunting, fishing, gathering, feasts, traditional forms of food processing, gardening, etc.)?’ and ‘In the last year, how often did you intentionally take action to be a good relative to your food system (e.g. composting, putting down tobacco, tending to land, water, plants or animals, etc.)?’. These items were paired with 7 response options ranging from I have never participated in [the activity described in the item] (0) to daily (6). The full Indigenous Nourishment Scales can be found in online supplementary material, Supplemental Table 1.
In addition to the three Indigenous Nourishment Scales, other relevant health measures and demographic information were collected. The Behavioral Risk Factor Surveillance System Fruit and Vegetable Questionnaire (BRFSS F&V-Q) consists of six questions and is a short reliable measure for assessing self-reported intake of fruits and vegetables(Reference Lee and Moore28). Fruit and vegetable intake across the six items was converted to daily servings. In alignment with Center for Disease Control and Prevention’s analytic recommendations, those with less than five daily servings were categorised as having inadequate fruit and vegetable intake, and those with five or more daily servings were categorised as having adequate fruit and vegetable intake(Reference Lee and Moore28).
The Mental Health Continuum-Short Form (MHC-SF) is considered a valid and reliable questionnaire used to assess emotional, psychological and social well-being(Reference Lamers, Westerhof and Bohlmeijer29). The MHC-SF consists of three sub-scales: emotional, social and psychological well-being. Participants responded to items assessing positive symptoms of mental health using a six-point Likert scale ranging from 0 ‘Never’ to 5 ‘Everyday’ (Reference Lamers, Westerhof and Bohlmeijer29). Participants responses were summed across sub-scales and the total scale, with higher scores indicating greater levels of positive mental health(Reference Lamers, Westerhof and Bohlmeijer29). Following established scoring guidelines, we categorised participants into three well-being groups: Languishing, Moderately Mentally Healthy and Flourishing. Individuals are classified as Flourishing if they report high levels of emotional well-being and the majority of psychological and social well-being symptoms as ‘every day’ or ‘almost every day’; Languishing if they report low levels of these symptoms ‘never’ or ‘once or twice’ in the past month; and Moderately Mentally Healthy if they fall between these two thresholds(Reference Keyes30). In our sample, the Cronbach’s α for the overall scale was 0·93, α for the Emotional well-being subscale was 0·86, α for the social well-being subscale was 0·83 and finally α for the psychological well-being subscale was 0·88.
The Cultural Connectedness Scale (CCS) is used to measure individual connection to culture and community, which has been shown to relate to positive mental health among First Nations youth(Reference Snowshoe, Crooks and Tremblay31,Reference King, Masotti and Dennem32) . The CCS has three sub-scales: Identity, Traditions and Spirituality and is composed of items representing various aspects of connection to culture. Eleven items used a response option of Yes (1) or No (0), fifteen items used a five-point Likert scale ranging from Strongly Disagree (0) to Strongly Agree (4), and three items used a five-point Likert frequency scale ranging from Never (0) to Everyday (4). Participant scores were summed by sub-scale and overall scale. In our study sample, Cronbach’s α for the overall scale was 0·93, α for the Identity subscale was 0·91, α for the Traditions subscale was 0·86 and finally α for the Spirituality subscale was 0·82.
Demographic questions included age, gender (coded as male = 0, female = 1, Transgender/Two-Spirit/Non-Gender Binary = 3; Two-Spirit is a modern broadly used Indigenous term for AI/ANs who hold a nonbinary gender identity and/or spiritual role that combines masculine and feminine spirits), Tribal affiliation, urban Native community (Baltimore, Washington DC, Minneapolis, or St. Paul), education (coded as High School Graduate, General Education Development or Less = 0, Some College, Technical School or Higher = 1) and household income (coded as less than $25 000 = 0, $25 000–$39 999 = 1, $40 000–$79 999 = 2, more than $80 000 = 3).
Procedure
In partnership with CRCs and partner organisations, we developed a multi-method recruitment approach. First, the lead author and CRC members attended and tabled at community events to share information about the survey and to distribute QR codes and print fliers with links to the survey. Second, participants were purposively recruited by community partner organisations and CRC members using snowball sampling, by word of mouth, email and distribution of print fliers. Partner organisations and CRC members were provided with an email script containing information about the study and the recruitment flier to share with their networks electronically. Partner organisations were also provided with print copies of the recruitment flier to place in community gathering and clinic spaces. Lastly, the lead author followed a similar recruitment strategy, sharing information about the study using the email script with community members in both communities. All recruitment materials shared the purpose of the study, contact information for the PI and IRB and the incentive of a $50 visa gift card.
Once a participant clicked on the survey link or followed the QR code link, they were directed to the REDcap online survey and data management platform. They completed re-captcha verification (a verification measure designed to differentiate between humans and bot activity) and answered four challenge questions designed to verify human participation (e.g. select the state of Maryland from the dropdown list, what is 3 + 2, etc.). If participants answered challenge questions correctly, they were led directly to a set of questions designed to assess eligibility without revealing eligibility criteria. These eligibility questions assessed age, racial and ethnic identity, tribal affiliation and what urban community they were associated with. To move on to the actual study questions, participants had to meet our eligibility criteria of being 18 years of age or older, self-identified American Indian or Alaska Native (either alone or in combination with other races/ethnicities) and being a member of Baltimore, Washington DC, Minneapolis or St. Paul Native communities. Participants then completed survey measures and a gift card preference survey, in which participants could select if they wanted to receive a $50 visa gift card via email or physical mail as compensation for their participation.
Analyses
Survey data were exported from REDCap and analysed in Stata and factor analyses were conducted in MPLUS Version 8.11 (Muthen & Muthen, 1998–2017).
Exploratory factor analyses and internal consistency reliability
Although the INS were conceptually grounded through our previous community-engaged qualitative work, this study is the first to empirically test their psychometric properties. Because no prior quantitative data existed on the factor structure, we used EFA to allow the data to reveal how the constructs manifested empirically within this sample. This approach aligns with our iterative Community-Based Participatory Research process, where community-derived constructs are refined through both qualitative and quantitative stages. In order to ensure the correlation matrix was not random and, therefore, that the Indigenous Nourishment Scales were appropriate for EFA, we examined results from Bartlett’s test of sphericity and KMO statistics (minimum KMO of 0·50 to be appropriate for EFA). After confirming that the underlying correlation matrix was appropriate for EFA, we conducted principal component analysis, examined scree plots and conducted parallel analyses to narrow down the number of factors to be retained(Reference Watkins33). Criteria for factor analyses were established a priori and used the following rules: pattern coefficients of > 0·40 were considered practically and statistically significant, items cross loading on more than one factor at greater than 0·30 were rejected, and each factor must have sufficient loadings by three or more items(Reference Watkins33). Due to the nature of constructs examined through scales, factors were assumed to be correlated, therefore geomin rotation was used. Internal consistency reliability evaluates the degree to which items within each factor measure the same underlying construct and produce coherent, consistent responses. To assess the internal consistency reliability of the Indigenous Nourishment Scales, Cronbach’s alpha was calculated for items contributing to each factor.
Convergent construct validity
Construct validity is an important form of validity, which indicates whether a scale is accurately measuring a construct of interest(Reference Hajjar34). Convergent construct validity is assessed by comparing scales, which measure the same or theoretically related constructs(Reference Hajjar34). To evaluate the convergent construct validity of our culturally developed nutrition measures, we tested several hypotheses. Specifically, we hypothesised that urban AI/AN adults who score higher on the Indigenous Nourishment scales (examined separately by factors) will have, (1) Stronger physical health behaviors (positively associated with adequate fruit and vegetable intake) and (2) Greater cultural connection (positive association with the cultural connectedness scale). To test these hypotheses, we examined the relationships between individual factors from the Indigenous Nourishment Scales and other health measures using Pearson’s correlations. Associations with a less than 5 % probability (P value < 0·05) using two-tailed tests were considered significant.
Relationships with holistic health indicators (unadjusted and adjusted regression models)
To assess relationships with health holistically, we used logistic and linear regression to examine each of four health-related domains with each of the four domains of nourishment outlined in the Indigenous Nourishment Model. To assess physical health, we examined the likelihood of consuming five or more servings of fruits and vegetables per day, a commonly used indicator of overall diet quality and a well-established behavioral marker associated with chronic disease risk and general physical well-being. To examine Spiritual Health, we examined the Spirituality Sub-Scale of the CCS as our spiritual health outcome using linear regression. Emotional Health was examined using the emotional well-being sub-scale of the MHC-SF via linear regression. Finally, Relational Health was assessed using the outcome of social well-being sub-scale of the MHC-SF. To assess the relationship between our four domains of health, our Indigenous Nourishment Scales and other related co-variates, we explored adjusted and unadjusted models for each domain outcome. Adjusted models included adjustment for community, gender and income. These covariates were selected a priori as socio-demographic factors known to influence diet quality, cultural engagement and well-being among AI/AN populations. The inclusion of community accounts for geographic and contextual differences across the two urban Native settings in our sample; gender is associated with variation in health behaviours and engagement with cultural experiences and household income is a recognised determinant of food access, dietary patterns and overall physical health.
Results
Sample descriptives
The final analytic sample included complete and valid data from 249 participants, 343 survey responses were excluded due to being identified as bot responses and an additional thirty-two were removed as duplicate entries. Although the survey incorporated reCAPTCHA verification and specific challenge questions designed to prevent automated responses, we identified a subset of surveys that demonstrated multiple indicators of fraudulent or bot activity (e.g. extremely short completion times, patterned or contradictory responses and failure on embedded attention checks). Similar patterns have been reported by other AI/AN research teams conducting online surveys in recent years(Reference Reed, Bull and Shrestha35), reflecting broader increases in sophisticated automated survey fraud. In consultation with our IRB and our community research partners, these responses were excluded to ensure data quality and protect the integrity of the analytic sample. The majority of the sample (69·1 %) resided in the Minneapolis/St. Paul communities (compared with 30·9 % from Baltimore/Washington DC). A large majority of the sample identified as female (73·1 %) and fewer identified as males (18·1 %) or transgender, non-binary, or two spirit (8·8 %). Participants ranged in age from 18 to 74 years, with a mean age of 38·5 years. More than a third (42·2 %) of the sample reported a household income of less than $25 000 per year. The majority of participants (77·9 %) reported inadequate fruit and vegetable intake (less than five servings of fruits and vegetables per day). Participant demographic and health characteristics are presented in Table 1.
Participant demographic and health characteristics (n 249)

Exploratory factor analyses and internal consistency reliability
Scale A: Relationships with food
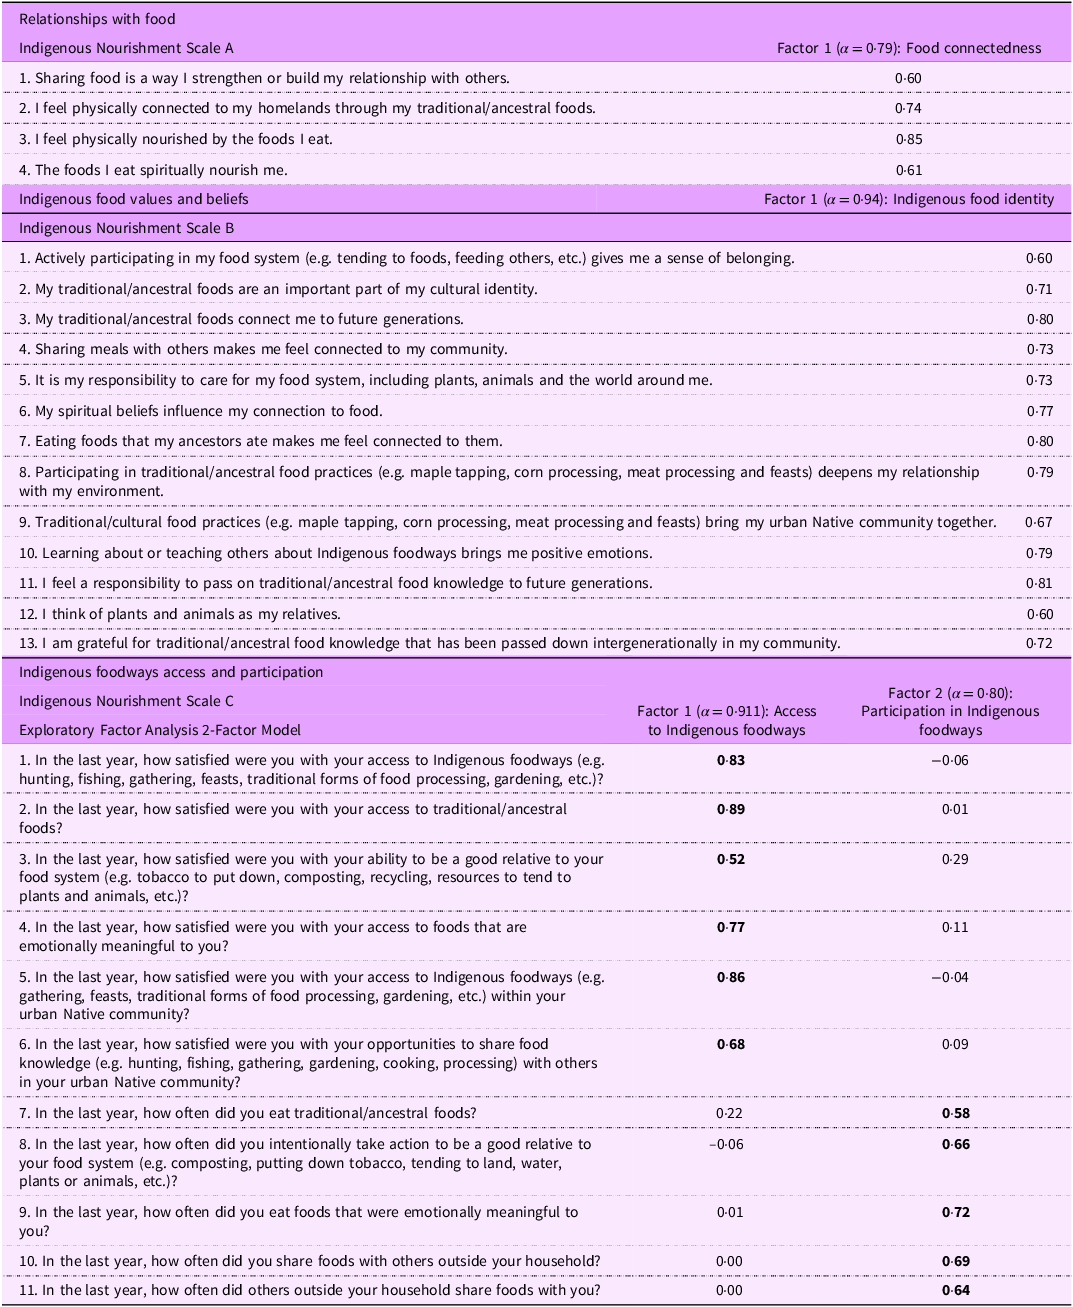
Bartlett’s test of sphericity (χ2 872·69, df 36, P < 0·000) and the KMO statistic of sampling adequacy (0·85) indicated the items and underlying matrices for Scale A were appropriate for factor analysis. The principal components analysis resulted in two eigenvalues > 1, the scree plot showed an elbow at two components, and the parallel analysis indicated between a 2 and 3 factor solution. Given the small number of items, however, a one-factor solution was examined in addition to the two and three-factor solutions. A three-factor solution failed to converge once cross-loading, and low-loading items were dropped and therefore was deemed inadequate. A two-factor solution was examined next but was reduced to a one factor model because only two items loaded onto the second factor. In alignment with EFA guidelines, the two items loading onto the second factor were dropped(Reference Watkins33). Therefore, a one-factor model with four items was deemed the most appropriate. This factor, titled ‘Food Connectedness’ had good internal consistency reliability as indicated by a Cronbach’s α = 0·79.
Scale B: Food values and beliefs
Bartlett’s test of sphericity (χ2 2278·63, 91 df, P < 0·000) and the KMO statistic of sampling adequacy (0·95) indicated the items and underlying matrices for Scale B were appropriate for factor analysis. principal component analysis revealed two eigenvalues > 1 indicating a two-factor solution, the scree plot suggested retaining two factors and the parallel analysis also indicated 1–2 factors. Therefore, both one- and two-factor solutions were examined. The food values and beliefs items were examined and tested for uni-dimensionality, all items loaded onto one factor (‘Indigenous Food Identity’) with sufficiently high loadings and a strong internal consistency reliability (Cronbach’s α = 0·94). A two-factor solution was examined but only two items adequately loaded onto the second factor, violating our a-priori factor analyses criteria. Therefore, a one-factor solution with thirteen items was accepted as the most adequate structural representation of the underlying latent variable for Scale B with these participants.
Scale C: Indigenous foodways access and engagement inventory
Bartlett’s test of sphericity (χ2 2328·95, 120 df, P < 0·000) and the KMO statistic of sampling adequacy (0·91) indicated the items and underlying matrices for Scale C were appropriate for factor analysis. For our final scale, principal component analysis resulted in three eigenvalues > 1, while the scree plot suggested retaining 2–3 factors, and parallel analysis suggested a two- or three-factor solution. A three-factor solution was examined and found to be inadequate as no items had strong loadings on the third factor. However, in a two-factor solution Factor 1: ‘Access to Indigenous Foodways’ and Factor 2: ‘Participation in Indigenous Foodways’, had salient loadings from enough items. The internal consistency reliability for the Access to Indigenous Foodways factor was α = 0·91 and for the Participation in Indigenous Foodways was α = 0·80. Items and factor loadings for the Indigenous Nourishment Scales are presented by Scale in Table 2.
The Indigenous Nourishment Scales, item factor loadings

Convergent construct validity
Table 3 presents the inter-scale correlation matrix. Correlations demonstrated statistically significant relationships between the factors from the Indigenous Nourishment Scales and other theoretically related health measures. More specifically, the positive statistically significant correlation between the Indigenous Nourishment Scale factors and adequate fruit and vegetable intake supports our first hypothesis that measures of Indigenous nourishment will be associated with adequate fruit and vegetable intake. In support of our second hypothesis, all four factors from the Indigenous Nourishment Scales were significantly associated with greater Cultural Connectedness.
Correlation matrix of Indigenous Nourishment Scales and Holistic health outcomes

CC, Cultural Connectedness Scale; MHC-SF, Mental Health Continuum Short form.
* P < 0·05.
** P < 0·01.
*** P < 0·001.
Relationships with holistic health indicators unadjusted and adjusted models
Physical health (Table 4 & online supplementary material, Supplemental Table 2)
In unadjusted models, each factor from the Indigenous Nourishment scales was significantly associated with increased odds of adequate fruit and vegetable intake (online supplementary material, Supplemental Table 2). In models adjusting for demographics (Table 4), access to Indigenous Foodways and Participation in Indigenous Foodways remained associated with increased odds of adequate fruit and vegetable intake.
Regression models † predicting holistic health outcomes (n 236)

Spiritual health (Table 4 and online supplementary material, Supplemental Table 3)
In the unadjusted model (online supplementary material, Supplemental Table 3) and models adjusted for demographics (Table 4), each of the Indigenous Nourishment scale factors was significantly positively associated with higher spirituality scores on the CCS.
Emotional health (Table 4 and Supplemental Table 4)
In both the unadjusted models and those adjusting for demographics, each of the Indigenous Nourishment Scale Factors and income (Models 1–4) was significantly positively associated with better emotional health scores.
Relational health (Table 4 and online supplementary material, Supplemental Table 5)
In unadjusted models, each of the Indigenous Nourishment Factors, as well as income, was significantly positively associated with higher social well-being scores (online supplementary material, Supplemental Table 5). The effects of Food Connectedness and Access to Indigenous Foodways on social health remained significantly positively associated in adjusted models.
Discussion
Utilising strengths-based nutrition measures is not only essential for countering deficit-based discourse but also for offering new insights that can inform public health practice, policy and interventions aimed at improving AI/AN health(Reference Bryant, Bolt and Botfield5,Reference Fogarty, Lovell and Langenberg6,Reference Foley and Schubert8,Reference O’Keefe, Maudrie and Cole13,Reference Askew, Brady and Mukandi15,Reference Brough, Bond and Hunt16) and human health generally. In the current study, we refined The Indigenous Nourishment Scales through psychometric testing, providing communities and the nutrition field with an innovative set of measures to evaluate AI/AN nutrition. Each scale captures unique aspects of Indigenous nourishment, contributing to a more holistic understanding of nutrition by recognising the importance of connection to food, food values and access to and participation in traditional foodways for AI/AN peoples. The scales and sub-scales demonstrated strong internal consistency reliability and strong convergent construct validity, making them reliable and valid measures of Indigenous nourishment for use in public health practice and research. Further, this study provides insights into the health of urban AI/ANs, who are often underrepresented in research. Even when compared with studies of other AI/AN populations, our sample had a low percentage of participants who met guidelines for adequate fruit and vegetable intake(Reference Berg, Daley and Nazir36–Reference Jernigan, Duran and Ahn38). At the same time, a large proportion of our participants (50·22 %) reported flourishing positive mental health. This finding is consistent with other studies of AI/AN adults, one of which reported approximately 50 % of their sample as flourishing(Reference Kading, Hautala and Palombi39), and another of which reported a median MHC-SF score of 45(Reference O’Keefe, Grubin and Vaidya40), while our sample reported a mean of 44·85. Although our sample reflected several important health challenges, including low income and high levels of inadequate fruit and vegetable intake, our sample also reported notable strengths and potential protective health factors including high levels of positive mental health flourishing and strong cultural connectedness.
Guided by our theoretical framework, the Indigenous Nourishment Model(Reference Maudrie, Clyma and Nguyen11,Reference Maudrie, Caulfield and Nguyen27) , we selected outcomes aligned with our four domains of nourishment, assessing the impacts of our Indigenous Nourishment Scales on a range of holistic health indicators. This is also a significant contribution to the literature, as much of the nutrition and food-related research in AI/AN communities focuses on physical health outcomes like dietary intake. All factors from the Indigenous Nourishment Scales were significantly and positively associated in unadjusted models with physical, spiritual, emotional and relational health in unadjusted models (online supplementary material, Supplemental Tables 1–4). Most associations remained statistically significant positive associations when adjusting for community, gender and income, indicating that the constructs represented by the Indigenous Nourishment Scales are consistently related to multiple dimensions of well-being in our cross-sectional sample (Table 4). Results from adjusted models (Table 4) further demonstrate that cultural, socio-economic and behavioral factors are interrelated with nutrition and health within our AI/AN sample. For example, physical well-being may be influenced by consumption of traditional/ancestral foods, but access to these important health promoting foods may be limited by economic access, lack of cultural food knowledge, access to land and even urban living conditions, illustrating how cultural, economic, physical and historical factors converge to influence individual health and health promoting behaviours. To summarise, in AI/AN communities, health and health behaviours cannot be understood in isolation from cultural identity, historical context and socio-economic contexts, which together shape food values, food behaviours, dietary patterns and experiences in accessing healthcare.
Some AI/AN communities and researchers have developed measures that capture cultural strengths in nutrition, primarily by assessing traditional food intake or food systems at the community level(Reference Noreen, Johnson-Down and Jean-Claude41–Reference Walch, Loring and Johnson45). Our work builds on these previous measurement efforts, by offering reliable and valid scales that encompass psychosocial relationships with food, food values and beliefs, offering new insights into factors influencing dietary intake at the individual level. These strengths-based measures may provide new insights into potential protective factors for AI/AN health at the individual level.
This research advances the broader movement towards strengths-based health research and shifting the field towards holistic research and preventive interventions to address issues like type 2 diabetes disproportionately impacting AI/AN communities(Reference Bryant, Bolt and Botfield5,Reference Fogarty, Lovell and Langenberg6,Reference Foley and Schubert8,Reference Askew, Brady and Mukandi15) . Our work in measuring and conceptualising nutrition is congruent with ongoing approaches led by Indigenous communities and researchers to address nutrition through holistic approaches and cultural strengths. The Together Overcoming Diabetes intervention was built by and for Indigenous communities and addresses diabetes through a holistic lens which considers spiritual, mental, physical and emotional well-being, an approach aligned with our Indigenous Nourishment Model(Reference Walls, Chambers and Begay46). Further, the Together Overcoming Diabetes intervention centres cultural and family connection, recognising that individual well-being is deeply influenced by relationships with family members and community(Reference Walls, Chambers and Begay46). A recent health intervention, the Go Healthy Indigenous Supported Agriculture Intervention, centred food sovereignty principles and Osage cultural food values as a central focus of the community-supported agriculture intervention(Reference Hayman, Moore-Wilson and Vavra47,Reference Maudrie, Nguyen and Lopez48) . In developing the Osage Mobile Market, Osage community partners describe how multiple perspectives and positions can be woven together to serve the overall goal of food sovereignty of the Osage community, again underlining the importance of considering health holistically through a lens of cultural strengths(Reference Hayman, Moore-Wilson and Vavra47). In addition to advancing the broader field of strengths-based research, the Indigenous Nourishment Scales offer practical tools for program evaluation, clinical screening and community health assessments by more accurately capturing culturally grounded dimensions of nutrition. In clinical settings, dietitians or healthcare providers could use the Indigenous Nourishment Scales as a way to assess holistic nutrition or a way to start a conversation about a patient’s holistic nourishment needs. Future research using these scales may identify protective cultural factors, monitor change over time and assess the cultural relevance of nutrition and wellness interventions. At a policy level, the ability to measure culturally meaningful aspects of Indigenous nourishment creates opportunities for Tribal and urban Indian health organisations to advocate for funding and programming that support traditional foodways, land access, cultural education and food sovereignty initiatives within their communities. By providing psychometric evidence of validity for these community-developed measures, this work supports efforts to align public health practice and policy with Indigenous definitions of nourishment and holistic well-being.
The current study is a first effort to assess the validity and reliability of the Indigenous Nourishment Scales and, as such, is not without limitations. First, this sample was a convenience sample largely gathered through recruitment at community health events, word of mouth and postings at community gathering spaces. Therefore, our sample may represent community members who are more engaged with health and culture-related events and who may experience higher levels of cultural connectedness or better health than the broader urban AI/AN population. This potential selection bias could have contributed to stronger observed associations between the Indigenous Nourishment Scales and well-being outcomes if our sample had disproportionately better health than the wider community. Future studies should recruit from a broader range of community settings to improve representativeness of community-based research and to help us better understand how relationships between Indigenous nourishment and well-being outcomes manifest across broader AI/AN populations. Further, our sample was primarily female, limiting our ability to effectively generalise our results to males, or non-gender binary or Two-Spirit populations. Our assessment of construct validity did not include discriminant validity, meaning we did not evaluate whether the scales unintentionally assessed unrelated constructs. To minimise participant burden in this community-based survey, we did not include measures of theoretically unrelated constructs, limiting our ability to assess discriminant validity. Future research can address this by incorporating unrelated or weakly related psychosocial and behavioral measures to more fully evaluate discriminant validity. Further, our sample included urban AI/AN adults from 2 urban Native communities with whom the Indigenous Nourishment Scales were developed. Despite the sample coming from two urban Native communities, participants and CRCs represented diverse Tribal affiliations, and therefore these measures may have resonance across a variety of AI/AN communities. However this may also mean that our measures lack cultural specificity to strongly apply to any one AI/AN community(Reference Walls, Whitesell and Barlow49). Future work should explore adapting and evaluating these measures in diverse AI/AN populations and age groups. Evaluating these measures in different samples and different age groups may yield additional insights into reliability and validity. A major strength of the current study is the development and validation of the Indigenous Nourishment Scales using a mixed methods Community-Based Participatory Research approach, allowing greater in-depth exploration of nutrition related concepts through multiple lenses. Additionally, using community-developed measures grounded in Indigenous ways of knowing and being, and assessing well-being holistically across physical, spiritual, emotional and relational domains, offers an alternative to research that focuses primarily on physical and emotional health while overlooking the importance of social and spiritual well-being. Our large sample of urban AI/AN adults is also a strength, as urban AI/AN populations remain underrepresented in research, particularly in nutrition studies. Finally, this study was conducted in partnership with two urban AI/AN communities, enhancing the diversity of experiences represented and strengthening the relevance of the findings for urban AI/AN communities across North America.
Conclusions
The Indigenous Nourishment Scales are valid and reliable scales used to assess a range of holistic nourishment topics important to AI/AN communities. These measures, which are theoretically grounded in a mixed methods framework, assess AI/AN nutrition in a way that highlights community strengths, rather than focusing on deficits, and provides direction for developing culturally relevant health interventions. The Indigenous Nourishment Scales expand on existing nutrition measures by conceptualising nutritional health holistically, providing new directions for the field of public health nutrition.
Supplementary material
For supplementary material accompanying this paper visit https://doi.org/10.1017/S1368980026102262
Acknowledgements
We would like to acknowledge and thank the members of the Twin Cities and Baltimore/Washington DC Native communities for their time, insights and efforts in participating in the survey described in this manuscript. This work would not have been possible without the selfless contributions of community members, leaders and organisations such as Native American Lifelines and Native American Community Clinic, who supported the design, recruitment and implementation of this project. We are deeply grateful to our community partners and research team members for their guidance, collaboration and unwavering commitment to ensuring that this work reflects the strengths, brilliance and relational ways of knowing and being that are central to the health of our Indigenous communities.
Financial support
Research reported in this publication was supported by the National Institute of Diabetes And Digestive And Kidney Diseases of the National Institutes of Health under Award Number F31DK135323 (PI: Maudrie). The content is solely the responsibility of the authors and does not necessarily represent the official views of the National Institutes of Health. The research described in this publication was also supported by the Research for Indigenous Social Action and Equity (RISE) Center Research Grant from the University of Michigan/Northwestern University (PI: Maudrie), and the Mathuram Santosham Endowed Chair in Native American Health at the Johns Hopkins University Center for Indigenous Health. Support for this article was provided in part by the Robert Wood Johnson Foundation. The views expressed here do not necessarily reflect the views of the Foundation. These funding sources had no role in the study design, data collection, data analysis, interpretation of data, writing of the article or the decision to submit this work for publication.
Competing interests
None.
Authorship
Conceptualisation, T.L.M., K.H.L., A.S. and V.M.O.; methodology, T.L.M, V.M.O. and D.H.; formal analysis, T.L.M. and D.H.; investigation, T.L.M. and V.M.O.; data curation, T.L.M. and D.H. writing – original draft preparation, T.L.M., writing – review and editing, D.H., L.E.C., J.M.M., L.R.M., J.D., J.V., B.L., A.N., K.H.L., A.S., V.B.B.J., M.L.W. and V.M.O.; supervision, V.M.O. and D.H.; project administration, T.L.M.; funding acquisition, T.L.M., V.M.O. and M.L.W. All authors have read and agreed to the published version of the manuscript.
Ethics of human subject participation
This study was conducted according to the guidelines laid down in the Declaration of Helsinki, and all procedures involving research study participants were approved by the the Institutional Review Board of the Johns Hopkins Bloomberg School of Public Health (IRB00026314; 5/15/2024). Written informed consent was obtained from all participants involved in the study.


 Open access