

Japan is a healthy longevity country( 1 , 2 ), and one of the factors is the influence of the ‘Japanese diet’, which refers to the unique and distinct dietary lifestyle of Japanese people. The Japanese diet is diverse and rich in rice and traditional foods such as fish, vegetables and soyabeans, as well as meat, milk, oils and fruits( 3 ). In addition, the Japanese diet includes abundant amounts of fermented foods, seaweed and green tea, which have high health benefits; thus, the characteristic components of the Japanese diet have been studied worldwide( Reference Rains, Agarwal and Maki 4 – Reference Buckley and Howe 6 ).
We have focused on the health benefits of the Japanese diet and we have performed several studies in animals using a reproduced and cooked Japanese diet. In one study, we created 1-week menus of the modern Japanese and modern American diets, based on dietary intake surveys conducted in each country. The prepared diets were freeze-dried, powdered and fed to rats, after which DNA microarray analysis of liver gene expression was performed. The results showed lower expression of stress-response genes and higher expression of energy, glucose and lipid-metabolism-related genes in rats fed the modern Japanese diet compared with those fed the modern American diet( Reference Tsuduki, Takeshika and Nakamura 7 ). These findings suggest that the Japanese diet decreases stress and is less likely to cause obesity owing to stimulation of metabolism compared with the American diet, and provide evidence that the Japanese diet is effective for maintenance of health.
Because the contents of the Japanese diet have been greatly altered by Western influence in the past 50 years, we created 1-week menus of Japanese diets from 2005, 1990, 1975 and 1960 based on the National Health and Nutrition Survey (NHNS), and fed these diets in freeze-dried, powdered form to mice to examine their effects on health( Reference Honma, Kitano and Kijima 8 , Reference Kitano, Honma and Hatakeyama 9 ). The weight of visceral fat and the average size of adipocytes were lowest in mice fed the 1975 diet. In DNA microarray analysis of liver gene expression, the levels of glucose and lipid-metabolism-related genes were highest in mice fed the 1975 diet. These results show that the 1975 diet suppresses accumulation of visceral fat and is the least likely to cause obesity among Japanese diets from different eras. We also made diets that reproduced the protein, fat, carbohydrate (PFC) energy balance of the Japanese diet from the four different eras using a single purified material (milk casein, soyabean oil, maize starch) for protein, lipid and carbohydrate, respectively. Feeding of these diets to mice resulted in no difference in visceral fat weight among the groups. This suggests that obesity control by the Japanese diet does not depend on PFC balance, and that quality (components) is important. Our subsequent study in senescence accelerated mice showed that the 1975 Japanese diet also has beneficial effects of maintaining learning memory, lengthening life span and delaying ageing( Reference Honma, Kitano and Kijima 8 , Reference Yamamoto and ES, Hatakeyama 10 ). Thus, several health benefits of the Japanese diet have been shown in previous studies, but there is still limited evidence from epidemiological studies and a lack of detailed information on composition( Reference Sasaki 11 , 12 ).
AIN-93 is a standard diet of composition published by the American Institute of Nutrition (AIN) that is used in animal experiments worldwide. The AIN-93G composition is based on the nutritional requirements of mice and rats for growth, pregnancy and lactation for 1 year after birth, and on the diet published by the National Research Council of the National Academy of Sciences( 13 ). A diet with an altered composition of AIN-93G has been developed to imitate the typical American diet, and is used as an obesity-inducing diet( 14 , 15 ). This Western diet is sold by feed manufacturers and can be used easily for animal experiments. In contrast, there is no standardised Japanese diet for use in experiments. Therefore, we would like to develop a standardised Japanese diet to facilitate studies of the dietary lifestyle of Japanese people worldwide.
As mentioned above, we prepared a Japanese diet for animal experiments by creating a 1-week menu of the Japanese diet based on the NHNS under the guidance of a registered dietitian. However, the freeze-drying and powdering method is difficult and time-consuming, and thus is not suitable for standardisation. Therefore, in this study, we aimed to mimic the Japanese diet using a purified diet that reproduces the characteristics of the Japanese diet using readily available materials and a simpler composition with a focus on quality components. First, we created a 1-week menu (for twenty-one meals) of the 1975 Japanese diet based on the NHNS. This diet was prepared, freeze-dried and powdered. Next, we mimicked the Japanese diet by changing the balance of protein, fat and carbohydrate of AIN-93G, based on the measured values in the 1975 Japanese diet( Reference Kitano, Honma and Hatakeyama 9 ) and using materials with reference to the NHNS( 16 ). Then, these two diets were fed to mice to examine whether they had characteristics of the Japanese diet, including that it is less likely to cause obesity.
Methods
Preparation of test diets
To develop a standard Japanese diet for animal experiments, a mimic diet with a simpler composition was made with the goal of reproducing the characteristics of the Japanese diet using readily available materials. The mimic diet was modelled on the 1975 Japanese diet because this particular diet has the strongest effect on suppression of obesity.
To compare the mimic diet and the 1975 Japanese diet (1975 diet), the 1975 diet was prepared( Reference Tsuduki, Takeshika and Nakamura 7 – Reference Kitano, Honma and Hatakeyama 9 , Reference Yamamoto and ES, Hatakeyama 10 ) and used as a test diet. A 1-week menu (twenty-one meals) (online Supplementary Table S1) of the 1975 diet was prepared based on the NHNS under the guidance of a registered dietitian, as previously described( 16 ). The diet was then freeze-dried in a vacuum freeze dryer (FD-550 R; Tokyo Rikakikai) and homogenised by grinding and stirring. The nutritional composition (fat, protein, moisture, ash, carbohydrate and energy) of the prepared diet was determined to confirm the actual values (Table 1). Fat was determined by acid digestion; protein by a modified Dumas method (Sumigraph NC analyzer NC-220 F; Sumika Chemical Analysis Service); moisture by vacuum oven drying; ash by direct ashing; and carbohydrate by subtracting the fat, protein, moisture and ash contents from the total amount( Reference Honma, Kitano and Kijima 8 , 17 ). The energy content was calculated by applying modified Atwater factors (16·7, 37·7 and 16·7 kJ/g for protein, fat and carbohydrate, respectively)( 17 ).
Nutritional compositions of test dietsFootnote *
AIN, AIN-93G; WD, Western diet.
* The 1975 Japanese diet prepared according to the menu was freeze-dried, powdered and fed to mice as a test diet. The measured value was obtained by measuring the whole diet after cooking used in this study.
The measured value of the nutritional composition of the 1975 diet was used for adjustment of the mimic Japanese diet. The balance of protein, fat and carbohydrate in AIN-93G was changed to match the values in the 1975 diet( Reference Kitano, Honma and Hatakeyama 9 ) (Table 1), and materials were selected with reference to the NHNS( 16 ) (Table 2). The percentages of protein and fat from animal and vegetable sources were determined based on NHNS nutrient intake data. In the mimic diet, soyabean protein (CLEA Japan) was used as vegetable protein; milk casein (Wako Pure Chemical) and egg-white powder (CLEA Japan) as animal protein; soyabean oil (Wako Pure Chemical) as vegetable fat; lard (Megmilk Snow Brand) and fish oil (Maruha Nichiro) as animal fat; and granulated sugar, pregelatinised maize starch, rice starch (Takai shokuhin), wheat starch (Maruri Mizutani) and potato starch (Maruri Mizutani) as carbohydrate. The percentages of milk casein and egg-white powder (animal protein), lard and fish oil (animal fat), and rice starch, wheat starch and potato starch (carbohydrate) were determined by calculating the percentages of milk, egg, meat and seafood in animal foods, and rice, wheat and potato in cereals from NHNS food group intake data.
Diet compositions of AIN-93G and mimic Japanese diet (g/100 g)
AIN, AIN-93G; WD, Western diet.* or ** AIN-93G-MX or S10001.† or †† AIN-93VX or V10001.
Animals
All animal procedures were performed in accordance with the Animal Experiment Guidelines of Tohoku University, and the animal protocol was approved by the Animal Use Committee at Tohoku University (2016AgA-009)( Reference Yamamoto and ES, Hatakeyama 10 , Reference Tsuduki, Yamamoto and Hatakeyama 18 ). The control groups in the experiment were given AIN-93G or Western diet (Tables 1 and 2). Institute of Cancer Research (ICR) mice (4 weeks, male; CLEA Japan) were fed a standard laboratory diet (CE-2) for 1 week before the study, after which they were randomly divided into four groups of twelve mice, such that the average body weights in the groups were similar. Mice were fed the 1975 Japanese diet (group JD), mimic Japanese diet (group mJD), a Western diet (group WD) or a AIN-93G diet (group AIN) and were given free access to their respective diet and distilled water in a temperature- and humidity-controlled room with a 12 h light–12 h dark cycle. At the end of the 4-week period, the mice were weighed and blood samples were collected by decapitation. Brain, heart, lungs, liver, spleen, pancreas, kidneys and white adipose tissues were removed and weighed. Serum and organs were stored at −80°C until use.
Biochemical analyses in serum and liver
The lipid compositions in the liver and serum were measured as described previously( Reference Tsuduki and Yamamoto 19 , Reference Yamamoto and Hatakeyama 20 ). TAG and total cholesterol (TC) levels in serum and liver, and phospholipid (PL), glucose, alanine aminotransferase (ALT) and aspartate transaminase (AST) levels in serum, were measured using commercial enzyme kits (Wako Pure Chemical) according to the manufacturer’s protocol. Insulin level in serum was determined using ELISA kit (Morinaga Institute of Biological Science) according to the manufacturer’s protocol. PL level in liver was determined using the method described by Rouser et al.( Reference Rouser, Fleischer and Yamamoto 21 ).
Histological analysis
For histological analysis of liver and white adipose tissue, liver and epididymal adipose tissue were fixed in 10 % formalin and embedded in paraffin( Reference Takasaki, Honma and Yanaka 22 ). Vertical sections (5 μm) were cut, mounted on a glass slide, stained with haematoxylin–eosin (HE) and observed using a microscope (BZ-9000; Keyence). The mean area of adipocytes in each group was calculated and compared( Reference Takasaki, Honma and Yanaka 22 ).
mRNA expression analysis
For real-time quantitative RT PCR (qRT-PCR), total RNA was isolated from liver using an RNeasy Mini Kit (Qiagen)( Reference Tsuduki, Yamamoto and Hatakeyama 18 , Reference Tsuduki, Kikuchi and Kimura 23 ), eluted with 40 μl of RNase-free water and stored at −80°C until use. To quantify the expression levels of genes, the mRNA levels for β-actin, cytoplasmic (Actb), acyl-coenzyme A oxidase 1, palmitoyl (Aco), carnitine palmitoyltransferase 1β (Cpt1), carnitine palmitoyltransferase 2 (Cpt2), cytochrome P450, family 7, subfamily a, polypeptide 1 (Cyp7a1), fatty acid synthase (Fas), Glut2, glycerol kinase (Gk), glucose-6-phosphate dehydrogenase X-linked (G6pdx), 3-hydroxy-3-methylglutaryl-coenzyme A reductase (Hmgcr), heat shock protein 70 (Hsp70), malic enzyme (Me), cyclin-dependent kinase inhibitor 1 (p21), Pparα and sterol regulatory element binding factor 1 (Srebp1c) in liver were determined with a Thermal Cycler Dice Real Time System® (Takara Bio). This system allows real-time quantitative detection of PCR products by measuring the increase in fluorescence caused by binding of SYBR green to double-stranded DNA( Reference Honma, Shinohara and Ito 24 , Reference ES, Kijima and Honma 25 ). In brief, complementary DNA (cDNA) was made using Prime Script® RT Master Mix (Perfect Real Time) (Takara Bio) from total RNA in liver. The cDNA was subjected to PCR amplification using SYBR® Premix Ex TaqTM (Perfect Real Time) and gene-specific primers for Actb, Aco, Cpt1, Cpt2, Cyp7a1, Fas, Glut2, Gk, G6pdx, Hmgcr, Hsp70, Me, p21, Pparα and Srebp1c (online Supplementary Table S2). The PCR amplification was performed with an activation step at 95°C for 10 s, followed by forty cycles at 95°C for 5 s (denaturation) and 60°C for 31 s (extension), and a dissociation stage at 95°C for 15 s, 60°C for 30 s and 95°C for 15 s for each gene. Melting curve analysis was performed following each reaction to confirm the presence of only a single reaction product. The threshold cycle (C T ) represents the PCR cycle at which an increase in reporter fluorescence above a baseline signal can first be detected. The ratio among the Actb content in test samples was defined as the normalisation factor( Reference Honma, Tsuduki and Sugawara 26 ).
Enzymatic activity analysis
The activities of hepatic enzymes (FAS (EC 2.3.1.85), glucose-6-phosphate dehydrogenase (G6PDH, EC 1.1.1.49), ME (EC 1.1.1.39), ACO (EC 1.3.3.6)) and CPT (EC 2.3.1.21) were basically measured, as described previously( Reference Ide, Kobayashi and Ashakumary 27 – Reference Tsuduki, Nakamura and Honma 29 ). Liver was homogenised with 0·25 mol/l sucrose containing 1 mmol/l EDTA and 10 mmol/l TRIS-HCl buffer (pH 7·4), and then centrifuged at 700 g for 10 min to eliminate nuclei and obtain a whole liver homogenate. The supernatant fraction was centrifuged at 45 000 rpm for 60 min to obtain a cytosol fraction. The whole liver homogenate was used for the measurement of the activity of ACO and CPT, whereas the cytosol fractions were used for measuring the activity of FAS, G6PDH and ME. All enzymatic activities were spectrophotometrically measured. The FAS activity was measured by the reduction of NADPH, using acetyl-CoA and malonyl-CoA as substrates. The G6PDH and the ME activity was measured by the increase of NADPH, using glucose-6-phosphate and malic acid as substrates, respectively. The ACO activity was estimated as the level of hydrogen peroxide produced during the oxidation of palmitoyl CoA when peroxidase was added with palmitoyl CoA. The CPT activity was determined by the reaction of DTNB (5,5'-dithio-bis-(2-nitrobenzoic acid)) and CoA released after adding palmitoyl CoA and l-carnitine.
Statistical analysis
Power analysis estimated that forty-eight mice (twelve mice/group) were required to obtain a power of 0·08, when the effect size was large (0·50) and a significance level of 0·05 was used( Reference Cohen 30 , Reference Poland, Rubin and Morton 31 ). Results were expressed as mean values with their standard errors. Data were analysed by a one-way ANOVA with a Tukey–Kramer post hoc test. A difference was considered to be significant at P<0·05. All statistical analyses were performed using Ekuseru–Toukei 2012 (SSRI).
Results
Growth parameters
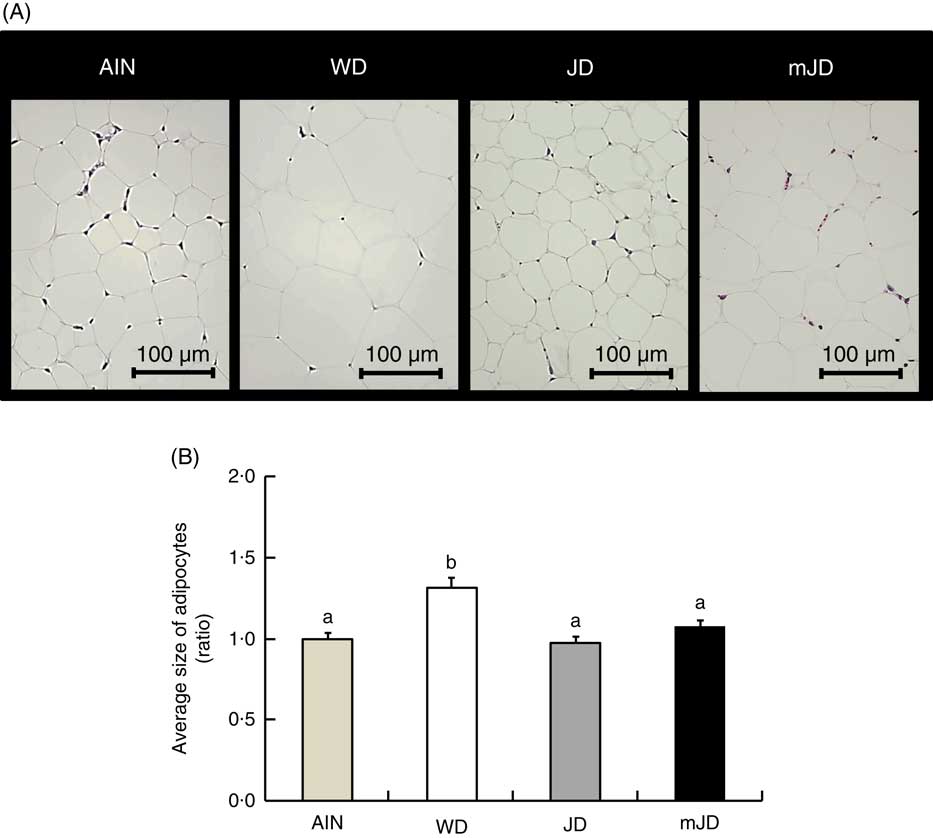
There was no significant difference in final body weight in group mJD compared with groups AIN, WD and JD (Table 3). Food and energy intakes did not differ significantly between groups mJD and JD, and food intake was significantly lower in groups mJD and JD compared with group AIN, and energy intake was significantly lower in group mJD compared with groups WD and AIN. Liver weight in groups mJD and JD was significantly lower than in group WD. Kidney weight in group WD was significantly lower than in groups AIN and JD. There were no significant differences in weights of mesenteric and epididymal adipose tissues among groups mJD, JD and AIN, whereas these weights were significantly lower than in group WD. There were no significant differences in other tissue weights in group mJD compared with groups AIN, WD and JD. Histological analysis performed by HE staining of epididymal adipose tissue showed that adipocytes in groups mJD and JD were smaller than those in group WD (Fig. 1(A)). There was no significant difference in the average sizes of adipocytes in groups mJD, JD and AIN, whereas these average sizes of adipocytes were significantly smaller than in group WD (Fig. 1(B)). These results show that the mimic Japanese diet and the 1975 Japanese diet are hard to accumulate visceral fat.
Effects of the mimic Japanese diet (mJD) and the 1975 Japanese diet (JD) on white adipose tissue in mice. (A) Epididymal adipose tissue sections from representative mice of each group (haematoxylin–eosin, scale bar=100 μm). (B) Average size of adipocytes in epididymal adipose tissue. Values are means (n 12), with their standard errors represented by vertical bars. AIN, AIN-93G; WD, Western diet. a,b Mean values with unlike letters were significantly different (P<0·05).
Body weights, food intake and tissue weights (Mean values with their standard errors; n 12/group)
AIN, AIN-93G; WD, Western diet; JD, Japanese diet; mJD, mimic Japanese diet.
a,b,c Mean values within a row with unlike superscript letters were significantly different (P<0·05).
Biochemical parameters in serum and liver
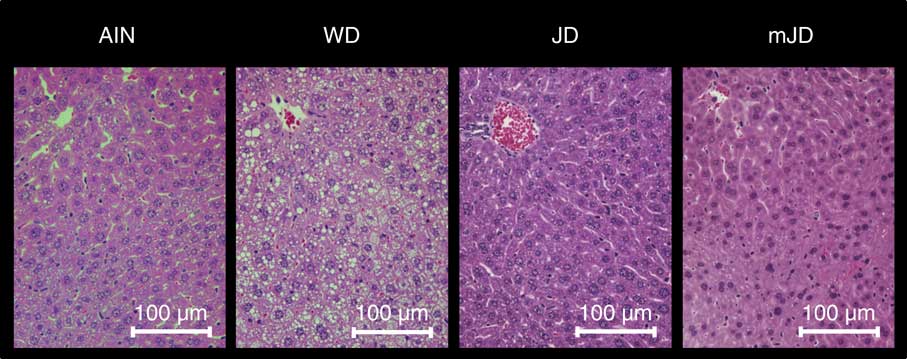
The serum TAG level in the mJD and JD groups was significantly lower than that in the AIN group, but did not differ significantly from that in the WD group (Table 4). The serum TC level in the mJD, JD and AIN groups was significantly lower than that in the WD group. There were no significant differences in serum PL and glucose level in the mJD, JD, WD and AIN groups. Serum insulin level and the homeostasis model assessment of insulin resistance (HOMA-IR), an index of insulin resistance, in the mJD group were not significantly different from those in the AIN, WD and JD groups, but those in the JD group were significantly lower than in the WD group. The serum ALT level in the mJD and JD groups was significantly lower than that in the AIN group. There was no significant difference in serum AST level in the mJD group compared with the JD, AIN and WD groups. Liver TAG level in the mJD and JD groups was significantly lower than that in the AIN and WD groups. Liver TC level in the mJD, JD and AIN groups was significantly lower than that in the WD group. The liver PL level in the mJD, JD and AIN groups was significantly higher than that in the WD group. Histological analysis using HE staining of liver tissue showed that there was little lipid accumulation in hepatocytes in the mJD and JD groups (Fig. 2). These results show that the mimic Japanese diet and the 1975 Japanese diet are hard to accumulate fat in the liver.
Effects of the mimic Japanese diet (mJD) and the 1975 Japanese diet (JD) on liver in mice. Liver sections from representative mice of each group (haematoxylin–eosin, scale bar=100 μm). AIN, AIN-93G; WD, Western diet.
Biochemical parameters of serum and liver (Mean values with their standard errors; n 12/group)
AIN, AIN-93G; WD, Western diet; JD, Japanese diet; mJD, mimic Japanese diet; TC, total cholesterol; PL, phospholipid; ALT, alanine aminotransferase; AST, aspartate aminotransferase.
a,b Mean values within a row with unlike superscript letters were significantly different (P<0·05).
mRNA expression in the liver
To investigate the mechanism of change in lipid metabolism system in the mJD and JD group, the expression levels of lipid-metabolism-related genes in the liver, which plays a central role in lipid metabolism, were measured by qRT-PCR. The levels of G6pdx and Me, which are related to fatty acid synthesis, were significantly higher in the mJD group compared with the JD, AIN and WD groups, whereas the level of Srebp1c, which is related to fatty acid synthesis, were significantly lower in the mJD group compared with the WD group (Table 5). The level of Aco, which is related to fatty acid β-oxidation, in the mJD group was not significantly different from that in the AIN, WD and JD groups, but that in the JD group was significantly higher than in the WD group. The levels of Cpt1 and Cpt2, which are related to fatty acid β-oxidation, in the mJD and JD groups were significantly higher than in the AIN and WD groups. The level of Pparα, which is related to fatty acid β-oxidation, in the JD group was significantly higher than in the mJD, AIN and WD groups. The level of Hmgcr, which is related to cholesterol synthesis, in the mJD group was significantly higher than in the JD, AIN and WD groups. The level of Cyp7a1, which is related to cholesterol catabolism, in the mJD group was significantly lower than in the AIN group and showed no significant difference compared with the JD and WD groups. These results show that the mimic Japanese diet and the 1975 Japanese diet altered expression of many lipid-metabolism-related genes, in particular, activates the β-oxidation system. In addition, energy and glucose metabolism and stress-response-related genes, which are known to change by the 1975 Japanese diet, were measured. The levels of Glut2 and Gk, which are related to energy and glucose metabolism, were significantly higher in the JD and mJD groups compared with the AIN and WD groups (Table 5). The level of p21, which is a stress-response-related gene, was significantly lower in the AIN, JD and mJD groups compared with the WD group. The level of Hsp70, which is a stress-response-related gene, was significantly lower in the AIN, JD and mJD groups compared with the WD group and was significantly lower in the JD group compared with the AIN and mJD groups. These results show that the mimic Japanese diet and the 1975 Japanese diet promoted expression of energy and glucose-metabolism-related genes and reduced the expression of stress-response-related genes.
mRNA expression level in liver (Mean values with their standard errors; n 12/group)
AIN, AIN-93G; WD, Western diet; JD, Japanese diet; mJD, mimic Japanese diet; Fas, fatty acid synthase; G6pdx, glucose-6-phosphate dehydrogenase X-linked; Me, malic enzyme; Srebp1c, sterol regulatory element binding factor 1; Aco, acyl-coenzyme A oxidase 1, palmitoyl; Cpt1, carnitine palmitoyltransferase 1β; Cpt2, carnitine palmitoyltransferase 2; Hmgcr, 3-hydroxy-3-methylglutaryl-coenzyme A reductase; Cyp7a1, cytochrome P450, family 7, subfamily a, polypeptide 1; Gk, glycerol kinase; p21, cyclin-dependent kinase inhibitor 1; Hsp70, heat shock protein 70.
a,b,c Mean values within a row with unlike superscript letters were significantly different (P<0·05).
Enzyme activity analysis
As there was a difference in expression levels of lipid-metabolism-related genes in liver, the activities of fatty acid metabolism-related enzymes were measured. The activity of FAS, which is related to fatty acid synthesis, did not differ significantly among the mJD, JD and AIN groups, but was significantly lower in the mJD and JD groups compared with the WD group (Table 6). The activity of ME, which is related to fatty acid synthesis, in the mJD group was significantly higher than in the JD and AIN groups and did not differ significantly from that in the WD group. The activity of ACO, which is related to fatty acid β-oxidation, in the mJD was significantly lower than in the JD group and did not differ significantly from that in the WD and AIN groups. The activity of CPT, which is related to fatty acid β-oxidation, in the mJD group was significantly higher than in the WD group and did not differ significantly from that in the JD and WD groups. These results suggest that the mimic Japanese diet and the 1975 Japanese diet reduce accumulation of visceral and liver fat by suppressing fatty acid synthesis and promoting fatty acid catabolism.
Hepatic enzyme activity (Mean values with their standard errors; n 12/group)
AIN, AIN-93G; WD, Western diet; JD, Japanese diet; mJD, mimic Japanese diet; FAS, fatty acid synthase; G6PDH, glucose-6-phosphate dehydrogenase; ME, malic enzyme; ACO, acyl-CoA oxidase; CPT, carnitine palmitoyltransferase.
a,b,c Mean values within a row with unlike superscript letters were significantly different (P<0·05).
Discussion
The aim of this study was to prepare a purified mimic Japanese diet with the characteristics of the Japanese diet using easily available materials with a simpler composition and a focus on quality, with the goal of facilitating future studies using the mimic diet in animal experiments.
In this study, we examined whether the mimic diet had a key characteristic of the 1975 Japanese diet of being less likely to cause obesity. The visceral fat weight in mice fed the mimic diet was similar compared with those fed AIN-93G and lower than in mice fed a Western diet. Adipocytes were smaller with the mimic diet compared with the Western diet, and liver weight and TAG and TC levels were lower with the mimic diet, with little lipid accumulation in hepatocytes. These results show that the mimic diet suppresses visceral and liver fat accumulation compared with the Western diet. To investigate the mechanism, expression levels of lipid-metabolism-related genes in liver were measured. In mice fed the mimic diet, mRNA levels for G6pdx and Me, which are related to fatty acid synthesis, were higher than those in the other three groups; mRNA levels for Cpt1 and Cpt2, which are related to fatty acid β-oxidation, were similar to those in the 1975 diet and higher than those in mice fed the AIN-93G and Western diets; the mRNA level for Hmgcr, which is related to cholesterol synthesis, was higher than those in the other three groups; and the mRNA level for Cyp7a1, which is related to cholesterol catabolism, was lower than that in mice fed the AIN-93G diet. The proteins encoded by G6pdx and Me promote fatty acid synthesis by supplying NADPH( Reference Thomas, Cherest and Surdin-Kerjan 32 ), whereas those encoded by Cpt1 and Cpt2 are transported to the mitochondrial membrane, where they promote fatty acid β-oxidation of long-chain fatty acids in mitochondria( Reference van der Leij, Huijkman and Boomsma 33 ). The protein encoded by Hmgcr is involved in one of the rate-limiting steps in the mevalonate pathway that synthesises cholesterol( Reference Lindgren, Luskey and Russell 34 ), and that encoded by Cyp7a1 has an important role in cholesterol metabolism by converting cholesterol to 7-α-hydroxycholesterol, the first step and the rate-limiting step in bile acid synthesis( Reference Cohen, Cali and Jelinek 35 ). Therefore, the mimic Japanese diet activated expression of many lipid-metabolism-related genes.
As there was a difference in expression levels of lipid-metabolism-related genes in liver, the activities of fatty acid metabolism-related enzymes were measured. With the mimic diet, the activity of FAS, which is related to fatty acid synthesis, was similar to those for the 1975 and AIN-93G diets and lower than in the Western diet; that of G6PDH, which is related to fatty acid synthesis, was similar to those for the Western and AIN-93G diets and higher than in the 1975 diet; that of ACO, which is related to fatty acid β-oxidation, was similar to those for the Western and AIN-93G diets and lower than in the 1975 diet; and that of CPT, which is related to fatty acid β-oxidation, was similar to those for the 1975 and AIN-93G diets and higher than in the Western diet. FAS is the rate-limiting enzyme that catalyses the synthesis of long-chain SFA such as palmitate from acetyl-CoA and malonyl-CoA in the presence of NADPH( Reference Alberts, Strauss and Hennessy 36 ), and ACO is the first enzyme in the fatty acid β oxidation pathway( Reference Hashimoto, Fujita and Usuda 37 ). These results suggest that the mimic diet reduces accumulation of visceral and liver fat by suppressing fatty acid synthesis and promoting fatty acid catabolism. Soya protein lowers serum insulin and prevents type 2 diabetes( Reference Acsencio, Torres and Isoard-Acosta 38 ). As the blood insulin level decreases, expression of Srebp1c, which is insulin sensitive, decreases and fatty acid synthesis in the liver is suppressed. The protein encoded by Srebp1c is a transcription factor that regulates genes required for glucose metabolism and fatty acid and lipid production, and its expression is regulated by insulin( Reference Ferré and Foufelle 39 ). Soya protein also induces expression of Cpt1 and accelerates inflow of fatty acids into mitochondria, thereby promoting fatty acid β oxidation( Reference Takahashi 40 ). Fish oil also decreases expression of Srebp1c, thereby suppressing fatty acid synthesis, and increases expression of Cpt1 via activation of Pparα, thereby promoting fatty acid β-oxidation( Reference Takeuchi, Yahagi and Izumida 41 – Reference Komprda 43 ). The protein encoded by Pparα is a ligand-activated transcription factor involved in the regulation of lipid homoeostasis such as fatty acid β-oxidation( Reference Latruffe and Vamecq 44 ). Because the mimic Japanese diet used soya protein as the vegetable protein, and fish oil as the seafood animal fat, the mimic diet may suppress fatty acid synthesis by decreasing FAS activity, and promote fatty acid β-oxidation by increasing CPT activity and promoting inflow of fatty acids into mitochondria. In addition, energy intake was similar to that with the 1975 diets and lower than with the Western and AIN-93G diets. This suggests that the Japanese diet can produce satiation, even with low energy intake. A further study is needed to clarify the mechanism of this phenomenon. All of the above results show that the mimic Japanese diet has one of the key characteristics of the 1975 Japanese diet of being less likely to cause obesity.
This study shows that both the mimic and 1975 Japanese diets reduce accumulation of visceral and liver fat by suppressing fatty acid synthesis and promoting fatty acid catabolism. However, there may be differences in mechanisms between the two diets. FAS and G6PDH, which are fatty acid synthesis systems, showed stronger enzymatic activity in the JD group compared with the mJD group. ACO, a fatty acid β oxidation system, showed stronger activity in the JD group compared with the mJD group, but CPT showed weak activity in the JD group. On the other hand, mRNA levels of G6pdx and Me, which are fatty acid synthesis systems, and Hmgcr, a cholesterol synthesis system, were increased in the mJD group. The mRNA level of Pparα, a lipid catabolism system, was increased in the JD group. These differences are likely to be due to the different components in the two diets. The mimic diet contained three kinds of protein, three kinds of fat and six kinds of carbohydrates, with soyabean protein used as vegetable protein and fish oil used as seafood animal fat. Thus, there are fewer foodstuffs and materials with physiological activities in the mimic diet. The 1975 diet also contains many unpurified materials. In our recent study, the characteristic components in the 1975 diet were identified using MS and PCA of Japanese diets from 1960, 1975, 1990 and 2005( Reference Iwagaki, Sakamoto and Sugawara 45 ). This analysis identified histidine, naringin, pyridoxamine, catechin, Cr, B, isoleucine, arachidonic acid, glycitein, stearidonic acid, daidzein, tyramine and leucine as key components of the 1975 diet. Histamine can act as a hormone in the brain to stimulate the satiety centre and naturally reduce appetite and visceral fat. However, histamine itself cannot cross the blood–brain barrier, and thus the health benefit of direct histamine intake is likely to be low. In contrast, histidine, an amino acid, can cross the blood–brain barrier and is then converted into histamine in the brain. Naringin is a polyphenol flavanone glycoside that is contained in citrus fruit and promotes lipid metabolism in serum and liver. Pyridoxamine is a water-soluble vitamin B6 compound that is found in vegetables and cereals, and improves obesity-related diseases such as metabolic dysfunction, insulin resistance and adipose tissue inflammation. Catechin is a polyphenol that is found in apples, citrus fruits and tea, and promotes weight loss, metabolic syndrome alleviation and prevention of diabetes and CVD. Cr is an essential trace element that is found in seafood and seaweed, and improves lipid metabolism. B is an essential trace element for plants that is present in vegetables at high levels and is found in legumes, fruits and marine algae. B-containing compounds improve lipid homoeostasis. Isoleucine is an essential amino acid that is present in dairy products and fish, and suppresses lipid accumulation in tissues. Arachidonic acid is a free fatty acid that is found in eggs, meat, fish and shellfish. Arachidonic acid affects the taste of food, and in sensory testing vegetable oil with addition of lipids containing arachidonic acid or chicken fat containing a high level of arachidonic acid were found to taste delicious. However, arachidonic acid is also a proinflammatory factor with a positive correlation with circulating levels of cholesterol and TAG. Therefore, the health benefit of arachidonic acid intake may be low. Glycitein and daidzein are isoflavone flavonoids found in soya foods. Glycitein and daidzein are aglycones, but isoflavones are mostly present as glycosides in soyabeans. However, in fermented foods such as miso and soya sauce, the sugar is removed to form the aglycone compounds. In a comparative study of aglycones and glycosides, aglycones were found to have better absorption than glycosides and to improve lipid metabolism in liver( Reference Izumi, Piskula and Osawa 46 ). Stearidonic acid is an n-3 PUFA (similar to EPA and DHA) that is present in vegetable oils and seaweed. Animal studies have shown that ingestion of stearidonic acid increases the levels of EPA, docosapentaenoic acid and DHA in tissues, which suggests that stearidonic acid intake could be beneficial to health( Reference Surette 47 ). Tyramine is an amine contained in seafood (including processed products), cheese, miso and soya sauce that is mainly produced by microorganisms involved in fermentation. Tyramine is a causative substance in food poisoning, and thus food with high tyramine levels is a potential concern. Miso and soya sauce contain a large amount of tyramine, but these foods are ingested multiple times each day and are not considered to be a problem, at least in healthy people. However, the health benefits of tyramine are likely to be low. Leucine is an essential amino acid found in dairy products, fish, shellfish and meat that improves mitochondrial dysfunction and metabolic abnormalities. These components are contained in the 1975 Japanese diet, but are not included in the mimic Japanese diet. Thus, there are several physiologically active ingredients with different mechanisms in the 1975 diet, and the effect of this diet on suppressing obesity may be due to a combination of the effects of these ingredients.
In the current study, serum insulin and HOMA-IR in mice fed the 1975 diet tended to be lower than with the other diets, which suggests that the 1975 diet is less likely to cause insulin resistance. HOMA-IR in mice fed the mimic diet also tended to be lower than with the AIN and WD groups, but was not as low as that with the 1975 diet. The mRNA levels of Glut2, which play an important role in glucose uptake into cells( Reference Bell, Kayano and Buse 48 ) and Gk, an important enzyme in sugar metabolism( Reference Kawai, Mukai and Mori 49 ), were higher in mice fed the 1975 diet, indicating that energy and glucose metabolism were activated. This suggests that the 1975 diet strongly incorporates glucose into cells and activates energy and glucose metabolism, thereby increasing insulin sensitivity. This may be an effect of some of the beneficial components in the 1975 diet, as indicated above( Reference Iwagaki, Sakamoto and Sugawara 45 ). Furthermore, with the mimic diet, serum TC was similar compared with the AIN-93G and 1975 diets, and lower compared with the Western diet. This suggests that cholesterol was not present in the mimic diet. Actually, the TC level and mRNA levels of cholesterol metabolism-related genes in the liver were lower with the mimic diet, which indicates movement in the direction of accumulation of cholesterol. Therefore, it is desirable to add an appropriate amount of cholesterol to the mimic diet to bring it closer to the 1975 Japanese diet.
Our previous study showed lower expression of stress-response genes and higher expression of energy, glucose and lipid-metabolism-related genes in rats fed the modern Japanese diet compared with those fed the modern American diet( Reference Tsuduki, Takeshika and Nakamura 7 ). In the current study, the levels of stress-response genes (p21 and Hsp70) in the JD and mJD groups were lower than in the WD group, whereas the levels of energy, glucose and lipid-metabolism-related genes in the JD and mJD groups were higher than in the WD group. Expression of p21 and Hsp70 is increased when cells are under stress( Reference Rodriguez and Meuth 50 , Reference Matsuda, Hoshino and Yamashita 51 ). The levels of stress-response genes in mice fed the mimic diet were lower than those in mice fed the Western diet, but the mimic diet was not as effective as the 1975 diet. This also may be due to effects of some of the beneficial components included in the 1975 diet indicated above( Reference Iwagaki, Sakamoto and Sugawara 45 ).
Conclusions
In this study, the results show that all mechanisms of the 1975 diet were not fully reproduced by the mimic diet, but this diet has key characteristics of the 1975 diet in that it reduces accumulation of visceral and liver fat by suppressing fatty acid synthesis and promoting fatty acid catabolism. Therefore, the mimic diet has potential for use as a simplified standard Japanese diet in animal experiments.
Acknowledgements
This study was supported by grants from Integration Research for Agriculture and Interdisciplinary Fields and Integration Development Research for Agriculture and Interdisciplinary Fields, Ministry of Agriculture, Forestry and Fisheries of Japan and The Canon Foundation.
The authors’ contributions are as follows: Y. M., Y. S., K. Y. and T. T. was the principal investigator and contributed to the study design, interpretation of the findings and data analyses and wrote the manuscript; S. S. and Y. I. contributed to the confection of diets and carried out data analyses. All authors have read and approved the final version of the manuscript.
The authors declare that there are no conflicts of interest.
Supplementary material
For supplementary material/s referred to in this article, please visit https://doi.org/10.1017/S0007114517002793


