





Introduction
Winter weed control in dormant warm-season turfgrass systems is a critical concern for turfgrass managers. When warm-season turfgrasses are dormant, winter weeds can easily outcompete the desired warm-season turfgrass for nutrients and other plant-essential resources such as moisture and light (Brosnan et al. Reference Brosnan, Breeden and Mueller2012; Johnson Reference Johnson1980). Dormant turfgrass appears brown or tan in color, while green winter weeds are easily identified and considered aesthetically unappealing. Annual bluegrass is regarded as a highly troublesome weed in dormant turfgrass systems (Brosnan et al. Reference Brosnan, Breeden and Mueller2012; Toler et al. Reference Toler, Willis, Estes and McCarty2007). Other common winter weeds include common dandelion, henbit, and common chickweed (Craft et al. Reference Craft, Godara and Askew2023a; Johnson Reference Johnson1975). These weeds are not only unsightly but they can also affect playability and athlete safety (Brosnan et al. Reference Brosnan, Dickson, Sorochan, Thoms and Stier2014).
A common method for controlling winter weeds during turfgrass dormancy is to apply nonselective herbicides (Craft et al. Reference Craft, Godara, Derr, Nichols, McCurdy, Richard and Askew2023b; Toler et al. Reference Toler, Willis, Estes and McCarty2007). When applied at the appropriate time, nonselective herbicides such as glyphosate can eliminate winter weeds without hindering spring transition; because dormant turfgrass is not actively growing does not uptake lethal doses of the herbicide (Rimi et al. Reference Rimi, Macolino and Leinauer2012). However, public perception of not only glyphosate but pesticides in general is increasingly negative and has led to increased regulation (Hahn et al. Reference Hahn, Sallenave, Pornaro and Leinauer2020). For example, some areas in the United States such as Montgomery County, Maryland, have banned pesticide use on residential turfgrass (Shiffler Reference Shiffler2025).
Alternative approaches for sustainable weed management have been explored due to the regulation of specific synthetic herbicides. Enhancing cultural practices such as fertility and mowing management reduces weed pressure in turfgrass systems (Busey Reference Busey2003; Dernoeden et al. Reference Dernoeden, Carroll and Krouse1993). While effective cultural practices are essential management tools, weed species can respond differently to cultural practices, further complicating their control in turfgrass. Bioherbicides derived from living organisms such as bacteria or fungi offer an opportunity for sustainable weed management, but few bioherbicides are registered for turfgrass use (Islam et al. Reference Islam, Karim, Kheya and Yeasmin2024). In addition to these methods, precision application of synthetic herbicides offers another sustainable strategy.
The goal of precision herbicide application is to achieve weed control comparable to broadcast applications by targeting only weedy plants or areas, reducing the amount of pesticide active ingredient required per hectare. To reduce chemical use and cost, the turfgrass industry has investigated precision application techniques such as site-specific applications informed by machine learning and object detection through machine vision. Some studies have demonstrated successful weed detection in turfgrass using machine vision (Jin et al. Reference Jin, Liu, Yang, Xie, Bagavathiannan, Hong, Xu, Chen, Yu and Chen2023; Xie et al. Reference Xie, Hu, Bagavathiannan and Song2021; Yu et al. Reference Yu, Sharpe, Schumann and Boyd2019). Furthermore, precision applications have resulted in a 65% decrease in herbicide usage in turfgrass when the percentage of weed cover was 65% (Jin et al. Reference Jin, Liu, Yang, Xie, Bagavathiannan, Hong, Xu, Chen, Yu and Chen2023). Precision application has been extended to disease control in turfgrass, achieving results comparable to broadcast fungicide applications for managing spring dead spot (Ophiosphaerella spp.) (Booth et al. Reference Booth, Sullivan, Askew, Kochersberger and McCall2021; Henderson et al. Reference Henderson, Haak, Mehl, Shafian and McCall2025). Optimizing herbicide use in turfgrass systems could reduce the amount of herbicide active ingredient applied per hectare without sacrificing weed control, potentially making herbicide use in turfgrass less susceptible to regulatory restrictions.
Since precision applications in turfgrass systems are relatively new, continued research is needed. In dormant turfgrass conditions, using a vegetative index may offer a simpler alternative to machine learning for real-time weed detection and precision applications. Machine learning requires extensive image collection and model training, while a vegetative index involves a single equation that uses a pixel-based analysis. The dark green color index (DGCI) is commonly used to detect color variations in turfgrass (Karcher and Richardson Reference Karcher and Richardson2003) and offers a method for distinguishing tan dormant turfgrass from green winter weeds without using complex machine learning techniques. Thus, the objective of this study was to develop and test a system using DGCI for precision application of glyphosate to detect and spray winter weeds growing among dormant bermudagrass.
Materials and Methods
Technology Development—Hardware
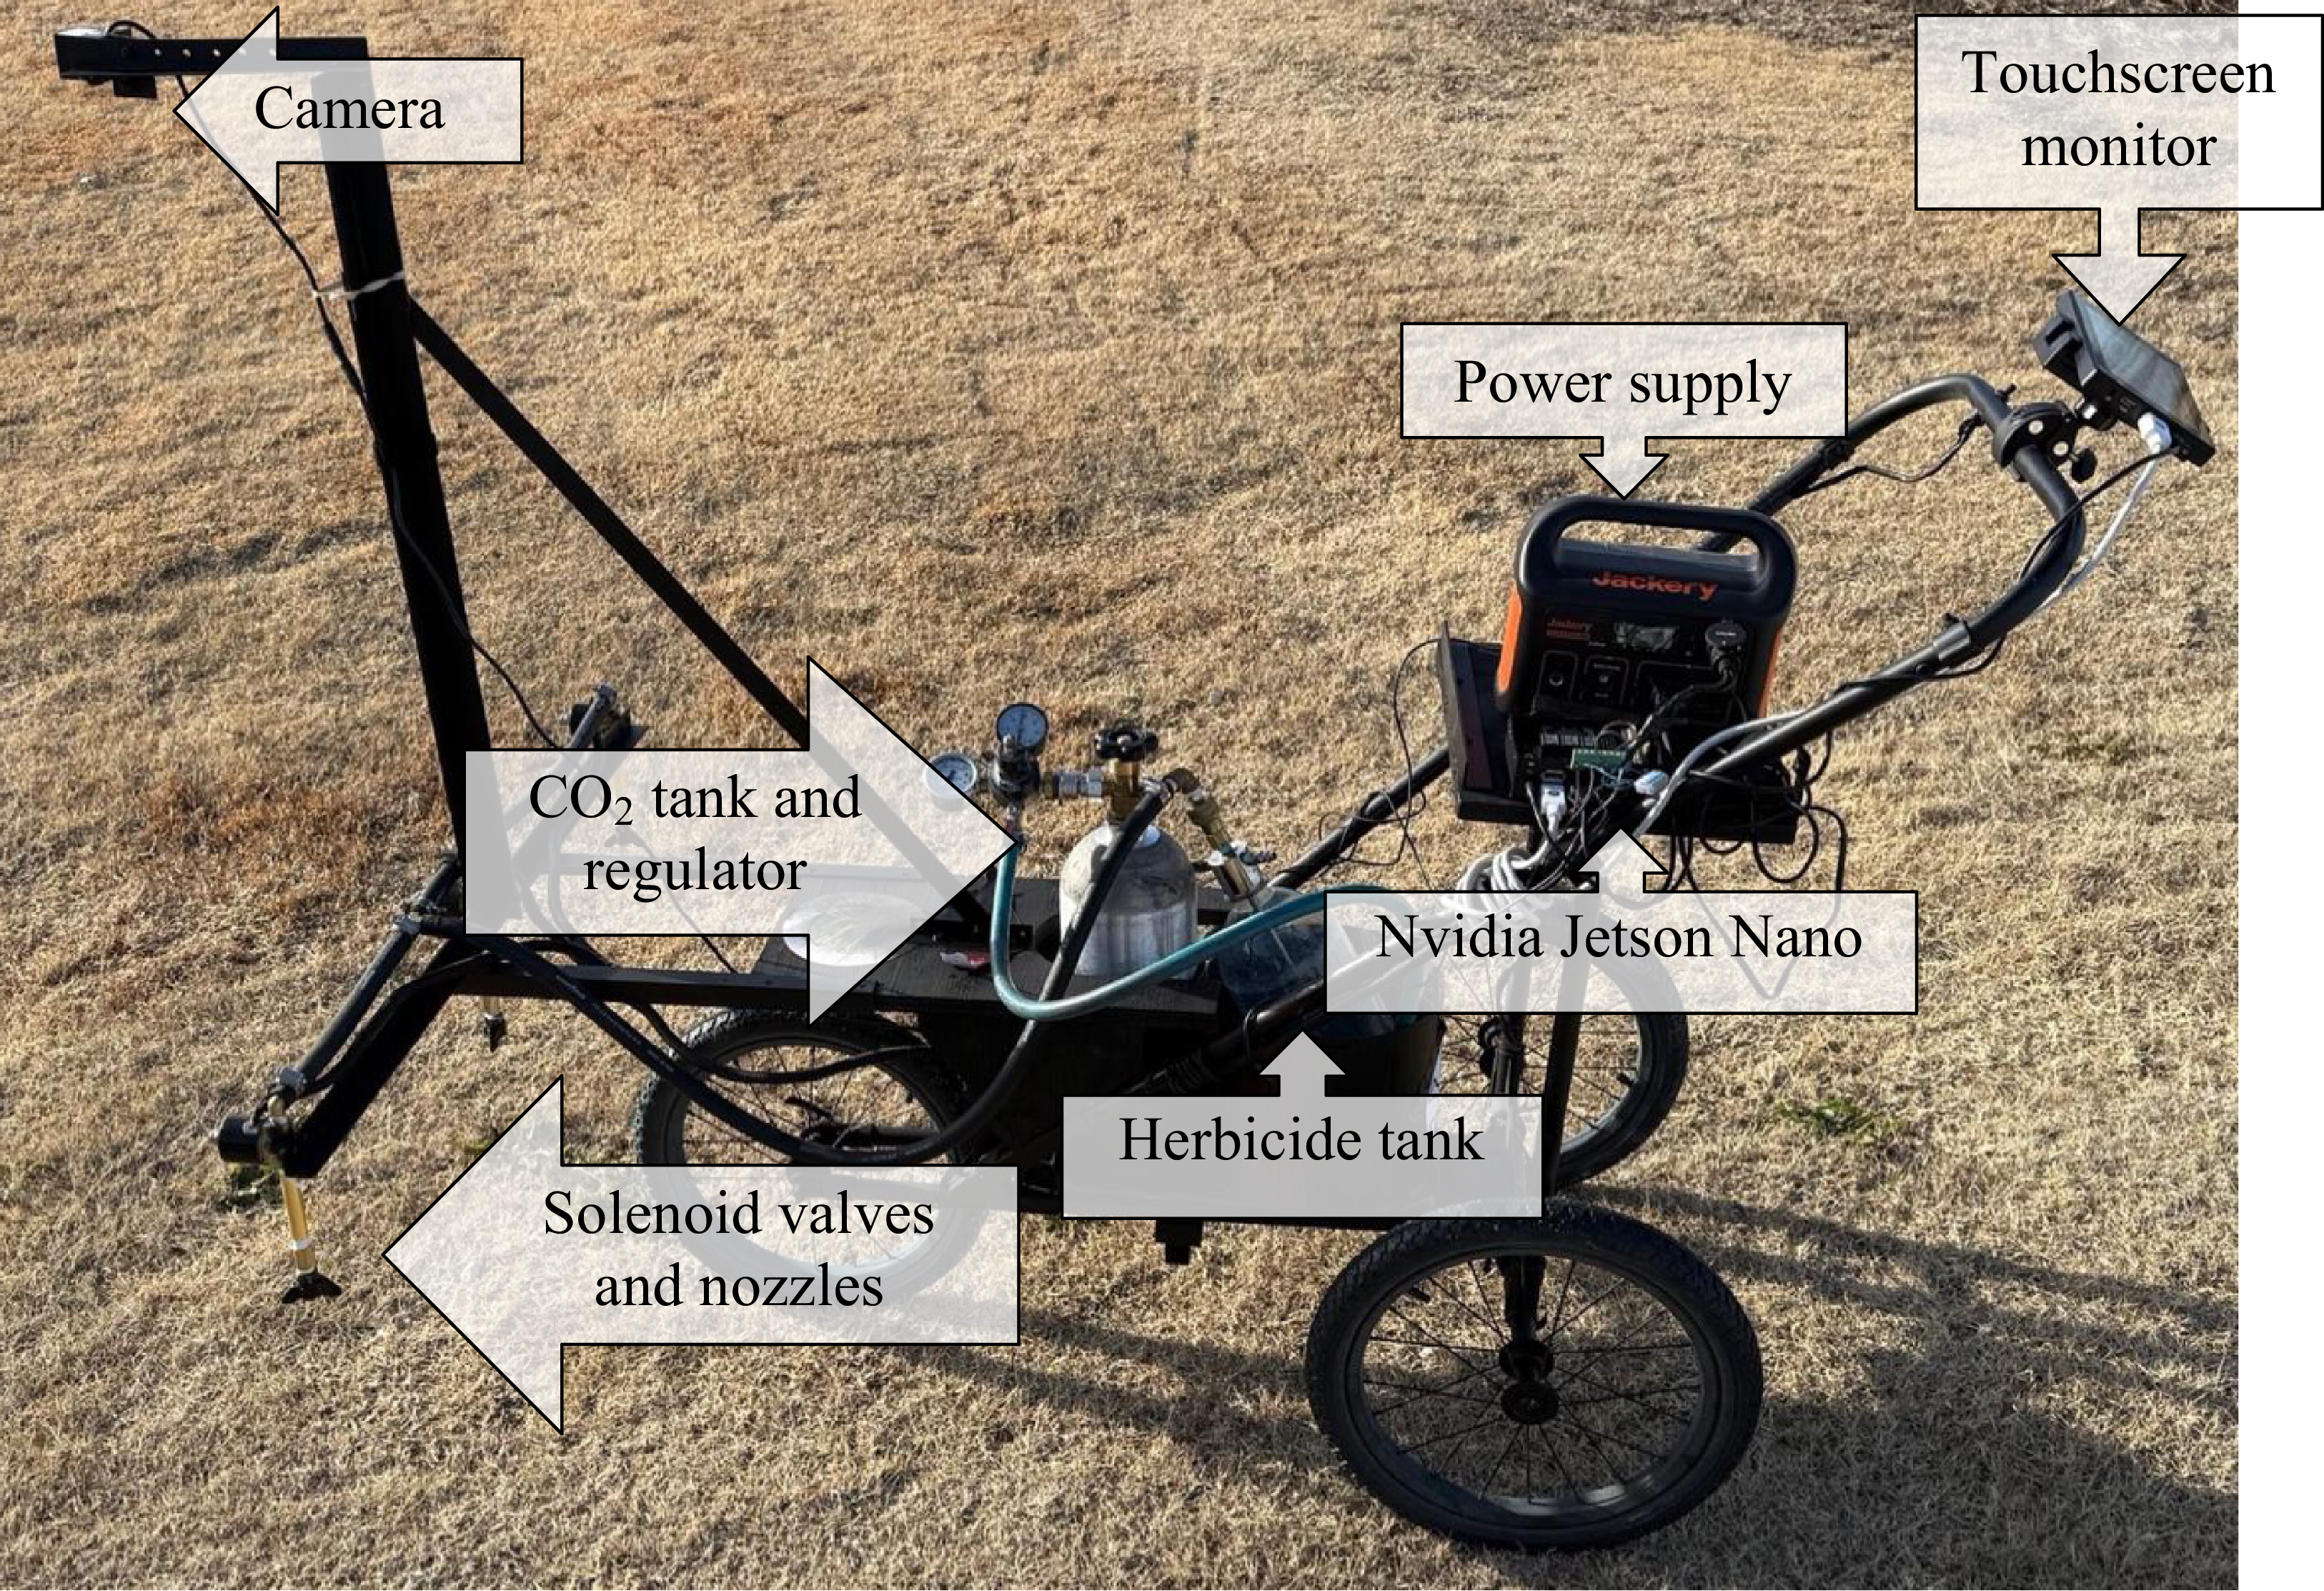
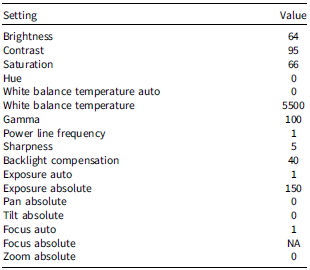
Using DGCI for winter weed detection requires machine vision. The system we developed for real-time weed detection and herbicide application consisted of a manually propelled sprayer equipped with a camera, single-board computer, and solenoid-controlled nozzle bodies (Figure 1). The camera (IMX415 USB; IFWATER, China) collected red-green-blue video at 30 frames per second with a resolution of 640 × 480 pixels. Camera settings were selected using the Video4Linux2 (V4L2) utilities package (Table 1). For optimal weed detection and image processing, the camera was positioned 25 cm in front of the boom, 125 cm above the ground, and tilted 3° off nadir facing forward.
The spray system that was constructed for precision applications, with parts labeled.

Camera settings used for application with the DGCI system from the Video4Linux2 utilities package. a

a Abbreviation: DGCI, dark green color index.
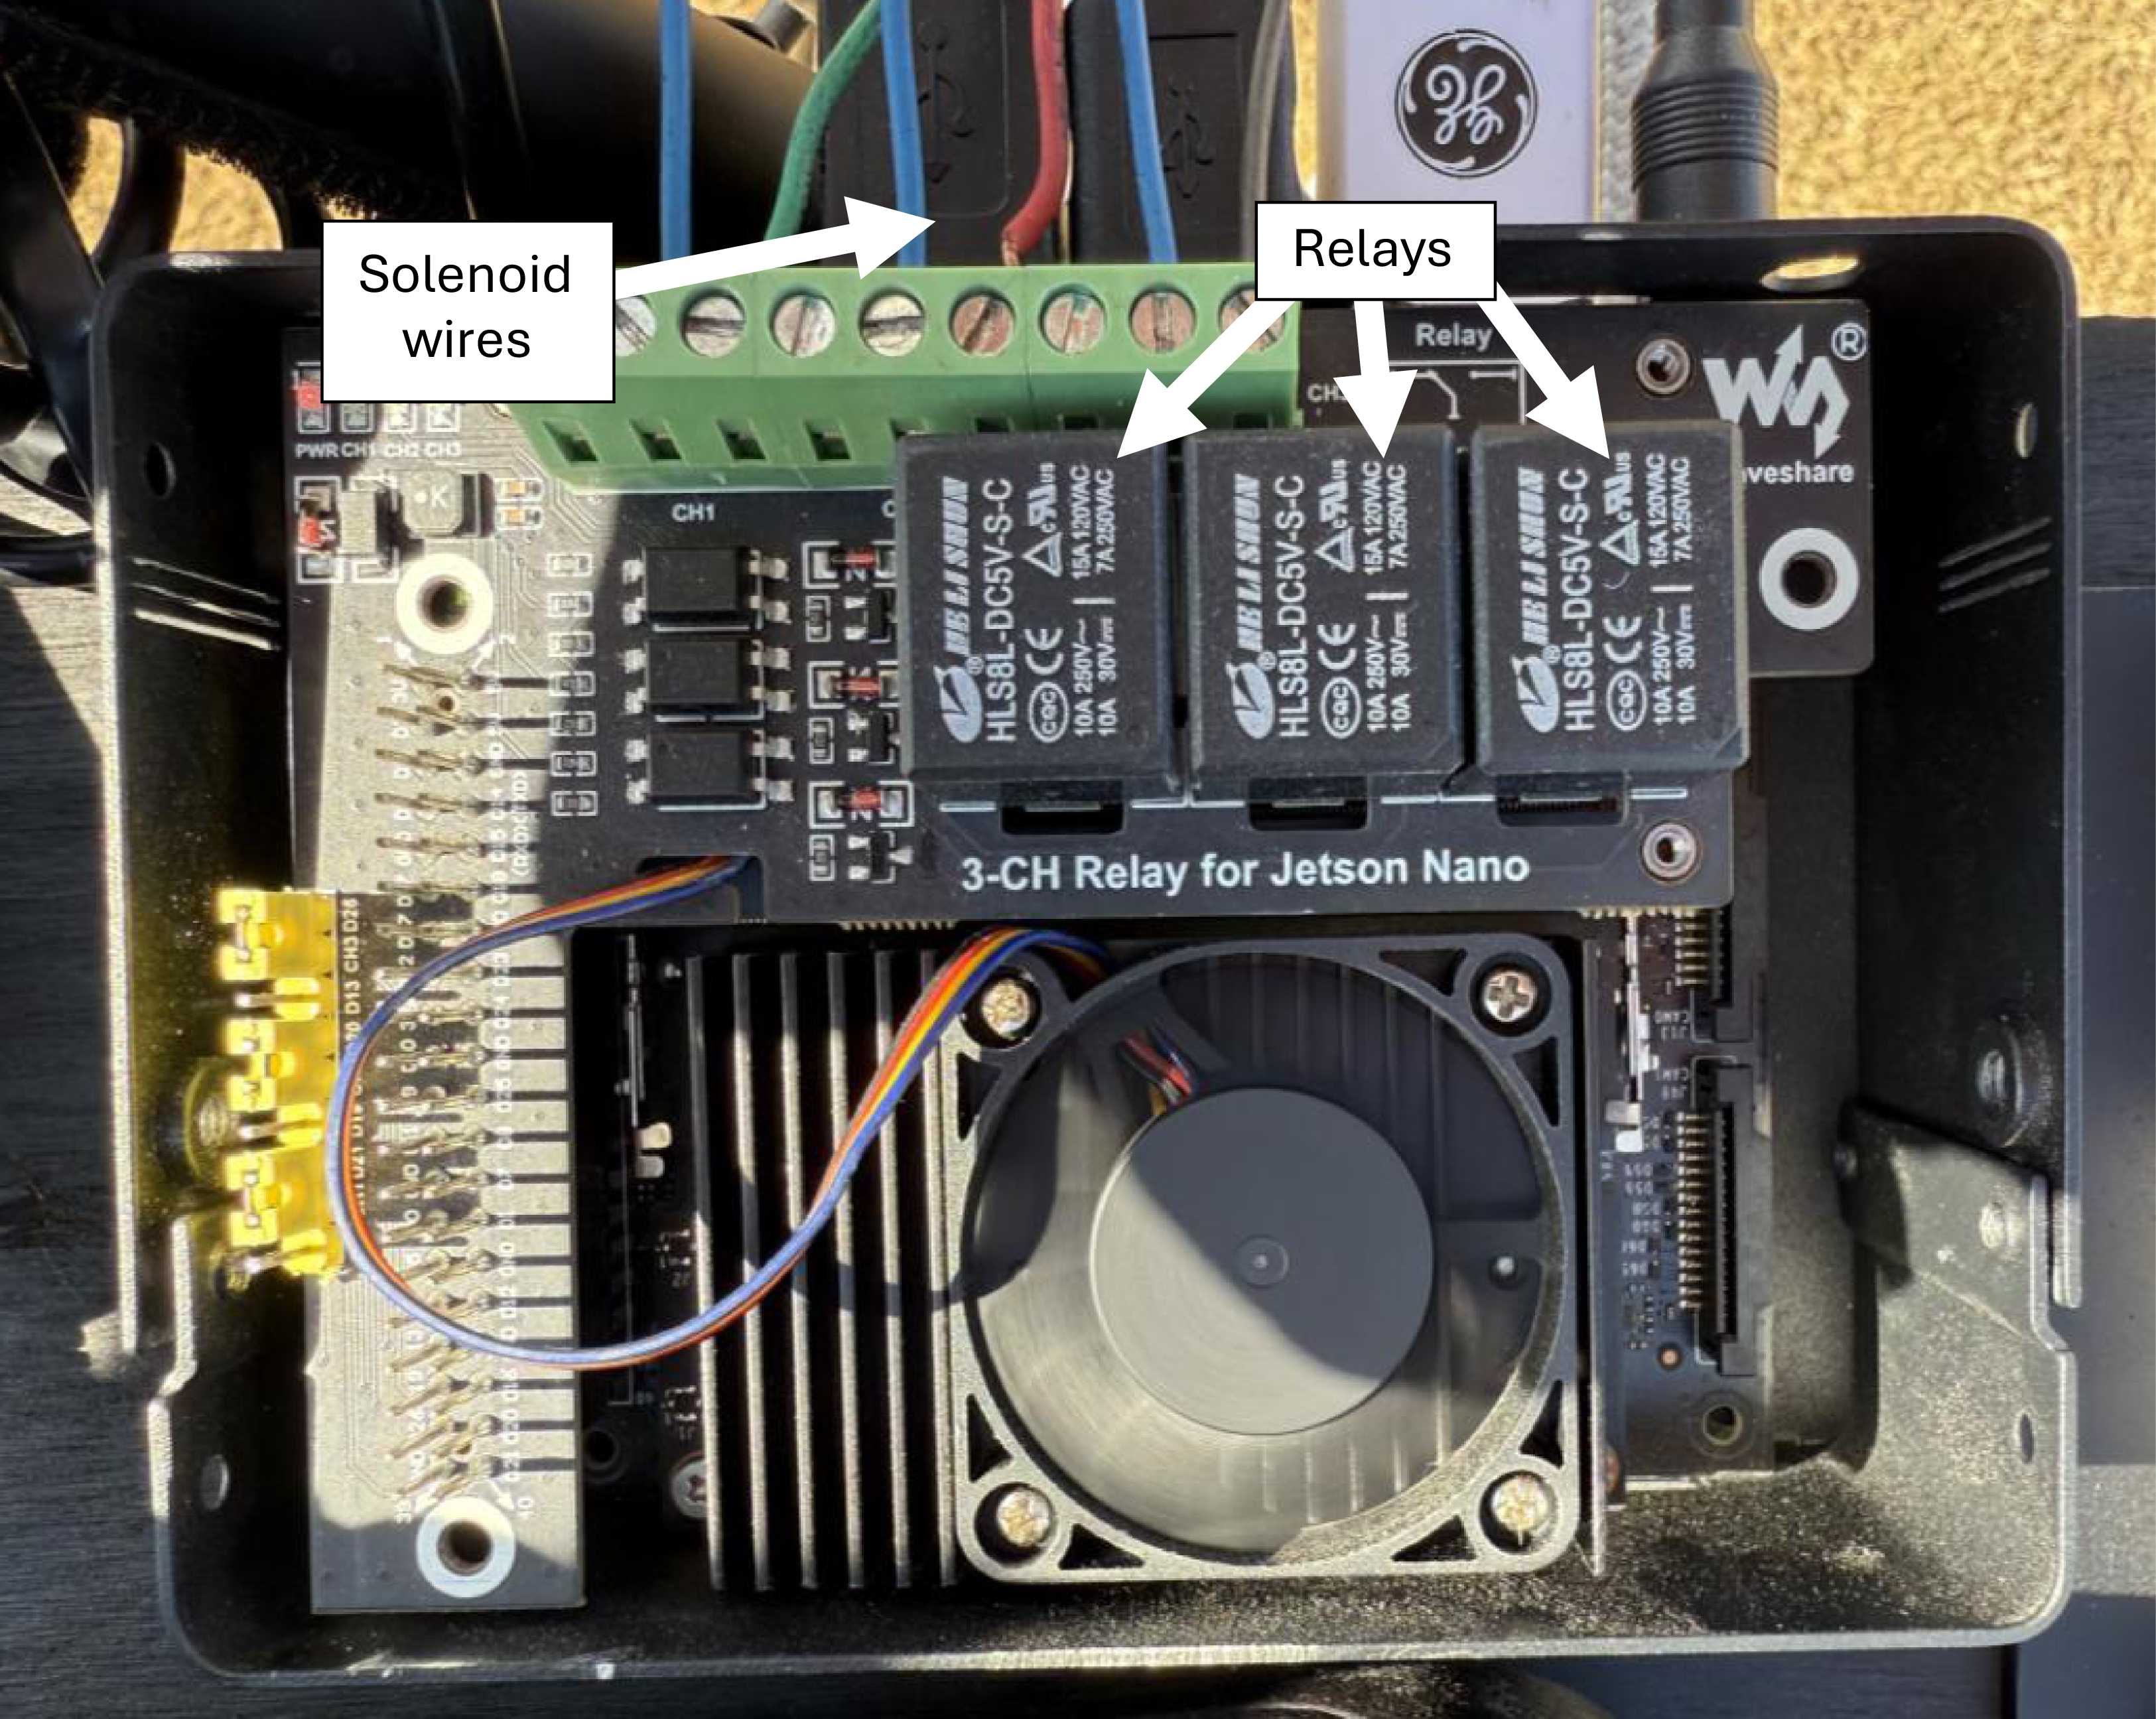
Footage collected by the camera was processed by a control system (Figure 2) (Jetson Nano; NVIDIA, Santa Clara, CA) with a Linux-based (Ubuntu 18.04) operating system running a Python (v.3.8) script to analyze the imagery via DGCI. The Python code was edited using artificial intelligence (ChatGPT; OpenAI, San Francisco, CA). A graphical user interface (GUI) allowed real-time adjustment of threshold values (including DGCI) with a touch-screen monitor (7-inch HDMI LCD [H]; Waveshare, Shenzhen, China). A three-channel relay expansion board (Waveshare) was placed on the board pins of the computer so that transmissions from the computer could be redirected to the spray mechanisms. Processed information was transmitted to the relay expansion board, which either powered on or delivered no power to solenoid valves (2W025-08; SNS Pneumatic Co., YueQing, Zhejiang, China) corresponding to each nozzle. A portable power station (Explorer 300; Jackery, Fremont, CA) provided 12 V power to the control and application system.
The computer used for this study (NVIDIA Jetson Nano) with labeled components. The blue wires powered the solenoid valves, and the green, red, and black wires controlled the activation of the left, middle, and right solenoid valves, respectively.

Technology Development—Software
Sprayer activation was determined by DGCI. Python code calculated DGCI for each pixel in every frame using Equation 1: $DGCI = {{\left( {{{Hue - 60} \over {60}}} \right) + \left( {1 - Saturation} \right) + \left( {1 - Brightness} \right)} \over 3}$
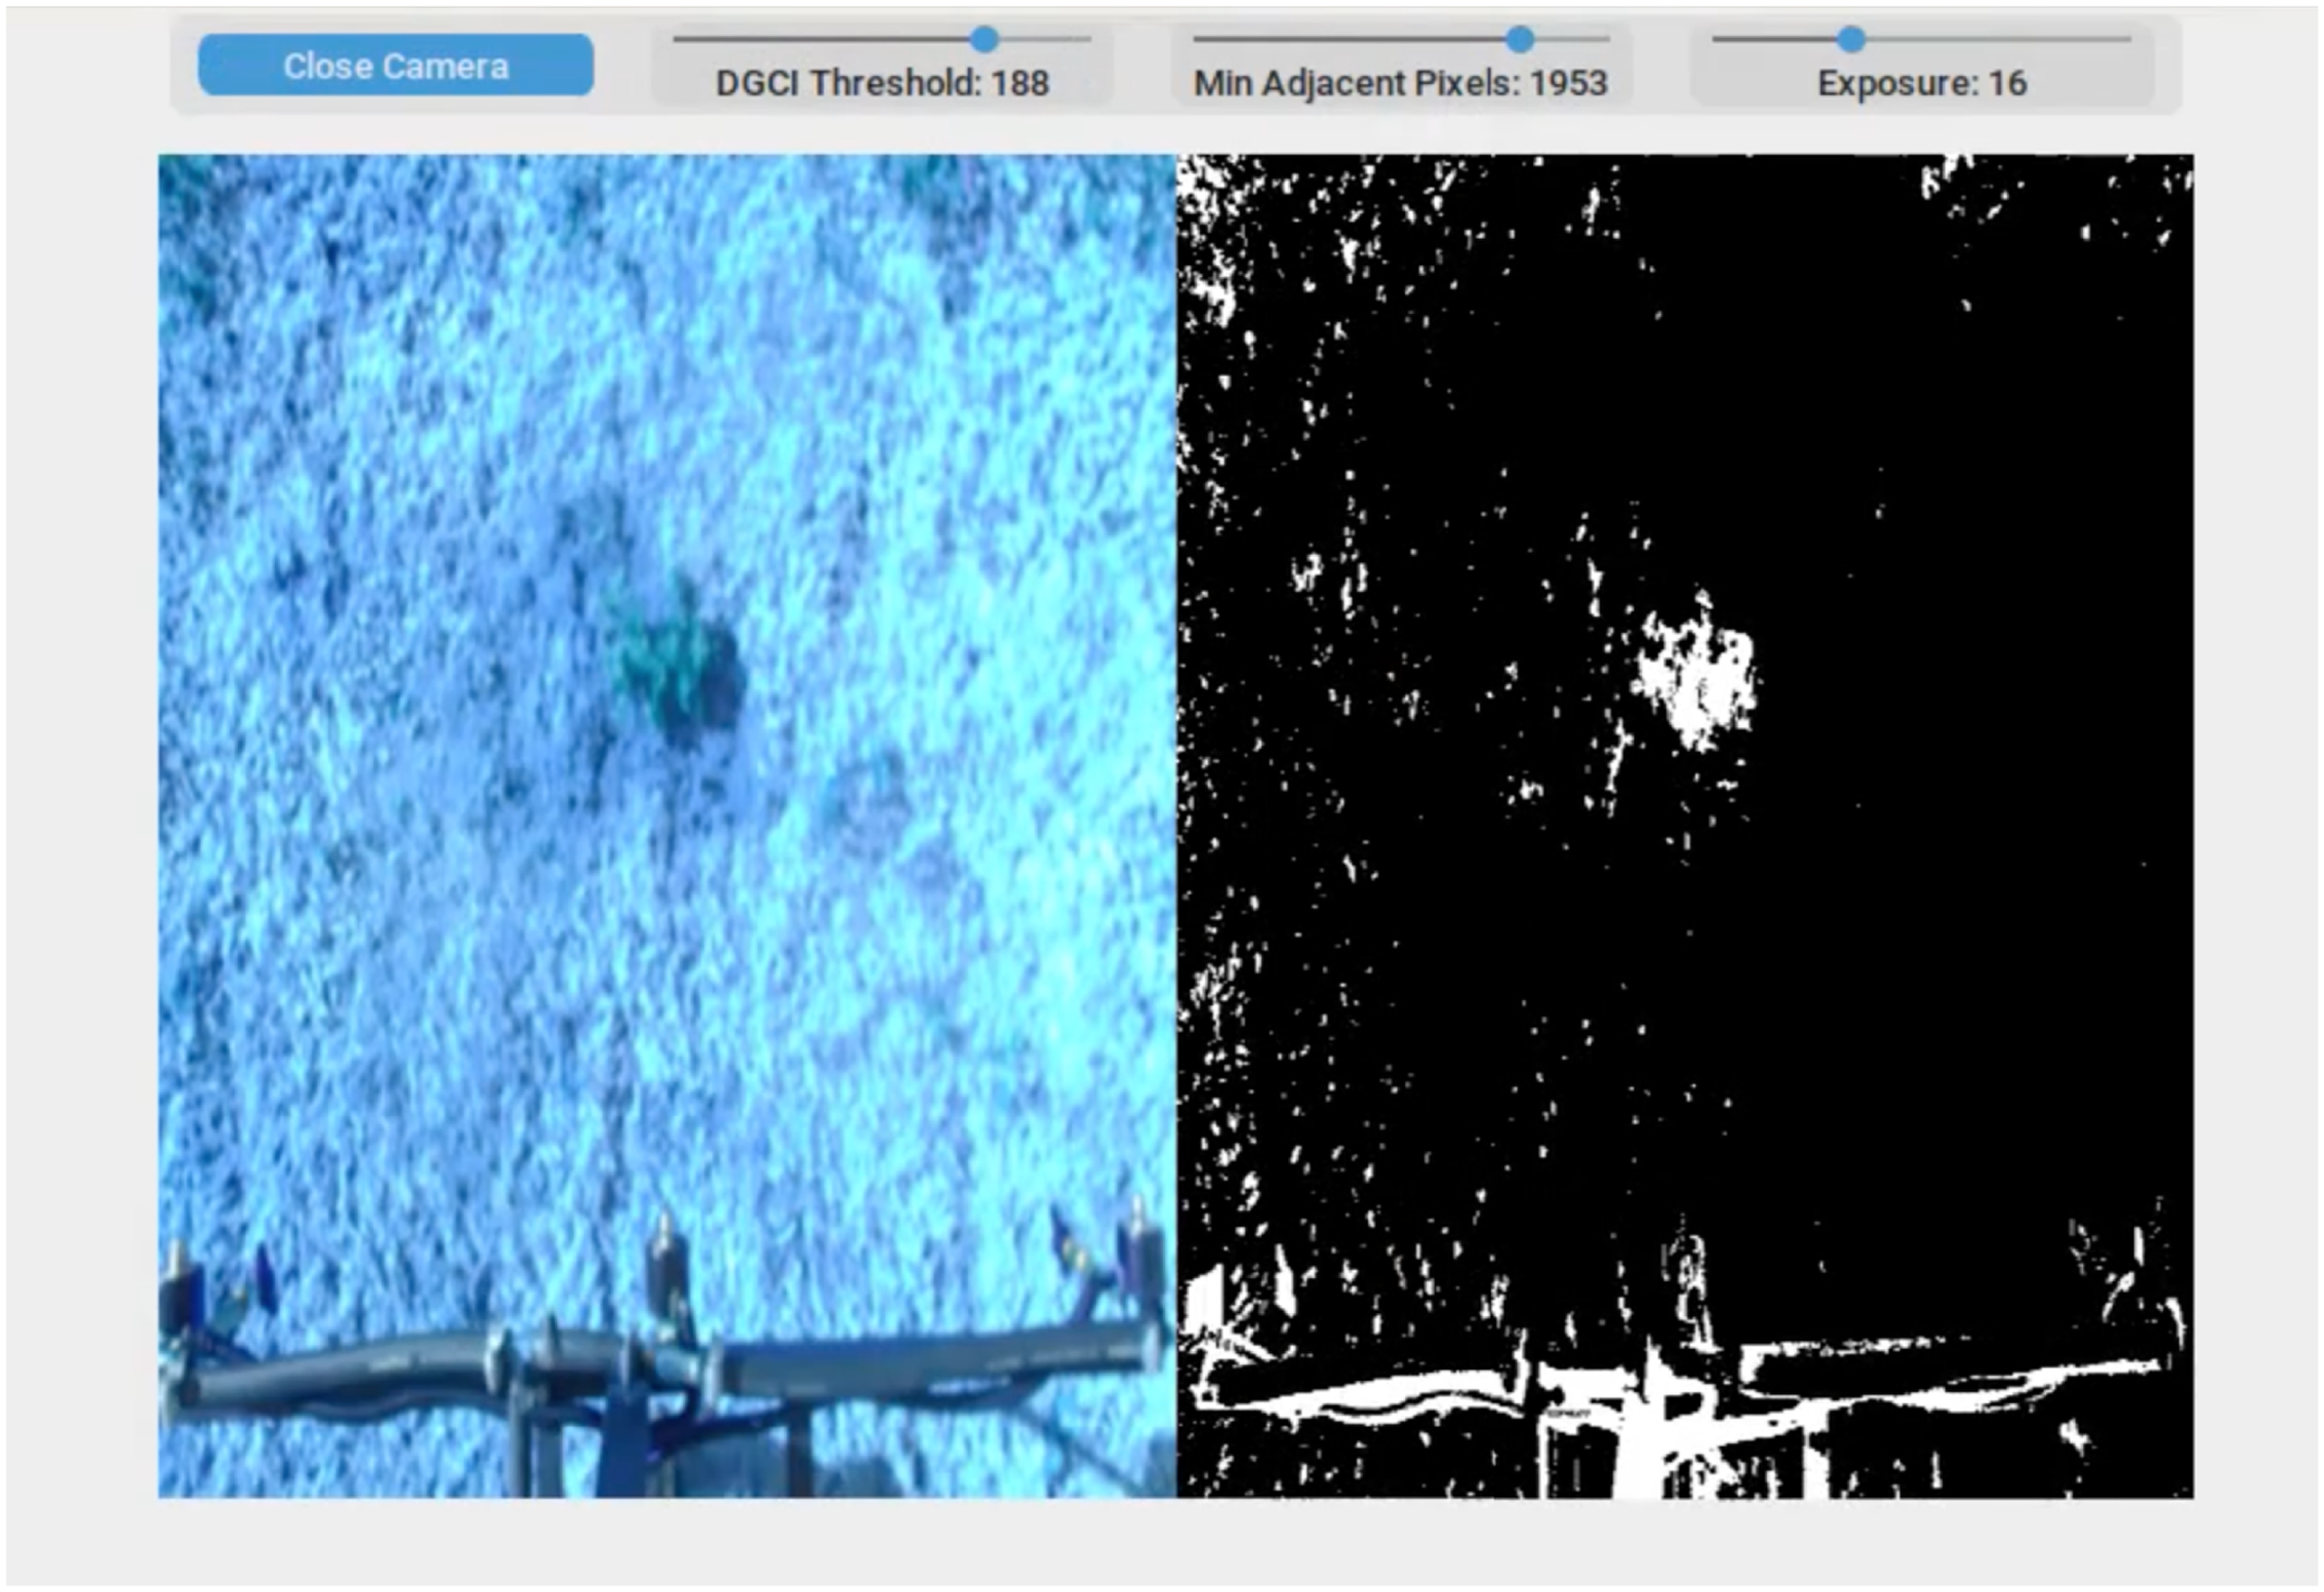
where hue, saturation, and brightness (HSB) represent human color perception (Karcher and Richardson Reference Karcher and Richardson2003). The DGCI values, scaled from zero to 1, were normalized to a 0 to 255 scale. Triggered pixels appeared white; nontriggered pixels appeared black (Figure 3). A user-adjustable threshold mask triggered pixels exceeding the DGCI threshold, prompting solenoid valve activation. To reduce random triggers from camera noise, an additional threshold required a defined number of adjacent triggered pixels. For example, upon observation of the computer system, a common dandelion plant typically represented 150 triggered pixels, so the adjacent pixel threshold was set accordingly. Each time the DGCI system was tested, the pixel threshold was defined by the operator based on visual assessment. Another threshold adjusted camera exposure to lighting conditions, which allowed the operator to fix the camera’s exposure to a defined value that presents the imagery properly. All thresholds were adjustable in real-time.
The graphical user interface the operator views (left half for demonstrative purposes only), which is a weed on dormant bermudagrass (Cynodon spp.) with specific camera settings for demonstration purposes. The white pixels are activated for spraying as the weed is present.

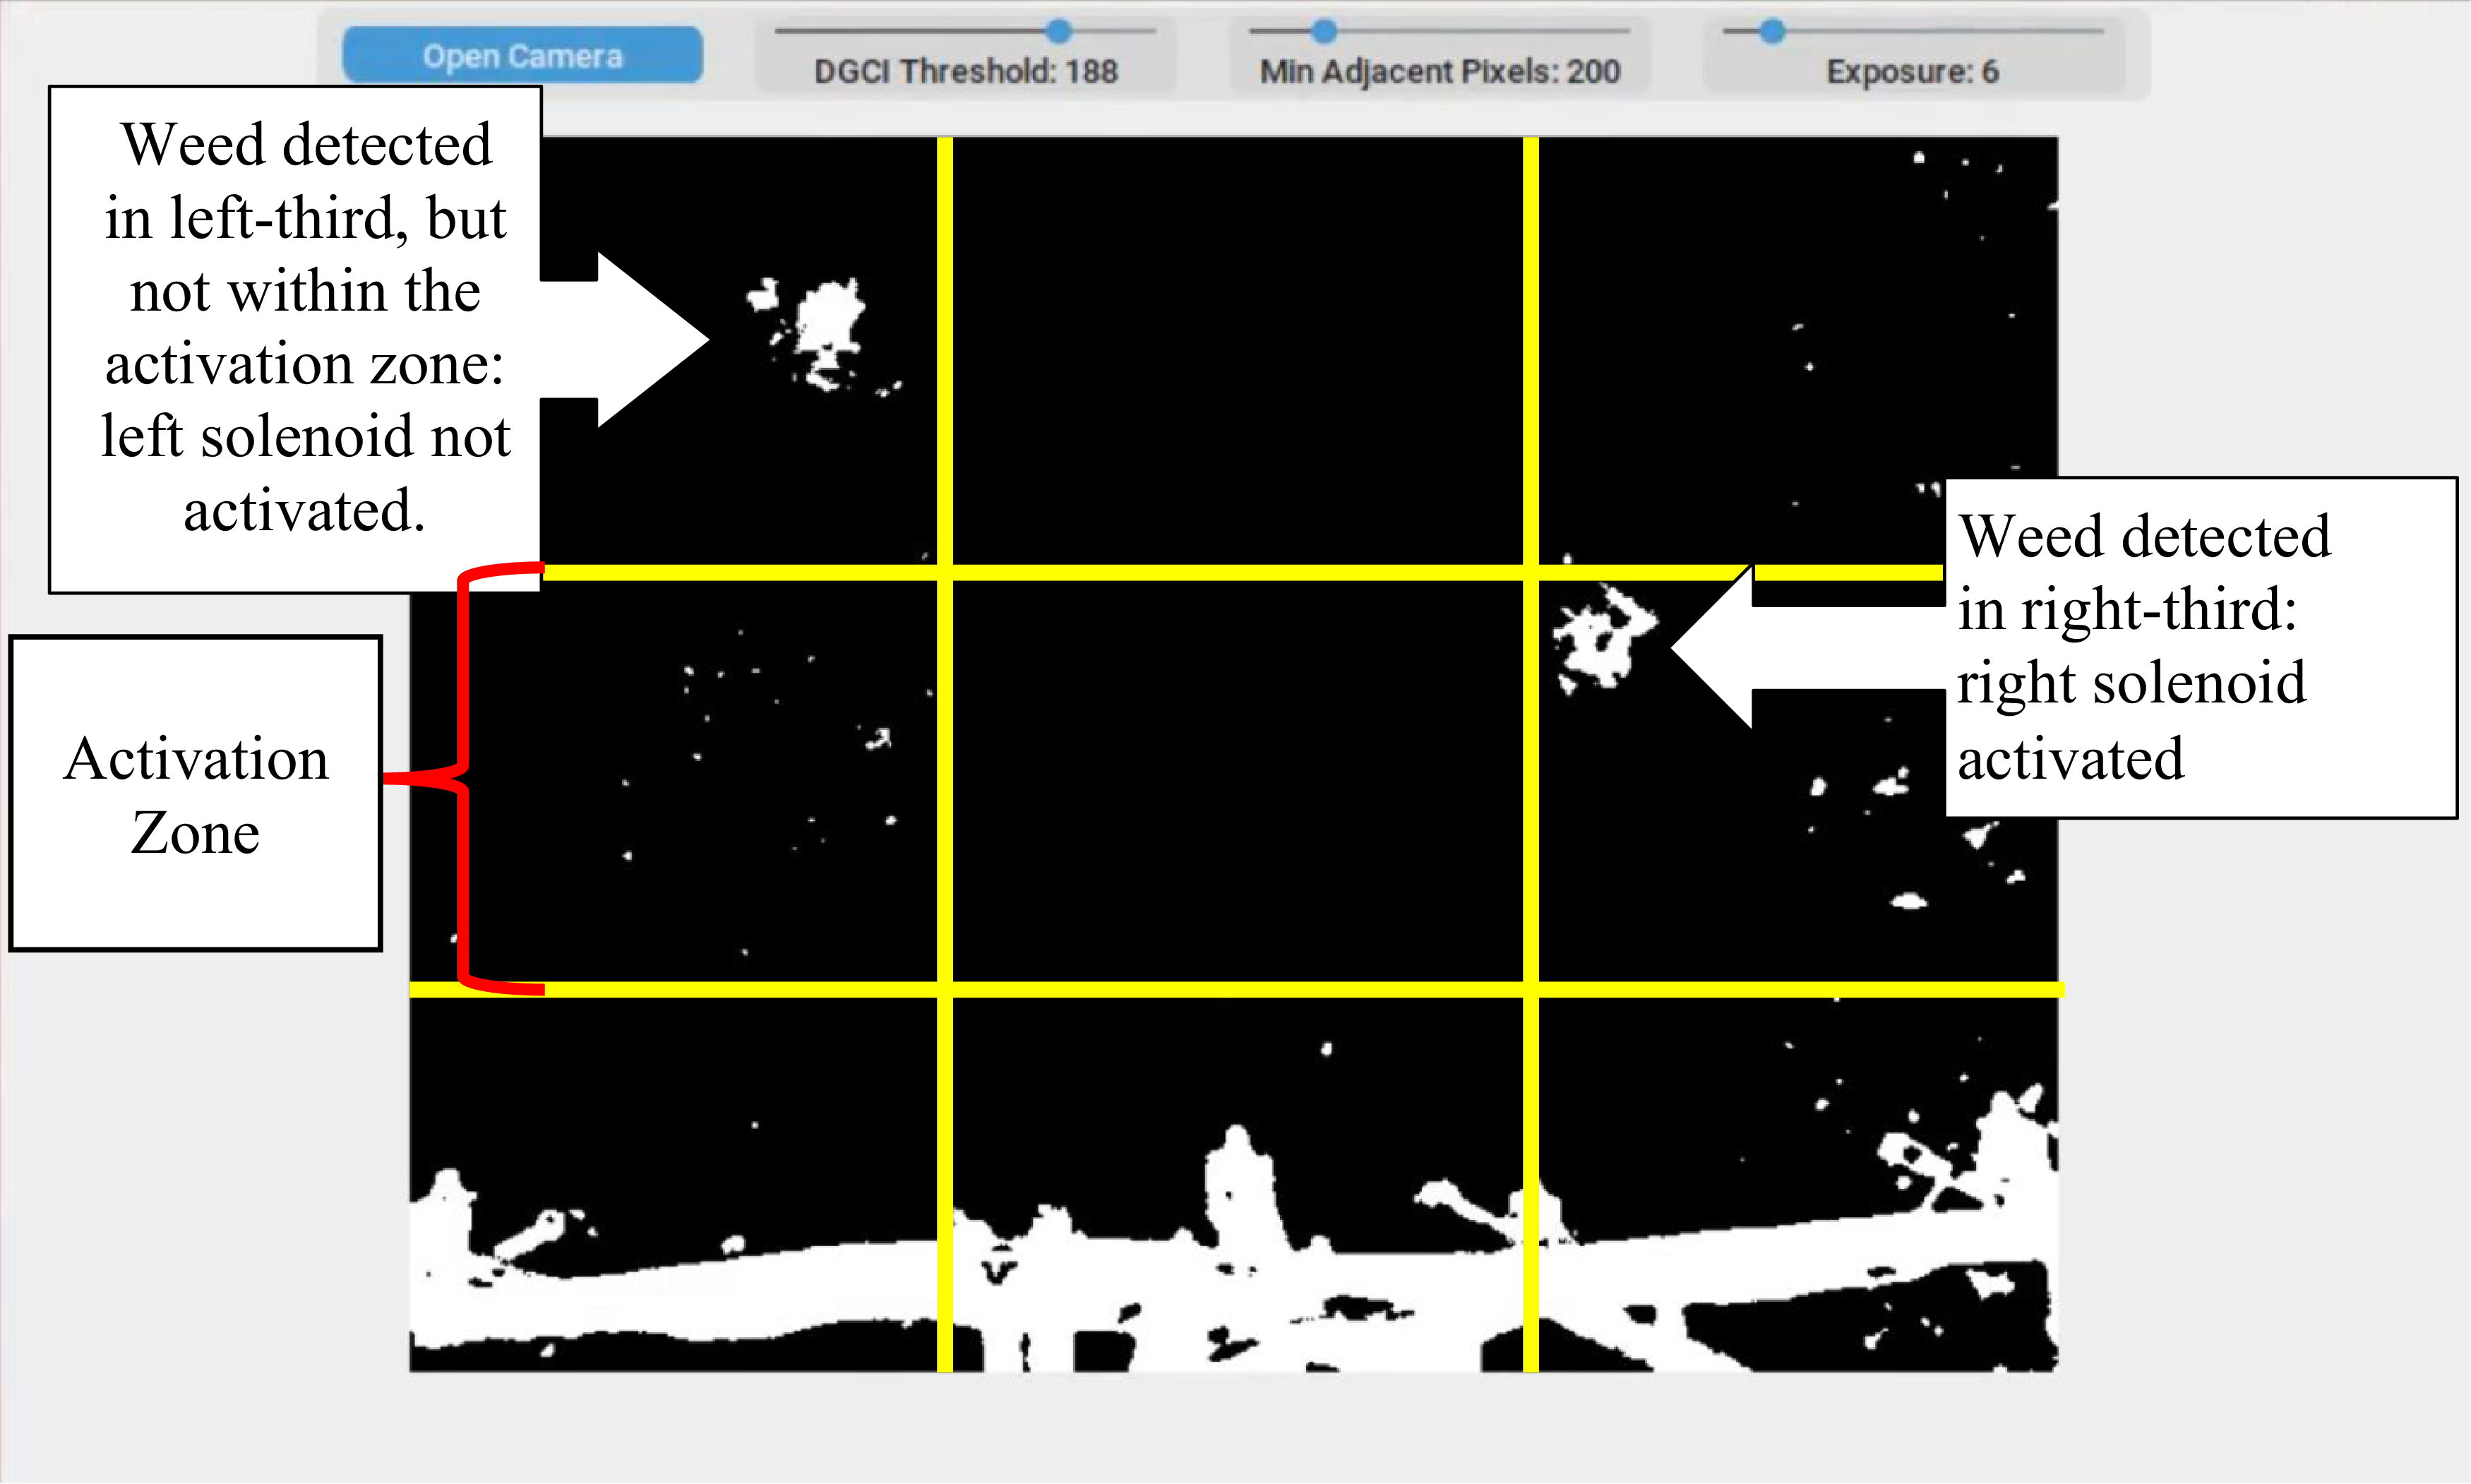
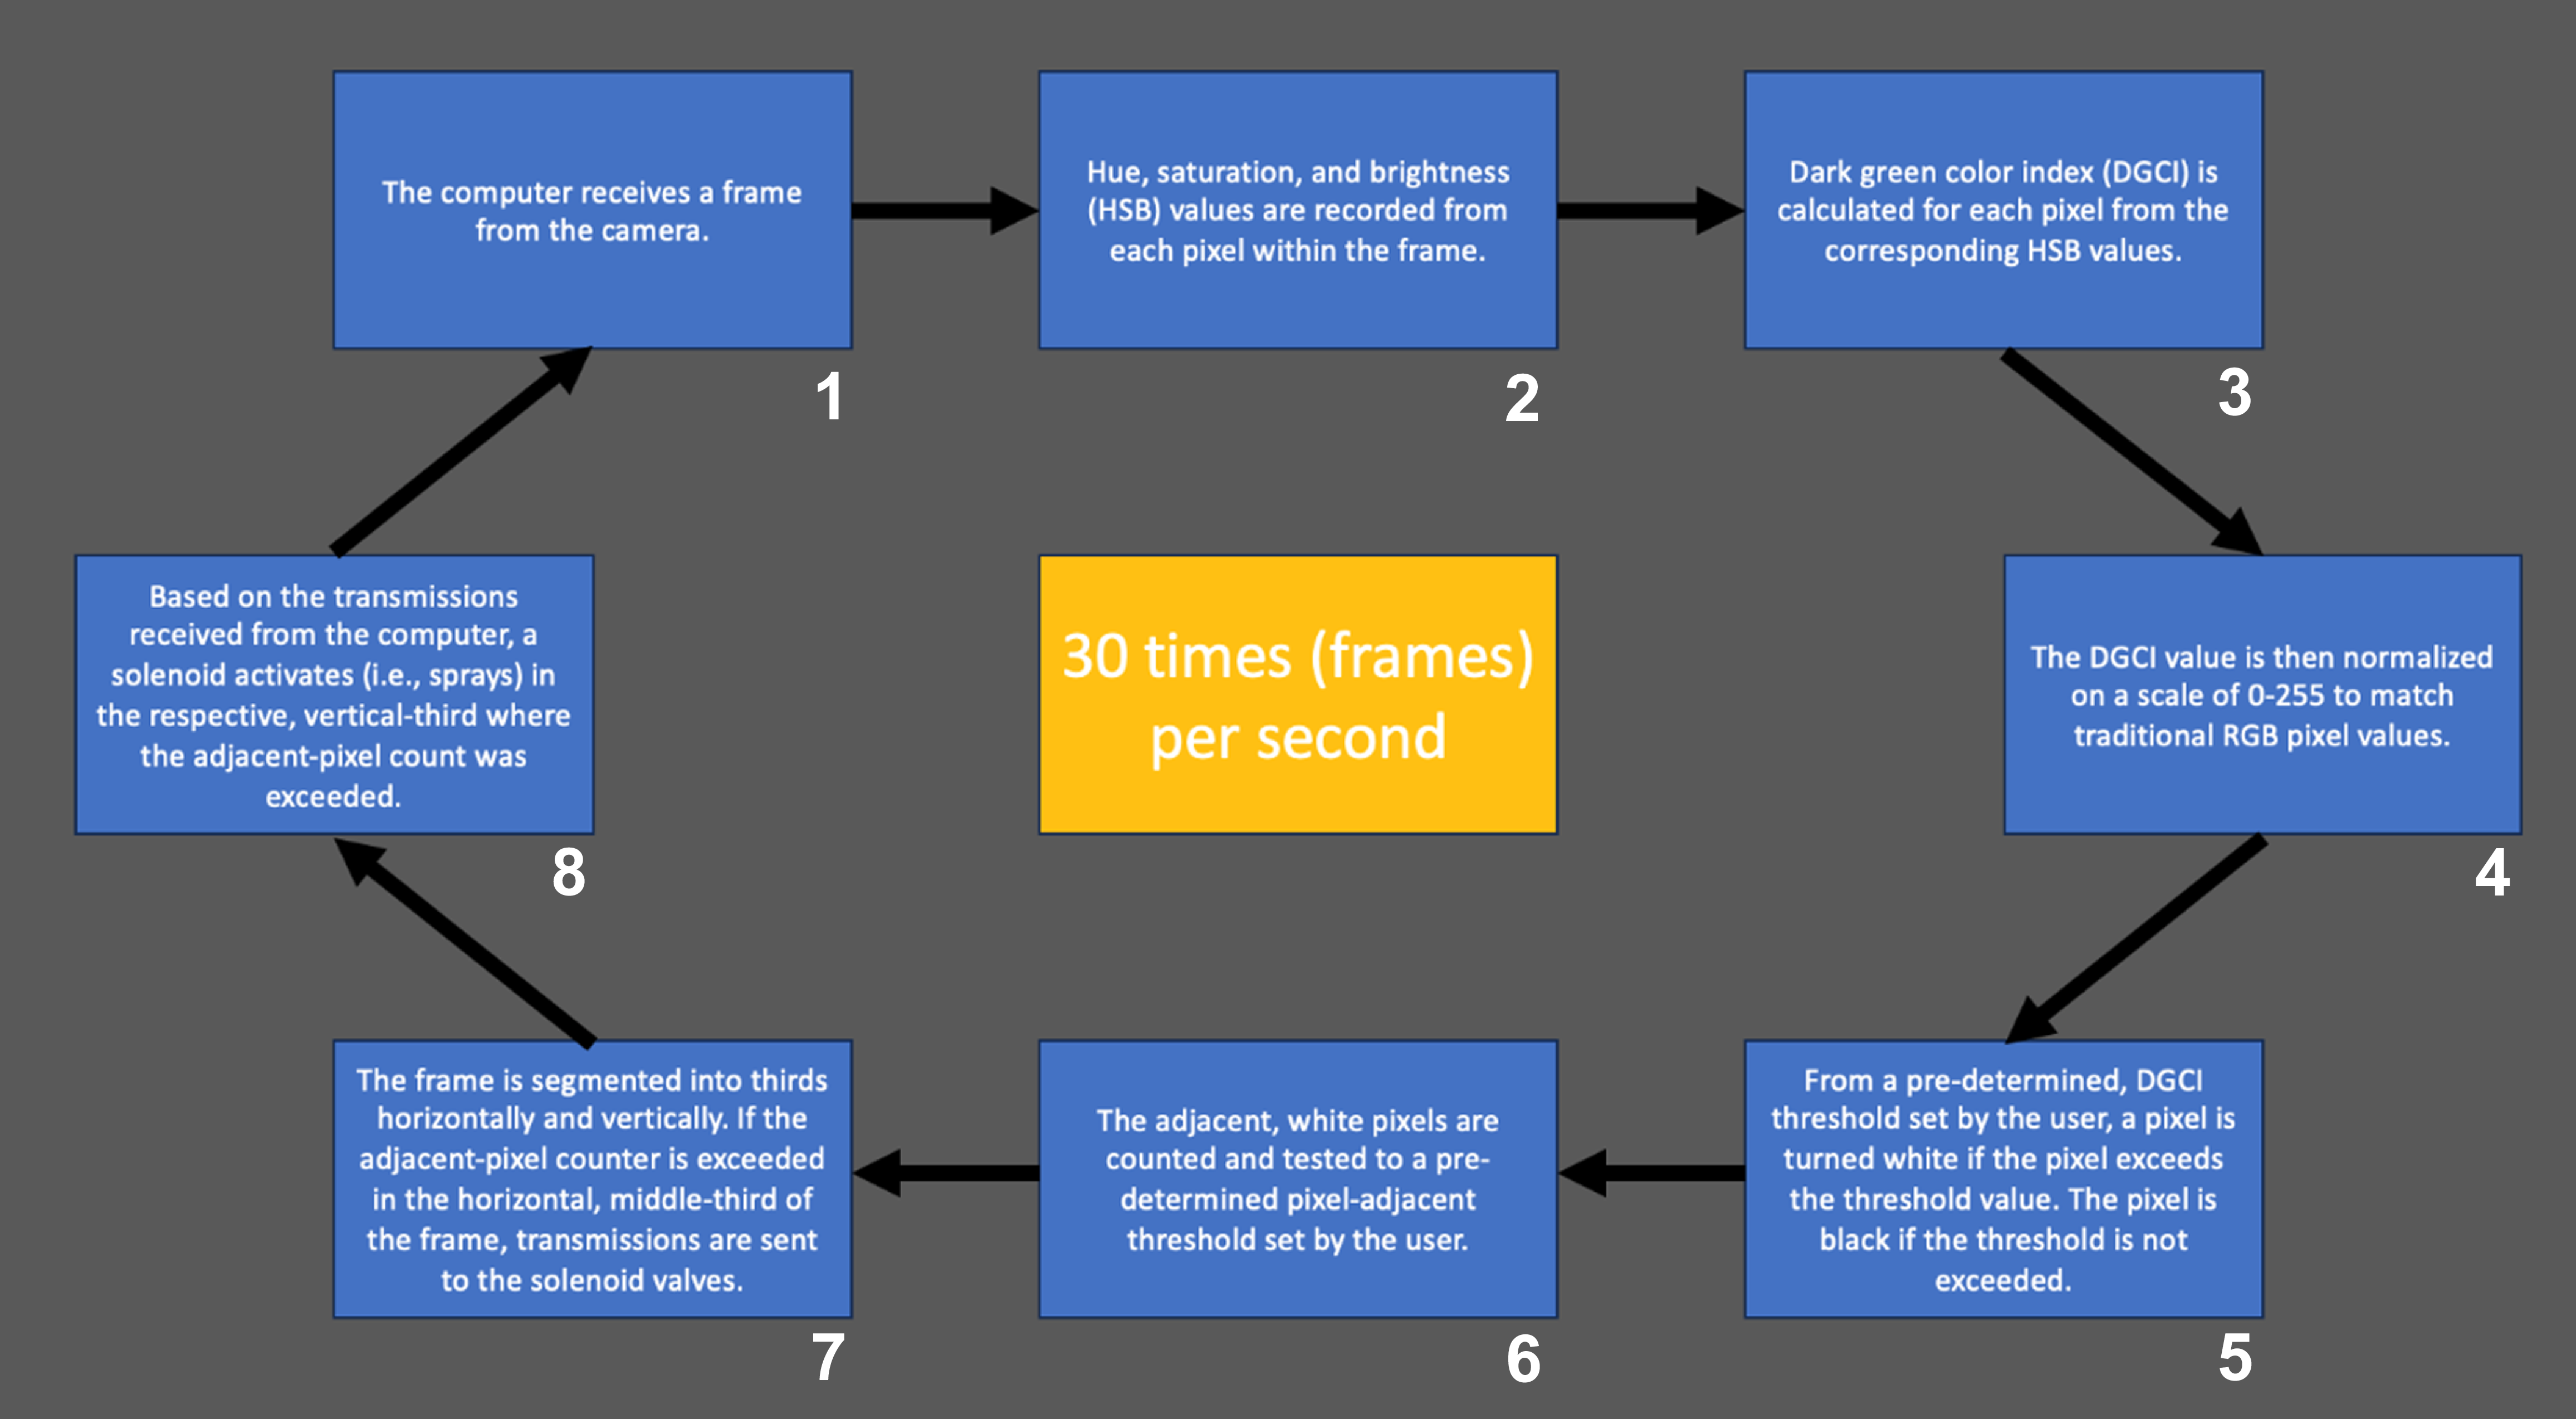
Each frame (640 pixels wide) was divided into vertical thirds, with each third linked to a solenoid valve (Figure 4). The frames were also split into horizontal thirds to accommodate for more precise timing of application and the operating speed of the sprayer (Figure 4). Solenoids were activated when triggered pixels exceeded the adjacent-pixel threshold within the middle, horizontal third of the image frame. When the threshold was exceeded, the solenoid that corresponded to the image frame would activate (Figure 4). Analysis occurred at 30 frames per second (Figure 5).
An illustration of the graphical user interface when only the right solenoid valve of the sprayer would activate. The horizontal, middle-third is the activation zone, and the vertical thirds correspond to respective solenoid valves.

A flow diagram explaining the software technology of the dark green color index (DGCI)-based spraying system.

Site Description for Sprayer Validation Field Trials
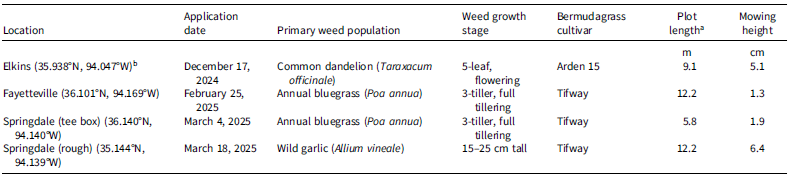
Field trials were conducted at four locations throughout northwestern Arkansas on dormant bermudagrass systems with varying mowing heights, weed populations, weed densities, and weed growth stages. Trials were arranged as a randomized complete block design with four replications at the Middle Fork Research Farm, in Elkins, Arkansas; the Milo J. Shult Agriculture Research and Extension Center, in Fayetteville; and Springdale Country Club (in the rough, or the ground bordering the golf fairway); and three additional replications at the Springdale Country Club (in a golf tee box) (Table 2). Elkins served as the location of a pilot study because we changed some methods in subsequent locations based on the results from Elkins.
Application date, primary weed population (at least 90% of the total weed population), weed growth stage, bermudagrass cultivar, plot length, and mowing height for each field trial location.

a The plot width at all locations was 1.5 m.
b The Elkins location served as a pilot study.
Application, Sampling, and Assessment Procedures for Field Trials
Before apply herbicides, individual weed counts for each plot and drone imagery (Mavic 2 Enterprise Dual; DJI, Shenzhen, China) were collected. Four treatments were applied: 1) a nontreated control, 2) a broadcast application of glyphosate, 3) a spot application of glyphosate with a backpack sprayer, and 4) application of glyphosate with the DGCI spray system that we developed. The same sprayer was used for both broadcast and DGCI treatments; the DGCI threshold was set to zero for broadcast treatments, which activated all solenoids. Activated solenoid valves released spray solution through corresponding model 8002 even flat-fan nozzles (TeeJet Technologies, Glendale Heights, IL) at a rate of 397 L ha−1. Application pressure was maintained at 275 kPa using CO2 for all application methods. Three nozzles, spaced 46 cm apart on a 91-cm boom, were mounted on aluminum angle 36 cm above the ground. Each nozzle covered a 61-cm swath, creating a 15-cm overlap. The operator walked at a rate of 2.4 km h−1 during both the broadcast and DGCI applications. Applied spot applications used a CO2-pressurized backpack sprayer equipped with a single model 8002 even flat-fan nozzle. The operator of the spot application was instructed to spray all visible weeds in the plot as quickly and accurately as possible, and the plot dimensions varied among trials (Table 2). The operator of DGCI, broadcast, and spot spray applications was the same individual and his technique remained consistent across all locations, except for the spot applicator at the pilot study location. The spray solution at each location consisted of glyphosate (Glyphosate Plus; Quali-Pro, Houston, TX) applied at 819 g ae ha−1 with a blue indicator dye (Tracer HD; Simplot, Boise, ID) mixed at 10 mL L−1.
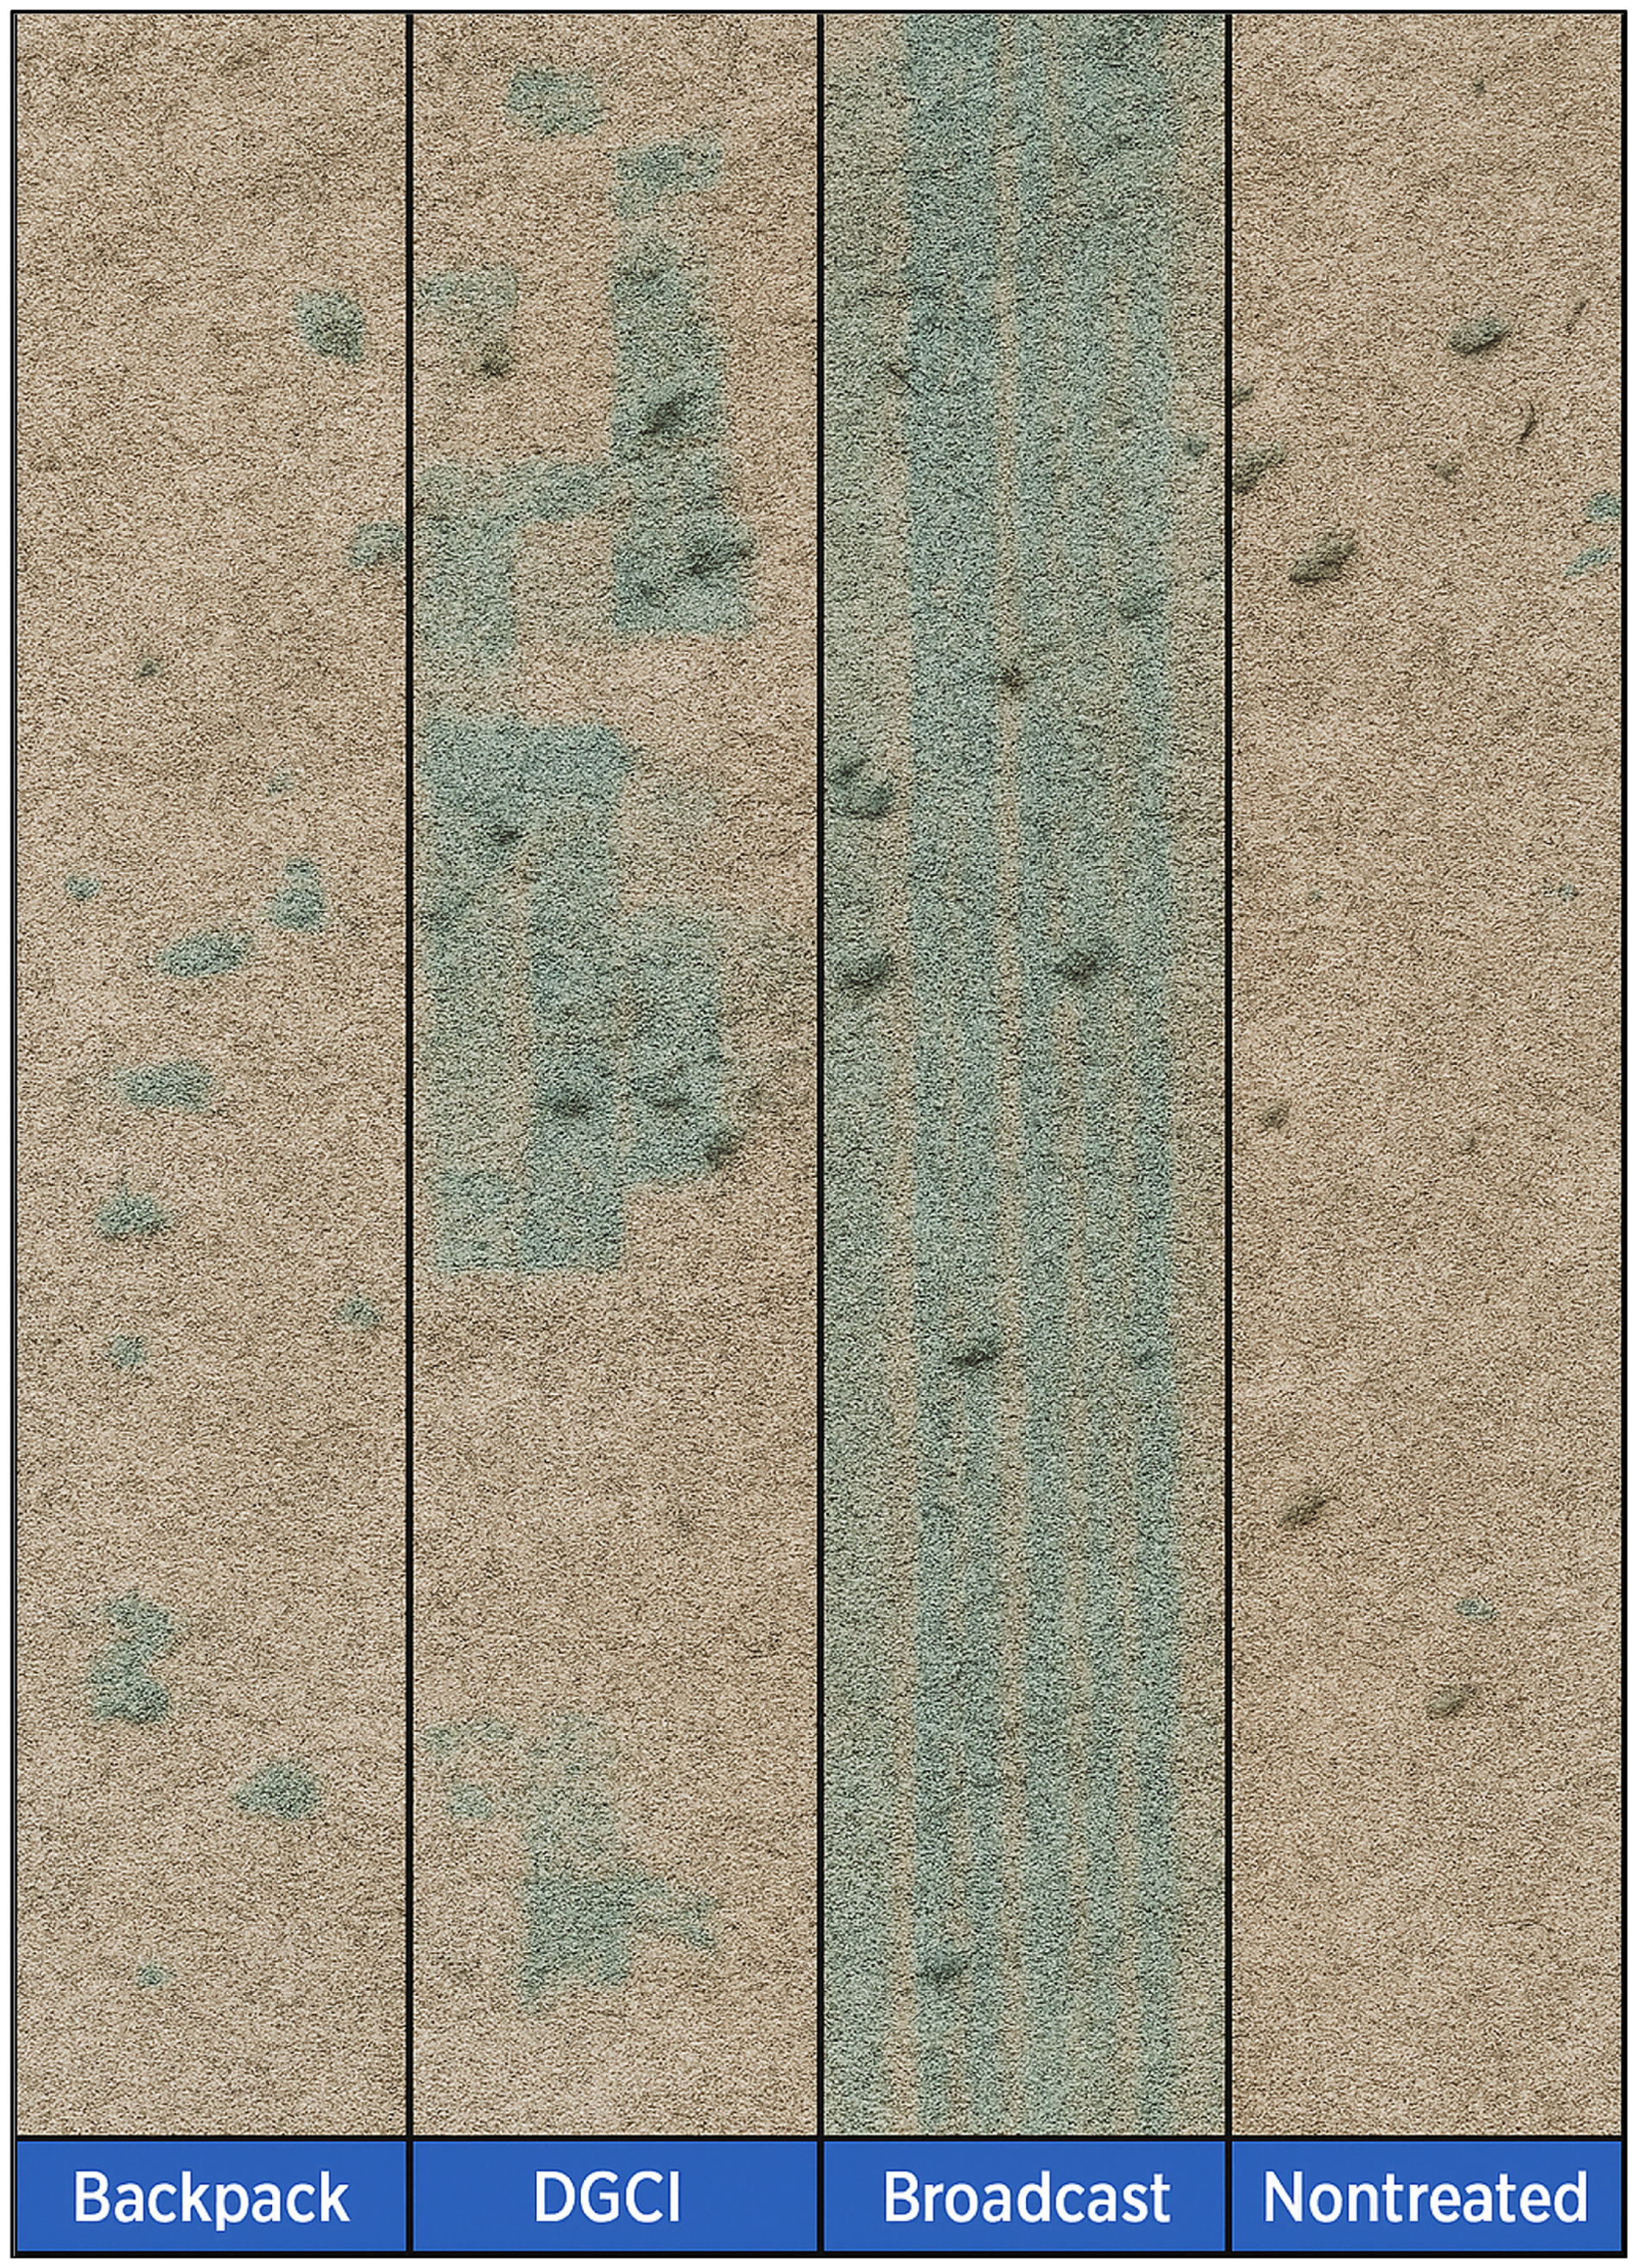
Before plots were sprayed, the sprayer was primed, and the spray solution discharge was collected in buckets. Each application was timed with a stopwatch, and the remaining solution within the spray boom was collected into buckets following application and measured using a graduated cylinder. Spray solution that was not applied to the plot was collected and measured in a graduated cylinder. The measured volume of solution after application was then subtracted from the original volume of spray solution prior to application, and the difference was recorded as the volume of solution applied per plot. After application in Fayetteville, Springdale (the golf tee box), and Springdale (the rough), weeds that were not sprayed (i.e., no blue dye on the weeds) were counted in person and recorded. Drone images were taken at all four locations after application (Figure 6).
From left to right: spot application (backpack), dark green color index (DGCI) system, broadcast application, and nontreated control of the spray patterns illustrated by blue indicator dye for detection of wild garlic (Allium vineale L.).

Calculations and Statistical Analyses
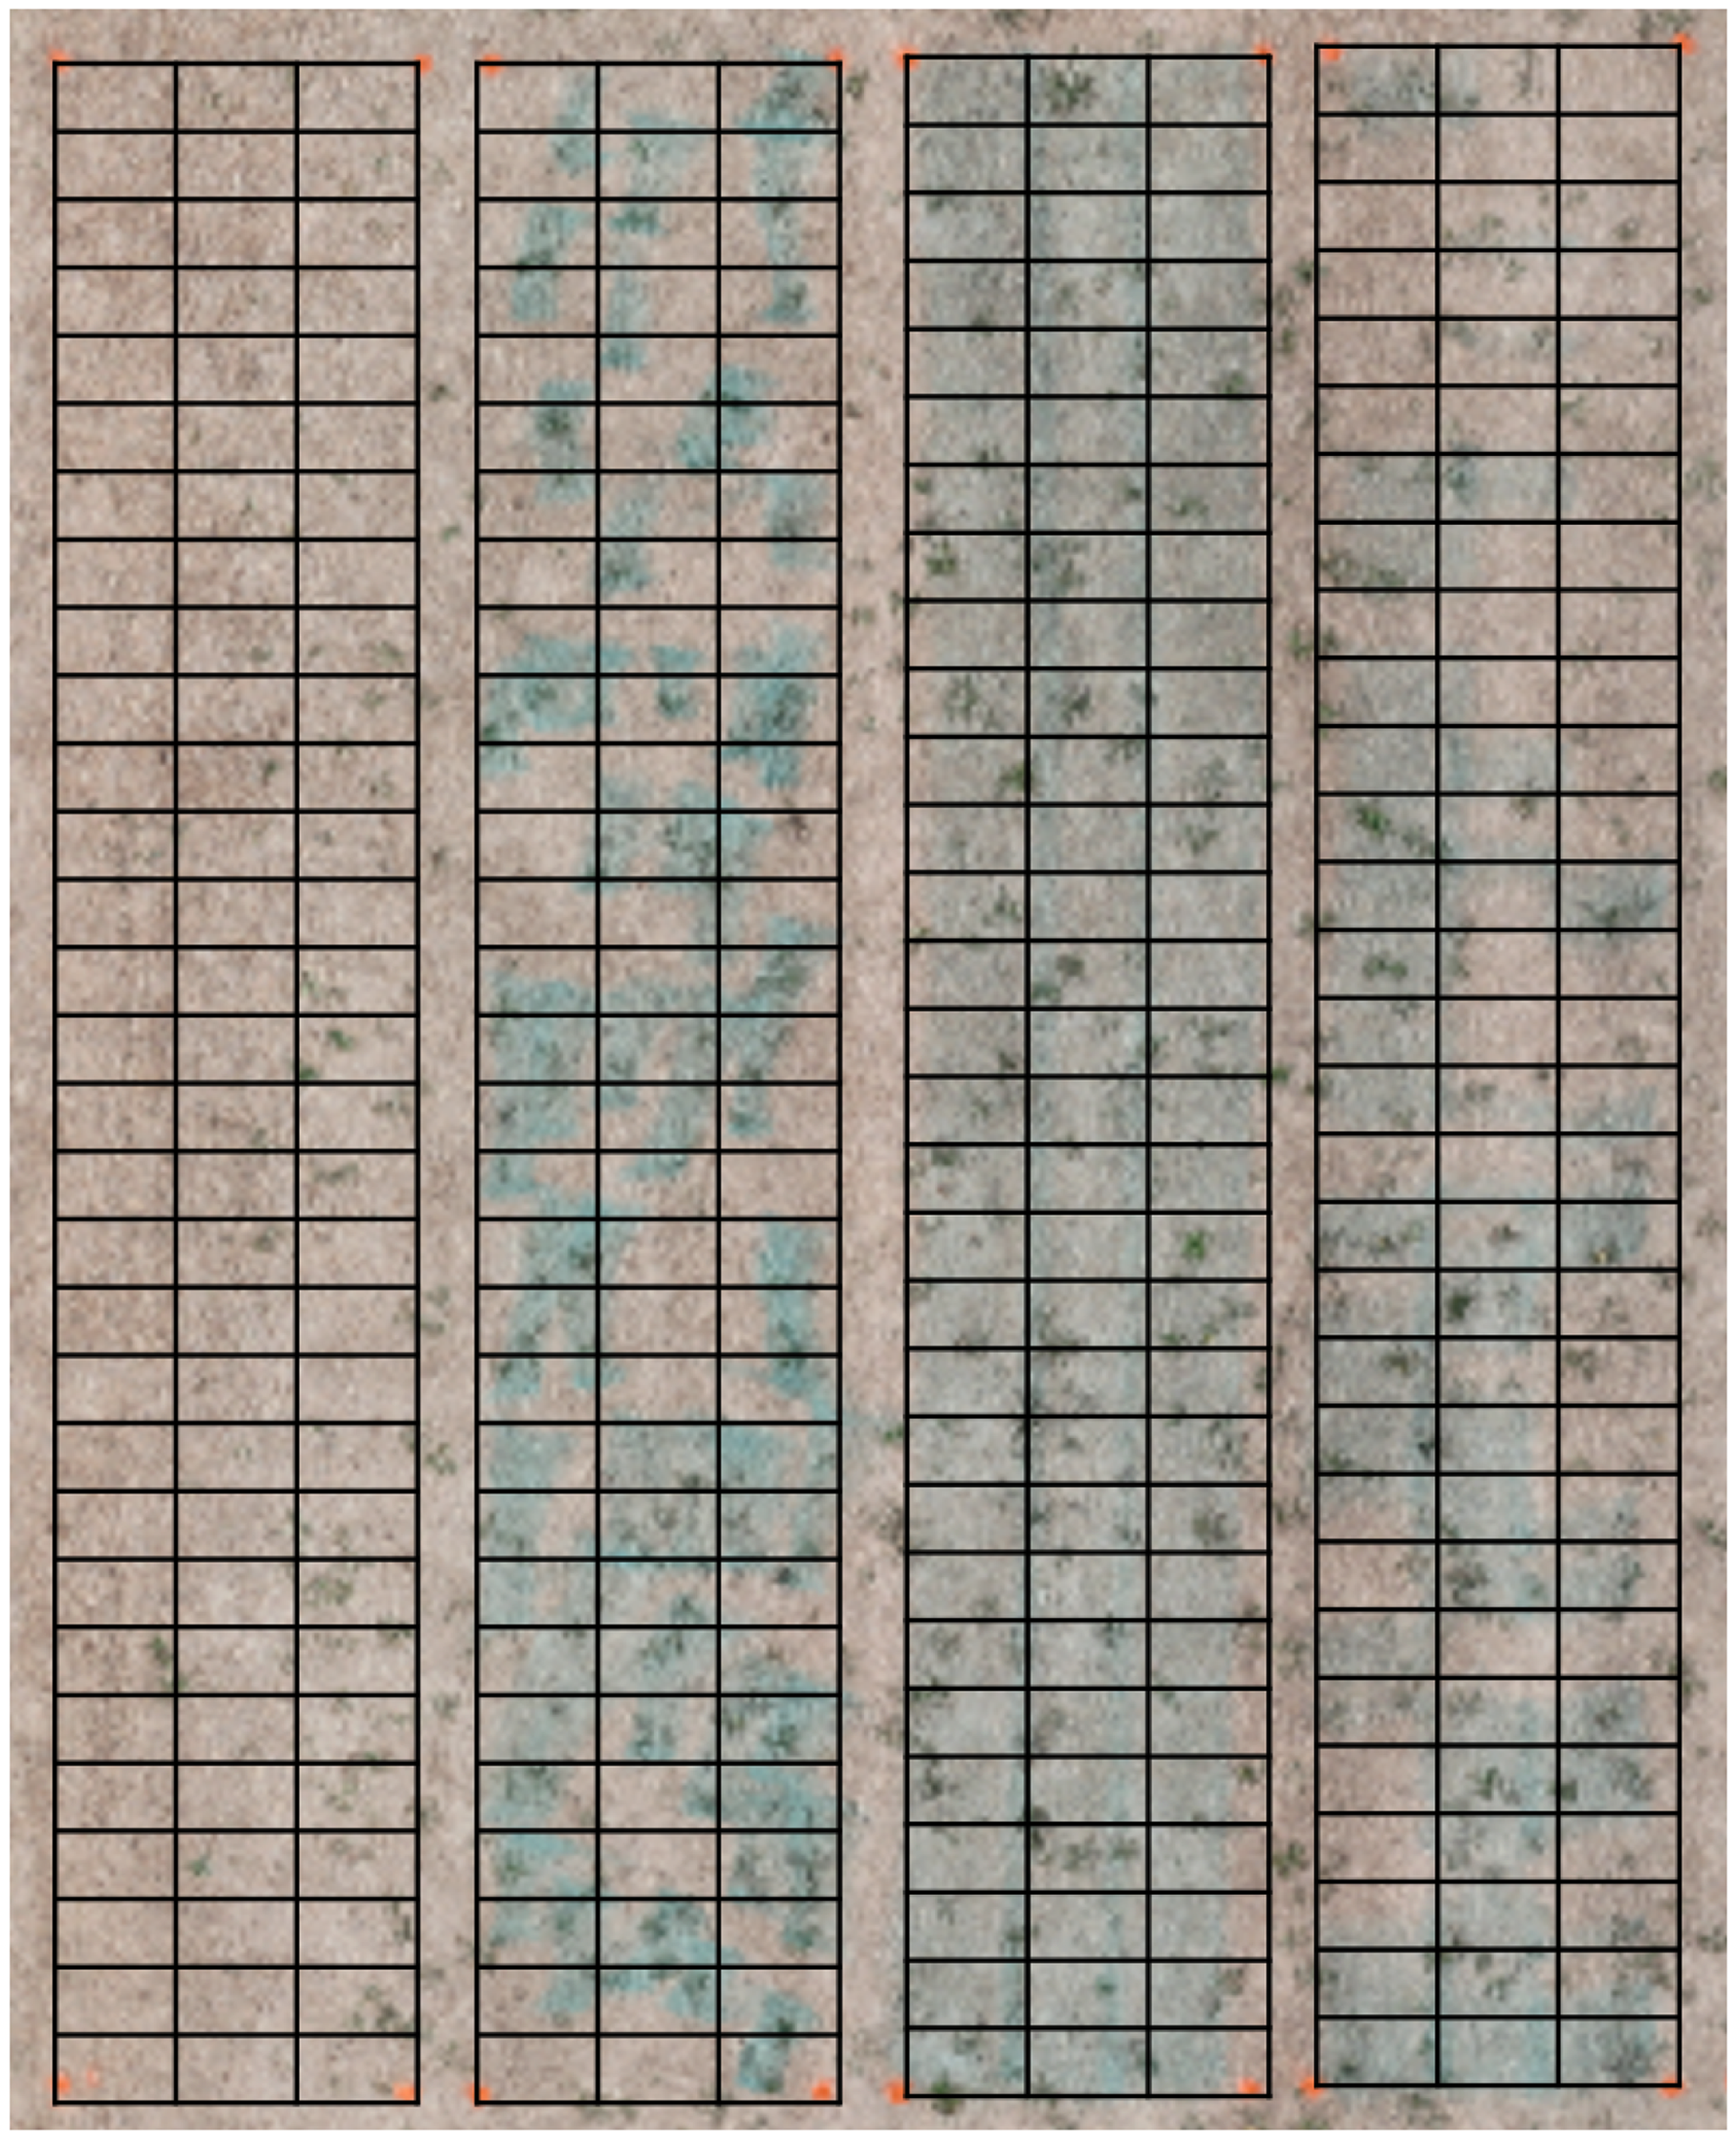
The study at the Elkins location was the first trial where the software and hardware were tested and served as a pilot study, and the method for rating the percentage of weeds sprayed in each plot (recall) differed from other trial locations. Unlike other locations, individual weeds were not counted immediately after application at Elkins, so recall was estimated via grid analysis from drone imagery. Ninety 0.5-m by 0.3-m grids were digitally placed on each plot (Figure 7). The grids that had a weed present and were sprayed (i.e., blue dye in the grid) were counted and recorded as a true positive (TP). The grids that had a weed present and were not sprayed (i.e., no blue dye in the grid) were counted as true negative (TN). Equation w was then used to calculate recall for each plot: $Recall\left( {\rm{\% }} \right) = {{{{{TP}}}}\over{{{{TP\; + \;TN}}}}} \times 100$
Ninety 0.5- by 0.3-m grids placed on 1.5-m by 9.1-m plots. This specific case is one replication at the pilot study (i.e., the Middle Fork Research Farm in Elkins) where recall was estimated by the grids with weeds present that were either sprayed or not sprayed.

Based on the first trial, counting weeds digitally via drone imagery was determined to be less accurate, so recall was assessed by a person who counted the weeds at the remaining locations.
To measure recall for the other three locations, the Equation 3 was used: $Recall\left( \% \right) = {{{\rm{Total}}\;{\rm{Weeds}} - {\rm{Weeds}}\;{\rm{Not}}\;{\rm{Sprayed}}} \over {{\rm{Total}}\;{\rm{Weeds}}}} \times 100$
Two-way ANOVA was conducted on the interaction between location and application method, which determined significant application method differences among locations (α = 0.05). Therefore, each location was analyzed independently, and recall, spray volume, and treatment time data were each subjected to one-way ANOVA, and means were separated using the Tukey HSD test at α = 0.05 significance level. Treatment was considered a fixed effect and block was considered a random effect. All statistical tests were derived from a linear mixed effects model with the lmer function in the lme4 package, and subsequent analysis of variance was performed with the anova function (base R Stats package) in RStudio (v.2025.09.2+401) (R Core Team 2020).
Results and Discussion
Pilot Study
Because different methods were practiced in the pilot study, all data from Elkins were analyzed separately. Results from this location determined a flaw in digitally counting weeds after application,. Additionally, several instances occurred when an actively growing weed was counted prior to application but it was undetected by the DGCI system. Failed detection was likely associated with the mowing height at Elkins (5.1 cm). The dormant bermudagrass was tan in color and the bermudagrass leaves were positioned above the weeds, which thereby obscured the weeds growing beneath the turfgrass canopy. This presents a potential limitation of the DGCI system in managing winter weeds in dormant bermudagrass, especially in locations where turfgrass is maintained at a higher mowing height, which is standard for home lawns and golf course roughs. Occlusion of weeds from machine vision sprayer technology has hindered precision applications in other cropping systems as well (Wu et al. Reference Wu, Chen, Zhao, Kang and Ding2021). Despite these flaws, the results from Elkins were instrumental in determining more thorough methodology for the remaining locations, so data were still analyzed and recorded.
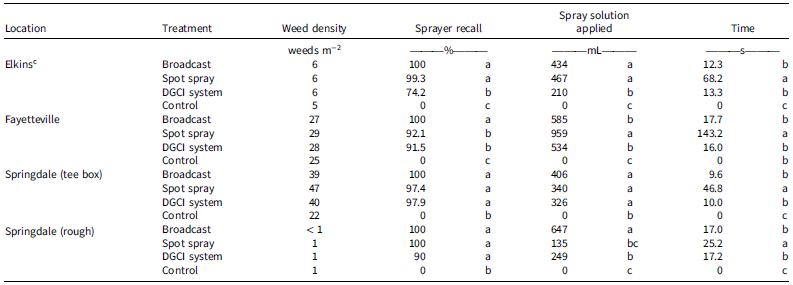
Nearly all weeds at Elkins were broadleaf species, with the majority being common dandelion at an average weed density of 6 weeds m−2. Estimated recall was 100%, 99.3%, and 74.2% for the broadcast application, spot spray, and DGCI system, respectively (Table 3). There was no difference in recall between the broadcast and spot application; however, recall for the DGCI system was significantly lower, which was likely influenced by mowing height.
Average weed density, sprayer recall, spray solution applied, and time required to spray the plots per location and treatment.a,b

Abbreviation: DGCI, dark green color index.
a Means are compared between treatments within location; means followed by the same letter within a column and location are not different based on the Tukey HSD test (α = 0.05).
b For Elkins, Fayetteville, and Springdale (tee box), weed density was determined from the total weed population. For Springdale (rough), the weed density was determined from the wild garlic (Allium vineale) population only.
c The Elkins location served as a pilot study.
On average, the volume of spray solution applied at Elkins for each treatment was 434 mL, 467 mL, and 210 mL for the broadcast application, spot spray, and DGCI system, respectively. The DGCI system applied 52% less spray solution than the broadcast application (Table 3), however, there was a significant reduction in recall for Elkins as well due to the positioning of weeds relative to the dormant turfgrass. These results suggest the DGCI system may not be suitable for applications to turfgrass maintained at a higher mowing height.
Broadcast and DGCI system applications were operated at the same speed, so there was no difference in application time. However, the time required to apply herbicides via broadcast and with the DGCI system was significantly less than the time required for spot application, indicating a potential increase of efficiency with the DGCI system (Table 3).
Sprayer Recall
The DGCI system we developed was designed to apply less glyphosate to winter weeds in dormant bermudagrass via precision application while achieving similar recall to that of a broadcast application. Glyphosate is a traditional herbicide used to treat weeds in dormant bermudagrass, particularly annual bluegrass (Toler at al. Reference Toler, Willis, Estes and McCarty2007). We acknowledge that a more optimal herbicide type, rate, and time of year may exist to obtain better weed control. However, because this study sought to investigate a DGCI-based approach to machine vision spraying, the goal was to measure the DGCI system’s ability to detect and spray weeds (i.e., as a percentage of the total weed population), which we theorized would simulate weed control. At all locations, the system’s recall of each nontreated control plot was 0% as no spray was applied to the plots.
In Fayetteville (weed density of 27 weeds m−2), recall was 100%, 92.1%, and 91.5% for the broadcast application, spot spray, and DGCI system, respectively. The spot application and DGCI system had significantly lower recall percentages than the broadcast application (Table 3). At the Fayetteville location, the primary weeds that were present included annual bluegrass and perennial ryegrass (Lolium perenne L.). Broadleaf weeds consisted of sibara <2 cm in diameter. Grassy weeds were larger (>5 cm in diameter) and more prevalent than broadleaf weeds, thus the adjacent pixel threshold for the DGCI system was set to treat plants of this size or larger. Though we explored setting the adjacent pixel threshold to target the smaller broadleaf weeds, the noise from the camera was too excessive and would have resulted in the DGCI system activating and spraying erroneously. Despite an application timing of late February when annual bluegrass plants were actively tillering (i.e., 3-tiller stage or more), glyphosate has been reported to adequately control annual bluegrass (Toler et al. Reference Toler, Willis, Estes and McCarty2007).
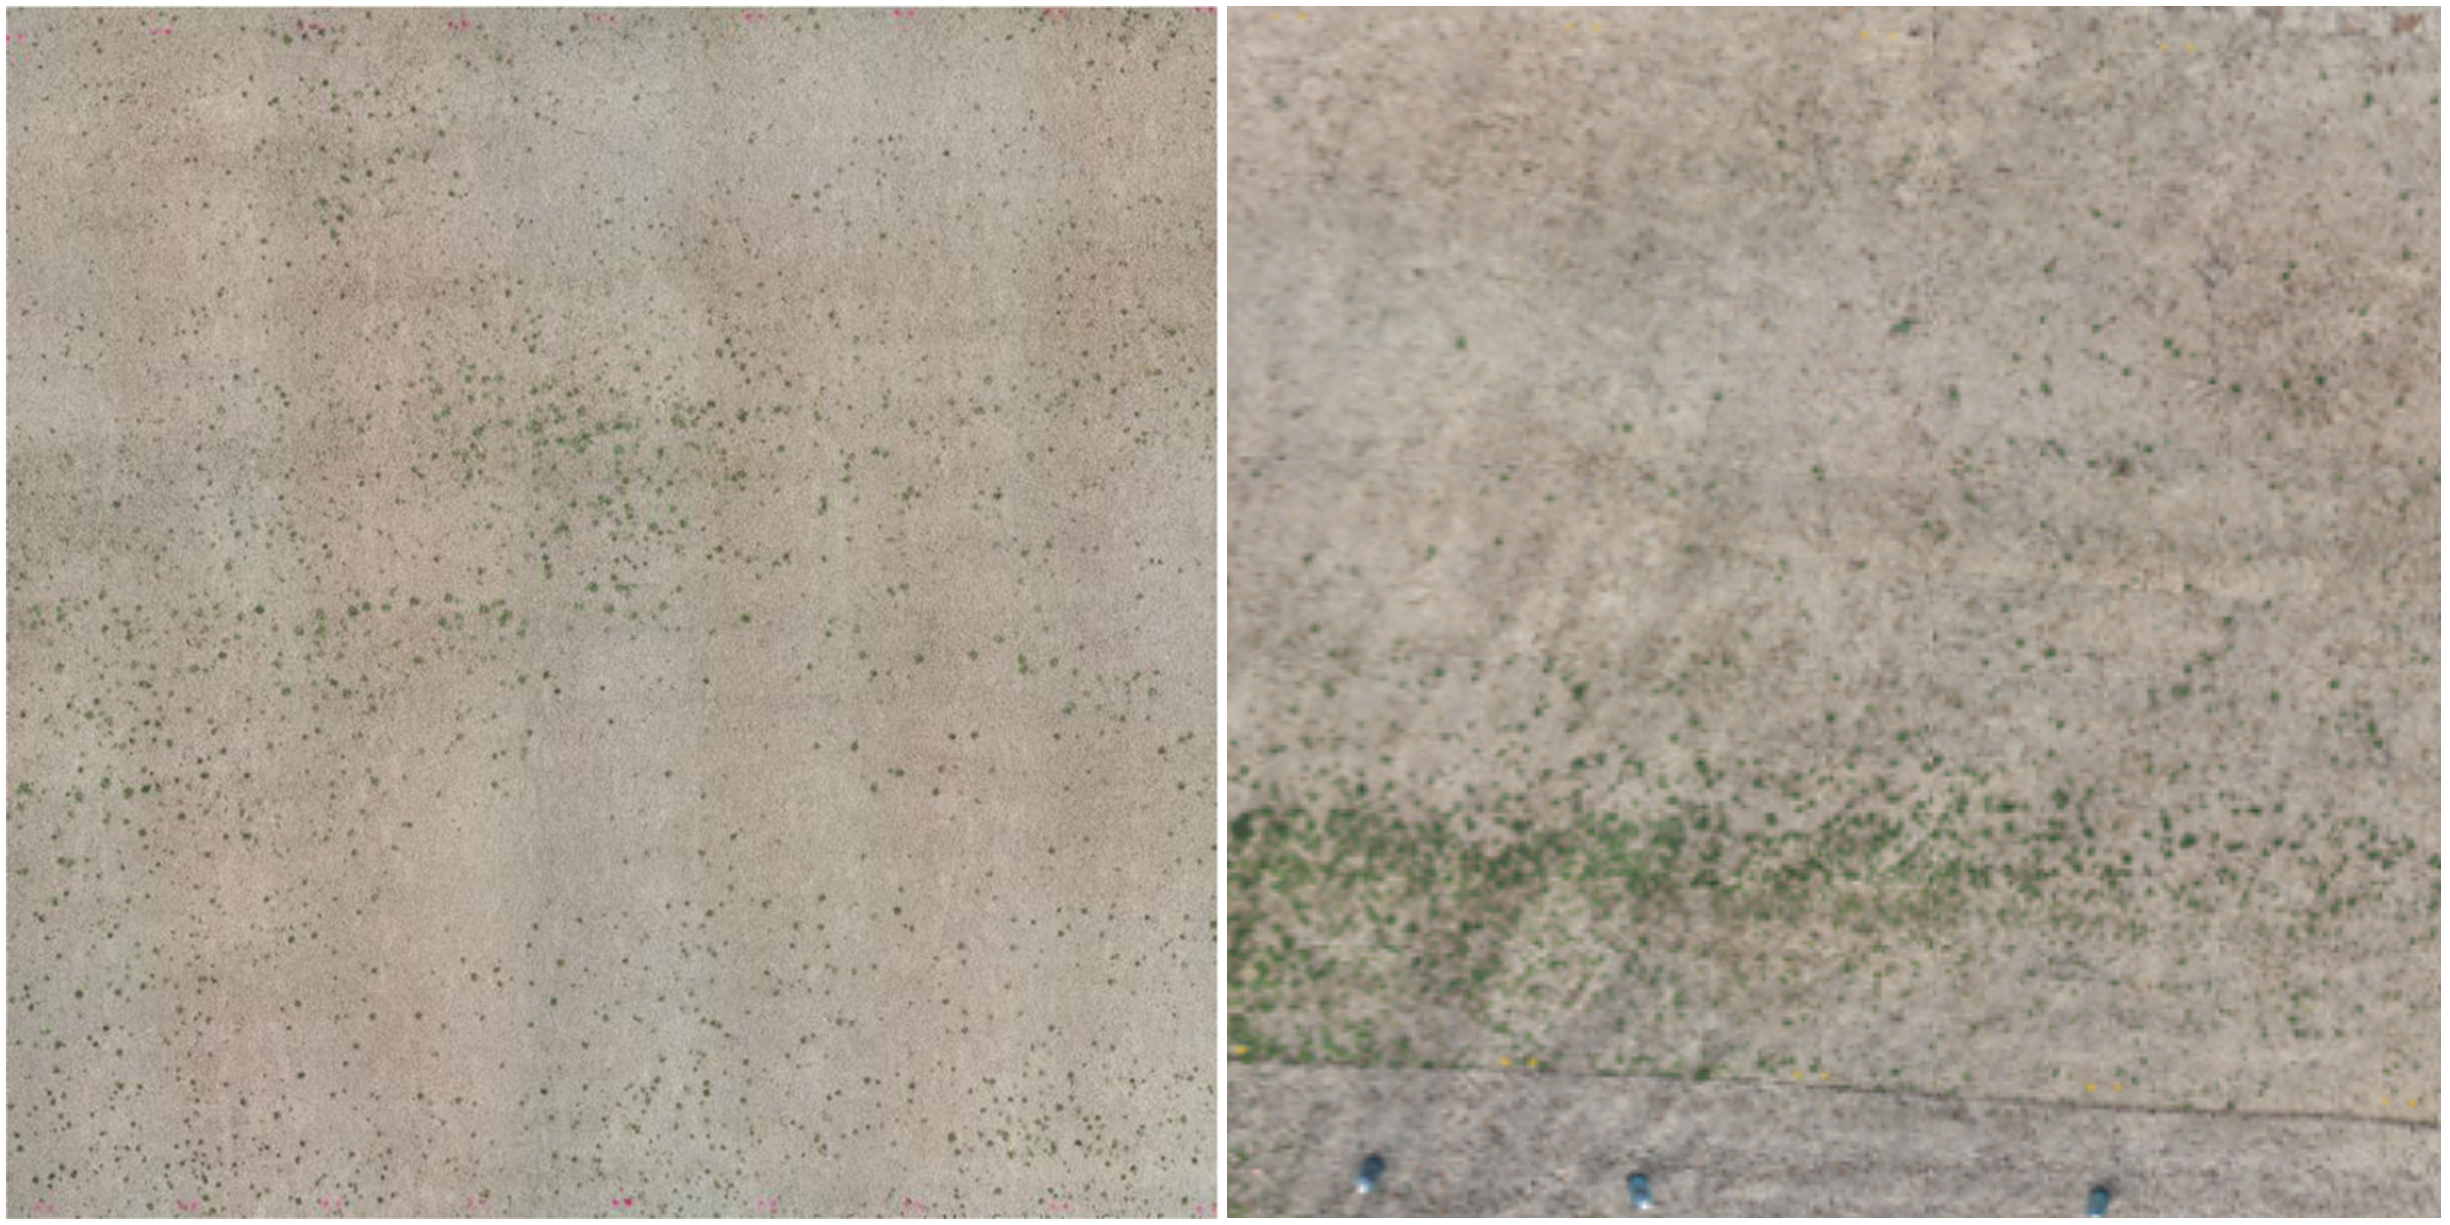
Overall, the tee box site at the Springdale location exhibited the greatest weed density (37 weeds m−2); however, the weed distribution was not uniform. At this location, weed density was greatest in the southern-third of the trial area, thus the trial was established so that the unique weed distribution was captured within each plot (Figure 8). There were no differences in recall among the three application methods in the tee box experiments at the Springdale location (Table 3).
The weed distribution at Fayetteville (left) compared to Springdale (right). These images represent two replications (Fayetteville) and one replication (Springdale [tee box]) of the entire plot area, but the distribution remained similar throughout the plot area.

Wild garlic was the primary weed species present the rough at the Springdale location, so the adjacent pixel threshold on the DGCI system was set to optimize efficiency for this species. Therefore, the following recall data represents wild garlic only. There were no differences in recall between application methods at this location (Table 3). This location exhibited optimal conditions to highlight the benefits of the DGCI system because weed density was minimal (1 weed m−2), and weeds were several centimeters taller than the bermudagrass. It is important to note that due to the higher height of cut, some weeds were obscured by the turfgrass canopy. Had those weeds been included in recall analysis, results would likely have been influenced similarly to the pilot study.
Herbicide Reduction
Application recall does not directly report data on false positives (i.e., spraying areas where weeds are absent). However, the data collected for the volume of spray solution applied to the plot yields indirect information for false positives of the sprayer applications as any false positives would result in a greater volume of spray solution applied. Each trial location The volume of spray solution applied was different at each location (Table 3). The volume of spray solution applied to each control plot across trial locations was 0 mL.
Fayetteville and Springdale (tee box) had the greatest weed density and similar weed species. To optimize recall with a substantial weed density, the DGCI system activated more often, therefore, more spray solution was required to treat the plots. In Fayetteville, there were no significant differences between the broadcast application and DGCI system. However, the spot application with the backpack sprayer applied 44% more spray solution than the DGCI system due to the increased weed density in the trial (Table 3). The increase in spray solution with spot application is likely subject to operator error because there is a general misconception of how much product is needed to treat a weed when spraying with a backpack sprayer.
There were no differences between treatments in the volume of spray solution applied at Springdale (tee box), likely due to the greater weed density at this location. At other trial locations where weed density was lower, spray volume for spot applications and the DGCI system was less than a broadcast application.
Weed density in the rough at the Springdale site was the least among the four trial locations (1 weed m−2). Compared to the broadcast application, spray volume was reduced by 79% with the spot application and 62% with the DGCI system (Table 3). For this trial, wild garlic was several centimeters taller than bermudagrass, so detection and recall by the DGCI system was greater than at other locations. Results from these studies suggest herbicides applied with the DGCI system could reduce the amount of herbicide used, especially when weed populations are less dense.
The purpose of these initial DGCI system studies was to test the capabilities of DGCI to detect winter weeds in dormant bermudagrass. The DGCI system we tested was a prototype, and due to hardware limitations, the minimum surface area of spray volume (i.e., independent of weed size) for a single nozzle was 407 cm2. If the weed size exceeded the minimum pixel threshold, the minimum surface area of spray was output to the turfgrass. Any additional weed detections within 0.1 s (at an operating speed of 2.4 km h−1) of the original detection would increase the minimum surface area until detections ceased. Therefore, future prototypes should have a smaller minimum surface area, which could be achieved by increasing the number of nozzles on the boom to reduce the volume of herbicide applied.
Time Reduction
At all trial locations, the operating time for the broadcast and DGCI applications was less than the operating time for spot applications with a backpack sprayer. In the rough at the Springdale site, where the lowest weed density was observed, the average application time was 17 s, 17.2 s, and 25.2 s for the broadcast application, DGCI system, and spot application, respectively (Table 3). Broadcast and DGCI applications were approximately 32% to 33% faster than the spot application, respectively. The difference in operating time between the DGCI system and spot application was more pronounced as weed density increased. For example, at Fayetteville, there was an 88.9% decrease in operating time with the DGCI system compared with spot application time. In some settings, individual weed treatment using a backpack sprayer is the optimal option for weed management, particularly in areas that are difficult to reach with equipment. However, the DGCI system offers a unique methodology to apply herbicide to individual weeds in a more time-efficient manner.
Limitations of the DGCI System
Precision applications with the DGCI system suggest potential for turfgrass managers, but the prototype for the DGCI system we assembled had limitations that further developments should address for optimization of weed detection and control. For instance, boom height was fixed at 36 cm from the ground, resulting in a nozzle swath width of 61 cm. To optimize applications using a DGCI system, a lower boom height and increased number of nozzles would result in more precise applications and ultimately decrease the volume of herbicide applied compared to broadcast applications.
In the prototype evaluated in these experiments, efficiency was severely limited by camera and computer operating power. Excessive noise generated from the camera at increased walking speed forced the operator to walk at 2.4 km h−1, which was half of the target speed of 4.8 km h−1. A greater frame rate could also reduce camera noise and allow for a faster application speed; however, the computing power of the control system may not be sufficient for a faster frame rate, so improvements to the computer hardware would also need to be implemented. Lastly, the camera settings selected for application with the DGCI system were chosen through a process of trial and error, but more optimized settings might decrease camera noise and increase recall (Table 1). For example, the camera had a setting that would automatically adjust to the light intensity, but that setting did not function properly in full sunlight, which is why the operator manually adjusted the exposure.
Turfgrass canopy architecture and debris could also be problematic for applications with the DGCI system. Turfgrass canopies can have differences in density, mowing height, and color that decrease recall for the DGCI system. For instance, the positioning of weeds beneath the turfgrass canopy in the pilot study resulted in a failure of the camera to identify some of the weeds and reduced recall for the DGCI system. Debris such as leaves, pinecones, and irrigation heads could be present on or in the turfgrass canopy and could hinder the efficiency of precision applications that rely on vegetative indices. Additionally, shade could cause the DGCI system to activate spray in inappropriate scenarios. A potential solution to minimize the effect of shade is to implement a system similar to the design of a light box (Mattox et al. Reference Mattox, Kowalewski, McDonald, Lambrinos, Daviscourt and Pscheidt2017). Another option could be to install a fixed light source that would illuminate the activation zone of the DGCI system, which would eliminate shade from the camera’s perspective.
Future Research
Precision sprayer applications in turfgrass systems have been scarcely adopted by turfgrass managers. Several studies have explored precision applications in turfgrass with machine learning and GPS systems (Booth et al. Reference Booth, Sullivan, Askew, Kochersberger and McCall2021; Henderson et al. Reference Henderson, Haak, Mehl, Shafian and McCall2025; Jin et al. Reference Jin, Liu, Yang, Xie, Bagavathiannan, Hong, Xu, Chen, Yu and Chen2023; Kitchin et al. Reference Kitchin, Sneed and McCall2024; Xie et al. Reference Xie, Hu, Bagavathiannan and Song2021; Yu et al. Reference Yu, Sharpe, Schumann and Boyd2019). Both machine learning and GPS systems have potential for implementation in the turfgrass industry. Petelewicz et al. (Reference Petelewicz, Zhou, Schiavon, MacDonald, Schumann and Boyd2024) developed a You Only Look Once machine learning model that resulted in 60% recall in simulated spotted spurge (Chamaesyce maculata L.) growing in bermudagrass. However, the process of drawing bounding boxes surrounding the spotted spurge in more than 1,000 images was laborious.
Vegetative indices, such as DGCI, offer a simple implementation for precision herbicide applications, especially in dormant warm-season turfgrass scenarios. However, other indices could be incorporated for precision treatment by a simple code change. For example, further studies that explore the use of vegetative indices should consider the use of a spectroradiometer to isolate the most severe differences in spectral reflectance for other turfgrass hosts and weeds. From the most severe difference of the spectral reflectance, a simple band calculation can be performed to highlight the difference (e.g., subtract blue band from red band). Similar studies were completed by Kazmi et al. (Reference Kazmi, Garcia-Ruiz, Nielsen, Rasmussen and Andersen2015) in sugar beet (Beta vulgaris L.), and the results demonstrated a recall of 97%. The simple implementation of a vegetative index is not only useful for detecting and treating turfgrass weeds, but vegetative indices also may be effective against other biotic and abiotic turfgrass stressors such as diseases and isolated dry spot.
Practical Implications
Despite the current limitations of the DGCI prototype described here, results from the system we developed were promising. Across locations, DGCI system applications were faster than spot applications and could be used by turfgrass managers facing labor time constraints during winter months. Additionally, there is potential for the DGCI system to reduce the amount of herbicide applied and achieve acceptable recall because the results from the three nonpilot studies exhibited at least 90% recall. Additionally, this technology could ideally be incorporated into existing spray systems because the components required (i.e., computer, camera, and solenoid valves) offer flexible installation options. The total cost to build the prototype was roughly US$850.
Acknowledgments
We thank Andy Thompson of Springdale Country Club, Middle Fork Research LLC, and the rest of the University of Arkansas turfgrass team for their assistance with this project.
Funding
This manuscript served as one of author S. Kreinberg’s research projects while he was a graduate assistant. S. Kreinberg’s stipend was funded through The Alotian Golf Club.
Competing Interests
The authors declare they have no competing interests.

 Open access

