


Increase in adipose tissue (AT) mass and changes in AT distribution are associated with increased risk of developing disorders such as the metabolic syndrome, cardiovascular diseases or diabetes(Reference Wajchenberg1). Subcutaneous (SAT) and intra-abdominal AT (IAAT) have major functional and structural differences(Reference Ibrahim2). This latter AT is composed of visceral AT (VAT) (bound by the fascia transversalis) and retroperitoneal AT (RAT) (between the fascia transversalis and the fascia abdominis subcutanea or Scarpa's fascia)(Reference Shen, Wang and Punyanita3). Visceral adiposity is highly correlated with a metabolic risk(Reference Yang, Chen and Clements4). Therefore, an accurate determination of body adiposity and AT distribution is of major interest to evaluate the metabolic risk of patients and/or further investigate the relationship between physiology and adiposity parameters in human subjects or animal models. Even though IAAT can be estimated by anatomical indexes such as BMI and waist circumference(Reference Weerarathna, Lekamwasam and Rodrigo5, Reference Kashihara, Lee and Kawakubo6), some studies demonstrated that those measurements may misclassify individuals in terms of metabolic risk(Reference Baumgartner, Wayne and Waters7, Reference Pou, Massaro and Hoffmann8). In addition to anthropometric measurements, AT mass can also be assessed by bioelectric impedance, dual-energy X-ray absorptiometry, abdominal ultrasonography, MRI and computed tomography (CT)(Reference van der Kooy and Seidell9). Because of its spatial resolution and reproducibility, CT is now considered as the ‘gold’ standard for adiposity measurement. In human subjects, several analytical methods based on single-slice scan estimation have been described(Reference Yoshizumi, Nakamura and Yamane10, Reference Romero, Ramirez and Marmol11). The use of such a method instead of a full abdominal three-dimensional reconstruction reduces X-ray exposure, as well as image acquisition and analysis time. Moreover, it is less expensive than a whole-body scan, and it is less prone to motion artifacts mainly associated with respiratory excursion. CT scanners are now available for the quantification of AT and its distribution in laboratory rodents, and these measurements have been validated by several authors(Reference Hildebrandt, Kelly-Sullivan and Black12–Reference Luu, Lublinsky and Ozcivici14). Luu et al. (Reference Luu, Lublinsky and Ozcivici14) even demonstrated that the analysis of selected abdominal slices showed a good correlation with whole-body scans, though such studies using alternative research models are lacking.
The pig is emerging as a model of predilection in biomedical research(Reference Vodicka, Smetana and Dvorankova15, Reference Spurlock and Gabler16) because of its metabolic features and ability to develop metabolic disorders observed in humans (e.g. excessive fat deposition, diabetes, atherosclerosis and hypertension). As a consequence, the number of studies using minipigs as a model of adult human obesity has increased in the recent years(Reference Johansen, Hansen and Richelsen17, Reference Dyson, Alloosh and Vuchetich18). To our knowledge, the use of CT to evaluate body adiposity in the pig has been mentioned in only one study(Reference Dyson, Alloosh and Vuchetich18), but this method has not been validated properly in this species. The main purpose of the present study was thus to validate the use of CT to assess AT distribution and AT mass in comparison with ultrasonography, anatomical measurements and body chemical analysis in Göttingen minipigs, which have been widely used in the literature. To determine whether these minipigs may be a good model of obesity, the effect of a deleterious diet on adiposity and insulin resistance was also examined. Another important point is that this diet intervention is a means to induce large variation in body composition. It thus allows us to calculate correlations between different measures of adiposity.
Materials and methods
Animals and diets
The present experiment was conducted in accordance with the ethical standards of the European Community (directive 86/609/EEC), agreement no. A35-622 and authorisation no. 01 894. In the present study, 30-month-old adult male Göttingen miniature pigs were used (Ellegard Göttingen Minipigs ApS, Dalmose, Denmark). They were housed in individual pens under controlled conditions (temperature kept between 22 and 23°C) with 12 h light–12 h dark cycle and had free access to water.
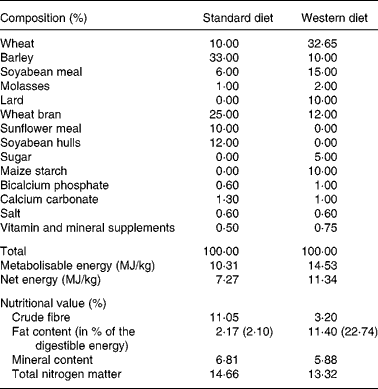
Before beginning the experiments, all the pigs were fed a standard diet (Table 1) that was formulated and rationed to maintain a lean phenotype in the Göttingen minipig (41·5 g/kg0·75 of body weight once daily at 09.00 hours, on average 6·47 MJ/d per animal). Three groups of pigs were used. In group 1, eight lean animals were submitted to a first set of CT-scan and ultrasonographic adiposity measurements. Then, they were offered ad libitum a Western diet (WD, Table 1) enriched with carbohydrates and lipids (one meal offered at 09.00 hours and calculated to exceed the daily consumption of the animals, on average 19·39 MJ/d per animal). After 15 weeks of such a diet, a second set of adiposity measurements was performed. In group 2, seven other animals were offered a WD during 4–10 weeks according to a rationing plan designed to obtain animals with a wide range of body weight and adiposity (from 6·16 to 15·84 MJ and on average 11·13 MJ/d per animal). These minipigs were submitted to CT-scan adiposity measurements at the end of this period and thereafter, they were slaughtered in our experimental slaughterhouse by electrical stunning and exsanguination for direct ex vivo AT evaluation. The measurements performed for all the animals are summarised in Table 2. In a third group, four animals (one Göttingen minipig and three growing pigs) were used to validate the CT-scan method.
Composition and nutritional values of the standard and Western diets used to feed the Göttingen minipigs
(Mean values with their standard errors)

WD, Western diet; IVGTT, intravenous glucose tolerance test; TAT, total adipose tissue; SAT, subcutaneous adipose tissue; VAT, visceral adipose tissue; IAAT, intra-abdominal adipose tissue = RAT+VAT; CT, computed tomography.
* Mean values values were statistically different (P < 0·05) between lean and obese conditions in group 1, except for basal glycaemia. Due to heterogeneity in the individual rationing plans, group 2 was not compared with group 1.
† 1 IU = 45·5 μg pure crystalline insulin.
Computed tomography-scan adiposity measurement
Computed tomography-scan procedure and analysis
Feed was withheld for 15–18 h before CT measurements. Animals were anaesthetised before CT-scan acquisition with an injection of ketamine (5 mg/kg intramuscularly; Rhône Merieux, Lyon, France). CT scans (Hispeed NX/I; General Electric Medical Systems, Milwaukee, WI, USA) were performed with all subjects in the prone position (Axial slice, 120 kV, 80–100 mA depending of the scout scan data, section thickness of 4 mm, exposition time of 3000 ms, data collection diameter of 500 mm, reconstruction type set as standard, no reconstruction filter and matrix size 512 × 512). A scout acquisition was performed in all subjects to localise the thoracic vertebra no. 13 (T13) and lumbar vertebra no. 2 (L2). Two cross-sectional scans were acquired at these two levels that were chosen for three reasons. First, CT scans in human subjects are generally performed at a level where the abdominal girth is the widest, i.e. the L4–L5 level (preferable to a slice at the umbilicus location which is highly variable among individuals). In minipigs, the abdominal girth is widest at the T13–L2 levels. Secondly, the L2 level is of particular interest in the pig because the P2 site, a commonly used site in the pig industry to measure SAT thickness by ultrasonography, is located on this slice. McEvoy et al. (Reference McEvoy, Madsen and Nielsen19) indicated that the current P2 site is situated in an area of low local variation and optimal correlation with the total volume of SAT. Finally, it is easier to delineate manually the RAT after identification of the kidneys that are clearly visible at the L2 level in the pig. Digital Imaging and Communications in Medicine (DICOM) 3.0-uncompressed images were exported to ImageJ software (National Institutes of Health, Rockville, MD, USA) for further analyses. The CT-scan machine was calibrated daily against air density and 30–60 min before the animal scan. The CT was also calibrated weekly for Hounsfield units with a water phantom. Its spatial resolution was also evaluated weekly against a water/Plexiglas phantom. The size of the reconstructed pixels was 0·495 mm2 (1·422 pixels/mm). The method used in the present study was based on the standardised technique for adiposity measurement in human subjects(Reference Yoshizumi, Nakamura and Yamane10). A region of interest of the well-identified subcutaneous adipose layer was delineated by manual drawing of its contour on each scan (Fig. 1(a) and (b)), and the X-ray density range (in Hounsfield units) for AT was calculated. A histogram for AT was computed to extract the mean and standard deviation. Three regions of interest were then drawn on each scan to include the whole scan area, the intra-abdominal area and the intraperitoneal area, respectively (the peritoneum was clearly visible and represented a good anatomical landmark). Tissue with X-ray density values within the mean (2 sd) as calculated above was considered as AT. The SAT area was obtained by subtracting the IAAT from the total AT (TAT), and the RAT area was obtained by subtracting the VAT from the IAAT. The pixels with X-ray density values in the selected X-ray density range were depicted as three different colours (Fig. 1(a)): SAT (yellow), RAT (blue) and VAT (red). The T13 and L2 circumferences (cm) of the animals were also determined on the CT scans.
Adiposity measurement by computed tomography (CT) in minipigs. (a) Main steps for the analysis of adiposity distribution in a CT-scan slice. Step 1, a well-identified sample area is selected in the subcutaneous adipose tissue, for which the grey shades histogram and distribution are calculated. Step 2, a double threshold is applied to the CT-scan image to visualise the total adipose tissue in the slice ((M − 2 sd; M+2 sd) with M = mean and sd = standard deviation calculated in step 1). Step 3, the adipose tissue amount (in cm2) is calculated in three regions of interest with I including the whole slice and consequently the total adipose tissue, II including the intra-abdominal area (retroperitoneal adipose tissue (RAT) and visceral adipose tissue (VAT)), and III including only the intraperitoneal area and visceral adipose tissue. Step 4, once identified and calculated in each region of interest, the adiposity is represented with three colours for an easier visualisation. (b) Adiposity distribution between subcutaneous adipose tissue (SAT), RAT and VAT (lumbar vertebra no. 2 level, L2) in three individuals fed a standard diet (6·95 MJ/d) and a WD during 10 weeks (14·64 MJ/d) or 15 weeks (19·58 MJ/d). (c) Adiposity distribution measured by CT scan in minipigs fed a standard diet (group 1 in lean condition, n 8), a WD during 4–10 weeks (group 2, n 7) or a Western diet during 15 weeks (group 1 in obese condition, n 8). The proportion of total adipose tissue (in percentage of CT slice area) is indicated on the right of each histogram, whereas the proportion of adiposity (in % of total fat) is indicated for the SAT, RAT and VAT.

Computed tomography-scan method validation
Additional measures were performed to assess the accuracy, sensitivity and reliability of the method. Adiposity measurement may be influenced by several factors (e.g. slight differences in animal positioning on the scanner bed, breathing movements and organ movements inside the abdominal cavity). To evaluate inter-scan variability, replicate measurements (n 6) were performed at the L2 level on the same minipig (30·4 kg) with repositioning before each scan. To evaluate the sensitivity of our method, three large White pigs (one donor of 47·2 kg and two receivers of 37·7 and 39·0 kg, respectively) were used to perform surgical implantation of adipose pads in the abdominal cavity of the two receivers. Two fat pads were removed from the subcutaneous AT of the donor pig. One receiver was implanted with a 1 cm2 section adipose pad, and the second receiver was implanted with a 4 cm2 section adipose pad. Surgical adipose removal and implantation were realised in artificially ventilated anaesthetised animals (Model AS3/ADU, GE Healthcare, Milwaukee, WI, USA). Pre-anaesthesia was induced by ketamine (5 mg/kg, intramuscularly). Anaesthesia was maintained with inhaled isoflurane (2·5 %, v/v) so to achieve a minimal alveolar concentration ranging between 1·8 and 2·2. Analgesia was achieved by an intravenous administration of fentanyl (1 ml bolus, then 6 ml/h perfusion until the end of the experiment). Euthanasia was realised with intravenous injection of T61 (Intervet, Beaucouzé, France). Finally, ten CT scans acquired in obese and non-obese minipigs from groups 1 and 2 were used to determine intra- and inter-rater variabilities. The CT-scan data were analysed in duplicate at a 6-month interval by the same rater and also by an inexperienced rater.
Ultrasonographic adiposity measurement
Echographic images (ATL Ultramark 9; Advanced Technology Laboratories, Bothell, WA, USA) were acquired in the two-dimensional mode immediately after the CT-scan acquisition with animals still anaesthetised and maintained in the same position as for CT. The echotomographic machine was fitted with a CLA 76 probe at 3·5 MHz (acoustic power 100 %, dynamic range 50 db, frame rate 9·8 Hz and depth acquisition 15–20 cm). The measurement site was localised by palpation on the left flank, approximately 6–7 cm lateral to the dorsal spinous process at the level of the most caudal point of the last rib (Fig. 2), which corresponded to the P2 site used in the pig industry(Reference McEvoy, Madsen and Nielsen19). After contrast optimisation (C4), the grey-scale image was frozen and transferred to ImageJ software for further analysis. Three different measures of the subcutaneous backfat thickness were realised every 2 cm.
Computed tomography-scan longitudinal and cross-sectional images (thoracic vertebra no. 13, T13 and lumbar vertebra no. 2, L2) showing the location of the ultrasonography measurement site. The measurement site was localised by palpation on the left flank, approximately 6–7 cm lateral to the dorsal spinous process at the level of the most caudal point of the last rib, which corresponded to the P2 site used in the pig industry. Three different measures of the subcutaneous backfat thickness were realised every 2 cm.

Anatomical measurements and body chemical analysis
After slaughtering of minipigs from group 2, intra-abdominal viscera and the perirenal AT were immediately collected. Visceral organs were then emptied. The carcass was laterally cut into two equal parts. The SAT (further called backfat) was excised from the right side of the carcass (from the L2 vertebra to the fifth rib). The left half-carcass (without legs, head and tail) was kept. The collected samples were weighed. The half-carcass and the abdominal content (VAT+RAT) were then stored at − 20°C. These frozen fractions were minced, sampled and freeze-dried for further chemical analyses. Analyses were then performed in duplicate on freeze-dried samples. The residual water content after freeze-drying was determined from 2·0 g samples by drying at+105°C to constant weight. Lipid content was determined from 2 g samples after chloroform–methanol (2:1, v/v) extraction according to Folch et al. (Reference Folch, Lees and Sloane-Stanley20).
Intravenous glucose tolerance test
Animals from group 1 underwent surgery before the beginning of the experiment to allow easy venous access. Pre-anaesthesia was induced by ketamine (5 mg/kg, intramuscularly). Anaesthesia was maintained with inhaled isoflurane (2·5 %, v/v). Analgesia was achieved by a subcutaneous administration of morphine (0·2 mg/kg) every 4 h for 12 h. A silicon catheter was inserted into the left jugular vein and connected to a subcutaneous implantable port allowing repeated sampling (Sitimplant; Vygon, Ecouen, France).
The intravenous glucose tolerance test was conducted before and after 15 weeks of WD. At 08.00 hours, after a 15–18 h overnight fast, blood samples were collected at − 10 min, immediately before (0 min) the intravenous infusion of glucose (0·3 g/kg of body weight, 30 % glucose solution, over 1 min), and 2, 3, 4, 5, 6, 8, 10, 12, 15, 18, 20, 25, 30, 35, 40, 60, 70, 80, 100, 120, 140, 160, 180 and 240 min after the end of the glucose infusion to assay glucose and insulin concentrations. Plasma glucose was measured in duplicate by an automated spectrophotometric method (Konélab 20i; ThermoFisher Scientific, Rockford, IL, USA). The intra-assay CV was < 2·5 %. Plasma insulin concentrations were measured with a specific homologous double-antibody RIA (Cisbio Bioassays, Bagnols-sur-Cèze, France). The intra-assay and inter-assay CV for plasma samples with a mean concentration of 35 μIU/ml were 15 and 11 %, respectively (where 1 IU = 45·5 μg pure crystalline insulin). Basal glucose and insulin concentrations were calculated as the mean of the − 10 and 0 min samples concentration. The glucose and insulin responses were integrated using the minimal model of cold glucose kinetics via the software SAAM II (Simulation, Analysis and Modeling Software for Kinetic Analysis, University of Washington, Seattle, WA, USA), as described in Martin et al. (Reference Martin, Weber and Ward21), to obtain the insulin sensitivity index, S I.
Statistics
Correlation calculations followed by Fisher's r to z tests were performed to analyse the relationship between animal characteristics (e.g. weight or abdominal perimeter) and/or different adiposity measures. Differences between lean and obese conditions in group 1 were assessed via paired t tests. Simple regressions as well as CI at 95 % (mean ± 1·96 sd) were calculated to estimate the repeatability and reliability of the CT-scan measures. A Bland–Altman plot was constructed to visualise the intra- and inter-rater variabilities.
Results
Validation of computed tomography-scan measurements
Replicate measurements of adiposity performed at the L2 level of one minipig indicated that the calculated AT surface on the slice was 95·3 (sd 1·1) cm2 with a CI at 95 % corresponding to 93, 97. This corresponds to an accuracy of approximately ± 2 cm2 in a 30 kg minipig (Fig. 3(a)). Implanted fat pads with a 1 or 4 cm2 section into the abdominal cavity of pigs were easily detected on the CT-scan slice (Fig. 3(b)). These fat pads corresponded to 1·04 and 4·84 %, respectively, of the TAT of the receiver pigs measured at L2. The intra- and inter-rater measures for TAT, SAT, IAAT, RAT and VAT quantification (measured on ten CT-scan slices of minipigs) were similar (intra-rater: r from 0·99 to 1, P < 0·001 and inter-rater: r from 0·98 to 0·99, P < 0·001). Estimation of adiposity distribution (SAT, IAAT, RAT and VAT) in percentage of the TAT was also highly correlated between the two similar analyses performed by the same rater and between the analyses of two different raters (Fig. 4(a) and (c)). The intra- and inter-rater variabilities (Fig. 4(b) and (d)) for adiposity distribution assessment were also very similar, i.e. ± 4·4 and ± 4·7 %, respectively, within the 95 % limits of agreement (1·96 sd from the mean difference), indicating an uncertainty of the measurement less than the 4 cm2 adipose implant visible in Fig. 3(b) (4·82 % of the TAT). All the subsequent analyses were based on a single analysis of each scan by the same operator.
(a) Repeated computed tomography (CT)-scan acquisitions realised at the level of lumbar vertebra no. 2 (L2) on the same minipig. The average total fat surfaces of the slices as well as the CI at 95 % are indicated. (b) CT-scan acquisitions realised on two growing pigs implanted with a 1 and 4 cm2 fat pad, respectively, in the peritoneal cavity. These fat pads represented 1·04 and 4·82 %, respectively, of the total adipose tissue measured at L2 in the receiver animals. Both adipose implants are clearly visible on the CT-scan slices.

Comparison of the assessment of different adipose compartments (subcutaneous, retroperitoneal and visceral) by computed tomography scan in percentage of the total adipose tissue (TAT) measured in a slice in duplicate by the same rater (R 2 0·978) (a) and by two different raters (R 2 0·976) (c). Bland–Altman scatter plots for the two analyses realised by the same rater (b) and for the same analysis realised by two different raters (d). –––––, The mean differences (bias: (b) 0 %; (d) − 0·2 %). 95 % limits of agreement (1·96 sd from the mean difference: (b) ± 4·4 %; (d) ± 4·7 %).

Computed tomography-scan measurements compared with other adiposity measurements
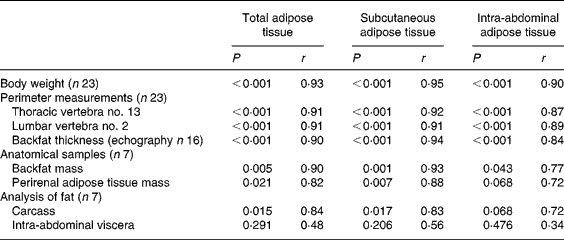
CT-scan measures at T13 and L2 levels were highly correlated for SAT and RAT (r 0·98 and 0·73, respectively, P < 0·001 for both) but not for VAT (r 0·31, P = 0·156). The CT data further presented were averaged upon T13 and L2 measures. Results for groups 1 and 2 are summarised in Table 2. The body weight was highly correlated (P < 0·001) with the average daily energetic intake (r 0·92), the T13 perimeter (r 0·95) and the L2 perimeter (r 0·94). Correlation analyses for CT-scan measures (TAT, SAT and IAAT) v. other adiposity evaluation methods are summarised in Table 3. The perirenal fat weight was highly correlated with the RAT measured by CT (r 0·88, P = 0·005). Compared with the anatomical measurements, the carcass lipid content (r 0·77) and the abdominal lipid content (r 0·83) were best correlated with the perirenal fat weight.
Correlation analyses for computed tomography-scan measurements v. other adiposity evaluation methods*
* Statistical significance was designated as P < 0·05.
Insulin sensitivity and adiposity in lean and obese minipigs
The basal glycaemia was not different between lean and obese conditions in group 1 (t = 0·313, P = 0·765), contrary to the basal insulinaemia (t = 2·461, P = 0·043). After analysis with the cold glucose minimal model method, we found an S I reduced in the obese condition compared with the lean condition (t = 2·577, P = 0·023). Total AT (r 0·52) and SAT (r 0·54) measured by CT were negatively correlated (P < 0·05) with insulin sensitivity. The correlation was NS for insulin sensitivity v. RAT and VAT (r 0·50 and 0·40, respectively, P>0·10). There was a trend for the correlation with IAAT (r 0·50, P = 0·059), including both RAT and VAT.
Fig. 1(b) and (c) displays the AT distribution in minipigs from groups 1 and 2. In group 1, 15 weeks of ad libitum WD induced a large increase in adiposity measured by CT (t = 5·802, P < 0·001) as well as a modification of body fat distribution (t = 5·116, P < 0·001) (Fig. 1(c)). Interestingly, with increased body weight, the relative proportion of SAT increased, whereas the relative proportion of IAAT decreased (Fig. 5).
Proportion of subcutaneous (SAT, ○, ●,  ) and intra-abdominal (IAAT, △, ▲,
  ) adipose tissue in percentage of the total adipose tissue measured by computed tomography scan, in relation to live body weight in minipigs fed a standard diet (○, △, group 1 in lean condition, 427 kJ/kg0·75), a Western diet during 4–10 weeks (, , group 2, 690 kJ/kg0·75) or a Western diet during 15 weeks (●, ▲ group 1 in obese condition, 824 kJ/kg0·75), with SAT ratio = SAT/(SAT+IAAT) × 100 and IAAT ratio = IAAT/(SAT+IAAT) × 100.

Discussion
The present study indicates that a standardised CT-scan method, considered as the gold standard technique in human subjects(Reference Yoshizumi, Nakamura and Yamane10, Reference Rössner, Bo and Hiltbrandt22), provides relevant estimations of AT distribution in minipigs. Obtained values are highly correlated with ultrasonographic data, anatomical measurements and body chemical composition. Our method allowed to estimate a wide range of adiposity in a non-invasive manner as demonstrated using animals with different degrees of adiposity by virtue of various rationing plans of WD.
Three important requirements must be met to analyse adiposity distribution by CT with the single-slice method: the choice of an adequate scan location, the use of an optimal range of AT X-ray density and the selection of regions of interest that can discriminate different fat compartments. We chose to perform the CT scan at the level of T13 and L2, two locations corresponding to the widest abdominal girth in minipigs, which is equivalent to L4–L5 level in human subjects. Even though these two scan locations provided similar results, we recommend the use of L2 level for later single-slice studies for three reasons. First, its perimeter was best correlated with TAT measured in the CT slice. Second, visualisation of the kidneys facilitates the delineation of RAT. Third, this level is the closest to the L4–L5 level used in human subjects, and includes the P2 site used in the pig industry for adiposity measurement by ultrasonography. Pixel densities between − 190 and − 30 Hounsfield units have been widely accepted as the X-ray density range for AT determination by CT(Reference van der Kooy and Seidell9, Reference Rössner, Bo and Hiltbrandt22, Reference Grauer, Moss and Cann23). Nevertheless, as reported in human subjects(Reference Yoshizumi, Nakamura and Yamane10), we found a wide variation among the average X-ray density for AT in the examined subjects. Such a variation with weight and adiposity level prevents the use of a fixed window width to measure X-ray density. We advocate the use of a flexible X-ray density range measured upon the basis of a well-identified region of interest delineated in the SAT.
The major pitfall in adipose measurement by CT is the precise identification and delineation of VAT. Clasey et al. (Reference Clasey, Bouchard and Wideman24) demonstrated that small changes in anatomical boundary line location resulted in significantly different VAT cross-sectional area measurement and proposed anatomical boundaries to exclude as much intramuscular fat as possible. It should be mentioned that most studies performed in human subjects still make semantic and/or anatomical confusions between VAT and IAAT, which is composed of VAT per se and RAT. The RAT is very often included into the anatomical boundaries that are chosen to measure VAT, which obviously leads to erroneous fat estimations. Romero et al. (Reference Romero, Ramirez and Marmol11) highlighted the difficulty in generating a method to identify automatically VAT. The technical difficulty in discriminating these adipose compartments has been recognised, even though several attempts have been made to develop measurement boundaries using anatomical landmarks to distinguish VAT from RAT(Reference van der Kooy and Seidell9, Reference Marin, Anderson and Ottosson25). Further development is still needed to solve this issue in human subjects, but we had no trouble in identifying the border between intraperitoneal and retroperitoneal AT in Göttingen minipigs. The high correlation and agreement between the measurements performed by an experienced and an inexperienced rater also support that the delineation of the different adipose compartments is not difficult in minipigs.
The good correlations that have been obtained between backfat weight and SAT, perirenal fat weight and RAT, and between fresh carcass lipids and TAT indicate that CT is a valid method for adiposity assessment. The downside of the present results is the low correlation between lipids extracted from the abdominal content and IAAT measured by CT. One hypothesis to explain this result is that uncertainty of VAT measurement is much higher than that of SAT or RAT (cf. correlations between T13 and L2 levels). First, VAT being more diffused than SAT and RAT, its estimation is directly dependent on the CT resolution: large adipose areas are easier to detect than fat droplets spread into the visceral mass. Secondly, viscera movements and alterations in the shape of abdominal organs are important factors of variability. We evaluated this specific variation in our validation procedure, and showed that intra-scan variability is quite low. Finally, there might be a bias in VAT evaluation due to the digestive tract content. Even after a 15–18 h fast, some food remains are still present in the digestive tract, especially in the intestine. These food remains might have CT values that overlap those of AT, which probably leads to an overestimation of VAT. This effect is probably even increased when subjects are fed a high-fat diet. In parallel, viscera sampled in euthanised animals are systematically emptied from any food remains, which might explain why the correlation between extracted lipids and VAT measured by CT was low and NS. Such a problem also exists for VAT estimation in human subjects, and this major bias should be taken into account in the future.
When accurate distinction between the different fat compartments is not required, our data indicate that ultrasonographic subcutaneous fat measurement can be used as an estimator of body adiposity in minipigs. This simple measure may be used with a good confidence to assess general adiposity in minipigs, even if this measure is more appropriate to assess SAT than other fat compartments. However, this method has major limitations: It is less accurate and reproducible than CT(Reference van der Kooy and Seidell9), and the possibility of erroneous measurements increases with body weight. The main advantage of ultrasonography remains its cost: at our imagery platform (PRISM, INRA St Gilles, France), the provision of an ultrasonographic adiposity measure and analysis for one animal costs approximately €25 or £22, while the provision of a CT-scan measure and analysis costs approximately €150 or £134.
Some studies showed that VAT is correlated with insulin resistance, contrary to the perirenal AT or RAT(Reference Després, Nadeau and Tremblay26–Reference Abate, Garg and Peshock28). One hypothesis to explain this relationship is that venous drainage from VAT is directed mostly into the portal vein, and therefore its metabolic products, such as cytokines and NEFA, reach the liver directly and have marked effects on its metabolism(Reference Björntorp29, Reference Frayn30). Caution must be taken because the different adipose depots are very often inter-related(Reference Frayn30). Moreover, Barzilai et al. (Reference Barzilai, She and Liu31) have shown that surgical removal of epididymal and perirenal fat, which are not the typical VAT, resulted in the reduction of insulin resistance in obese rats. As previously described(Reference Abate, Garg and Peshock27, Reference Abate, Garg and Peshock28, Reference Misra, Garg and Abate32), SAT was found in the present study to be significantly correlated with insulin sensitivity, contrary to VAT and RAT, though caution is required because this correlation was not very high (r 0·54). Frayn(Reference Frayn30) reviewed the relationship between VAT and insulin resistance, and concluded that visceral adiposity and insulin resistance are probably common correlates of SAT accumulation at the abdominal level. In human subjects, obesity is not always associated with an extensive development of VAT, and the SAT is generally considerably larger than the IAAT, consequently having a greater potential to contribute to insulin resistance through release of NEFA into the systemic circulation(Reference Frayn30). Surprisingly, we did not find such a clear-cut ratio in minipigs even though SAT represented the biggest fat compartment, and the SAT amount increased more dramatically than IAAT or VAT in obese subjects. This indicates that minipigs are a suitable model for common forms of human obesity.
In conclusion, the present study demonstrates that CT scans, considered as the gold standard method used to analyse adiposity distribution in human subjects, can be transposed to minipigs. The requirements are to (1) perform the scan at the L2 level to obtain the best correlation with adiposity measurements, (2) generate individual X-ray density ranges for AT on the basis of the well-identified SAT and (3) manually delineate the three main adipose compartments using anatomical landmarks (at least until a reliable automated method is proposed). Under these conditions, adiposity measurements by CT were validated by anatomical data and body chemical composition (with a remaining uncertainty for VAT assessment). We also demonstrated that this CT-scan method was accurate, sensitive and reliable. Finally, several arguments plead for the use of minipigs to investigate the relationship between different AT and morbidity associated with obesity in humans: dramatic increase in adiposity and especially SAT in obese subjects, easy discrimination between fat compartments, correlation between adiposity and insulin resistance, and possibility to perform experimental surgeries and treatments. All these assets open the way for further studies in comparative medicine and nutrition.
Acknowledgements
The authors declare no conflict of interest. The present study was supported by a grant from the CRITT Santé Bretagne. D. V.-L. was responsible for the entire study, data acquisition and analysis, and manuscript preparation. S. B. was responsible for the anatomical measurements performed at the slaughterhouse, I. L. for the chemical analyses and C. H. M. for the development of the CT-scan method and the CT-scan acquisitions performed at the PRISM imagery platform. All contributed to the experimental design and the final version of the manuscript. The authors gratefully acknowledge the efforts and cooperation of the staff who participated in the present experiment: Maurice Alix, Alain Chauvin, Sylvie Guérin, Benoît Janson, Isabelle Nogret, Gwenaëlle Randuineau and Christine Tréfeu.



