

1. Introduction
Rock glaciers are ice–rock mixtures moving downslope and exhibiting striking viscous flow morphology. They are generally regarded as the main geomorphological expression of mountain permafrost (Reference BarschBarsch, 1996; Reference BerthlingBerthling, 2011), the latter being defined as ground with temperature remaining at or below 0°C during at least two consecutive years, irrespective of ice content or texture (Reference WashburnWashburn, 1979; Reference Van EverdingenVan Everdingen, 2005; Reference HaeberliHaeberli and others, 2006). Rock glaciers are very common in mid-latitude orogens. This is particularly true in the semi-arid Andes of Chile and Argentina, where they can reach very high concentrations and very large dimensions (Reference SchrottSchrott, 1996; Reference Trombotto, Buk and HernándezTrombotto and others, 1999; Reference BrenningBrenning, 2005; Reference AngillieriAngillieri, 2009; Reference Azócar and BrenningAzócar and Brenning, 2010). The abundance of rock glaciers in the semi-arid Andes potentially makes them the most important ice reservoir, before glaciers; at the scale of some catchments where the density of glaciers is low or null, this is indisputable (Reference BrenningBrenning, 2005; Reference Azócar and BrenningAzócar and Brenning, 2010). However, considerable uncertainties remain as to how much ice is stored in rock glaciers at the basin scale, mainly due to a lack of observations of their internal structure and ice content. Studies of rock glaciers in the semi-arid Andes, especially field-based ones, are few compared with other areas of the world such as the intensively studied European Alps. To our knowledge, only two published studies have addressed the problem of the internal structure of rock glaciers in the semiarid Andes (Reference Croce and MilanaCroce and Milana, 2002; Reference Milana and GüellMilana and Güell, 2008). At the same time a considerable amount of mostly unpublished consulting work (e.g. Reference MarangunicMarangunic, 2010) has brought insights on this topic within the framework of the mining industry. In the mountains of northern Chile, the development of mining activities has indeed been favored by the presence of large amounts of precious metals, with porphyry copper at the forefront (Reference SillitoeSillitoe, 2010), and by economic and political factors at global and national levels in recent decades – especially the importance and growth of copper usage in many segments of industry worldwide (ICSG, 2010) and the driving of the Chilean mining sector by the so-called ‘Chilean economic model’, with a friendly environment for foreign investment (Reference Bastida, Irarrázabal and LabóBastida and others, 2005; Reference BastidaBastida, 2006). Because mining activities may reshape the Earth’s surface (e.g. Reference PalmerPalmer and others, 2010) and hence affect cryosphere elements, which in semi-arid to arid high mountains may constitute important freshwater reservoirs, the political and scientific interest in the Chilean cryosphere has grown over the past decade (Reference BrenningBrenning, 2010). Nevertheless, debates exist around the hydrological importance of rock glaciers (Reference Arenson and JakobArenson and Jakob, 2010; Reference BrenningBrenning, 2010). This context highlights the need for further research and field measurements on rock glaciers in the semi-arid Andes.
In this paper, we describe and interpret new field data collected on a rock glacier in the upper Choapa valley, Norte Chico region of Chile (between 29°02’S and 32816’ S), with the aim of revealing its stratigraphy and estimating its composition. Our approach focuses on the use of ground-penetrating radar (GPR) complemented with borehole drilling and ground temperature monitoring. Over the past decade, many studies have employed GPR in order to describe the stratigraphy of rock glaciers (e.g. Reference Lehmann and GreenLehmann and Green, 2000; Reference Degenhardt, Giardino, Junck, Bristow and JolDegenhardt and others, 2003; Reference Hausmann, Krainer, Bruckl and MostlerHausmann and others, 2007; Reference Monnier, Camerlynck and RejibaMonnier and others, 2008; Reference DegenhardtDegenhardt, 2009; Reference Leopold, Williams, Caine, Volkel and DethierLeopold and others, 2011). On the other hand, few studies have used the velocity of radar-wave propagation in rock glaciers. The latter varies significantly both in the lateral and vertical directions, which is likely to reveal valuable information on the internal composition of rock glaciers (Reference Musil, Maurer, Holliger and GreenMusil and others, 2006; Reference Monnier, Camerlynck, Fejiba, Kinnard, Feuillet and DhemaiedMonnier and others, 2011). Notably, previous studies have highlighted from geophysical data the presence of liquid water in permafrost (Reference Musil, Maurer, Holliger and GreenMusil and others, 2006; Reference Maurer and HauckMaurer and Hauck, 2007; Reference Hauck, Bottcher and MaurerHauck and others, 2011). Hence our study places emphasis on the characterization and interpretation of the radar-wave velocity in a rock glacier and discusses the influence of unfrozen water within or beneath the rock glacier on the GPR-derived velocity.
2. Study Area
The rock glacier investigated is located in a small hanging valley called Quebrada Noroeste (NW) within the Los Pelambres mine area in the upper part of the Choapa valley (31.88 S, 70.5°W) (Fig. 1). The Los Pelambres mine is an open-pit copper mine with elevations ranging from ∼1100 to 4500 m a.s.l. The area represents a transition between the Mediterranean climate to the south and the semi-arid steppe climate to the north. The climate of the upper Choapa valley is a highland climate. Using meteorological data from the Chilean Water Service (Dirección General de Agua, DGA), a linear temperature gradient of- 0.73°C(100m)–1 was calculated and resulted in a 0°C isotherm located at ∼3650m a.s.l. In Quebrada NW, a meteorological station installed in 2009 at 3700m a.s.l. by the Los Pelambres Company recorded in 2010 an average air temperature of +0.5°C. The nearest precipitation gauge maintained by the DGA (Huintil, 805 m a.s.l.) registered 207 mm in 2010, 38% less than the 1961-90 average of 334 mm. Various consulting studies previously focused on the rock glaciers in Quebrada NW in order to address concerns about the use of this site by the mining company. These studies gave rise to various geomorphological interpretations, from the rejection of permafrost and rock glacier occurrence (DISSAM Sécurité, 2002) to the identification of glacier ice-cored rock glaciers (Geoestudios, 1998); Reference GeoblastGeoblast (2009) recognized the features in Quebrada NW as rock glaciers and, using geoelectrical measurements, made the hypothesis of permafrost occurrence. Apart from these consulting studies, Reference Azócar and BrenningAzócar and Brenning (2008) and Reference Brenning and AzócarBrenning and Azócar (2010) inventoried rock glaciers in Quebrada NW from aerial photograph and satellite imagery interpretation. They emphasized the role that these rock glaciers may play as reservoirs and suppliers of fresh water and the damage that these landforms may suffer, or have already suffered, from nearby mining activities.

Fig. 1. Location map of the Los Pelambres mine area and Quebrada NW. The studied rock glacier (see Fig. 2) is indicated by a small rectangle in Quebrada NW.
In Quebrada NW (Fig. 2), the most prominent natural morphological feature is a set of small (<350 m) coalescent valley-side rock glaciers at the foot of a southwest-facing andesitic crest. Aerial photographs from the end of the 1990s, before any mining intervention took place, allow identification of seven rock glacier units at the foot of the southwest-facing crest. The rock glaciers represent an area of 0.359 km2. The infilling of Quebrada NW with extraction mineral residues began in 2002–03, but was later stopped in anticipation of further permafrost studies, so that a portion (65% of the original area) of the rock glaciers identified in the late 1990s has been covered and is no longer visible. In 2010 and 2011, we studied the rock glacier identified as #5 and the upper lateral part of the one identified as #4 (Figs 2 and 3). These represent the most intact landforms that remain visible at the site, i.e. they were the least disturbed by mining operations. The elevation range of the surveyed area is 3710-3780 m a.s.l. Rock glacier #5 is a small, 270 m wide and 200m long valley-side landform. The original (undisturbed) surface of the rock glacier is quite smooth without noticeable ridges and furrows. However, a clear and steep front is noticeable on the satellite images recorded before burial of the distal part by extraction residues and is still perceptible in the artificial morphology. Using a high-resolution (2 m) digital elevation model (DEM) of the area derived from aerial photographs taken in 2009, the original height of the front was estimated to be ∼10m. On the currently intact parts of the surface, the material is coarse, consisting of gravels, cobbles and small (<30cm) boulders (Fig. 2). Monitoring of surface movement at five locations on rock glaciers #4 and #5 was carried out by topographers from the Los Pelambres Company between March 2010 and March 2012 and showed horizontal displacements between 13 and 50 cma–1 (CEAZO, 2012).
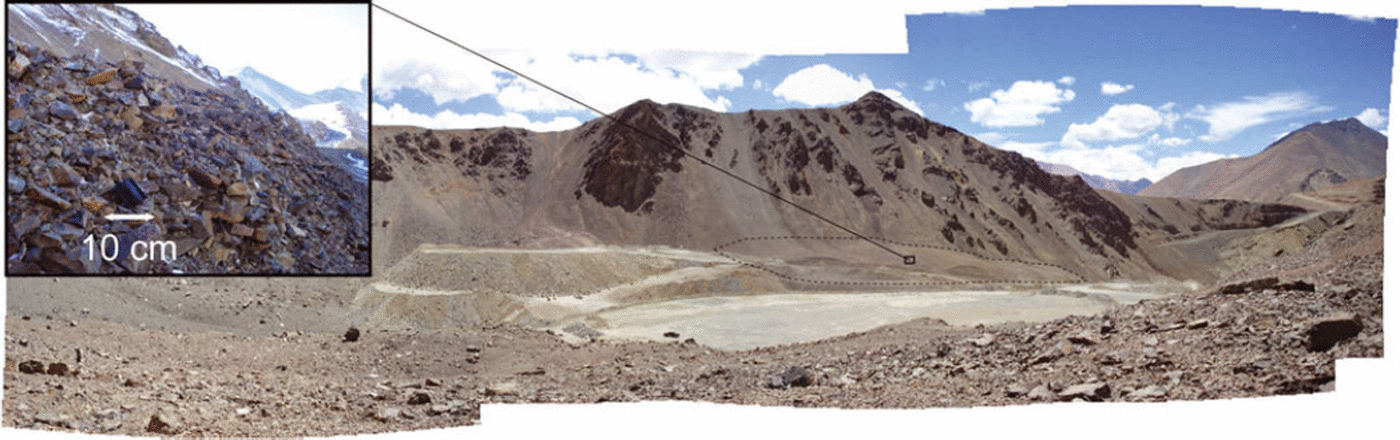
Fig. 2. Quebrada NW viewed from the northwest (in the main picture south is to the right). The inset photograph shows the materials encountered in the first few decimeters below the surface (the pocket camera case gives the scale). The study area is depicted with a dashed line.

Fig. 3. Location of the GPR common-midpoint and constant-offset profiles and boreholes on the studied rock glacier #5 and upper margin of rock glacier #4, Quebrada NW. The map is a 2009 orthophoto from which the elevation contours were also derived.
3. Methods
3.1. Core drillings
Two boreholes (DDH2010-1 and DDH2010-2) of 25 and 20 m depth, respectively, were drilled in the intact part of the rock glacier (Fig. 3). The drilling operation took place at the end of the summer (April) of 2010 without any snow cover on the surface. In most previous studies refrigerated air-flush drilling technology had been used (Reference Haeberli, Huder, Keusen, Pika, Rothlisberger and SennesetHaeberli and others, 1988; Reference ArensonArenson, 2002; Reference Arenson and SpringmanArenson and Springman, 2005); however, in this study we applied the diamond drillhole (DDH) technique (Reference Barsch, Fierz and HaeberliBarsch and others, 1979) due to its availability on the site for use in geological exploration. A 96cm/63.5cm inner/outer diameter drill head was used. The limit of such a technique lies in the warming generated in the borehole by the rotation of the diamond head; although cooling is maintained by the injection of cold water, losses of core samples are bound to occur. This use of water also prevents the determination of volumetric ice content by the gravimetric method using known densities (Reference Arenson and SpringmanArenson and Springman, 2005). Considering that rock glaciers have been drilled only on very rare occasions (see Reference HaeberliHaeberli and others, 2006), this opportunistic technique was still considered valuable to visually examine the inner part of the rock glacier and to provide general ground-truthing for the GPR results. During drilling of the hole, the recovery rate (the ratio between the retrieved sample length and the total length drilled) was recorded. The samples were described according to visible grain size and ice filling. Since the DDH technique disturbs and wets the structure we did not weigh the samples. The temperature of the samples was measured on site immediately after their recovery from the borehole using a manual digital thermometer. The ice content was estimated visually at depth intervals of 10-40cm depending on the complexity of the stratigraphy. The varying recovery rate of the sample cores was then used to estimate the potential minimum and maximum ice content. As the type of material lost during the coring is unknown, we considered that the lost core fraction may have been composed of pure debris or pure ice; however, it is probable that ice-poor wet materials are more likely to be destroyed and lost due to their lower cohesive strength.
3.2. Ground temperature monitoring
The DDH2010-1 borehole was equipped with a 25 m long 12-thermistor (Lakewood Inc.) string with an accuracy of ±0.2°C. Thermistors were spread between the surface (0 m) and at successive depth intervals of 2 m between -1 and -17 m and of 4 m between -17 and -25 m. The borehole was backfilled with sand and sealed with bentonite at the surface to prevent water percolation. A data logger was connected to the string and programmed to record borehole temperatures every 2 hours. In the DDH2010-2 borehole an 18m long five-thermistor string with an accuracy of ±0.2°C, without a data logger, was placed for punctual measurements.
3.3. Ground-penetrating radar
In April 2010, we used a pulseEKKO Pro DVL (Sensors & Software Inc.) GPR system mounted with unshielded 50 MHz antennas in order to obtain data describing the subsurface of rock glacier #5 in Quebrada NW. We performed (Fig. 3): (1) three common-midpoint (CMP) surveys near the boreholes using a step size of 0.4 m; and (2) five constant-offset (CO) profiles (four longitudinal profiles of ∼150m and one 350m long transverse profile) throughout the intact and intervened parts of the rock glacier using an antenna separation of 2 m and a step size of 0.5 m. Whereas the CMP1 survey was performed at the exact location of DDH2010-1 before drilling of the borehole, the CMP2 and CMP3 surveys were performed 50 m northwest and 35 m southeast of DDH2010-2, respectively, because the borehole had already been drilled and the surface disrupted by the drilling platform. For the whole survey, each collected trace was the results of 16 stacks in order to increase the signal-to-noise ratio. Topographic data were integrated into the GPR survey using a handheld GPS for planar positioning and elevation values from the pre-existing 2009 high-resolution DEM. An automatic high-pass filter (dewow filter) was applied to the GPR data to remove the very low-frequency component. Following common procedures (Reference Eisen, Nixdorf, Wilhelms and MillerEisen and others, 2002; Reference AnnanAnnan, 2003) semblance analysis of the CMP data was performed in order to obtain a vertical profile of the normal moveout (NMO) velocity. Then, according to the main changes seen in the borehole stratigraphy, interval velocities were calculated using the Dix formula (Reference DixDix, 1955). The four longitudinal CO profiles were migrated with a Reference StoltStolt (1978) migration using a constant velocity (0.13 m ns–1) derived from consideration of both the CMP results and the fitting of some diffraction hyperbolas in the unmigrated CO data. The data from the transverse profile (QNW5) allowed the following advanced processing steps to derive the distribution of the radar-wave velocity. The large number of diffraction hyperbolae in the data was used for calculating root-mean-square (rms) velocities using the hyperbola-fitting method. The latter technique has been described by Reference Brandt, Langley, Kohler and HamranBrandt and others (2007), Reference Bradford, Nichols, Mikesell and HarperBradford and others (2009) and Reference JolJol (2009). Reference JolJol (2009) reported errors of ±10% associated with the technique. To reduce the errors, velocity measurements were carefully repeated several times on each hyperbola, so that the maximum error on rms velocities is estimated to be <5%. Subsequently, the distribution of rms velocities was used for migration of the profile using a two-dimensional (2-D) Kirchhoff migration (Reference Yilmaz and DohertyYilmaz and Doherty 2001). When hyperbolae were found to be approximately aligned vertically along the profile, which was frequently the case, the Dix formula (Reference DixDix, 1955) was used to convert the rms velocities into a vertical profile of interval velocities. Maximum errors on calculated interval velocities were computed considering the maximum ±5% error on rms velocities. The interval velocities were used for the time-to-depth conversion of the profile. Finally, static elevation corrections were applied to all GPR profiles using the topographic data, and profiles were further visually enhanced using automatic gain control (AGC) gain with a time window of 60 ns.
4. Results
4.1. Borehole stratigraphy
Figure 4 shows the observed stratigraphy at the boreholes DDH2010-1 and DDH2010-2. In the DDH2010-1 borehole, the first 7 m are devoid of ground ice and exhibited positive temperatures at the moment of their retrieval. The materials are predominantly sand with gravels (0-5 m deep) and then angular gravels with a few sand matrices (5-7 m deep). Below 7 m, the materials are frozen. The occurrence of ground ice is heterogeneous. Between 7 and 10m depth, there is an alternation of layers with excess pore ice, layers with unsaturated pore ice and even two very thin (10cm) layers of pure ice. Below 10 m, sediments with unsaturated pore ice predominate, with the occasional occurrence of thin layers with excess pore ice. The sediment size in the DDH2010-2 borehole is nearly constant throughout its length, consisting of angular gravels with a few sand matrices. The top unfrozen layer is thinner than in the first borehole (5 m). Below 5 m the materials are frozen, again with heterogeneous occurrence of ground ice. Between 5 and ∼12 m, unsaturated pore ice predominates, though two ∼50cm thick layers with excess pore ice and one 20 cm thick layer of pure ice are encountered. Below ∼12 m and down to the bottom of the borehole, the frequency of layers with excess pore ice increases, alternating with layers of unsaturated pore ice. The lowest 6 m of the DDH2010-1 borehole are not presented here because the null recovery rate or the very bad state of the samples did not provide reliable data. In neither borehole was the bedrock reached.

Fig. 4. Stratigraphy, core recovery rate, ice content in the two boreholes and corresponding radar-wave velocity profiles obtained from the analysis of the CMP data; the main stratigraphic discontinuities in the boreholes were used to constrain the conversion from NMO velocities to interval velocities. The ice content uncertainty is bounded by the potential minimum and maximum ice contents, corresponding to losses of pure debris and pure ice, respectively.
In both cores the visual ice content is <10% in unsaturated frozen sediments and ∼40% in layers with excess pore ice. In the DDH2010-1 borehole the average recovery rate in the first 19 m is 51% (44% in the frozen parts below the superficial unfrozen layer), with the lowest recovery rates occurring below 15 m (>30%). In the DDH2010-2 borehole the average recovery rate is 57% (67% in the frozen parts), with the lowest rates in the unfrozen superficial layer (>10%) and at 15–17m depths (>45%). The low recovery rates of some of the cores evidently question the nature of the lost samples. Assuming that the lost core material could represent either pure ice or pure debris leads to a considerable uncertainty range around the average ice content calculated from the recovered samples, especially in the deepest part of the DDH2010-1 borehole (Fig. 4). Still, the uncertainty envelope around the estimated ice content profile shows significant vertical heterogeneity. From the recovered cores the calculated average ice content in the frozen portions of the DDH2010-1 borehole is 16% (uncertainty interval 9-63%). The average ice content in the 20 m of the DDH2010-2 borehole is 27% (uncertainty interval 19-52%). The estimated ice content was linearly regressed onto the core recovery rate to examine a possible causative link between the two variables. Coefficients of determination (r2) of 0.08 and 0.05 are found for DDH2010-1 and DDH2010-2, respectively, showing that the rate of core loss does not significantly explain the vertical variations in estimated ice content.
4.2. Ground temperatures
The monitoring of the ground temperature in borehole DDH2010-1 confirms the existence of a 5-7 m thick seasonally unfrozen superficial layer (active layer) (Fig. 5). Below this, the ground is constantly frozen and, despite the lack of a few months of measurements needed to fulfill the accepted definition, the rock glacier can be considered as a permafrost feature. However, the thermal state of the permafrost appears singular since all temperature probes between 7 and 25 m depth remain at 0°C year-round (taking into account the ±0.2°C accuracy of the probes). This phenomenon is well known at the seasonal timescale as the ‘zero curtain effect’ (Reference Outcalt, Nelson and HinkelOutcalt and others, 1990; Reference Hanson and HoelzleHanson and Hoelzle, 2004). The zero curtain effect is explained either by the release of latent heat during the change of phase from water to ice or by the absorption of latent heat during the change of phase from ice to water. Moreover, the temperature measurements performed episodically (three times in the year) in the DDH2010-2 borehole (not shown) confirmed the values measured in the DDH2010-1 borehole.
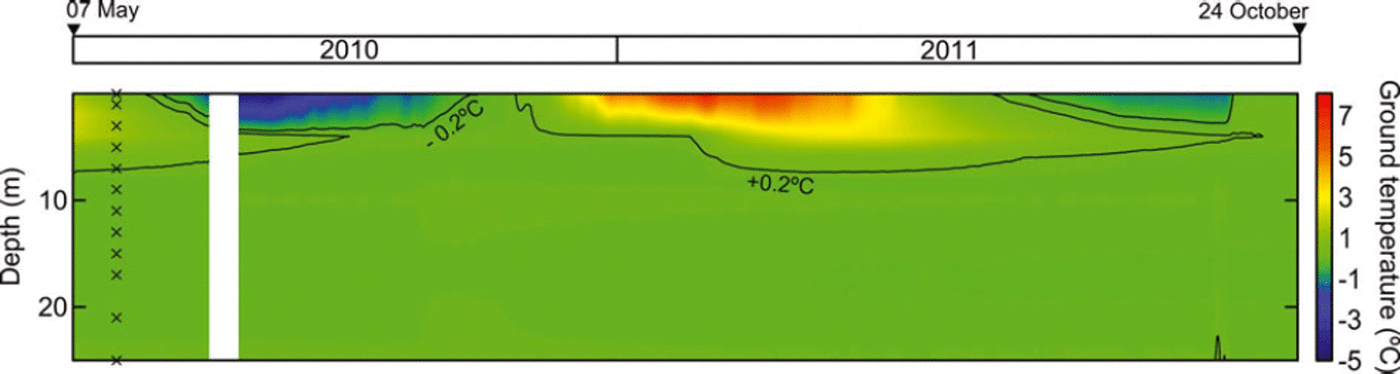
Fig. 5. Ground temperature regime interpolated from the thermistor data between 1 and 25 m depth in the DDH2010-1 borehole. The black crosses on the left axis show the location of the thermistors. The –0.2°C and +0.2°C isotherms are indicated in black as they represent the confidence interval bound around the 0°C isotherm.
4.3. Ground-penetrating radar
4.3.1. GPR stratigraphy
The migration of the GPR profiles, using a constant velocity for the QNW1–QNW4 profiles and a 2-D velocity distribution for the QNW5 profile, have collapsed the hyperbolae and considerably improved the visualization of GPR reflections, allowing for a detailed view of the rock glacier GPR stratigraphy (Fig. 6). On the whole, the internal structure shows vertical heterogeneity but also a certain degree of lateral continuity of the most prominent reflectors. We first examine the longitudinal profiles (QNW1–QNW4). In the upper parts of these profiles, bounding and strongly down-dipping reflectors are encountered between 10 and 25–30 m depths; we call these reflectors ‘basal’ because they very likely represent the interface between the rock glacier and the underlying deposit or bedrock. The basal reflector is particularly conspicuous in the median part of the QNW2 profile. Over these basal reflectors, the overall internal stratigraphy of the rock glacier is made of rather smooth and superimposed reflectors, onlapping onto the basal one, concordant with one another and synclinally disposed in the case of QNW1 and QNW2 (i.e. in the northwestern part of the rock glacier). In areas affected by mining operations, the imaging of the GPR data is rather poor (QNW1) or null (QNW4). In the third longitudinal profile (QNW3), the GPR stratigraphy in the intervened part appears quite disorganized with rather small reflectors. A neat folded structure is also observed at the lower end of the intact portion of QNW4. In the transversal direction (profile QNW5), the GPR stratigraphy is somewhat more complex. Whereas concordant and laterally continuous layers predominate, undulating and overlapping reflectors are also identified. A basal bounding reflector can be traced quite neatly over the lower (southeast) part of the profile at ∼25 m depth, but fades toward the northwest end.

Fig. 6. Migrated GPR profiles. All profiles were enhanced with AGC and compensated for elevation. The dashed lines indicate the limits between the intervened (southwest) and intact (northeast) parts of the rock glacier. The position of the longitudinal profiles (QNW1–QNW4) is reported onto the transversal profile (QNW5). See Figure 3 for the exact positions of the profiles on the rock glacier. Specific GPR stratigraphic features are indicated by numbers: 1 . basal bounding reflectors; 2. internal bounding reflectors; 3. concordant and stacked reflectors; 4. undulating and toplapping events; 5. prominent V-shaped reflector (at x = 155 m); 6. artificial structures of reflectors (folded structures). Note that for commodity the horizontal scale differs between the longitudinal profiles and the transversal profiles.
4.3.2. Radar-wave velocity
The vertical profiles of the radar-wave velocity obtained from the CMP data near the boreholes exhibit noticeable variations (Fig. 4). In the top few meters corresponding to the unfrozen active layer, the velocity is typically ∼0.15 mns-1 at CMP2 and CMP3 (materials in nearby DHH2010-2 are gravels) and slightly lower (∼0.13 m ns–1) at CMP1 (materials in nearby DDH2010-1 are sand with gravels). At CMP1, the velocity increases to 0.17 m ns–1 between 7 and 10 m, which corresponds to the concentrated ice-rich layers found in DDH2010-1; in the lower part of the vertical profile (<10 m), the velocity is ∼0.13 m ns–1. At CMP2, below the top layer, the velocity is nearly constant with values of 0.135-0.138mns–1, while at CMP3 a layer with a velocity of 0.16 m ns–1 is found between 5 and 13 m before the velocity decreases to ∼0.14mns–1 below. The various velocity profiles obtained from the CO data along the transversal profile (QNW5) display significant lateral and vertical variations (Fig. 7). In the first few meters of the structure, in the active layer, the velocity is 0.15-0.17mns-1. Below this, in the permafrost layer, values in the interval 0.12-0.16mns–1 are frequent, in agreement with the velocity profiles from the CMP surveys. However, deeper in the rock glacier (below 15–20 m) and generally close to the basal bounding reflector, but also at some locations closer to the surface, the velocity can decrease well below 0.10 mns–1. On the whole, the velocity tends to decrease toward the southeast (downslope) end of the profile. The maximum error bound around interval velocities (Fig. 7c) is greater for points with lower rms values (Fig. 7b) and with nearby hyperbolas, which points to the sensitivity of the method to the time separation between hyperbolas and the need for careful rms velocity estimation. As rms velocities were calculated several times at each point, calculated values are considered to be reliable.

Fig. 7. Calculation of interval velocities from rms velocities measured along hyperbolae in the radargram of the transversal profile (QNW5): (a) topography; (b) rms velocities; (c) interval velocities. The maximum error bound around calculated values is indicated by the inner and outer black circles. The positions x=35m, close to CMP2 and CMP3, and x=155m, close to CMP1, are indicated.
It is worth observing in detail the CO-data-derived velocity profiles at the profile locations closest to the CMP surveys (Fig. 8). At 155 m (close to CMP1), the CO velocity is 0.13 mns–1 in the first 7 m, in agreement with CMP1, but below this the CO velocity decreases dramatically to values between 0.05 and 0.08 mns–1, hence strongly diverging from the CMP1 velocity profile. This decrease in the CO velocity occurs exactly below a peculiar V-shaped stratigraphic feature ending at 7m depth (visible in Figs 6–8). On the other hand, close to the DDH2010-2 borehole the CO velocity profile obtained from the QNW5 profile is in better agreement with the nearby CMP2 profile; however, an important decrease in the CO velocity down to 0.07 mns–1 is observed below 17 m depth, which is not apparent in CMP2. These discrepancies between velocity estimates from CMP and CO data must be seen in the light of: (1) the potentially strong lateral variations in electromagnetic characteristics in a complex medium such as a rock glacier (see Section 5); and (2) the potential overestimation of the interval velocity that can occur in CMP velocity analysis when strong vertical velocity gradients exist (Reference BradfordBradford, 2008).
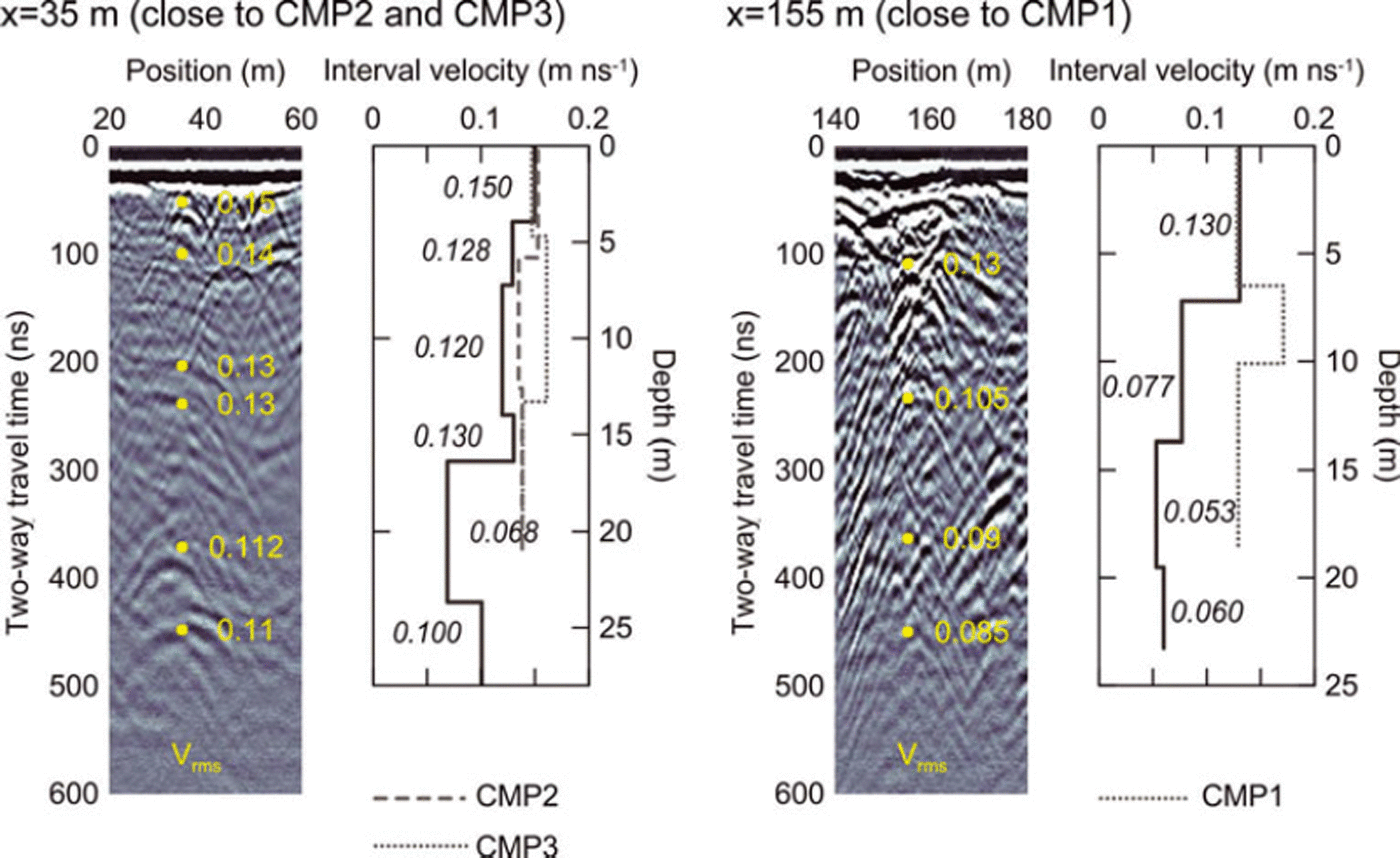
Fig. 8. Detailed velocity profiles from Figure 7 at locations x=35m and x= 155m corresponding to CMP2/CMP3 and CMP1, respectively.
5. Discussion
5 . 1 . Uncertainties of the core samples
The studied rock glacier contains ice but in a proportion that is disputable from the borehole evidence because of the limitations of the coring technique employed. Whereas both extreme situations of losses of pure ice and pure debris were used to constrain the minimum and maximum possible ice contents, respectively, it remains difficult to estimate with more precision the ice content at the borehole locations. The absence of a significant positive correlation between the recovery rate and the estimated ice content suggests that low recovery rates do not correspond to losses of pure ice. Moreover, the cohesion of materials in permafrost conditions is exponentially and positively correlated with their ice content (Reference ArensonArenson, 2002). Therefore, it is plausible that the lost core sections correspond to ice-poor and wet materials with poor cohesive strength. Hence in the reconstruction of the potential maximum ice content (Fig. 4), the extreme values (>70-80%) obtained at some depths are probably unrealistic. As such, whereas the uncertainty interval around the average ice content in the permafrost is 9-63% (borehole DDH2010-1) and 19-52% (borehole DDH2010-2), the actual average ice content is likely to be closer to the average value calculated from observations (16% for DDH2010-1, 27% for DDH2010-2). On the whole, apart from the rare and very thin layers of pure ice, our data point toward the presence of a rock-ice mixture with a low ice content (∼15-30%) and with significantly vertical heterogeneity.
5.2. Radar-wave velocity
The main finding regarding the radar-wave velocity is its lateral and vertical variability, particularly apparent in the analysis of the transversal CO profile (QNW5). These variations constitute a potentially valuable source of information on the materials inside the rock glacier and their significance must be explored. The radar-wave velocity is related to the relative dielectric permittivity e by the relation
where c is the speed of light in a vacuum (0.299 m ns–1). In a complex medium such as a rock glacier, which is composed of debris, ice, unfrozen water and air (Reference ArensonArenson, 2002; Reference Hauck, Bottcher and MaurerHauck and others, 2011), the bulk permittivity of the medium can be modeled using a four-phase mixture model of the form (Reference Zakri, Laurent and VauclinZakri and others, 1998; Reference Bittelli, Flury and RothBittelli and others, 2004)
where θr, θi, θ w and θa are the volumetric fractions of rock debris, ice, water and air, respectively; εr, εi, ε w and εa are the relative dielectric permittivities for rock debris, ice, water and air, respectively; and a is a factor that, although frequently considered as empirical, has a physical meaning depending on the arrangement of the particles in the medium (Reference Zakri, Laurent and VauclinZakri and others, 1998) and is taken as 0.5 when considering a random arrangement of the particles (e.g. Reference Bittelli, Flury and RothBittelli and others, 2004), which comes to what is referred to as the complex refractive index model (CRIM) proposed by Reference Birchak, Gardner, Hipp and VictorBirchak and others (1974).
For understanding the velocity variations in the studied rock glacier, the components with the lowest (air = 1) and the highest permittivity (water = 88 when the temperature is close to the melting point; Reference Thomson, Osinski and PollardThomson and others, 2012) are of special interest; ice and andesitic debris have permittivities of 3.2 and 3.5-5.0 (Reference Campbell and UlrichsCampbell and Ulrichs, 1969; Reference AbidAbid, 2005), respectively. According to the rare measurements performed in samples retrieved from rock glacier boreholes (Reference ArensonArenson, 2002; Reference Arenson and SpringmanArenson and Springman, 2005), the air content must be low, <10-15%. The water content, on the other hand, can be estimated directly from the bulk permittivity using the common Topp formula (Reference Topp, Davis and AnnanTopp and others, 1980). The latter formula is valid over a permittivity range of 3-40 and has been confirmed for a very large variety of cases (Reference NoborioNoborio, 2001) including frozen soils with ice (with an uncertainty of ±0.025 cm3 cm–3; Reference Smith and PattersonSmith and Patterson, 1984) and gravelly soils (Reference Drungil, Abt and GishDrungil and others, 1989). Its applicability in our case is reinforced by the absence of clay (confirmed by the observations in the boreholes) and the consolidated state of the rock glacier as a permafrost feature. The application of the Topp formula to the interval velocities of transversal profile QNW5 yields water content values typically ranging between 0% and 20%, but reaching as high as 46% (Fig. 9). High water contents (>20%) generally occur below depths of 15-20 m. At 35 m, high water content is visible at the bottom of a typical syncline structure, where it is plausible that water convergence occurs. In two other cases (at 155 and 250 m along the profile, respectively), high water contents concentrate along a vertical segment. As the porosity of the dry sediments (mostly gravels) of the rock glacier must be between 25% and 40% (Reference DelleurDelleur, 1999), many of the water content values calculated here imply a saturation of the materials. Some of the highest values may be partly explained by the propagation of the initial uncertainty on rms velocity determination to the interval velocity and water content calculations (Fig. 9). However, despite the possible errors, the data still suggest the occurrence of punctually high water contents, and values higher than 40%, in excess of porosity, must be explained by macro-porosity features such as cracks or channels. These are quite plausible at the base of the rock glacier and, in cases when the velocity drops downward repeatedly such as seen at 155 m along the profile (Figs 6-9), imply the presence of water-filled cracks/conduits in the permafrost akin to those seen in glaciers and buried ice deposits (e.g. Reference Moorman, Harris and MurtonMoorman, 2005). The presence of concentrated water in such zones is supported by the prominent V-shaped reflector previously described at 155 m and which may be interpreted as a funnel-type feature reaching down to 10m depth, perhaps linked to a crack below in which the water penetrates. Moreover, in the unmigrated data (Fig. 8), the column of hyperbolas and intercrossed reflectors at this position is reminiscent of the features created by crevasses in glaciers (Reference MooreMoore and others, 1999). High water contents are not necessarily incompatible with the presence of ice. Indeed it is possible to use Eqn (2) to simulate the radar-wave velocity from, for instance, a fictive mixture composed of stable volumetric contents of debris (47.5%) and air (5%) and in which the ice (with an initial maximum content of 47.5%, corresponding to a situation of pore ice in excess) is progressively replaced by water. This leads us to consider that in such a medium radar-wave velocities decreasing as low as 0.06-0.07 m ns–1 can occur while ice is present in the ground in small quantity (-10%).
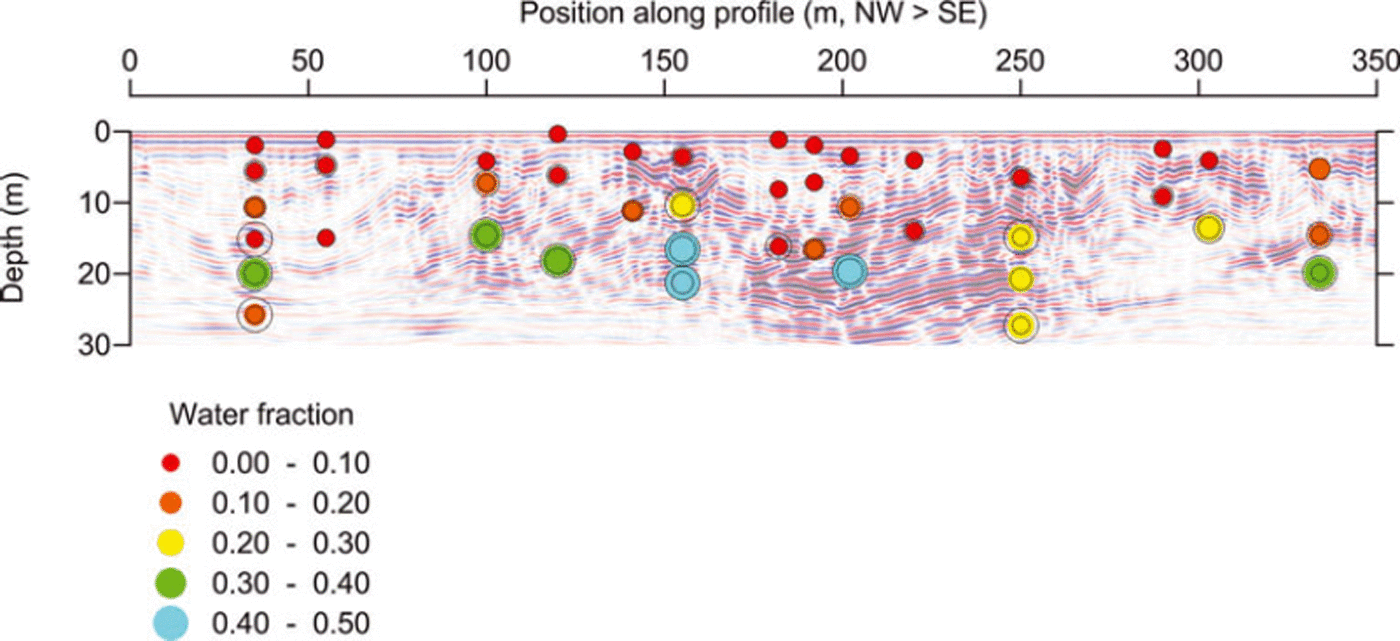
Fig. 9. Water fractions along the transversal profile (QNW5) estimated from the application of the Topp formula to calculated interval velocities (see Fig. 7). The maximum error bound around water content values, which arises from maximum errors on calculated interval velocities, is indicated by the inner and outer black circles.
Previous geophysical studies have already reported the possibility of encountering considerable amounts of water in rock glaciers (Reference Croce and MilanaCroce and Milana, 2002; Reference Musil, Maurer, Holliger and GreenMusil and others, 2006; Reference Hauck, Bottcher and MaurerHauck and others, 2011). Reference Arenson, Hoelzle and SpringmanArenson and others (2002) reported that during drillings into the Murtèl-Corvatsch rock glacier, Switzerland, water was found at the permafrost table but also at greater depths inside the permafrost body. The hydrology of rock glaciers is known to be complex (Reference Burger, Degenhardt and GiardinoBurger and others, 1999). Conceptual models of rock glacier hydrology have usually considered the permafrost core in rock glaciers as an impermeable body with water flowing rapidly over it through the superficial active layer (supra-permafrost flow) and more slowly below it (sub-permafrost flow) (Reference Giardino, Vitek, DeMorett, Dixon and AbrahamsGiardino and others, 1992; Reference Burger, Degenhardt and GiardinoBurger and others, 1999; Reference Williams, Knauf, Caine, Liu and VerplanckWilliams and others, 2006). Using dye-tracing experiments, Reference TenthoreyTenthorey (1992, Reference Tenthorey1994) also deduced the existence of water flowing through an inactive rock glacier (‘intra-flow’), with no supra-permafrost flow, a phenomenon that was attributed to the ice-poor nature of the material and the occurrence of thermokarst subsidence within the rock glacier. The conceptual model of Reference TenthoreyTenthorey (1992, Reference Tenthorey1994) included water transfer from the active layer down the rock glacier through unfrozen channels. Our interpretation of GPR-derived locally high water content in our studied rock glacier is in agreement with these observations and models. The occurrence of unfrozen water within the rock glacier is also compatible with the constant zero-curtain effect observed in the ground temperatures and which may indeed express permafrost degradation in the rock glacier. The idea of a melting structure with water at near-melting-point temperature and percolating at depth is further supported by the poor state of the core samples encountered below 19-20 m depth in borehole DDH2010-1.
Finally, the generally high velocities (0.15-0.17mns-1) observed in the first few meters of the structure (active layer of the rock glacier) must be explained by the larger volumes of air within the layer. For example, if we consider the active layer to be devoid of unfrozen water and ice, a velocity of 0.16m ns–1 yields an air content of 22% using Eqn (2). The special case of the lower velocity (0.13m ns–1) in the active layer of the CMP1 profile has to be explained by the finer materials (likely to retain water) observed in the core samples from the drilling.
5.3. GPR stratigraphy and rock glacier development
The prominent bounding reflectors encountered at depth in both the longitudinal and transversal profiles of the rock glacier are interpreted as the basal contact between the rock glacier and the underlying sediments or bedrock. They give an approximation of the rock glacier thickness. The latter varies between 10 m in its upper part, close to the talus slopes, and 30m or even more in its lower part. The poor imaging of the GPR data in the areas affected by mining operations prevents a more precise estimation. The reduced GPR imaging in the areas affected by mining (construction of platforms and later infilling by mining waste rocks) is still poorly understood. It may result from an increase in the material conductivity due to compaction of the materials (Reference Johnson, Doran, Duke, Wienhold, Eskridge and ShanahanJohnson and others, 2001) and thus increased attenuation of the radar signal, and from the disruption of the stratigraphy due to operation of machinery and the overburden pressure of the waste rocks, as suggested by the stratigraphy (disorganization, folded structure) in the lower part of QNW4. In areas where the original structure is clearly visible, the rather smooth stratigraphy together with the steady surface topography supports the idea of a rock glacier that has undergone somewhat more extensive than compressive deformations during flow. The stacked, mostly concordant and quite laterally – along longitudinal profiles and also to some extent along the transversal profile – continuous GPR layers of the rock glacier could be regarded as contradicting the lateral variations of the radar-wave velocity. In fact, the lateral variations of the radar-wave velocity appear more as punctual discontinuities than a continuously irregular phenomenon; furthermore, they were only highlighted along a transversal axis (QNW5) and not along longitudinal profiles. Thus, the GPR stratigraphy tends to suggest a sequential development of the landform. The apparently heterogeneous vertical distribution of ice further supports this scenario. In the hypothesis that little ice was lost during the retrieval of core samples from the boreholes, the structure of the studied rock glacier appears as a succession of layers alternatively poor and rich in pore ice. Pore ice within rock glaciers can originate from refreezing of rain-or meltwater percolating from the surface, groundwater seepage from upslope, or snow burial (Reference Haeberli and MühllHaeberli and Mühll, 1996; Reference HaeberliHaeberli and others, 2006). Below steep slopes the origin of snow can be avalanches, as highlighted in arctic regions (Reference Humlum, Christiansen and JuliussenHumlum and others, 2007). Hence the ice-poor layers may represent dry periods with limited or no formation of pore ice, while the ice-rich layers may represent wet periods with enhanced formation of pore ice. Avalanche maps for the mine area indicate important avalanche activity on the southwest-facing slopes of Quebrada NW, which suggests that snow avalanching and consequent snow burial is likely to be an important process for the formation of interstitial ice in the rock glaciers in Quebrada NW.
6. Conclusion
We have presented a unique combination of sediment cores, ground temperature records and GPR data collected on a small valley-side rock glacier in Quebrada NW in the semiarid Andes of Chile. Particular attention was paid to the analysis and processing of the GPR data in order to derive the distribution of the radar-wave velocity and reconstruct the GPR stratigraphy. The combined analysis of these data provides information on the inner structure and materials of the rock glacier. Our study has led to the following conclusions: (1) the rock glacier is a permafrost landform with a thermal state close to the melting point. Given the average air temperature registered at the site (+0.5°C), the observed zero curtain is thought to reflect current permafrost degradation; (2) the rock glacier is up to 30 m thick toward its terminus, though uncertainty remains in the lower intervened parts where the GPR signal was strongly attenuated; (3) the rock glacier is a layered landform with vertical alternations between ice-poor and ice-rich layers, where the extracted ice content varies between 15% and 30%; (4) in line with the near-melting thermal regime, the occurrence of low radar-wave velocities in various locations within the rock glacier suggests that water stagnates or circulates through the pores of the structure and through possible conduits in the permafrost, adding to the evidence that the permafrost in the rock glacier is currently degrading. Future works on this site will aim to improve the geophysical mapping of the internal structure by combining different geophysical methods and more advanced modeling of the geophysical properties.
Acknowledgements
This study was funded by Minera Los Pelambres (MLP) through research contract CS-581. The MLP Company was informed of the content of the manuscript but did not interfere in its production. We thank the partners at MLP for providing technical and logistic support during the field surveys. Roberto Garrido, Jorge Marín and Rodrigo Sáez provided assistance during field campaigns and with the processing of remote-sensing and GIS data. We thank Christian Camerlynck and Fayçal Rejiba for advice on the processing of GPR data. We also thank Helmut Hausmann and an anonymous reviewer for valuable and constructive comments on the manuscript.


