Vitamin D is an essential substance for maintaining the natural bone architecture. Vitamin D deficiency can lead to complications including osteomalacia and secondary osteoporosis(Reference Dawson-Hughes and Favus1). During pregnancy, considerable amounts of Ca are transferred from the mother to the fetus, and the preparation of such supply of Ca is mainly achieved by the regulation of increased intestinal Ca absorption. Moreover, during pregnancy, the concentration of 1,25-dihydroxyvitamin D increases two to three times above the normal range mainly because of the increase in renal 1-α-hydroxylase activity(Reference Kovacs and Kronenberg2). Theoretically, vitamin D deficiency in mothers could lead to a low production of 1,25-dihydroxyvitamin D due to substrate reduction. Maternal 1,25-dihydroxyvitamin D is transported to the fetus through the placenta, and the cord blood vitamin D level is equal to or at most 25 % lower than the maternal concentration(Reference Haddad, Boisseau and Avioli3).
There are only a few foods that are good sources of vitamin D, and in countries with no food fortification industries, the generation of vitamin D in the skin is the major source of vitamin D in the body. However, many studies have reported high frequencies of vitamin D deficiency in sunny countries(Reference Goswami, Mishra and Kochupillai4–Reference Sedrani, Elidrissy and El Arabi7).
Vitamin D deficiency is highly common in Iran, and based on several reports, up to 80 % of women living in Tehran suffer from mild to severe vitamin D deficiency(Reference Hashemipour, Larijani and Adibi8). Studies on pregnant women have also shown a high prevalence of vitamin D deficiency, particularly in developing countries including Iran(Reference Hossain, Khanani and Hussain-Kanani9–Reference Ainy, Ghazi and Azizi13). Maternal vitamin D deficiency has several disadvantages to fetal outcomes. In cross-sectional studies, a correlation of maternal 25-hydroxyvitamin D (25(OH)D) levels with fetal femur volume(Reference Ioannou, Javaid and Mahon14) and newborn weight(Reference Leffelaar, Vrijkotte and van Eijsden15) has been reported.
There are limited clinical trials investigating the effect of vitamin D therapy in the mother on the serum mineral status of both the mother and the newborn. In some studies, an improvement in serum Ca concentrations of the mother as well as a reduced possibility of neonatal hypocalcaemia have been reported(Reference Marya, Rathee and Lata16, Reference Delvin, Salle and Glorieux17). In these studies, different doses of vitamin D were used regardless of the mother's initial vitamin D level. The present randomised clinical trial was conducted to investigate the effect of vitamin D administration in pregnant women with vitamin D deficiency on maternal and fetal 25(OH)D and Ca levels.
Materials and methods
This was an open-label, randomised clinical trial carried out in Qazvin (Iran) during December 2011 to March 2012. The primary outcome was to evaluate the effect of treating maternal vitamin D deficiency on newborn vitamin D status. Additional analyses were performed to evaluate the effect on maternal and newborn hypocalcaemia (as secondary outcomes). A total of 160 pregnant women at their twenty-four to twenty-six gestational weeks, who were referred for prenatal care to an obstetric clinic, were investigated. Inclusion criteria included a gestational age of 24–26 weeks, singleton pregnancy and a BMI of 19–26 kg/m2. Exclusion criteria were gestational diabetes or diabetes before pregnancy, severe pre-eclampsia, chronic hypertension, fetal anomaly, oligohydramnios or polyhydramnios, a history of repeated abortion, rheumatoid arthritis, parathyroid disorders, hepatic or renal diseases, preterm delivery (before week 37), and use of aspirin, anti-convulsive and immunosuppressive drugs. Initially, blood samples were collected from pregnant women for the measurement of serum vitamin D levels, and once the results were obtained, those with vitamin D deficiency entered the study. Vitamin D deficiency was defined as serum 25(OH)D less than 30 ng/ml. Participants were randomly assigned to two treatment and control groups using a computerised random number generator. Enrolment was performed by obstetrician who was responsible for prenatal care. The present study was conducted according to the guidelines laid down in the Declaration of Helsinki, and all procedures involving human subjects were approved by the Ethics Committee of Qazvin University of Medical Science. Written informed consent was obtained from all subjects. The control group received a multivitamin containing 400 IU vitamin D3 plus 200 mg elemental Ca daily until the end of pregnancy. Subjects in the treatment group received a weekly dose of 50 000 IU vitamin D3 for 8 weeks (from 26 to 28 weeks of pregnancy) as well as the drug regimen given to the control group. Participants visited once every 2 weeks during the second trimester and once per week within the third trimester, and parameters such as weight, blood pressure, uterine fundal height and use of the vitamin D supplement and multivitamin were followed up. Following delivery, blood samples (5 ml) from the mother and the umbilical cord were taken after clamping and sent to the hospital laboratory to be centrifuged and kept frozen until use. The Ca level was determined by calorimetry using a commercial kit (Zist-Shimi). Serum Ca less than 83 mg/l was defined as hypocalcaemia. The intra-assay and inter-assay for Ca measurements were 2·3 and 2·6 %, respectively. Serum vitamin D was determined by an ELISA reader (Awareness Technology) and a commercial kit (Euroimmun). The intra-assay and inter-assay for 25(OH)D were 3·3 and 6·7 %, respectively. Serum 25(OH)D < 30 ng/ml was considered as vitamin D deficiency. An additional analysis was performed on the cut-off of 25(OH)D < 10 ng/ml as more sever vitamin D deficiency.
Data are presented as frequency distribution tables and numeric indices. Vitamin D status was presented as frequency distribution tables and numeric indices. ANCOVA was used to compare maternal serum vitamin D and Ca at delivery between the two groups. A χ2 test was used for comparing the frequency of vitamin D deficiency and hypocalcaemia between the two groups. For analysing serum vitamin D and Ca levels after the intervention compared with the pretreatment level in pregnant women, a paired t test was used. To examine the presence of any possible correlation, Pearson's correlation coefficient was employed.
Results
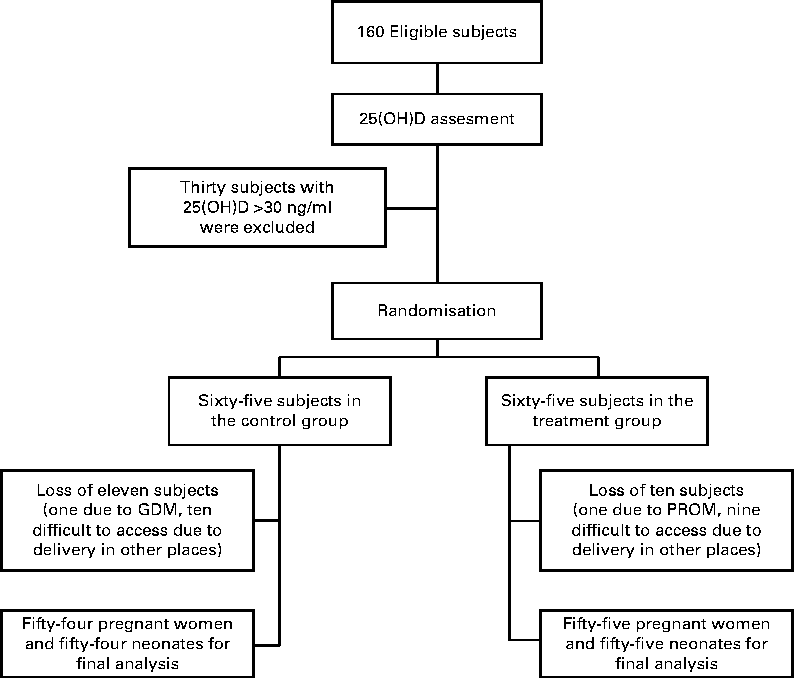
Of the 160 pregnant women (81 %), 130 had vitamin D deficiency. During the study, twenty-one pregnant women were excluded: one with gestational diabetes (in control group); one with a premature rupture of the membrane in the treatment group; ten in the control group and nine in the treatment group had difficulty to access due to their delivery in other places (Fig. 1). Complete results were obtained from fifty-four subjects in the control group and fifty-five subjects in the treatment group, and statistical analysis was performed on their baseline and outcome data. Mean gravidity, gestational age at delivery, sun exposure time and serum vitamin D and Ca levels were not significantly different between the two groups (Table 1).
CONSORT (Consolidated Standards of Reporting Trials) flow chart of the study. 25(OH)D, 25-hydroxyvitamin D; PROM, premature rupture of the membrane; GDM, gestational diabetes mellitus.

Baseline demographic and reproductive variables of the treatment and control subjects who completed the study (Mean values and standard deviations)

Maternal vitamin D and calcium levels
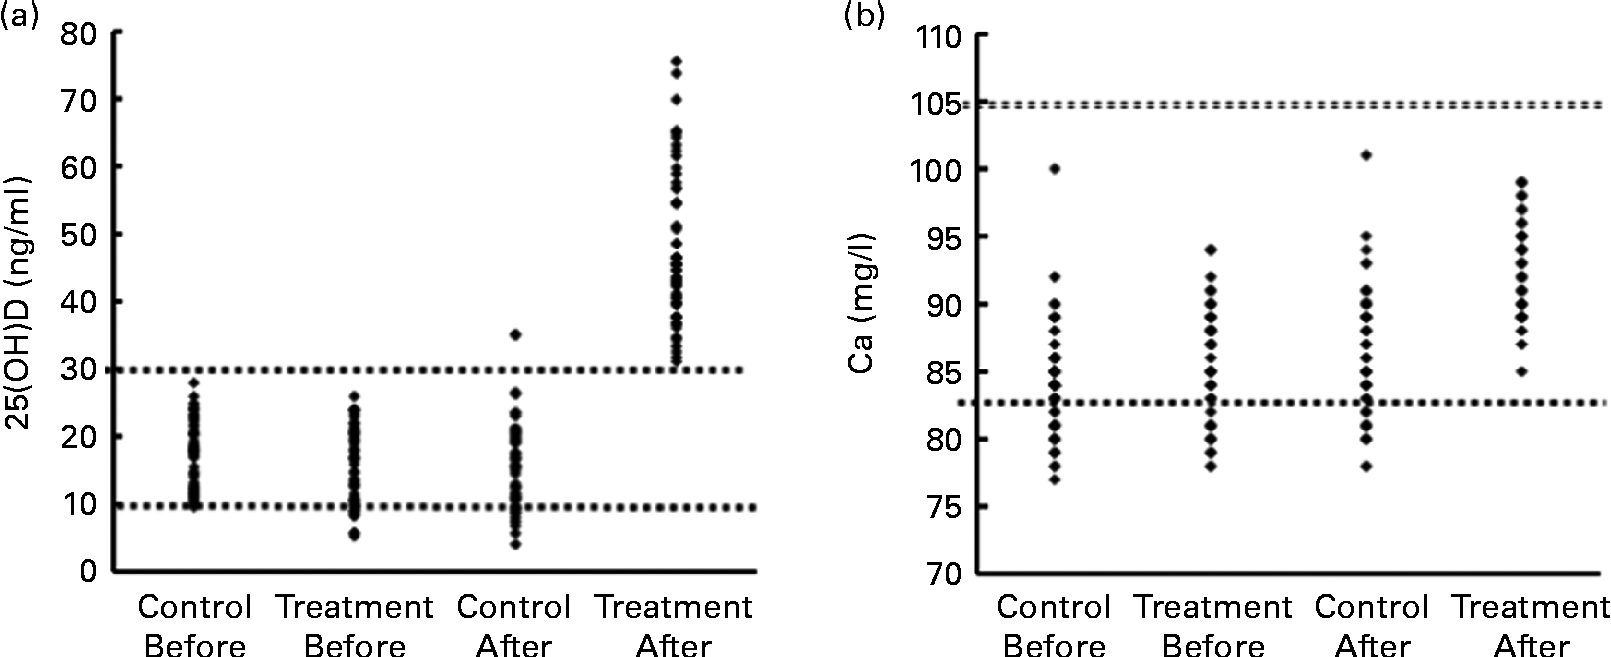
The mean vitamin D level before the intervention was 17·5 (sd 4·8) ng/ml in the control group and 15·8 (sd 5·6) ng/ml in the treatment group (Table 1). At the time of delivery, the serum vitamin D level was significantly higher in the treatment group compared with the control group, with a mean difference of 31·8 (95 % CI 28·3, 35·3) ng/ml (ANCOVA test, P= 0·0001; Table 2). In the control group, the mean serum 25(OH)D concentration at the end of the study was even lower than the pre-intervention concentration ( − 1·6 ng/ml, paired t test P< 0·05), while mean serum 25(OH)D was 31·97 ng/ml higher than the pretreatment level in the treatment group. (P< 0·0001, paired t test).
Comparison of maternal and neonatal vitamin D and calcium levels in the two groups following the intervention (Mean values, standard deviations and 95 % confidence intervals)

25(OH)D, 25-hydroxyvitamin D.
Mean values were significantly different compared with the control group: * P< 0·0001, ** P< 0·01.
† ANCOVA test.
‡ t test.
§ χ2 test.
Moreover, the serum concentration of vitamin D in all the vitamin D-treated pregnant women (100 %) was higher than 30 ng/ml at the time of delivery, while in the control group, only two women (3·7 %) had a vitamin D level >30 ng/ml (P< 0·0001). The frequency of serum vitamin D < 10 ng/ml in the control group was 22·2 (95 % CI 11·1, 33·2) % at the end of the study (P< 0·0001; Table 2).
Serum Ca concentration was significantly higher in the treatment group at the time of delivery than in the control group, as shown in Table 2 (P= 0·001). Before the intervention, hypocalcaemia was present in 32·7 and 29 % of the subjects in the control and treatment groups, respectively. The frequency of hypocalcaemia (Ca < 83 mg/l) was 32·7 (95 % CI 20·4, 45·0) % in the control group, whereas hypocalcaemia was not found in the treatment group (P= 0·0001; Fig. 2). All of the hypocalcaemic subjects before and after the intervention were asymptomatic. None of the subjects had sever hypocalcaemia (Ca < 75 mg/l).
(a) Scatter plot of serum 25-hydroxyvitamin D (25(OH)D) of pregnant women in the two control and treatment groups before and after the intervention.  (Upper), diagnostic cut-off of vitamin D deficiency (25(OH)D < 30 ng/ml);
  (lower), cut-off of more sever hypovitaminosis D (25(OH)D < 10 ng/ml). (b) Scatter plot of serum calcium of pregnant women in the two control and treatment groups before and after the intervention.
  (Lower) and
  (upper) (83 and 105 mg/l) represent the lower and upper limits of the normal range for serum calcium, respectively.
Neonatal vitamin D and calcium levels
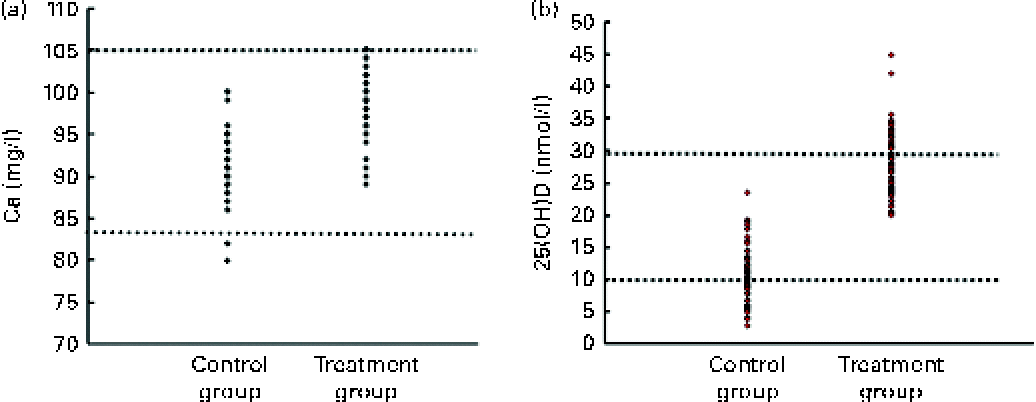
As shown in Table 2, the mean vitamin D level in the serum sample, obtained from the umbilical cord, was significantly higher in the treatment group compared with the control group (27·7 (sd 5·2) v. 10·9 (sd 4·4) ng/ml, respectively, P= 0·001). All newborns in the control group were vitamin D deficient (25(OH)D < 30 ng/ml), while the frequency of vitamin D deficiency in the treatment group was 67·3 (95 % CI 55·0, 79·6) %.
The frequency of serum 25(OH)D < 10 ng/ml was 50·9 (95 % CI 37·7, 64·1) % in the newborns of the control group. None of the newborns in the treatment group had 25(OH)D < 10 ng/ml (P< 0·0001; Table 2).
The Ca level in blood samples taken from the umbilical cord was significantly higher in the treatment group than that found in the control group, as shown in Table 2 (mean difference: 7·8 (95 % CI 0·63, 9) mg/l, P= 0·0001) and Fig. 3. There were two cases with mild hypocalcaemia in the control group; however, the frequency of hypocalcaemia incidence between the two groups was statistically insignificant.
(a) Scatter plot of serum calcium of newborns in the two control and treatment groups.  (Lower) and
  (upper) (83 and 105 mg/l) represent the lower and upper limits of the normal range for serum calcium, respectively. (b) Scatter plot of serum 25-hydroxyvitamin D (25(OH)D) of newborns in the two control and treatment groups.
  (Upper), diagnostic cut-off of vitamin D deficiency (25(OH)D < 30 ng/ml);
  (lower), cut-off of more sever hypovitaminosis D (25(OH)D < 10 ng/ml).
There was a direct correlation between the neonatal vitamin D levels of both groups and the maternal vitamin D level (r 0·7, P= 0·001 for the treatment group; r 0·49, P= 0·001 for the control group; Table 3). No significant correlation was found between the neonatal Ca level and maternal vitamin D.
Correlation between maternal and neonatal vitamin D and calcium levels

* P< 0·05 indicates a significant association.
† Vitamin D level: serum 25-hydroxyvitamin D.
Discussion
In the present study, 81 % of women at 24–28 weeks of pregnancy were vitamin D deficient. After 8 weeks of treatment with vitamin D, mean maternal and neonatal vitamin D and Ca levels were significantly higher in the treatment group compared with the control group. At the end of the study, a high frequency of vitamin D deficiency (96 %) and hypocalcaemia (32 %) was detected in the pregnant women of the control group, despite using 400 IU vitamin D3/d. There was a strong and direct correlation between the maternal and umbilical cord 25(OH)D levels at the time of delivery.
Several studies performed in Iran and other countries have also indicated a high prevalence of vitamin D deficiency among pregnant women. However, the results are conflicting for the prevalence of vitamin D deficiency among Iranian pregnant women, ranging from 48 % in one study to 86 % in another study(Reference Kazemi, Sharifi and Jafari12, Reference Ainy, Ghazi and Azizi13). Seasonal difference (sampling in the winter or summer) and geographic variation (distance from the sea level) are considered as important factors affecting the reported prevalence of vitamin D deficiency among Iranian pregnant women.
In studies reported from other Asian countries, vitamin D deficiency has also been found to be common in pregnant women(Reference Hossain, Khanani and Hussain-Kanani9–Reference Farrant, Krishnaveni and Hill11). Vitamin D deficiency among Asian pregnant women is a function of the overall status of vitamin D in these societies. A high prevalence of vitamin D insufficiency has been recognised as a clinical problem in Asian countries for many years. A lack of food enrichment with vitamin D, genetic factors and cultural and nutritional habits are essential factors associated with vitamin D deficiency in Asian people(Reference Awumey, Mitra and Hollis18–Reference Shaw and Pal20).
In the present study, there was a high frequency of hypocalcaemia in the control group, but no hypocalcaemia observed in subjects of the vitamin D-treated group. Generally, hypoalbominaemia due to high intravascular volume is considered as the major cause of mild hypocalcaemia in pregnancy(Reference Kovacs, Kronenberg and Favus21). In the present study, serum albumin levels were not measured and serum Ca was not corrected for serum albumin. However, an interesting finding was the absence of hypocalcaemic patients in the treatment group, despite a prevalence of 29 % in the treatment group before the intervention and a continuous high prevalence of hypocalcaemia in the control group at the end of the study. These results suggest that in the cases of gestational hypocalcaemia, even a mild one, a high possibility of vitamin D deficiency must be considered before attributing the condition to the pregnancy-related dilution of albumin.
The effect of maternal vitamin D deficiency during pregnancy on neonates has been the focus of several studies. In the present study and in the majority of other studies, a strong and direct correlation between the maternal and umbilical cord vitamin D levels has been documented(Reference Lee, Smith and Philipp22–Reference Marwaha, Tandon and Chopra25). A strong correlation between the maternal and fetal vitamin D concentrations is predictable, as 25(OH)D in the mother's serum has the ability to easily pass through the placenta into the blood circulation of the fetus(Reference Haddad, Boisseau and Avioli3). In the present study, relative and absolute vitamin D deficiency was considerably higher among the neonates of the control group, compared with the control group, and in the treatment group, only one infant was found to have absolute vitamin D deficiency (25(OH)D < 20 ng/ml).
In different studies, complications such as the increased risk of infection(Reference Dror26), neonatal hypocalcaemia(Reference Martinez, Catalán and Balaguer27), softening of the skull bone (craniotabes)(Reference Yorifuji, Yorifuji and Tachibana28) and decreased growth indices in vitamin D-deficient infants(Reference Bowyer, Catling-Paull and Diamond29, Reference Kalra, Das and Agarwal30) have been reported. In the present study, there was no significant difference in the frequency of neonatal hypocalcaemia in the control and treatment groups; however, hypocalcaemic cases were not frequent and were limited to only two infants in the control group.
In brief, vitamin D deficiency in pregnant women was considerably common during the winter in the present study. According to the recent recommendations(Reference Hyppönen and Boucher31), supplementation with 400 IU vitamin D3/d does not prevent maternal hypovitaminosis D. Treatment of vitamin D-deficient pregnant women improved maternal vitamin D status, prevented hypocalcaemia of pregnancy and increased fetal vitamin D and Ca levels.
The present study has its own advantages and limitations. The advantages were the randomised clinical design, the season of performing the study (winter) and also the inclusion of vitamin D-deficient pregnant women as a necessary criterion to enter the study. The first limitation of the present study was the lack of using placebo, although it does not seem to have produced major effects on laboratory parameters. The second drawback was due to the failure in determining serum albumin levels and thus calculating corrected Ca concentrations, which could have led to decreased serum total Ca levels associated with the pregnancy-related dilution of albumin. However, a considerable difference in the frequency of hypocalcaemia in the treatment group following vitamin D therapy compared with pretreatment status and also with the control group demonstrates the importance of treating vitamin D-deficient pregnant women to prevent hypocalcaemia.
Acknowledgements
The present study was supported by a grant from the Department of Research of Qazvin University of Medical Sciences. The authors would like to thank the participants involved in the study and the Department of Research of Qazvin University of Medical Science for endorsing the project. The authors' contributions are as follows: S. H. and F. L. conceptualised the study; S. Z. M., F. L. and T. D. G. participated in the data collection; A. Z. and S. H. wrote the manuscript. All the authors contributed to the interpreting of the results and the writing of the manuscript, and read and approved the final version. None of the authors has a personal or financial conflict of interest.