

The prevalence of childhood obesity has increased dramatically during recent years and is no longer only prevalent in high-income countries( 1 – 4 ). Recent data report that over the last decade the prevalence of overweight children in South Africa (both sexes combined) has increased from 10·6 to 18·2 %( Reference Labadarios, Swart and Maunder 5 , Reference Shisana, Labadarios and Rehle 6 ). Childhood obesity has a large impact on the quality of life of children and poses major health and economic consequences for themselves, their families and the society as a whole( Reference Sonntag, Ali and Lehnert 7 ). The obesogenic environments that promote the consumption of foods high in fat, sugar and/or salt (HFSS) are thought to be a key driver in the global childhood obesity epidemic( Reference Swinburn, Sacks and Hall 8 , Reference Boyland, Nolan and Kelly 9 ). Unfortunately, because of rapid urbanisation and acculturation in numerous low-income and middle-income countries, many children are now raised in these obesogenic environments( Reference Swinburn, Sacks and Hall 8 , Reference Lobstein and Dibb 10 , Reference Hawkes and Lobstein 11 ).
There is growing evidence that food marketing impacts food preferences of children, their consumption and purchasing requests to parents( Reference McGinnis, Gootman and Kraak 12 – Reference Boyland and Halford 15 ). Child-directed food marketing is extensive, perhaps most prominent on television( Reference Cairns, Angus and Hastings 16 ), and research indicates that it primarily concern HFSS food products( Reference Roberto, Baik and Harris 14 , Reference Boyland and Halford 15 , Reference Kelly, Hebden and King 17 , Reference Zimmerman and Bell 18 ). The global increase in childhood obesity and the recognition that food marketing practices may influence the food choices of children have resulted in an increased public debate regarding the best course of action to improve the food environments of children. In 2010, the World Health Organization published a set of recommendations for the marketing of food and non-alcoholic beverages to children that was endorsed by the 63rd World Health Assembly (WHA 63.14)( 19 ). In 2016, the WHO released a report by the Commission on Ending Childhood Obesity, which notes with concern ‘the failure of Member States to give significant attention to Resolution WHA 63.14’ and ‘requests that they address this issue’( 20 ). Governments should therefore take leadership in combating childhood obesity by implementing a policy that aims to reduce the impact on children of marketing HFSS foods( Reference Lobstein, Jackson-Leach and Moodie 3 , 20 , Reference Hawkes, Smith and Jewell 21 ). In order for such a policy to be effectively implemented, a clear definition of the foods that should be restricted is required, unless the marketing of all foods is to be prohibited( Reference Kelly, King and Baur 22 ). Nutrient profiling is defined as ‘the science of classifying or ranking foods according to their nutritional composition for reasons related to preventing disease and promoting health’( 23 , Reference Rayner, Scarborough and Stockley 24 ), and is suggested by the WHO to support child-directed food marketing restrictions( 20 ). Numerous nutrient profiling models with different aims have been developed, by academics, health organisations, national governments and food industries throughout the world. However, studies have indicated that the models classify foods differently( Reference Rayner, Scarborough and Kaur 25 – Reference Scarborough, Payne and Agu 27 ) and that a few have been thoroughly tested and validated( 23 ).
The manner in which nutrient profiling models have been constructed vary considerably. Some models use across-the-board nutrient criteria to classify foods in a limited amount of food categories (e.g. foods and drinks)( 28 , Reference Rayner, Scarborough and Lobstein 29 ). Others use food category-specific nutrient thresholds for foods in many sub-categories (e.g. breakfast cereals, savoury snacks, cheeses, etc.)( 30 , 31 ). Some classify foods solely on the basis of nutrients to limit( 30 , 31 ), whereas some also include elements such as dietary fibre to encourage consumption( 28 , 32 , 33 ). It is recommended that policymakers seeking to use a nutrient profiling model for regulatory reasons should rather adapt an existing model from an authoritative source that has been validated, as it is more cost-effective and time saving( 23 , Reference Rayner, Scarborough and Kaur 25 ). There are now a large number of models available that are used or designed for child-directed food marketing restrictions. Previous studies also suggest that models designed for other applications, such as nutrient and/or health claim regulations, may also be suitable for this purpose( Reference Rayner, Scarborough and Kaur 25 , Reference Julia, Kesse-Guyot and Touvier 34 ).
In South Africa, the South African nutrient profiling model (SANPM) is used to support the regulation of nutrient and/or health claims( 33 ). This model enjoys support from all stakeholders involved as it was thoroughly tested and validated before implementation into the regulation( Reference Wicks 35 – Reference Wentzel-Viljoen, Jerling and Vorster 37 ). The South African National Department of Health, Directorate: Food Control, published a draft regulation aiming to restrict the marketing of all HFSS foods to children in 2014( 33 ). The draft regulation recommends using the South African Department of Health’s (DoHSA) nutrient profiling model, which is an adapted model based on the SANPM. The SANPM was, however, developed and validated( Reference Wicks 35 – Reference Wentzel-Viljoen, Jerling and Vorster 37 ) to assess whether food products are eligible to carry a nutrient and/or health claim in South Africa and not to regulate food marketing to children. Using the SANPM in the context of restricting the marketing of HFSS foods to children could be problematic as the model was never tested for this purpose. Therefore, this study aimed to explore how appropriate the SANPM is as a food classification tool for regulating the marketing of foods to children in South Africa.
Methods
The SANPM was compared with four existing, non-industry nutrient profiling models that were designed by national government departments, academic research groups and authoritative organisations to restrict the marketing of HFSS foods to children. The nutrient profiling models were compared to determine whether the models agree on (a) the percentage of foods permitted (overall strictness) and (b) the type of foods permitted for child-directed food marketing.
The nutrient profiling models used for comparison
In total, five nutrient profiling models were identified and included for comparison (Box 1).
The five nutrient profiling models included in the investigation
South African nutrient profiling model (SANPM) ( 28 , 33 ): based on the model developed by the UK Food Standards Agency (FSA) and adapted by Food Standards Australia New Zealand for the regulation of health claims. In 2012, this model was adopted by the South African National Department of Health, Directorate: Food Control, to support the regulation of nutrient and/or health claims in South Africa. The validity of the model has been demonstrated( Reference Wicks 35 – Reference Wentzel-Viljoen, Jerling and Vorster 37 ). This model is a scoring model that uses across-the-board nutrient criteria.
United Kingdom Office of Communication nutrient profiling model (Ofcom) ( 32 ): developed in 2005 by the UK FSA and adopted by Ofcom (the UK regulatory body for communications industries) in 2007 to support the regulation of food advertising during programmes aimed at children under the age of 16 years. This model has been extensively tested and validated( Reference Arambepola, Scarborough and Rayner 38 – Reference Azais-Braesco, Goffi and Labouze 39 ) and is a scoring model that uses across-the-board nutrient criteria.
WHO’s Regional Office for Europe nutrient profiling model (REU) ( 30 ): a nutrient profiling model developed in 2013 by the WHO regional office for Europe with the assistance and inputs of member states. The model is based on two existing models, the Norwegian model( 40 ) developed by the Norwegian government – adopted by industry with minor changes made for voluntary restrictions in Norway – and the model developed by the Danish Forum of Responsible Food Marketing Communications – endorsed by the Danish government for voluntary restrictions in Denmark( 41 ). The model was tested by European member states. The model is a threshold model that uses category-specific nutrient thresholds.
WHO’s Eastern Mediterranean Regional Office nutrient profiling model ( 31 ): a nutrient profiling model developed in 2014 by the WHO Eastern Mediterranean regional office with the assistance and inputs of member states. The model is based on the REU model with minor adaptations as suggested by the member states. The model is in the testing phase and is a threshold model that uses category-specific nutrient thresholds.
South African Department of Health nutrient profiling model for restricting food marketing to children ( 33 ): developed in 2014 by the South African Department of Health, Directorate: Food Control, to support child-directed food marketing restrictions in South Africa and published as a draft regulation( 33 ). The model is an adapted nutrient profiling model. The model classifies foods first by using the SANPM (across-the-board scoring model) and second, the UK FSA front-of-pack traffic light labelling criteria (category-specific nutrient threshold) per 100 g/100 ml for green (low)( 42 ) and then, finally, the presence of non-nutritive sweeteners, fluoride, fructose and aluminium( 42 ).
Table 1 describes the characteristics of the above-mentioned nutrient profiling models. Energy, SFA, sugar (total or added) and Na/salt were used by all five models to classify foods. Total sugar refers to the sum of all intrinsic (lactose, fructose and galactose) and added sugars (monosaccharides and disaccharides), and added sugar refers to any sugar added to food by manufacturers, cooks or consumers during processing or preparation. A non-nutritive sweetener is a food additive (other than a monosaccharide or disaccharide sugar), of which one serving of 5 g provides ≤8 kJ (1·9 kcal) and a sweet taste equivalent to 5 g of sucrose( 30 , 33 ).
Characteristics of the five nutrient profiling models
SANPM, South African nutrient profiling model; Ofcom, United Kingdom Office of Communication nutrient profiling model; REU, WHO’s Regional Office for Europe nutrient profiling model; NNS, non-nutritive sweeteners; EMRO, WHO’s Eastern Mediterranean Regional Office nutrient profiling model; DoHSA, South African Department of Health nutrient profiling model for restricting food marketing to children.
Nutrient criteria algorithms were developed in Microsoft Excel 2013 according to the food classification criteria of the included nutrient profiling models. Each food item was individually classified, according to these nutrient criteria.
Development of a representative food list
Previous studies indicate that the majority of food advertisements on television are of savoury snacks, confectionery, sugar-sweetened beverages and fast-food meals( Reference Roberto, Baik and Harris 14 , Reference Boyland and Halford 15 , Reference Kelly, Hebden and King 17 , Reference Zimmerman and Bell 18 ). Studies also indicate that nutrient profiling models generally classify these foods as ‘unhealthy’, and that there is less agreement between models with regard to the classification of foods such as cheese, full-cream milk and non-nutritive, sweetened beverages( Reference Rayner, Scarborough and Kaur 25 ). In order to effectively compare how the included nutrient profiling models classified a variety of foods, a representative food list was developed as recommended by the literature( Reference Rayner, Scarborough and Kaur 25 ). The representative food list was developed is such a manner that it would allow the researchers to compare the classification of a variety of foods from various food groups. The representative food list included foods advertised on South African free-to-air television channels in 2014 and foods reported by recently published literature to be commonly consumed by South African children.
First, all advertised foods (child-directed and adult-directed) on free-to-air South African television channels (SABC 1, 2, 3 and eTV) in 2014 were included, because children are not only exposed to television advertisements aired during child-directed programming( Reference Mchiza, Temple and Steyn 43 ). Television recordings on 4 weekdays (Monday to Thursday) and on Saturdays from 06.00 to 22.00 hours during the months of April, June, September and November of 2014 were used. These months were included in order to capture advertisement changes during the different seasons and holidays such as Easter and Christmas. The food advertisement list consisted of the names of the food products, names of the manufacturing companies, number of advertisements recorded during the sample time, presence of child actors in these advertisements and whether these advertisements were shown during child-directed programmes. A total of 1030 food advertisements were aired over the 4-month period. Advertisements were excluded if they were promoting (1) alcoholic beverages, coffee, tea or chewing gum; (2) retailers who provided a variety of products; (3) baby or toddler foods and milks; and (4) meal replacement supplements. This exclusion resulted in a total of 615 advertisements marketing 137 different food products.
Second, single food items and meals commonly consumed by South African children (3–18 years) were identified from the published literature( Reference Tee, Laubscher and Botha 44 – Reference Pedro, MacKeown and Norris 49 ) and were included in the food list. This resulted in the identification of sixty additional food items.
Finally, a food list containing foods from various food groups was compiled. The food list consisted of 197 foods, of which 137 were foods advertised on South African free-to-air television channels and sixty were foods reported to be commonly consumed by South African children from the published literature.
Collection of nutritional information of foods
The majority of foods included in the food list were packaged foods. Nutritional information of these foods was sourced from the nutrition information panel indicated on the food items by using the George Institute Data Collection Application version 1.1( 50 ). Nutritional information of fast-food meals, restaurant meals and foods containing no nutrition information panel was sourced from the websites of companies. If no nutritional information was available on these particular webpages, the nutritional information of a similar food was sourced from the Condensed Food Composition Tables for South Africa ( Reference Wolmarans, Danster and Dalton 51 ).
Statistical analyses
The proportion of foods allowed by each nutrient profiling model to be marketed to children was calculated, and the overall pairwise agreement between the models was assessed by using Cohen’s κ coefficient. Agreements were assessed as follows: 0·00–0·20 ‘slight’, 0·21–0·40 ‘fair’, 0·41–0·60 ‘moderate’, 0·61–0·80 ‘substantial’ and 0·81–1 ‘almost perfect’( Reference Landis and Koch 52 ).
The included foods were divided into food groups on the basis of the revised South African Food-Based Dietary Guidelines (SAFBDG)( Reference Vorster, Badham and Venter 53 ). The main purpose of the SAFBDG is to guide the South African public to choose ‘healthy’ diets, which implies that these diets are adequate, meet all nutrient requirements and protect people against the development of diet-related, non-communicable diseases( Reference Vorster, Badham and Venter 53 ). By keeping the main purpose of the SAFBDG( Reference Vorster, Badham and Venter 53 ) in mind as well as the contribution of sugar-sweetened beverage consumption to added sugar intake( Reference Feeley and Norris 54 ) and obesity( Reference Della Torre, Keller and Depeyre 55 ) of children, the following eight food groups were chosen: starchy foods (breads, grains, potatoes and cereals); vegetables, fruits and legumes; milk and dairy products; meat and eggs; fats and oils (margarines, cooking oils and peanut butter); composite dishes (foods composed of items from more than one category such as beef stew); sugar-sweetened beverages; and finally HFSS foods (foods that are not part of the SAFBDG for healthy eating such as sweets, confectionery and savoury snacks). For each type of food in the food groups listed above, the number of nutrient profiling models that would allow the food to be marketed to children was calculated.
Results
Of the 615 food advertisements captured, 125 (20 %) were aired during child-directed programmes and 269 (43·7 %) used child actors( Reference Delport 56 ). The most frequently advertised foods were foods from the HFSS foods (51·5 %), composite dishes (14 %) and sugar-sweetened beverages (13·6 %) food groups. The majority of foods reported by literature to be frequently consumed by South African children were from the HFSS foods (27·84 %) and vegetable, fruits and legumes (20·59 %) food groups.
Fig. 1 illustrates the percentage of foods from each food group, which will be allowed for marketing to children when applying the five nutrient profiling models. Interestingly, the DoHSA model only allows foods from the starchy foods (35 %) and vegetable, fruit and legume (30 %) food groups to be marketed to children, whereas the SANPM allows selection of food from all the food groups to be marketed to children. The percentage of foods allowed for child-directed food marketing from the milk and dairy groups ranged from 0 % (DoHSA) to 75 % (SANPM). The only models allowing foods from the HFSS foods and sugar-sweetened beverages food groups to be marketed to children were the SANPM (11 %) and United Kingdom Office of Communication nutrient profiling model (Ofcom) models (11 %, respectively).
The percentage of foods from different food groups allowed to be marketed to children according to each of the nutrient profiling models. SANPM, South African nutrient profiling model; Ofcom, United Kingdom Office of Communication nutrient profiling model; REU, WHO’s Regional Office for Europe nutrient profiling model; EMRO, WHO’s Eastern Mediterranean Regional Office nutrient profiling model; DoHSA, South African Department of Health nutrient profiling model for restricting food marketing to children.
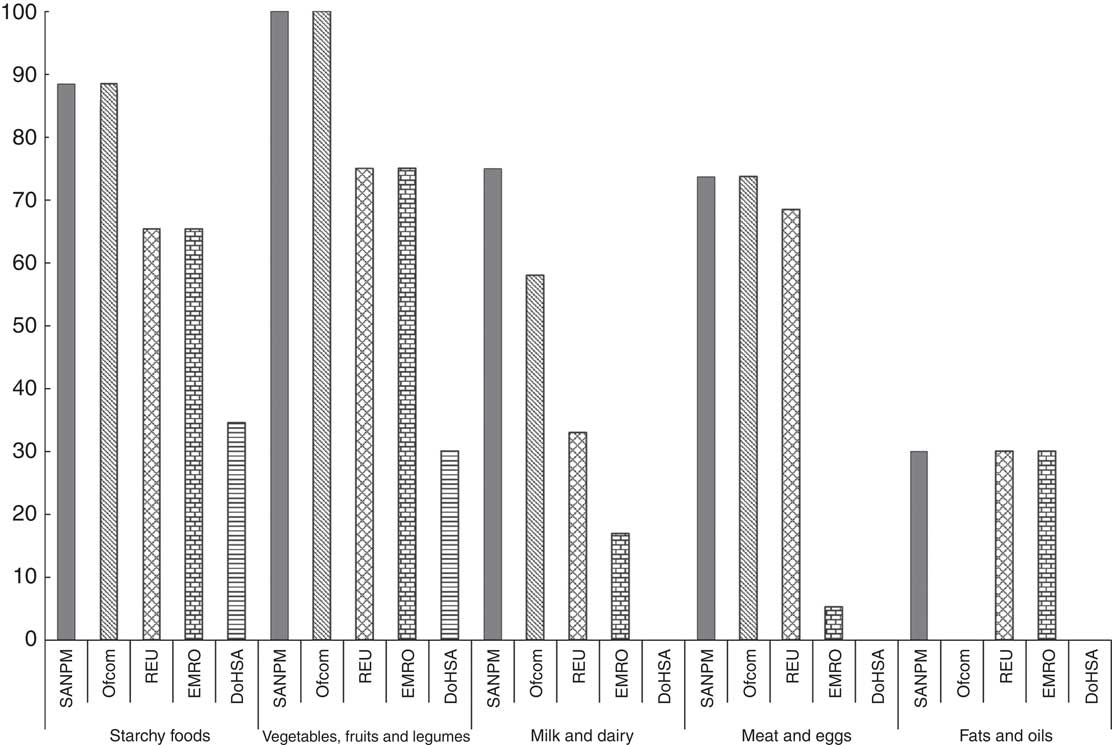
Table 2 summarises the explanations for differences in food classification by the included nutrient profiling models. For example, bran flakes (breakfast cereal) was restricted for marketing by the WHO’s Regional Office for Europe nutrient profiling model (REU) and the WHO’s Eastern Mediterranean Regional Office nutrient profiling model (EMRO) models because of the high Na content of this specific food product.
Examples of foods of which the classification by nutrient profiling models differed
SANPM, South African nutrient profiling model; Ofcom, United Kingdom Office of Communication nutrient profiling model; REU, WHO’s Regional Office for Europe nutrient profiling model; EMRO, WHO’s Eastern Mediterranean Regional Office nutrient profiling model; DoHSA, South African Department of Health nutrient profiling model for restricting food marketing to children.
Table 3 indicates that an almost perfect pairwise agreement was found between the SANPM and the Ofcom models, and a moderate agreement between SANPM, REU and EMRO models. The SANPM showed no agreement with the DoHSA model.
Pairwise κ values calculated for the five models
SANPM, South African nutrient profiling model; REU, WHO’s Regional Office for Europe nutrient profiling model; EMRO, WHO’s Eastern Mediterranean Regional Office nutrient profiling model; DoHSA, South African Department of Health nutrient profiling model for restricting food marketing to children; Ofcom, United Kingdom Office of Communication nutrient profiling model; *, fair; **, moderate; ***, substantial; ****, almost perfect( Reference Landis and Koch 52 ).
The DoHSA model, a combined nutrient profiling model, was the strictest. This model allows only 6 % of foods on the food list to be marketed to children. The REU and EMRO models, which are category-specific nutrient threshold models, allow 32 and 20 %, respectively. The most lenient models were the two across-the-board scoring models – the SANPM model that allows 45 % of the foods to be marketed to children and the Ofcom model that allows 42 %.
Discussion
The main findings of this study were that the included nutrient profiling models varied considerably with regard to their overall strictness, and that the DoHSA model is by far the strictest nutrient profiling model and the SANPM is the most lenient with regard to restricting the marketing of foods to children in South Africa. Other research studies have also compared nutrient profiling models for the purpose of restricting the marketing of ‘unhealthy’ foods to children( Reference Brinsden and Lobstein 26 , Reference Scarborough, Payne and Agu 57 , Reference Rayner, Mizdrak and Logstrup 58 ). The percentage of foods allowed to be marketed to children, according to Scarborough et al. ( Reference Scarborough, Payne and Agu 57 ), ranges from 2·4 to 39·88 % and, according to Rayner et al. ( Reference Rayner, Mizdrak and Logstrup 58 ), from 4·76 to 39·88 %. A research study conducted by Brinsden & Lobstein( Reference Brinsden and Lobstein 26 ) also compared nutrient profiling models but classified foods previously permitted to be advertised in the USA, and reported that the percentage of foods allowed to be marketed to children ranged from 14 to 49 %.
Another output in which the included nutrient profiling models differ, regardless of their overall strictness, is the type of foods the models would permit for marketing to children( Reference Rayner, Scarborough and Kaur 25 , Reference Scarborough, Payne and Agu 57 ). The nutrient profiling models generally agree that foods such as sweets, savoury snacks and sugar-sweetened beverages should be restricted for marketing to children. However, the models displayed little agreement on the type of foods that should be permitted for marketing to children as the classification of foods such as full-cream milk, cheese, sweetened yogurt, tinned peaches, breakfast cereals, etc. were undecided. Scarborough et al. ( Reference Scarborough, Payne and Agu 57 ) and Rayner et al. ( Reference Rayner, Mizdrak and Logstrup 58 ) compared nutrient profiling models by using a representative list of foods that were advertised during child-directed programmes in 2008. Similar to our findings, the models included in their study agreed on foods that should not be allowed to be marketed to children (sugary and fatty foods, mostly snacks and confectionery); however, the models have shown little agreement on foods allowed for marketing. In contrast, the nutrient profiling models compared by Brinsden & Lobstein( Reference Brinsden and Lobstein 26 ) found little agreement on both foods permitted and not permitted to be marketed to children. Discrepancy in the findings was attributed to including nutrient profiling models developed by both governments and the food industry( Reference Brinsden and Lobstein 26 ). Government-led nutrient profiling models are significantly more restrictive than industry-led nutrient profiling models because of their stricter sugar and Na/salt criteria. In comparison to the findings of previous research articles, the SANPM is rather lenient when it is applied for restricting the marketing of HFSS foods to children. Rayner et al. ( Reference Rayner, Scarborough and Kaur 25 ) defined a strict nutrient profiling model – a model that classifies most foods as ‘unhealthy’. Thus, the SANPM could still be considered as a relatively strict model, even though certain foods from food groups generally considered to be ‘unhealthy’ (sugar-sweetened beverages and HFSS foods groups) were permitted for marketing to children. The DoHSA model is very strict and permits a few foods for marketing to children. The additional nutrient threshold criteria( 42 ) of the DoHSA model were the main reason for its stringency.
Nutrient profiling models differ in both their strictness and the type of foods they would permit for marketing to children because of the differences in their respective structures. These differences include the nutrients used, the number of food categories the model contains, the type of model (across-the-board or category-specific) and the additional classification criteria. In this research article, the across-the-board nutrient profiling models (SANPM and Ofcom models) were found to be more lenient than the category-specific models (REU and EMRO models). This could be because of the fact that across-the-board scoring nutrient profiling models motivate the fact that certain food groups should be eaten more often than others by applying the same definition of ‘unhealthy’ to all food groups. This motivation, however, means that foods such as non-nutritive, sweetened beverages and certain fruit ices from the sugar-sweetened beverages and HFSS foods groups are permitted to be marketed to children by the SANPM and Ofcom models. This is in contrast with category-specific threshold models that motivate ‘healthier’ foods within a food group to be chosen more often by applying different definitions of ‘unhealthy’ to different food groups( Reference Scarborough, Arambepola and Kaur 59 ). Category-specific nutrient profiling models also prohibit certain food groups such as sweets, confectionery, fruit juices and edible ices from being marketed to children irrespective of their nutrient content. This is because of the fact that these nutrient profiling models intend to motivate the public to rather choose ‘healthier’ foods from food groups proven to be essential components to ‘healthy’ diets( Reference Scarborough, Payne and Agu 57 ).
Nutrient profiling models are also now used by the food industry to re-formulate food products. However, concerns have been raised that in order to ‘pass’ some of the nutrient profiling models’ classification criteria, certain foods that ordinarily would not ‘pass’ the nutrient profiling models’ classification will now be developed( Reference Darmon 60 ). Such foods include highly-processed food products with little or no nutritional value or foods artificially fortified with ingredients considered healthy. In order to prevent such foods from ‘passing’ the selected nutrient profiling model, policymakers are urged to adapt the chosen model by including additional classification criteria. Exclusions are thus made to the model or additional food categories are added. The SANPM was adapted by the South African Department of Health, Directorate: Food Control in order to create the proposed DoHSA model (Box 1). The proposed DoHSA model uses the SANPM as the first classification step followed by the UK Food Standards Agency front-of-pack traffic light labelling criteria for green (low)( 42 ). The DoHSA model also excludes foods with the following food additives: non-nutritive sweeteners, fluoride, fructose and aluminium( 42 ). The non-nutritive sweetener criterion resulted in some of the foods permitted for marketing by the SANPM to be excluded by the DoHSA model. The use of non-nutritive sweeteners in the fight against childhood obesity is, however, uncertain, as the use of non-nutritive sweeteners is recommended by some( Reference Miller and Perez 61 , Reference Rogers, Hogenkamp and De Graaf 62 ) while others are against it( Reference Swithers 63 ). The additional nutrient threshold criteria( 42 ) of the DoHSA model mean that certain foods generally considered as essential components to a healthy diet, such as apples and low-fat milk, are classified as ‘unhealthy’. It is, therefore, of utmost importance that policymakers are aware of the fact that adaptations made to nutrient profiling models could negatively affect the way in which they classify foods, which in return will impact the type of food marketing that children are exposed to. It can be concluded that the additional threshold criteria( 42 ) of the DoHSA model are very strict and allow a few foods to be marketed to children.
Nutrient profiling models do not only vary in the way that they have been constructed but also to the degree in which they have been validated( Reference Rayner, Scarborough and Kaur 25 ). Unfortunately, validity testing of nutrient profiling models is limited, and no gold standard for assessing the way in which nutrient profiling models classify foods exists( Reference Rayner, Scarborough and Kaur 25 ). The Ofcom model has been extensively tested( Reference Brinsden and Lobstein 26 , Reference Scarborough, Payne and Agu 57 , Reference Rayner, Mizdrak and Logstrup 58 , Reference Jenkin, Wilson and Hermanson 64 – Reference Garsetti, de Vries and Smith 66 ) and validated( Reference Arambepola, Scarborough and Rayner 38 , Reference Azais-Braesco, Goffi and Labouze 39 ) for the purpose of regulating the marketing of foods to children. When comparing the SANPM with the Ofcom model, an almost perfect pairwise agreement was found (construct validity). This was, however, expected as the models are based on one another. Even so, there are still distinct differences between the models, although they have the same basic principles. The Ofcom model classifies foods into one of only two food categories (foods or beverages). The SANPM has an additional food category for cheese and processed cheese with a Ca content >320 mg/100 g, edible oils, edible oil spread, margarine and butter. Foods within this food category are allowed to obtain a higher score in comparison with that of foods in the other food categories because of the naturally high total energy, total fat and SFA content of these foods. This additional food category means that the percentage of foods permitted by the SANPM and Ofcom models from the milk and dairy (allowing 75 and 58 %, respectively) and fats and oils (allowing 30 and 0 %, respectively) groups varied considerably. A moderate pairwise agreement was found between the SANPM and the REU and EMRO models; these models also classify foods from the fats and oils food group similarly. No statistically significant level of agreement was found between the SANPM and the DoHSA models; the DoHSA model also prohibits any of the foods included in the milk and dairy and fats and oils food groups to be marketed to children. Available data indicate that the intake of milk and Ca by South African children is low due to the price of certain dairy products and lack of knowledge on the nutritional value of milk and dairy products. The accessibility and affordability of highly-processed packaged foods are increasing, and therefore it can be argued that the thresholds of the chosen nutrient profiling model be set appropriately so that certain cheeses and yogurts with little added sugar be allowed for marketing to children.
The comparison between the nutrient profiling models provided valuable information with regard to the suitability of the SANPM for child-directed food marketing regulations and highlighting the similarities and differences between the included models. The comparison also emphasised the importance of testing a nutrient profiling model before implementation into policy. However, the limitations of such a comparison should also be taken into consideration as more validity studies are needed to confirm the included nutrient profiling models’ accuracy with regard to classifying or ranking the healthiness of foods. The WHO recommends that the nutrient profiling model being used to regulate the marketing of foods to children should align with the Food-Based Dietary Guidelines of the country in which it is intended for use( 23 ). It could, therefore, be argued that the nutrient profiling model used to regulate the marketing of foods to children in South Africa should permit ‘healthy’ foods within the food groups that the SAFBDG promote. The SANPM aligned well with the SAFBDG during the validity testing for nutrient and/or health claim regulatory use( Reference Wicks 35 ). However, no validity testing of the DoHSA model has been conducted to date.
Limitations
The analysis reported in this article only included food advertisements broadcasted on free-to-air South African television channels and foods commonly consumed by the targeted population as identified from published literature. Foods marketed to children through other forms of marketing, such as radio broadcasts, product placements, product packaging and internet advertisements, were not included, and cross-continent food marketing through international television channels were also not included.
Conclusion
The nutrient profiling models included in this article vary considerably in both the total amount of foods and the type of foods allowed for marketing to children. The SANPM, already accepted and used by the South African food industry as the first screening process to determine a food product’s eligibility for a nutrient and/or health claim, is appropriate as the first screening process for regulating the marketing of HFSS foods to children. The SANPM displays the best agreement with the Ofcom model and it permits certain dairy products such as low-fat yogurt to be marketed to children. However, further research is recommended to assess the validity of the SANPM and to develop an evidence-based framework to assist in the exclusion of certain highly processed foods that are included by the SANPM owing to limited nutritional values (such as energy drinks with non-nutritive sweeteners).
Acknowledgements
The authors thank Elizabeth Dunford for her gracious assistance and guidance with using the George Institute Data Collection Application, Willie Smit for developing the nutrient criteria algorithms in Microsoft Excel 2013, Janlie Delport for her endless precision and dedication while capturing the television food advertisements and Marike Cockeran for her assistance with the statistical analyses.
The authors received no financial support for this study.
The authors’ contributions are as follows: M. W. wrote the statistical analysis plan, captured and analysed the data and drafted and revised the paper; E. W.-V. provided essential materials, participated in the statistical analysis plan and critically revised the paper for important intellectual content; H. W. analysed the data and critically revised the paper for important intellectual content.
The authors declare that there are no conflicts of interest.


