

Introduction
Glacier surging is an internally regulated cyclic flow instability (e.g. Reference Meier and PostMeier and Post, 1969). A surge-type glacier periodically speeds up by a factor of 10–1000 times, and during this active phase ice stored in an upper reservoir zone is discharged into a lower receiving zone. The glacier terminus may advance by several kilometres, and a tidewater-terminating glacier may greatly increase its iceberg calving flux.
Svalbard glaciers have been shown to have a long active phase (Reference Dowdeswell, Hamilton and HagenDowdeswell and others, 1991), which is characterized by prolonged multi-year surge terminations (e.g. Reference Murray, Dowdeswell, Drewry and FrearsonMurray and others, 1998).This is in contrast to surges of Alaskan glaciers at which fast flow appears to terminate over a few hours (e.g. Reference KambKamb and others, 1985; Reference Harrison, Echelmeyer, Chacho, Raymond and BenedictHarrison and others, 1994). However, less is known about surge initiation on Svalbard glaciers, which are typically already crevassed and fast-flowing by the time the event is noticed. Remotely sensed data provide an archive which can be used to study the beginning of a surge event once it has been detected (e.g. Reference Rolstad, Amlien, Hagen and LundénRolstad and others, 1997; Reference Luckman, Murray and StrozziLuckman and others, 2002). In particular, synthetic aperture radar (SAR) interferometry, which can be used to determine ice velocity (e.g. Reference Goldstein, Engelhardt, Kamb and FrolichGoldstein and others, 1993), has great potential for studying relatively low-velocity Svalbard surges (Reference Dowdeswell, Unwin, Nuttall and WinghamDowdeswell and others, 1999; Luckman and others, in press). In this paper we use satellite radar interferometry (SRI) to elucidate the dynamics of Fridtjovbreen in central Spitsbergen as it begins its surge phase.
Field Site
Fridtjovbreen (77°50’ N, 14°26’ E) is a 13 km long surge-type glacier in central Spitsbergen, which flows southwards into an inlet of Van Mijenfjorden (Fig. 1). The glacier is up to 5 km wide but narrows to ∼1.5 km at the glacier terminus. Before the 1990s surge, the western part of the terminus was tidewater-terminating, whereas the eastern portion terminated on land. The glacier is one of only five in the Svalbard archipelago at which two surges have been observed, one in about 1861 (Reference Hagen, Liestøl, Roland and JørgensenHagen and others, 1993), the other starting in the mid-1990s. The quiescent phase at the glacier is thus ∼133 years. Reference Glasser, Huddart and BennettGlasser and others (1998) describe the historical evidence for the 1860s surge. I n 1858–61, the glacier terminated at Axelsøya (Fig. 1; Reference Hjelle, Lauritzen, Salvigsen and WinsnesHjelle and others, 1986), but 5 years later, in 1866, maps depicted the glacier well inland (Reference NordenskioldNordenskiold, 1866), and by 1909 it was reported to be smooth with no crevasses (Reference IsachsenIsachsen, 1915).
Location of Fridtjovbreen (box in insert) and of meteorological stations at Longyearbyen (L) and Svea (S) in central Spitsbergen. The location of the long profile is shown with 1km tick marks;0 km is located at the head of the northwestern tributary. Background backscatter intensity image is May 1996 Arrows a and b show the approximate location and direction of photographs in Figure 2. Look direction for ascending (A) and descending (D) data is indicated by arrows above scale bar.

Like most other glaciers in Svalbard, Fridtjovbreen has been retreating since the Little Ice Age, and the terminus retreat from 1936 to 1990 was ∼1.3 to 2 km. The specific mass balance measured in 1987–88 was –0.57 m we. (Reference Glazovskiy, Macheret, Moskalevskiy and JaniaGlazovskiy and others, 1991). Between 1936 and 1988, maximum loss of ice occurred near the glacier front ∼100 m thinning), diminishing to zero by an elevation of ∼ 3 5 0 m a.s.l., and the glacier thickened above this altitude (Reference Glazovskiy, Macheret, Moskalevskiy and JaniaGlazovskiy and others, 1991). This is typical of a surge-type glacier recharging its reservoir zone. The maximum thickening, by > 40 m, occurred in the northwestern tributary; mass gain in the northeastern tributary was much less, ∼10 m (Reference Glazovskiy, Macheret, Moskalevskiy and JaniaGlazovskiy and others, 1991).
Russian radio-echo sounding in 1988 showed that the ice was typically 250–300m thick, and that the bed of the lower ∼7km (before the surge) laybelow sea level, withbasins over-deepened by up to 50m (Reference Glazovskiy, Macheret, Moskalevskiy and JaniaGlazovskiy and others, 1991). At a point 2km down-glacier from the ice divide, radar returns were interpreted as showing that the upper ∼125m of the glacier ice was cold, the underlying ice was warm, and that the glacier was polythermal (Reference Glazovskiy, Macheret, Moskalevskiy and JaniaGlazovskiy and others, 1991). Measurements of the glacier dynamics in spring of the same year showed velocities of 0.08 md–1 near the equilibrium-line altitude (∼370ma.s.l.), increasing to 0.32 md–1 near the glacier terminus (Glazovskiy and Moskalevsky,1989; personal communication from A. F. Glazovskiy, 1999).
Reference Musial and ZalewskiMusial (1994) describes the front of Fridtjovbreen as even and retreating with subsided areas and surface lakes. In 1995, however, Fridtjovbreen had begun to advance rapidly, and was unusually heavily crevassed in August near the terminus, although still smooth further upstream (personal communication from A.J. Hodson, 2002). By October 1995, crevassing had spread to the accumulation area (personal communication from S. Onarheim, 1995) and in 1996 the glacier was drawn down at the northwestern backwall by ∼10m (personal communication from A.J. Hodson, 2002; estimated visually from location on moraines). A steep calving cliff had advanced ∼2.5km down the fjord by summer 1997 (Reference Glasser, Huddart and BennettGlasser and others, 1998), the lower part of the glacier was intensely chaotically crevassed (Fig. 2a), and extensional crevassing was apparent in the upper basins (Fig. 2b). During that summer, ice surface velocities were measured to be 2.0–3.3 m d–1at two points near the eastern side of the glacier terminus (Reference Zinger, Zakharov and ZhidkovZinger and others, 1997). Advance at the western side of the terminus meant that Fridtjovbreen was over-riding the ice surface of Sagabreen (Fig. 1), which was acting as a décollement plane (Reference Glasser, Huddart and BennettGlasser and others, 1998).
(a) Chaotic crevassing in the lower region of Fridtjovbreen. (b) Upper basin showing transverse crevassing resulting extensional flow regime. (Photographs taken 2 July 1996 by M. J. Hambrey.) Approximate location and direction of these photographs is shown in Figure 1.

Method
Differential interferometry was undertaken (e.g. Reference Joughin, Kwok and FahnestockJoughin and others, 1996a,b) using either triplets from the 3 day repeat phases, or two pairs from the tandem phase of European Remote-sensing Satellite (ERS) operation. The ERS SAR images used (Table 1) were chosen in conjunction with meteorological data, collected at Svea and Longyearbyen (Fig. 1) by the Norwegian Meteorological Institute, avoiding periods with temperatures above freezing, concurrent precipitation or strong winds following recent snow. A digital elevation model (DEM) derived from the Norwegian Polar Institute (NPI) mapping from 1936 aerial photographs (digital version of 1:100000 map sheet B10) was used to help phase unwrapping of the differential topography-only interferograms. This DEM was also used to determine ground-control points and for baseline refinement. Four interferometric DEMs were produced (Table 1) with an estimated vertical accuracy of 20–40m, limited by the rugged topography and low resolution of the 1936 DEM used for ground control.
Dates and characteristics of images and interferometric combinations used in this study

Velocity-only interferograms were produced by subtraction of the topographic phase signal. In most cases, this was done using the interferometrically derived DEM closest in time (Table 1); for the very short baseline interferograms, however, the 1936 DEM was used, permitting more complete spatial coverage (Table 1). Unwrapping was performed from a known zero reference, a nunatak in the northwestern tributary (Fig. 1). In all, 12 line-of-sight velocity maps spanning 7 years were produced.
Dual-azimuth processing combines ascending and descending data to resolve the horizontal direction of flow, and can be used in conjunction with a DEM to determine the full three-dimensional velocity vector (e.g. Reference Joughin, Kwok and FahnestockJoughin and others, 1998; Reference Mohr, Reeh and MadsenMohr and others, 1998). Typically this is done by assuming that flow occurs parallel to the ice (i.e. DEM) surface (e.g. Reference Reeh, Madsen and MohrReeh and others, 1999). This assumption of surface-parallel flow has been used extensively for valley and outlet glaciers (e.g. Reference Rignot, Forster and IsacksRignot and others, 1996; Reference Vachon, Geudtner, Mattar, Gray, Brugman and CummingVachon and others, 1996; Reference Mattar, Vachon, Geudtner, Gray, Cumming and BrugmanMattar and others, 1998; Reference Mohr, Reeh and MadsenMohr and others, 1998; Reference Rott, Stuefer, Siegel, Skvarca and EckstallerRott and others, 1998; Reference Joughin, Fahnestock, Kwok, Gogineni and AllenJoughin and others, 1999). Ascending- and descending-pass data suitable for dual-azimuth processing were available only duringJanuary 1994 and November 1995 (Table 1). At other dates, the assumption was made that ice-flow direction did not change during the surge, permitting 10 three-dimensional velocity maps to be produced. Thevalidity of both these assumptions is assessed below.
Results
Analysis of the position of the glacier front in SAR images between October 1991 and September 2000 shows that the terminus remained static until at least March 1994. By October 1995 the terminus had advanced ∼350m, and by February 1996 by another ∼550m. The maximum advance rate occurred during 1996–97, and the front position was ∼2.8km from its pre-surge location by May 1997 .This represents an average terminus advance rate of ∼4.2md– 1 over this 15 month period. Between May and October 1997 the front had started to retreat by ∼100 m, and by September 2000 it had retreated a total of - 3 7 0 m.
Interferograms provide information on the spatial development of the surge, even in areas where the velocity cannot be unwrapped (Fig. 3). In the upper basins, tightly spaced fringes separate the northeastern tributary near the ice divide from the remainder of the glacier, suggesting a relatively rapid change in either topography or velocity. Since there is no change in topography in this area, it would appear that the main trunk and northwestern tributary were flowing faster than the northeastern tributary at this time. By November 1995 the surge had spread to include this northeastern upper tributary.
Selected geocoded combined topography and displacement interferograms. Baselines are given in Table 1. Interferograms formed from scenes in November 1995 and May 1996 have very short topographic baselines and are therefore relatively insensitive to topography. The look direction is 126° for descending data and 238° for ascending data at an incidence angle of 23° to the vertical.

As discussed, sufficient ascending and descending scenes to allow dual-azimuth interferometry were only available for January 1994 and November 1995 (Table 1; Fig. 4a and b). At other dates, the flow direction was taken from one of these two (Table 1), and the resulting three-dimensional velocity fields for Fridtjovbreen are shown in Figure 5, draped over the SAR intensity images. These intensity images are calibrated, so their brightness is directly comparable. Changes in brightness result from changes in the water content at the surface or in surface roughness. The former results in the darkness of the June 1995 and May 1996 images, whereas sub-pixel surface roughness from increased crevassing (e.g. Fig. 2) probably results in the glacier surface becoming brighter by November 1995. The advance of the glacier terminus is clearly visible in the intensity images.
Three-dimensional velocity derived from (a) January 1994 and (b) November/ December 1995 dual-azimuth differential interferometry. Ice-flow directions for all other times were taken from one of these results (Table 1). Velocity arrows are displayed every 600 m. The backscatter intensity is calibrated so that the scenes are comparable. Surface velocity measurements are available only where coherence levels permitted phase unwrapping. (c) Enlargement showing change in the direction of ice flow between January 1994 and November/ December 19 95. A positive angle represents a clockwise rotation between 1994 and 19 95. Values plotted where the velocity vector could be measured in both years and where the velocity in January 1994 was 40.1m d–1.

Plan-view velocity maps, October 1991–October 1997 (colour scale). Images are 18 km £ 24 km. Velocity contours every 0.2 m d–1. Background images (grey scale) are descending images except October 1997.

There is no discernible change in velocity between October 1991 and March 1992 (Fig. 5), when coverage from the commissioning and first ice phases of ERS-1 finishes. Interferometric data are available again from January 1994, and by this time there is a clear increase in velocity. The velocity increases again by June 1995, and continues to increase through winter 1995/96, reaching a peak in February and May 1996. The measured maximum flow rate was ∼2.5 m d–1 (Fig. 5), down-glacier of which coherence was lost, presumably due to increasing flow rates, as suggested by the higher measured rates of frontal advance. Although very little unwrapped coverage is available in October 1997, because the ice-flow and satellite look directions were close to perpendicular, it would appear that the glacier velocity has begun to drop by this time.
Flow velocities were extracted along an approximate flowline (Fig. 1). The temporal trends can be seen most clearly in this profile (Fig. 6a) and the associated temporal profile (Fig. 6b), which both clearly show the dramatic acceleration of the glacier between June and November 1995.
(a) time series of velocity from interferometry along long profile (location in fig 1). data are from (1) october 1991, february 1992 and march 1992; (2) january and march 1994; (3) june 1995; (4) november 1995; (5) february and may 1996; (6) october 1997. black circles show russian field data measured in 1988. dashed vertical lines show the location of the data points plotted in (b). gaps in the data indicate regions that were incoherent, could not be unwrapped in the interferometric image at the location of the transect, or where the flow direction approached an angle perpendicular to the line of sight. (b) surface velocity as a function of time. grey area indicates no SRI data are available.

Assessment of Errors
Several assumptions are required in SRI processing (e.g. Reference Fatland and LingleFatland and Lingle, 1998; Reference Joughin, Kwok and FahnestockJoughin and others, 1998) and these, together with other sources, result in errors in the calculated velocities. The best overall assessment of errors probably comes from comparison with in situ measurements. At Fridtjovbreen, two sets of field-based measurements are available, one set taken in 1988 representing late quiescent-phase velocities (Fig. 6a), and one set in summer 1997. Unfortunately, only one of these measurements was within the region of interferometric coherence, but its value agrees well with the earliest SRI measurements from October 1991 and February 1992 (Fig. 6a).
The magnitude of systematic errors in the SRI flow rate can be assessed by the apparent surface displacement of those rock areas not used as a zero velocity reference. For Fridtjovbreen, the apparent displacement of land was calculated using a mask made from NPI digital map sheet B10. The apparent displacement of rock was less than 0.03 ±0.02 md–1 (mean ± standard deviation), typically averaged over ∼ 2 0 000 pixels.
Glacier flow is, in general, submergent in regions of accumulation and emergent in regions of melt, which means that there is a component of vertical flow as well as that parallel to the ice surface (Reference Reeh, Madsen and MohrReeh and others, 1999). The ERS SAR configuration is more sensitive to vertical than horizontal displacement because of the steep look angle. An assessment of the error resulting from the assumption that flow is surface-parallel can be made by assuming the glacier surface is flat. In this case, a vertical displacement dv would be misinterpreted as a horizontal displacement of d h
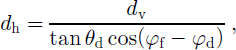
where φd and φ f are the orientation angle of the SAR observation and ice-flow directions, respectively, and θ d is the incidence angle of the SAR observation. At Fridtjovbreen, downdraw due to the surge is thought to be a maximum of ∼ 10 m (personal communication from A.J. Hodson, 2002) over the first 1–2 years. A vertical velocity of 10 ma–1 would be interpreted as a horizontal velocity error of ∼ ±0.06 md–1 if the flow direction and the satellite look direction are coincident. However, the error will increase as the angle between the incidence angle and flow direction increases. The mean angle between the flow direction of Fridtjovbreen and the look direction for descending data is 28°, which gives rise to an error of ∼ ±0.07md–1 , and for ascending data the mean angle is 84° and the corresponding error is ∼ ± 0.62 md–1.
Any change in ice-flow direction during the surge will result in error in the calculated three-dimensional surface velocities. To assess this error, the difference in flow direction between the two dates for which the data for dual-azimuth processing were available was calculated. For the region shown in Figure 3c, this mean absolute difference is 1.2° and the standard deviation 2.4°, which suggests that the error resulting from a change in flow direction will be small. Ninety-five per cent of the measurements will fall within two standard deviations of the mean, i.e. within ± 5 ° . For such a 5° change in flow direction, the error is ∼ 5 % when the angle between the flow direction and look direction is ∼ 2 8 ° (i.e. descending data). As this angle increases to 80°, the error increases to about 50%.
The error in the calculated velocity increases rapidly with increasing angle between the flow direction and the look direction. Therefore, all data within ±15° of perpendicular to the look direction were masked from the three-dimensional velocity maps when only data from a single look direction were available. The large angle between the satellite look direction and ice-flow direction makes ascending data poor for determining the velocity of Fridtjovbreen.
Discussion
There is no indication in any of our results of a surge front travelling down-glacier. At a surge front, closely spaced interferometric fringes or incoherence would be expected because of the high spatial rate of change of velocity and the likely presence of a topographic bulge. Field observations that crevassing occurred first near the glacier terminus and subsequently up-glacier support this. Furthermore, crevasses in the upper glacier were predominantly transverse (Fig. 2b), indicating that only extensional flow had occurred, which also suggests no surge front had propagated down-glacierthrough this area. Similar observations of Svalbard surges without clear surge fronts, where the lower glacier appears to accelerate initially, have been reported at the tidewater-terminating glaciers Osbornebreen (Reference Rolstad, Amlien, Hagen and LundénRolstad and others, 1997) and Monacobreen (Reference Luckman, Murray and StrozziLuckman and others, 2002).
Comparing the 1992 SRI DEM, the 1936 DEM and the Russian bedrock map (Reference Glazovskiy, Macheret, Moskalevskiy and JaniaGlazovskiy and others, 1991) shows the glacier had become both thicker in the reservoir zone (the upper 4 km of the glacier) and steeper over most of its length during this period. At both dates, the thickest portion of the glacier was ∼5kmalongthe profile, roughly coincident with the down-glacier extent of the reservoir zone. The thickening and steepening have the effect of increasing the basal shear stress to ∼100 kPa over most of the glacier’s length. If the surge starts near the terminus and propagates up-glacier, presumably steepening of surface is most important in triggering the surge, in contrast to Variegated Glacier, Alaska, U.S.A., where ice thickening has been shown to be most critical (Reference Eisen, Harrison and RaymondEisen and others, 2001).
During peak flow, strong shear zones in the interferograms (Fig. 3) suggest that basal motion is dominating the flow of the glacier. This velocity pattern is similar to those of Osbornebreen (Reference Rolstad, Amlien, Hagen and LundénRolstad and others, 1997) and Monacobreen (Reference Luckman, Murray and StrozziLuckman and others, 2002) during their surges. At Fridtjovbreen, the long profile shows that, early in the surge, velocities increased almost monotonically down the glacier (Fig. 6a). In later profiles, a strong increase in velocity can be seen down-glacier of 6.3 km along the profile (Fig. 6a). Comparing the velocity results with the Russian bedrock map (Reference Glazovskiy, Macheret, Moskalevskiy and JaniaGlazovskiy and others, 1991) shows that this corresponds to the start of the area below sea level (the low-effective-pressure zone). Two strong flow restrictions are apparent farther down-glacier at ∼7–9 km along the long profile during faster flow periods, resulting in regions of strong compression and extension (Fig. 6a). This would be consistent with bedrock ridges beneath the glacier. However, there are no obvious rises or reverse slopes in the radar-determined bed at these locations, although the resolution may not be sufficient to distinguish such features.
Fridtjovbreen underwent a slow acceleration phase that lasted at least between October 1991 and spring 1995 (Fig. 6b). The pattern of flow observed in the interferograms suggests the surge affected first the western tributary, and that accelerated flow was occurring in this tributary at the very beginning of our observations, some 4years before peak flow (Fig. 3). Width-averaged balance velocities for Fridtjovbreen have been calculated by one author (A.-M.N.) at two locations at approximately 3.8 and 6.6 km along our profile (Fig. 1) as 0.02 and 0.03 md–1. At these locations, the lowest measured velocity from this SRI study is 0.06 and 0.10 md–1, respectively, about three times higher than the balance velocities. It would appear that, prior to the rapid rise in ice-flow rates, there is a progressive multi-year acceleration phase during which flow rates exceed balance velocities.
Conclusions
Interferometric SAR has been used to study the dynamics during surge initiation at the glacier Fridtjovbreen, central Svalbard. The results show that the direction of flow is consistent during the surge event. The glacier underwent a progressive acceleration phase over the period October 1991 and June 1995, which at all times exceeded the balance velocity. This slow acceleration phase was followed by a rapid acceleration to peak flow rates in winter 1995/96. By October 1997, a drop in the flow rate had occurred. There was no indication of a surge front travelling down-glacier, which is consistent with field observations of crevassing occurring initially near the glacier terminus.
Acknowledgements
We are grateful to the European Space Agency for providing the ERS images (project AO3-283). Meteorological data were generously supplied by the Norwegian Meteorological Institute, and digital map data by the Norwegian Polar Institute. This project was funded by the U.K. Natural Environment Research Council (projects GST/02/2192 and F14/6/37). M. J. Hambrey kindly provided photographs of Fridtjovbreen in surge. T.M.’s attendance at the Yakutat conference was supported by the Royal Society, Quaternary Research Association and the School of Geography, University of Leeds. Thanks are due to the reviewers, J.-O. Hagen, J. Kohler and editor H. Björnsson for their comments.


