


INTRODUCTION
Basal processes can force large changes in ice motion over short timescales. On the Greenland ice sheet (GrIS), observations have established a link between surface melt input and dynamical ice motion over daily to seasonal periods (Zwally and others, Reference Zwally2002; Bartholomew and others, Reference Bartholomew2010; Hoffman and others, Reference Hoffman, Catania, Neumann, Andrews and Rumrill2011). This forcing on velocity by surface input is attributed to the subglacial drainage system, which modulates sliding by adjusting the balance of forces at the bed through changes in drainage system pressure distribution and water coverage. To date, efforts have been focused predominantly on the evolution of active drainage elements at the ice-sheet bed (i.e. those that transport meltwater along the base), which permits direct assessment of pressure changes in response to imposed surface fluxes (e.g. Hewitt, Reference Hewitt2013; Werder and others, Reference Werder, Hewitt, Schoof and Flowers2013). Less attention, however, has been diverted to the isolated end-member component of the subglacial system, which may have important implications for basal water storage and traction.
Weertman (Reference Weertman1964) and Lliboutry (Reference Lliboutry1976) identified cavitation and acknowledged that cavities on the lee sides of bedrock bumps may be water-filled and isolated in nature. Iken and Truffer (Reference Iken and Truffer1997) posited that such isolated cavities may have a modulating effect on glacier flow variability. If water pressure in the active system rises, subsequent increase in velocity would drop pressure in isolated cavities, causing them to act as ‘sticky spots’. Alternatively, the persistence of isolated water bodies could promote continued sliding when pressure drops in the active system or the fraction of the bed covered by water-routing elements decreases. Over diurnal timescales, Ryser and others (Reference Ryser2014a) reproduced in situ deformation measurements and out-of-phase surface velocity and basal water pressure with a numerical model, and concluded that isolated, slippery reaches of the bed likely respond in a passive manner to daily changes in basal traction along a connected reach of the drainage system. Over longer scales, it has been hypothesized that the seasonal slowdown in Greenland during the melt season is the result of the incorporation of isolated basal cavities by more interconnected reaches of the ice-sheet drainage network (Andrews and others, Reference Andrews2014).
Isolated cavities thus appear to be a relevant component in the feedback between surface melt forcing, drainage development and sliding dynamics. However, their importance is likely a function of their size and distribution, processes influencing their pressure and proximity to water-routing elements along the ice-sheet bed. These remain poorly constrained beneath all glaciers, including the GrIS. Here, we present in situ measurements of borehole water pressure, temperature, and dye concentration, and augment these with GPS positions in a strain diamond from a site in the ablation zone of western GrIS. We use these data to characterize a reach of the basal drainage network, with focus on isolated elements. From independent dye and thermal dilution considerations, we estimate local drainage network geometry. Finally, we explore plausible processes inducing the observed pressure behavior in the context of the interpreted basal drainage conditions.
SITE AND METHODS
Site setting
The experiment was conducted in western GrIS’ ablation zone at a site located ~34 km east of the terrestrial terminus of Isunnguata Sermia (Fig. 1). The experimental borehole was one of nine drilled at the site, which are included in an east/west transect of 32 boreholes drilled to the bed during 2010–15 as part of a multi-faceted investigation of basal hydrology and ice dynamics in the region (Meierbachtol and others, Reference Meierbachtol, Harper and Humphrey2013, Reference Meierbachtol, Harper, Johnson, Humphrey and Brinkerhoff2015; Graly and others, Reference Graly, Humphrey, Landowski and Harper2014; Harrington and others, Reference Harrington, Humphrey and Harper2015). Ice thickness at the study site ranges from 641 to 675 m. Similar to other borehole sites along the transect, the ice temperature is coldest at mid-depth and has a temperate basal layer tens of meters thick (see Harrington and others, Reference Harrington, Humphrey and Harper2015). ICEBRIDGE radar data (Allen and others, Reference Allen, Leuschen, Gogineni, Rodriguez-Morales and Paden2010) indicate that the bed is relatively flat with a slight reverse bed slope, although an east/west trending, 1000 m deep basal trough exists ~1.8 km north of the site.
Western Greenland site setting. Study site and drill sites from previous field investigations (Meierbachtol and others, Reference Meierbachtol, Harper and Humphrey2013) are shown as black circles for reference. Surface contours are generated from the surface DEM from Bamber and others (Reference Bamber2013), overlaid on a LANDSAT 8 image from July, 2014. Detailed study area is shown in the inset image. Triangles in the inset show locations of GPS stations and star shows borehole location overlaid on a Worldview image from July, 2012 (Copyright 2011, DigitalGlobe, Inc.).

Borehole drilling
Hot water drilling methods permitted direct access to the ice-sheet bed (see Meierbachtol and others, Reference Meierbachtol, Harper and Humphrey2013 for description). Surface meltwater, temporarily housed in a 7.7 m3 tank, was used for drilling. While radar data established the approximate depth of the bed, in the field we used drill water pressure, drill tower load and borehole water level as indicators of contact with the ice/bed interface. The cold ice temperatures at depth caused refreezing of the borehole, allowing just 2–3 h of working time to install instrumentation after borehole completion. Depth marks on the drilling hose and sensor cable string constrain hole depth with an uncertainty of <1% (5 m).
Dye tracing
When the advancing drill was ~5–10 m above the expected bed depth, a known volume of 20% Rhodamine WT (RWT) dye was added to the drilling water reservoir. Dye concentration of the drilling water was confirmed by measurement after thorough mixing. The dyed hot water was pumped through the drill until the borehole terminated at the bed, and during drill recovery from the hole, resulting in a dye profile along the entire borehole length. The final dye concentration is strongly influenced by the drilling advance/extraction rate. Rapid drill extraction rates of ~25 m min−1 mean small volumes of dye were added higher in the borehole column facilitating greater dilution. Further, because we held the drill steady at the bed for 20 min in attempts to confirm basal intersection, dye concentrations should have been highest near the bottom of the borehole, approaching the concentration in the surface storage tank.
After hole completion, we lowered a Turner Designs Cyclops 7 fluorometer down the borehole, logging RWT concentration to capture a dye profile along the borehole column. The fluorometer was then fixed in place just above the bed, so that long-term dye concentrations at the ice/bed interface could be logged to a surface datalogger at 5 min intervals. To overcome signal degradation over the ~750 m cable lengths, we converted fluorometer voltage output to current. Current output was converted back to a differential voltage at the surface. Laboratory calibration confirmed a linear response of the modified voltage output across the 0–800 parts per billion (ppb) measurement range of the fluorometer. Our modified circuit limited the measurement precision and introduced a slight sensitivity to temperature change in the datalogger box. As a result, we estimate the accuracy of the fluorometer measurements to be ~10 ppb.
Thermal tracing
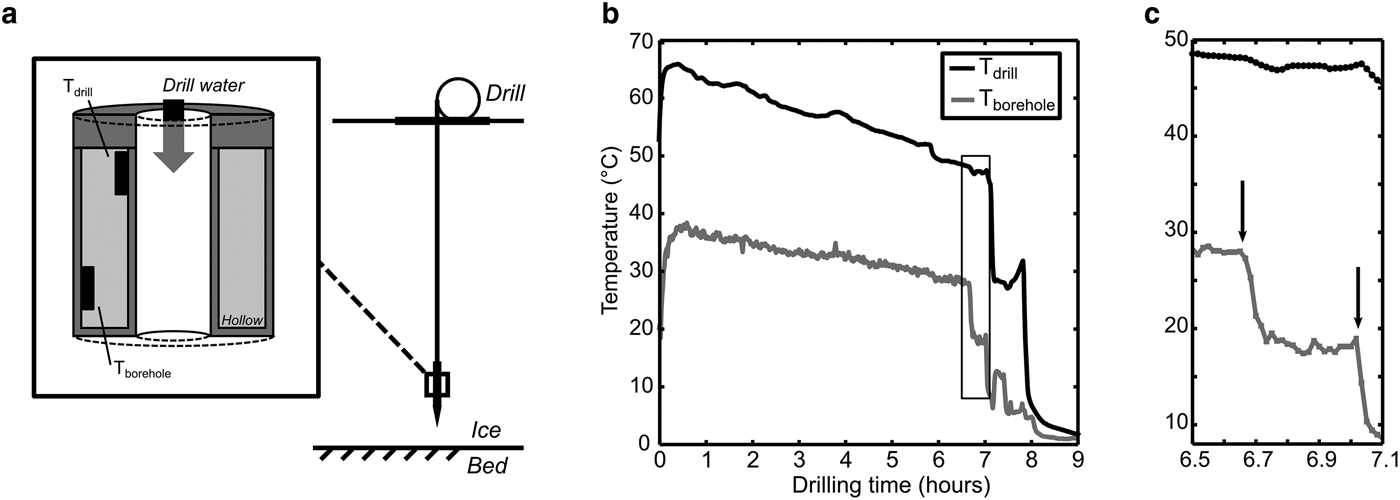
Two temperature sensors were embedded in the drill stem to track heat transfer between the drilling water and the borehole during drill advance and extraction (Fig. 2a). One sensor was located on the inside wall of the drill stem to measure the temperature of the drilling water prior to exiting the nozzle, and another was pressed against the outside wall of the stem to measure borehole water temperature. Temperatures were logged at 1 min intervals by a data logger located in the hollow drill stem cavity. Sensor resolution is 0.065°C.
Instrumented drill stem schematic indicating the water temperature sensor lay out (a), and drill and borehole water temperature during borehole drilling (b, c). Black rectangles labeled T drill and T borehole in (a) refer to sensors measuring temperature presented in (b) and (c). Bounding box in (b) identifies the bed intersection event displayed in (c). Vertical arrows in (c) identify the borehole water temperature drop from initial bed intersection, and subsequent drill extraction.
Assessing the accuracy of temperature measurements is complicated by thermal gradients between hot water flowing through the drill and the colder water in the borehole, facilitating heat conduction through the instrumented drill stem. Comparison of the inner sensor temperature with the drill water temperature exiting the diesel heaters at the surface prior to drilling indicates that the sensor measurement is within ~3°C of the water temperature traveling through the drill hose. The degree to which the outer sensor is affected by thermal conduction through the instrumented stem from hot drill water is difficult to constrain. In calculations below, as with the inner sensor, we assume the outer sensor is biased by 3°C from true borehole water temperature, and estimate an uncertainty of ±3°C in error calculations. In doing so, we inherently assume that the measured drill water and borehole water temperatures are minima and maxima, respectively.
Water pressure
We measured borehole water pressure using 2000 psi, Omega PX309-2KGI pressure transducers, which were installed just above the bed and connected to low-power dataloggers at the surface via signal cable. Dataloggers were constructed in house and converted analog pressure readings to a digital signal using a 24 bit A/D converter, yielding measurement resolution of ~0.1 m water level change. The measurement interval varied from 1 s to 15 min.
Surface velocity
Four GPS units were spaced approximately one ice thickness (700 m) apart in a strain diamond pattern encompassing our field site, and measured positions at 15 s intervals. Kinematic positions were determined by differential processing relative to a base station located ~22 km away at the ice-sheet margin using TRACK v.1.29 processing software. Reported positional errors are ~1–2 cm. Processed positions were smoothed using a Gaussian filter over a 6 h window to remove spurious, high-frequency noise. Velocities were subsequently calculated over 6 h time windows following Bartholomew and others (Reference Bartholomew2012). Over these time intervals, positional errors yield velocity errors of ~30–43 m a−1.
RESULTS
Below, we partition the results in to three different phases based on timing and relevant events.
Stage 1: borehole drilling (day of year 198)
Drill water temperatures declined over the course of drilling the 675 m borehole from increasing conductive losses as drill hose was payed into the water-filled hole (Fig. 2b). The thermal signature of bed intersection at the drill stem ~6.65 h after drilling commenced is characterized by an initial drop in borehole water temperature from 28°C to 18°C over 5 min (Fig. 2c). After reaching a minimum of 17°C, water temperature slowly increased to 19°C when drill extraction began, 20 min after initial bed intersection. The change in borehole water temperature occurred in the absence of temperature change in the drill water (Fig. 2c). A second drop in borehole water temperature occurs as a result of drill extraction through cold water higher in the borehole column (Figs 2b and c).
At the ice surface, bed intersection was characterized by enhanced back pressure in the drilling water and sudden reduction of load on the drill tower as the drill stem came in contact with the bed. However, the borehole water level remained at the ice surface. Not until the drill was extracted from the borehole ~45 min after bed intersection did the water level slowly drop by ~65 m. The rate of water input to the hole was greater than the rate of drill hose extraction during recovery, so the change in water level does not reflect a volume reduction from drill hose extraction.
Stage 2: diurnal water pressure swings (days of year 199–209)
Following the intersection of the ice-sheet bed on day of year 198, water pressure rose steadily for 2 d to ~50 m above overburden levels (Fig. 3b). The pressure peak was followed by a gradual decrease to below overburden levels and establishment of small diurnal variations. Daily pressure excursions had a range of 4–5 m and were nearly out of phase with diurnal velocity fluctuations (Figs 3 and 6). Daily pressure minima occurred between ~16:00 and 21:00 local time (UTC −2 during the summer season) and were closely aligned with velocity maxima. Pressure maxima occurred between ~05:00 and 07:00.
GPS surface velocity (a), water pressure expressed as meters head equivalent (b) and dye concentration (c) measured over a 15 d period in 2014. Red, blue, green and magenta velocity time series correspond to the west, south, north and east GPS stations, respectively. Gray line in (b) identifies the ice overburden pressure. Sporadic drops in dye time series, evident during days of year 205, 207, 208 and 209, are interpreted to reflect temporary sensor malfunction and not physical changes in dye concentration as discussed in the text.

Surface velocities during Phase 2 show consistent diurnal variability with subtle variations in timing and magnitude of diurnal maxima and minima between GPS receivers (Fig. 3a). Minimum daily velocities range from ~120 to 150 m a−1 and rise to daily maxima of ~200–250 m a−1.
Dye concentration slowly increased following installation of the fluorometer before plateauing at a constant concentration of ~95 ppb (Fig. 3c). This steady concentration was diluted from the initial drill water concentration of 610 ppb. Dye concentration remained steady for nearly 2 weeks with the exception of four periods of erratic behavior when voltage readings showed sporadic drops indicating dye-free conditions. Considering that these oscillatory excursions immediately recovered to the longer term mean, we interpret them to reflect behavior associated with the fluorometer light-emitting diode as opposed to real changes in dye concentration. This could result from temporary instrument malfunction if the fluorometer light source failed to power up or from temporary blockage of the light source from basal sediment or other instrumentation at the bottom of the borehole. We favor the latter interpretation as the surface datalogger was programmed to allow sufficient time for fluorometer power up during sensor excitation.
Stage 3: termination of diurnal variations (days of year 209 – end)
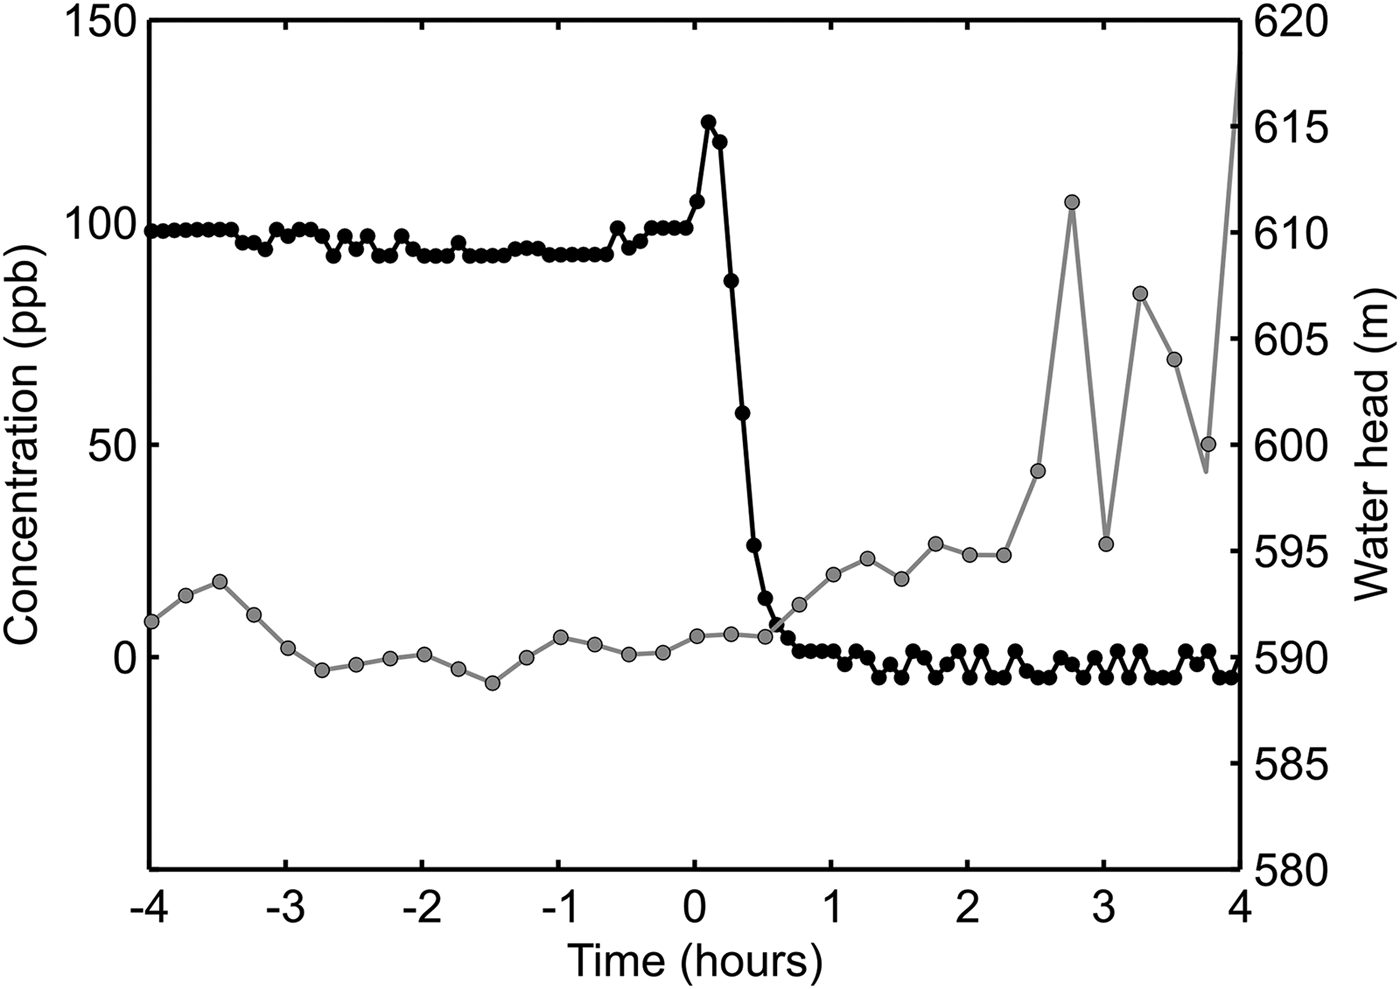
On day of year 209 diurnal pressure variations ended, as basal pressure dropped abruptly (Fig. 3b). Erratic pressure behavior ensued. Pressures lower than those during Phase 2 continued through day of year 210, and subsequently increased to levels above local overburden at the end of the experiment. Day 210 also documents a dye disappearance event. Dye concentration briefly increased before steadily declining to 0 ppb over the course of an hour (Fig. 4). This event was followed by persistent dye-free water at the bottom of the borehole, which continued until the end of the study period.
Dye concentration and water pressure (expressed in meters head equivalent) during the dye disappearance event on day of year 211. Dye concentration is shown in black, and referenced by the left y-axis. Right y-axis references basal water pressure, which is shown in gray. Time is shown in hours from the initiation of transient dye behavior indicating the beginning of the dye disappearance event.
Days of year 209–210 are marked by a period of low-quality GPS positions. Surface position and height show large excursions, in some places exceeding 2 m over short-time intervals. Considering that this period overlapped our field season and we did not experience such large changes in surface height, we have omitted this period from the time series. Velocities following the event continued to display diurnal variation; the end of the study period showed the lowest variations of the record (Fig. 3a).
ANALYSIS
Structure of the local basal system
The three phases described above display characteristic behavior which permit us to make inferences regarding the structure of the local drainage system. Phase 1 is defined by borehole water temperature drop in response to bed intersection during drilling and delayed borehole water level response, with slow drainage occurring ~45 min after intersection. Phase 2 is marked by out of phase diurnal basal water pressure and surface velocity variations in the absence of changing dye concentration. Permanent dye evacuation over 1 h marks Phase 3.
Slow or lacking borehole drainage in response to bed intersection during drilling has been previously interpreted to reflect connection to an isolated reach of the glacier bed (Gordon and others, Reference Gordon2001). This interpretation is supported at our field site by the dye concentration time series and thermal signature of bed intersection in the borehole water. In the absence of changes in drill water temperature, borehole water temperature changes reflect three possible scenarios:
-
Scenario 1: The drill intersects an isolated reach of the bed with no resident basal water (e.g. ice overlying bedrock).
-
Scenario 2: The drill intersects an isolated basal cavity of unknown volume.
-
Scenario 3: The drill intersects an active region of the bed with substantial water flow.
Prior to basal intersection, heat energy from drilling acts primarily to overcome the latent heat barrier associated with the phase change from ice to water ahead of the drill tip. In scenario 1, this heat energy is redirected toward melting a cavity around the drill tip and dissipation in bedrock, when an isolated system without resident basal water is intersected. In the absence of efficient latent heat transfer directly in front of the drill tip, the expected thermal signature is warming of borehole water closest to the drill as depicted in Figure 5.
Conceptual model of borehole water temperature change in response to drill intersection with the bed for the three potential scenarios described in the text.

In scenario 2, the drill heat energy undergoes turbulent mixing with resident basal water (initially at the pressure melting temperature), which forces an initial drop in temperature. However, due to the isolated nature of the cavity, the thermal system evolves toward a steady state similar to scenario 1 (Fig. 5). The final steady-state temperature in scenario 2 is expected to be a function of the basal cavity geometry; a cavity geometry with larger ice-water contact patch (i.e. larger surface area) will have greater energy transfer to the ice, and hence lower water temperature than scenario 1.
In scenario 3, flowing basal water advects hot drill water away from the immediate basal system, resulting in a new steady temperature that is lower than prior to bed intersection. Alternatively, drainage of the borehole water column could induce a similar effect by advection of colder water from higher in the borehole column. These three conceptual models guide interpretation of water temperature results and allow us to generate constraints on the volume of basal water to which we connected.
The borehole water temperature drop upon bed intersection, rules out scenario 1. It appears that water temperatures slowly began to warm after sometime, but a long-term warming signature was absent because of drill extraction. However, dye concentrations are constant for nearly 2 weeks after drilling, indicating stagnant conditions at the bed, and this allows us to eliminate scenario 3. Further, the borehole water level remained at the surface when the bed was intersected, eliminating the advection of borehole column water as a cooling source.
Taken together, measured dye concentrations and the thermal signature of the borehole water temperature during drilling strongly suggest connection to an isolated basal cavity. Further, steady dye concentrations indicate that this cavity remains unconnected for nearly 2 weeks after drilling. Because borehole water temperature drops at bed intersection, and measured dye concentration is dilute from the injected concentration, the basal cavity must be water-filled. In this event, the magnitudes of cooling and dilution, respectively, provide an indication of the volume of the isolated cavity. Next, we provide first-order estimates of cavity volume by considering thermal dissipation and dye dilution.
Basal cavity volume
In estimating cavity volume from dye dilution, the measured dye concentration (C final) of 95 ppb is the result of mixing of resident cavity basal water volume (V res), dyed drill water (C drill, V drill), clean ice melted during drilling (C melt = 0, V melt) and borehole column water from delayed borehole drainage (C bh, V bh). The individual water volumes V i and dye concentrations C i mix to form the final measured solution concentration following the dilution equation:
 $${\sum {({C_{\rm i}}{V_{\rm i}})} = {C_{{\rm final}}}\sum {{V_{\rm i}}}}. $$
Rearranging Eqn (1) and substituting dye concentration and volume from each of the mixing components above thus permits estimation of the basal cavity volume:
 $${{V_{{\rm res}}} = \displaystyle{{[{C_{{\rm bh}}}{V_{{\rm bh}}} + {C_{{\rm drill}}}{V_{{\rm drill}}}]} \over {{C_{{\rm final}}}}} - ({V_{{\rm bh}}} + {V_{{\rm melt}}} + {V_{{\rm drill}}})}.$$
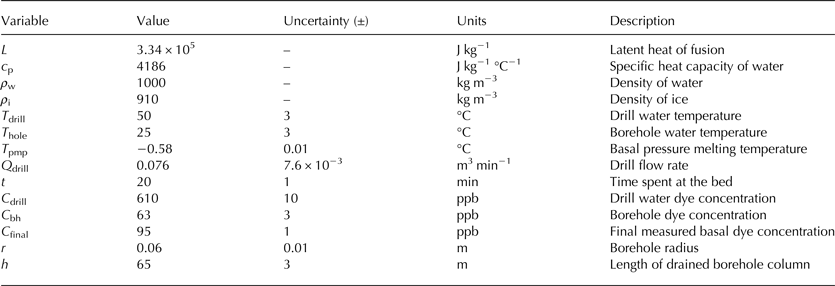
We estimate the melted ice volume (V melt) from the measured temperature difference between drill water and borehole water, assuming that this thermal energy goes to the phase change in melting ice, and warming that melt to the ambient temperature of the borehole water. Borehole volume (V bh) is estimated from the observed water level drop following drilling, assuming a cylindrical borehole with radius of 0.06 m. Drill volume is estimated from the drilling discharge rate and time spent drilling at the bed. Dye concentration of the borehole column is taken from the initial dye profile in the column during deployment of the fluorometer. With these considerations, and propagating the estimated uncertainty for each quantity (shown in Table 1) following Taylor (Reference Taylor1997), we calculate the estimated cavity volume from dye dilution to be 7.6 ± 6.7 m3.
Variables, variable values and estimated uncertainties
We estimate basal water volume from thermal dissipation by using the temperature change in borehole water during bed intersection as a thermal signature of the basal system.
The temperature drop in borehole water (ΔT) reflects the change in energy consumption at the bed:
 $${{\rm \Delta} \dot E = {Q_{{\rm drill}}}{c_{\rm p}}{\rho _{\rm w}}{\rm \Delta} T},$$
where variables are defined in Table 1. Integration of Eqn (3) over the duration of time spent drilling at the bed yields a first-order estimate of the total change in energy consumption. We assume that this change in energy acts solely to warm resident basal water from the pressure melting temperature (T pmp) to the temperature of the borehole water. This is a function of the resident basal water volume (V res):
 $${E = {V_{{\rm res}}}{\rho _{\rm w}}{c_{\rm p}}({T_{{\rm hole}}} - {T_{{\rm pmp}}})}.$$
We estimate ΔT to be 11°C in computing the total change in energy consumption from Eqn (3). We substitute this value in the left-hand side of Eqn (4), and calculate a basal cavity volume from thermal dissipation of 1.1 ± 0.9 m3.
Calculating basal volume from dye dilution assumes that there is complete mixing between resident water, ice melt, drill water and borehole column water. However, the small increase in dye concentration just prior to the dye disappearance event (Fig. 4) suggests that complete mixing was not achieved and so the dye dilution calculation is a maximum estimate. With this in mind, and considering the uncertainty of the estimates, the two independent methods show the cavity volume is less than tens of cubic meters, but likely to be larger than one.
DISCUSSION
Ice sheet and glacier sliding dynamics are influenced by basal drainage processes. The coupling between drainage dynamics and ice motion is commonly assigned to basal water pressure, which responds to local water flux, so that surface meltwater ultimately forces basal motion (e.g. Hewitt, Reference Hewitt2013; Hoffman and Price, Reference Hoffman and Price2014). Our results identify pressure variations over diurnal periods in the absence of water flow, and GPS measurements show that these diurnal pressure variations are out of phase with respect to surface velocity (Figs 6a and b). Estimates from dye and thermal dissipation considerations suggest that these pressure variations act on a cavity with volume that is on the order of cubic meters. The aspect ratio of basal cavities in the lee sides of bedrock bumps depends on the bedrock bump height which is inherently unconstrained. As a first approximation, a bump height on the order of decimeters may be assumed as ice may flow around bumps larger than meter-scale through enhanced deformation. Thus, it is plausible that our measured pressure variations act over areas of the bed that are of the order of many tens of square meters.
Measured water pressure in meters head equivalent (a), velocity from the east GPS station (b), and detrended strain from the GPS strain grid (c) over a 4 d period from day of year 205–209. Bold black line shows ε xx , and thin line shows ε yy in (c). Strain in (c) is calculated by linearly detrending the cumulative strain over the time series, which is shown in Figure 7. Periods of interest from daily water level maxima to minima are shown by the gray vertical lines and horizontal arrows.

Similarly out of phase basal pressure and surface velocity behavior has been identified on Greenland by Ryser and others (Reference Ryser2014a) and Andrews and others (Reference Andrews2014) in boreholes that were interpreted to be connected to an isolated reach of the bed. The observed prevalence of such pressure variations and likelihood that they act over a measurable area of the bed motivate investigation of other, potentially non-local sources that may influence basal pressure dynamics.
Pressure changes in isolated cavity space can be invoked through changes in volume. The equation of state for water relates density changes to changes in pressure (Clarke, Reference Clarke1987; Murray and Clarke, Reference Murray and Clarke1995; Kavanaugh, Reference Kavanaugh2009):
 $${{\rho _{\rm w}}(\,p) = {\rho _{\rm w}}({\,p_{\rm 0}}){\rm exp[}\beta (\,p - {\,p_{\rm 0}}){\rm ]}},$$
where p 0 is a reference water pressure, and β is the compressibility of water (taken here to be 5.1 × 10⁻¹⁰ Pa−1). Assuming mass is conserved, density change is the result of volume change alone, and Eqn (5) is rearranged to yield the volume change associated with a pressure perturbation:
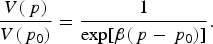 $${\displaystyle{{V(\,p)} \over {V({\,p_{\rm 0}})}} = \displaystyle{1 \over {{\rm exp[}\beta (\,p - {\,p_{\rm 0}}){\rm ]}}}}.$$
Due to water's incompressible nature, pressure excursions result from small changes in volume: a pressure change similar to the diurnal variations we observe in our boreholes (5 m head equivalent) can be induced by a volume change of ~2.5 × 10⁻³%.
Small volume changes could be induced from three mechanisms, each forced by overlying ice dynamics rather than local water flow: (1) daily changes in longitudinal straining of the cavity/borehole system, (2) opening of cavity space through accelerations in glacier sliding over a bedrock bump, and (3) load transfer at the bed resulting from elastic displacement of the ice roof in response to pressure increases in nearby connected regions. We assess the plausibility of each below.
Longitudinal effects
If longitudinal extension and compression is great enough on a daily scale, the resultant straining of the coupled borehole/cavity system could induce the measured pressure diurnal variations. Over the duration of the time series, cumulative strain across the GPS strain diamond shows net extension (positive strain) in the Cartesian y-direction and compression in the x-direction (Fig. 7). However, by linearly detrending the cumulative strain time series to remove longer term trends, and comparing this detrended time series with the basal water pressure, surface strain changes over the half-cycle from high to low water pressure show little evidence of extension (Fig. 6). Instead, the dominant trend appears to be compression in the x-direction, which would imply squeezing of the borehole/cavity system.
Cumulative strain calculated over the GPS strain diamond during the study period. Bold black line shows ε xx , and thin line shows ε yy . Positive strain indicates extension, and negative values indicate compression. Horizontal dashed line indicates 0 strain. Break in time series corresponds to the period of high GPS position variability as discussed in the text. Due to resetting of the GPS units, the time series terminates before the end of the velocity record in Figure 3.

The lack of clear tensile strain in the GPS strain diamond during basal pressure decline leads us to conclude that longitudinal stretching is unlikely to force the measured pressure variations. This result contrasts with Ryser and others (Reference Ryser2014a), who successfully reproduced measured out-of-phase surface velocity and basal pressure behavior using a numerical ice flow model, and concluded that the out-of-phase behavior resulted from longitudinal stress coupling between passive slippery (i.e. isolated) reaches at the bed and sticky reaches undergoing transient changes in basal traction. Inferring basal conditions from surface strain calculations as we have done ignores complicating processes through the ice column and may thus be an oversimplification, but the result of Ryser and others (Reference Ryser2014a) also requires longitudinal extension through the full ice thickness (e.g. see Ryser and others (Reference Ryser2014a) Fig. 10). Alternatively, the fact that our measured pressure variations occur below ice overburden suggests that our borehole may connect to a different basal setting than the drainage system studied by the authors. Thus, isolated pressure variations that are out of phase with surface velocity may also be forced by other processes that occur outside of a setting that is near transition from slippery to sticky.
Cavity opening from sliding
To examine cavity opening, we restrict our analysis by assuming that the change in cross-sectional area of the cavity is proportional to the change in volume. Thus, in an isolated system, Eqn (6) implies that cavity opening increases cavity volume, which enforces a drop in water pressure (i.e. when (dS / dt) > 0, (dp w / dt) < 0) and vice versa. This implies that (dS / dt) = 0 when (dp / dt) = 0 (e.g. at water pressure minima and maxima), which is satisfied twice daily under diurnal pressure variations. In the absence of melting induced by water flow, cavity opening from sliding is countered by closure from creep of the overlying ice roof (Schoof, Reference Schoof2010):
 $${\displaystyle{{{\rm d}S} \over {{\rm d}t}} = {u_{\rm b}}{h_{\rm s}} - cS{N^n}},$$
where u b is the sliding velocity, h s is the bedrock step height, c is a constant reflecting the ice viscosity, S is the cavity cross-sectional area, N = p i − p w is the effective pressure, and n is Glen's flow exponent, which we take to be 3. Our velocity results suggest that the sliding rate is also likely to vary at these two points in time. If we assume that diurnal velocity variations are due to changes in basal motion alone, then daily sliding increases from some baseline level when water pressure is high (u b(p max)), to a faster speed when water pressure is low (u b(pmin) = ub(pmax) + Δu), by some amount Δu. Because (dS / dt) = 0 at pressure minima and maxima, this permits the cross-sectional area to be isolated in Eqn (7) at these times. Substituting the above expressions for sliding velocity, and computing the fractional change in area at these two instances yields:
 $${\displaystyle{{S({\,p_{{\rm min}}})} \over {S({\,p_{{\rm max}}})}} = \displaystyle{{({u_{\rm b}}({\,p_{{\rm max}}}) + {\rm \Delta} u)} \over {{u_{\rm b}}({\,p_{{\rm max}}})}}{{\left[ {\displaystyle{{{\,p_{\rm i}} - {\,p_{{\rm max}}}} \over {{\,p_{\rm i}} - {\,p_{{\rm min}}}}}} \right]}^n}},$$
where ice viscosity (c) and bedrock step height (h s) cancel. Assuming that volume changes in the cavity result from cross-sectional area changes alone, Eqn (8) indicates that, under the basal cavitation conceptual model, the pressure/volume relationship from Eqn (6) can only be achieved under specific baseline sliding conditions (u b(p max)) if water pressures p min and p max, and velocity change Δu are known.
Our observations permit us to estimate p max and p min over the diurnal cycle. During this period, surface velocity changes by ~100 m a−1 (Δu = 100 m a−1). Under these conditions, we calculate that baseline sliding velocity must be ~32 m a−1. However, the sliding result is quite sensitive to small uncertainties in the ice thickness. Thickness uncertainties of ±3 m invoke a sliding velocity uncertainty of ±18 m a−1. Thus, background sliding on the order ~30–50% of the minimum measured surface velocity (~120 m a−1) satisfies the estimated pressure/volume relationships. In comparison, in a similar setting in western Greenland Ryser and others (Reference Ryser2014b) reported basal motion can exceed 90% of surface motion in the summer (and 44–73% in the winter). Large variations in sliding velocity are likely across Greenland's ablation zone, and so while our estimate appears low, we cannot eliminate sliding-induced cavity opening as a mechanism controlling the measured pressure variations from our analysis.
Load transfer
Murray and Clarke (Reference Murray and Clarke1995) presented a conceptual model whereby pressure increases in a hydraulically active region of the bed elastically displaced the overlying ice roof, mechanically increasing the volume of nearby isolated cavity space. Assuming a simplistic, rectangular cavity with an initial height between 0.15 and 0.5 m, the necessary volume expansion, we calculate requires raising the ice roof ~4–12 µm, respectively. Murray and Clarke (Reference Murray and Clarke1995) found that similar roof expansion values could be induced by pressure pulses on the order of 10 m head equivalent in a connected system <10 m away. Our documented dye disappearance event indicates active drainage elements persist close to our cavity, meaning a potential source exists for pressure pulses within active reaches of the bed. Elastic displacement of the overlying ice roof of the isolated cavity thus appears to be a plausible mechanism for inducing pressure perturbations.
The load transfer conceptual model is poorly constrained in that the size of the connected reach, magnitude of pressure disturbance and distance from the isolated pocket all influence the corresponding response in the unconnected cavity. The fact that our measured dye evacuation event occurred over 1 h, coupled with our volume estimates, implies that the flow rate through active drainage elements is of the order of ~0.1 m3 min−1. Large preexisting conduits (i.e. meter diameter) would likely have the capacity to evacuate the stored basal water in seconds to minutes. Thus, if pressure pulses in connected basal features elastically displace the ice roof and drop pressure in the isolated area, it appears that the connected reach must be composed of small nearby drainage elements as opposed to a large distal melt conduit.
CONCLUSIONS
A suite of measurements at the surface and within a borehole provide in situ constraints on basal conditions of the GrIS at a site located 34 km inland from the outlet stream, where the ice is nearly 700 m thick. Borehole water temperature and in situ dye tracing at the bed via borehole injection indicates connection to an isolated basal cavity, which we estimate to be on the order of cubic meters in size. Measurements of basal water pressure in the isolated cavity show diurnal swings, which are out of phase with surface velocity recorded by a GPS strain diamond encompassing the borehole measurement. Because dye measurements indicate no local water flow at the bed, it is plausible that measured pressure changes are due to small changes in volume of the coupled borehole/cavity space.
Our in situ measurements provide direct example that changes basal water pressure can be a complex function of processes other than local water flux. In our case, longitudinal coupling effects are not responsible for pressure variations, but accelerated cavity opening and load transfer from elastic uplift are plausible mechanisms for volume/pressure changes at the bed. If load transfer is responsible for pressure variations, connected reaches of the bed are likely to consist of small nearby flowpaths as opposed to large distal melt conduits. Thus, horizontally and vertically directed mechanical processes may induce important pressure variations over isolated reaches of the bed and need to be considered in the relationship between water flux, water pressure and sliding speed.
ACKNOWLEDGEMENTS
This work is funded by NSF (Office of Polar Programs-Arctic Natural Sciences grant no. 0909495), SKB, Posiva, NWMO, NAGRA and NASA grant NNX11AM12A. Discussions with J. V. Johnson helped guide the analysis. C. Florentine assisted with instrument calibration and field experiments.


 Open access

