


I. Introduction
Decentralized finance enables financial services to operate on public blockchains through self-executing smart contracts,Footnote 1 allowing assets to trade without traditional intermediaries. A fast-growing segment of this activity involves fiat-referenced stablecoins such as USDC and EURC, which maintain one-to-one parity with the U.S. dollar and the euro.Footnote 2 These stablecoins trade on decentralized exchanges (DEXs), creating an on-chain analogue to traditional foreign exchange (FX) markets. Although still small relative to global FX turnover, such markets have attracted increasing attention as potential infrastructure for cross-border payments and settlement.Footnote 3
This article provides the first microstructure analysis of a blockchain currency market and assesses whether it is efficiently linked to the underlying currency market. We identify two channels supporting this linkage. The first is an arbitrage channel that keeps decentralized and traditional prices tightly aligned, although it is constrained by blockchain frictions such as gas fees and Ether price volatility. The second is an information channel, whereby order flow reflects private information about fundamentals. Participants who trade at large scale and have direct access to stablecoin issuance and redemption exhibit informational advantages consistent with the asymmetric-information paradigm in FX markets (Ranaldo and Somogyi (Reference Ranaldo and Somogyi2021)).
A central goal of the paper is to examine whether—and how—blockchain and traditional FX markets interact. To do so, we construct a granular transaction-level data set for the EURC/USDC pair on Uniswap V3, the dominant DEX for stablecoin trading, and combine it with price and order data representative of the global traditional currency market obtained from the Continuous Linked Settlement (CLS) system.Footnote 4 A distinctive feature of blockchain markets is the transparency of wallet-level identities, which allows us to classify participants by economic role, distinguishing sophisticated traders, primary dealers with mint and redemption access, and liquidity providers (LPs). Such real-time identification is rarely available in traditional FX microstructure data, where dealer and client activity must typically be inferred indirectly (Hagströmer and Menkveld (Reference Hagströmer and Menkveld2019), Hortaçsu and Sareen (Reference Hortacsu and Sareen2005)).
Using this data set, we document several features of decentralized FX trading. EURC/USDC prices are closely linked to EUR/USD benchmarks, with average deviations of roughly 24 basis points that narrow during periods of active trading. These deviations covary with blockchain-specific frictions such as gas fees and slippage rather than with balance-sheet constraints that determine pricing in traditional FX markets.Footnote 5 Transaction costs therefore vary substantially across users. Gas fees dominate for smaller traders, while slippage is the primary cost for larger traders. Although these costs exceed those faced by inter-dealer FX participants, they are comparable to those incurred by less-privileged over-the-counter (OTC) clients (Hau, Hoffmann, Langfield, and Timmer (Reference Hau, Hoffmann, Langfield and Timmer2021)).
We then examine the arbitrage mechanism linking decentralized and traditional FX markets. Price differences between EURC/USDC and EUR/USD predict subsequent on-chain order flow, indicating that trading activity corrects cross-market price discrepancies. This mechanism is particularly visible during the USDC de-pegging episode on Mar. 11, 2023, when concerns about reserves held at Silicon Valley Bank (SVB) generated sharp price dislocations across venues. In this episode, subsequent on-chain trading was dominated by sophisticated traders, who were the only group to systematically arbitrage across centralized exchanges and Uniswap pools. Similar dynamics are observed around Federal Reserve announcements. Following policy news, EURC/USDC prices adjust rapidly toward EUR/USD, accompanied by pronounced increases in on-chain trading volume that coincide with heightened activity in traditional FX markets.
Having established the arbitrage channel, we next investigate whether on-chain order flow also conveys private information about fundamentals. Using a structural vector autoregression (SVAR) framework following Hasbrouck (Reference Hasbrouck1991), we study the dynamic interaction between blockchain order flow and prices. Order flow from sophisticated traders and primary dealers generates significant and persistent price impacts, indicating that their trades contain information about fundamentals. In contrast, LPs exhibit little or weakly negative price impact, consistent with their role as liquidity suppliers rather than informed traders. These findings are robust to alternative trader classifications and controls for liquidity and just-in-time liquidity provision.
We next examine whether the permanent price effects reflect private information about fundamentals or arbitrage that aligns decentralized prices with traditional benchmarks. We use two complementary tests. We exploit a feature unique to blockchain markets by classifying transactions according to their routing, distinguishing public transactions from private transactions that bypass the public mempool.Footnote 6 Private transactions, which are concentrated among sophisticated traders and primary dealers, generate larger and more persistent price impacts, suggesting that these trades embed information relevant for future EUR/USD movements. We also decompose order flow into an arbitrage-driven component predicted by lagged DEX–CLS price differentials and a residual component that we interpret as informational order flow. Only the residual component produces significant price impact with respect to benchmark FX returns.
Taken together, the evidence shows that blockchain currency markets are closely integrated with traditional FX markets through both arbitrage and information channels, and that blockchain transparency offers a unique lens for studying price discovery at high frequency.
Related Literature. This article contributes to research on DEXs, stablecoins, and FX market microstructure.
A first strand studies the design and functioning of DEXs. Recent work assesses market quality and efficiency in automated market makers (AMMs, decentralized trading protocols in which prices are determined algorithmically as a function of pool liquidity rather than through a limit order book) and examines liquidity provision and informed trading incentives in these environments (e.g., Barbon and Ranaldo (Reference Barbon and Ranaldo2024), Capponi and Jia (Reference Capponi and Jia2025), and Lehar and Parlour (Reference Lehar and Parlour2025)). Related contributions study AMMs in FX and equity settings (Foley, O’Neill, and Putniņš (Reference Foley, O’Neill and Putniņš2023), Malinova and Park (Reference Malinova and Park2024)) and use transaction-level blockchain data to analyze market events and trading costs (Adams, Lader, Liao, Puth, and Wan (Reference Adams, Lader, Liao, Puth and Wan2023), Liu, Makarov, and Schoar (Reference Liu, Makarov and Schoar2023)). Relative to this literature, we use wallet-level data to identify informational advantages across trader types and to show how participants link decentralized and traditional FX markets through both arbitrage trading and the incorporation of fundamental information.
A second strand focuses on stablecoins and their price stability. Prior work shows that arbitrage stabilizes on-chain exchange rates across tokens and venues (Lyons and Viswanath-Natraj (Reference Lyons and Viswanath-Natraj2023), Ma, Zeng, and Zhang (Reference Ma, Zeng and Zhang2025)), while other studies highlight fragility and run risk in collateralized designs (Aldasoro, Ahmed, and Duley (Reference Aldasoro, Ahmed and Duley2023), Eichengreen, Nguyen, and Viswanath-Natraj (Reference Eichengreen, Nguyen and Viswanath-Natraj2023), and Gorton, Klee, Ross, Ross, and Vardoulakis (Reference Gorton, Klee, Ross, Ross and Vardoulakis2026)). We extend this literature by studying stablecoins within the informational efficiency of a blockchain currency market and by assessing the extent to which such markets can intermediate FX trading alongside traditional OTC infrastructure.
We also contribute to the FX microstructure literature on order flow and price formation (Evans and Lyons (Reference Evans and Lyons2002), Huang, Ranaldo, Schrimpf, and Somogyi (Reference Huang, Ranaldo, Schrimpf and Somogyi2025), and Ranaldo and Somogyi (Reference Ranaldo and Somogyi2021)). Traditional FX pricing models emphasize portfolio shifts and inventory management transmitted through inter-dealer trading (Evans and Lyons (Reference Evans and Lyons2002)), whereas pricing on Uniswap V3 is determined algorithmically through bonding curves that clear trades without intermediaries. Despite these structural differences, heterogeneous traders in blockchain currency markets play economically analogous roles. Analogous to the microstructure tests of Lyons (Reference Lyons1995), which distinguish price adjustments driven by inventory control from those driven by private information, we test whether prices are driven primarily by arbitrage constraints and blockchain frictions or by the asymmetric information of sophisticated traders.
Our results indicate that sophisticated traders and primary dealers exhibit informational advantages, while LPs behave passively by reallocating liquidity in response to price movements rather than actively managing inventory risk. Consistent with the asymmetric-information paradigm in FX markets (Ranaldo and Somogyi (Reference Ranaldo and Somogyi2021)), blockchain order flow predicts EUR/USD returns, while arbitrage activity links decentralized prices to traditional FX benchmarks.
The remainder of the article is structured as follows: Section II describes the institutional setting and data. Section III analyzes market efficiency and transaction costs in decentralized currency markets. Section IV evaluates the informational content of blockchain order flow and its link to traditional FX markets. Section V concludes.
II. Data and Institutional Background
A. Market Structure of Blockchain and Traditional Currency Markets
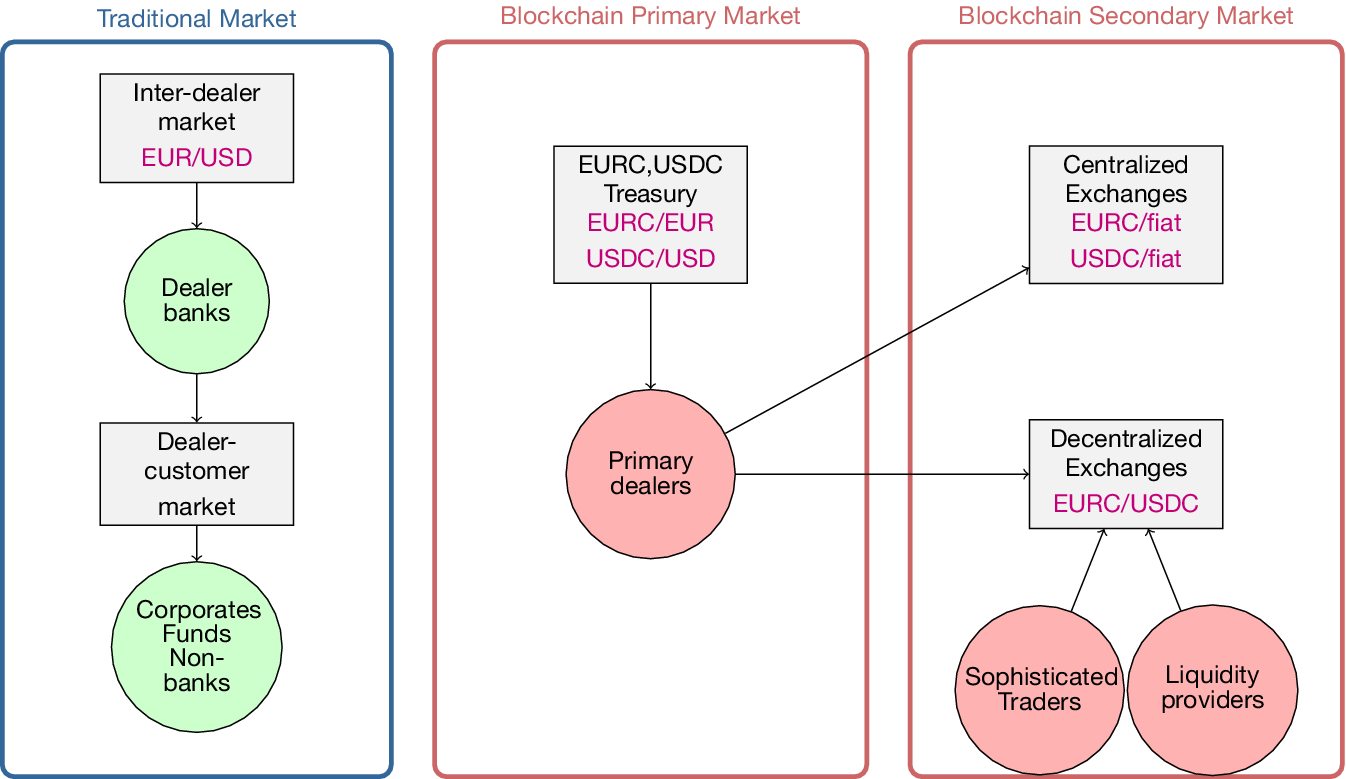
Figure 1 summarizes the institutional structure of the traditional EUR/USD market and the blockchain EURC/USDC market studied in this article. Traditional FX is organized around a two-tier dealer system in which banks intermediate customer trades and trade among themselves in an inter-dealer market that remains central to price discovery (Chaboud, Rime, and Sushko (Reference Chaboud, Rime, Sushko, Gürkaynak and Wright2023), King, Osler, and Rime (Reference King, Osler and Rime2012)). Dealers supply liquidity, manage inventory risk, and process information embedded in customer and inter-dealer order flow, consistent with inventory and portfolio-shift models (Bjønnes and Rime (Reference Bjønnes and Rime2005), Evans and Lyons (Reference Evans and Lyons2002), Huang, O’Neill, Ranaldo, and Yu (Reference Huang, O’Neill, Ranaldo and Yu2023), and Ranaldo and Somogyi (Reference Ranaldo and Somogyi2021)). Electronic platforms such as Refinitiv and EBS support this structure by allowing dealers to post quotes on centralized limit order books, while nonbank financial institutions, corporates, and asset managers typically access liquidity through dealers.
Figure 1 presents a schematic comparison of traditional and blockchain-based currency markets. In traditional FX markets, liquidity is provided by dealer banks operating in an inter-dealer market and a dealer–customer market, where dealers trade with corporates, funds, and nonbank financial institutions. In the blockchain market, issuance occurs in a primary market in which Circle, through its treasury operations, mints EURC and USDC tokens and distributes them to primary dealers. These tokens are subsequently traded in secondary markets, including centralized exchanges with limit order books and decentralized exchanges such as Uniswap, where EURC and USDC trade against each other. Secondary-market participants include liquidity providers and sophisticated traders.
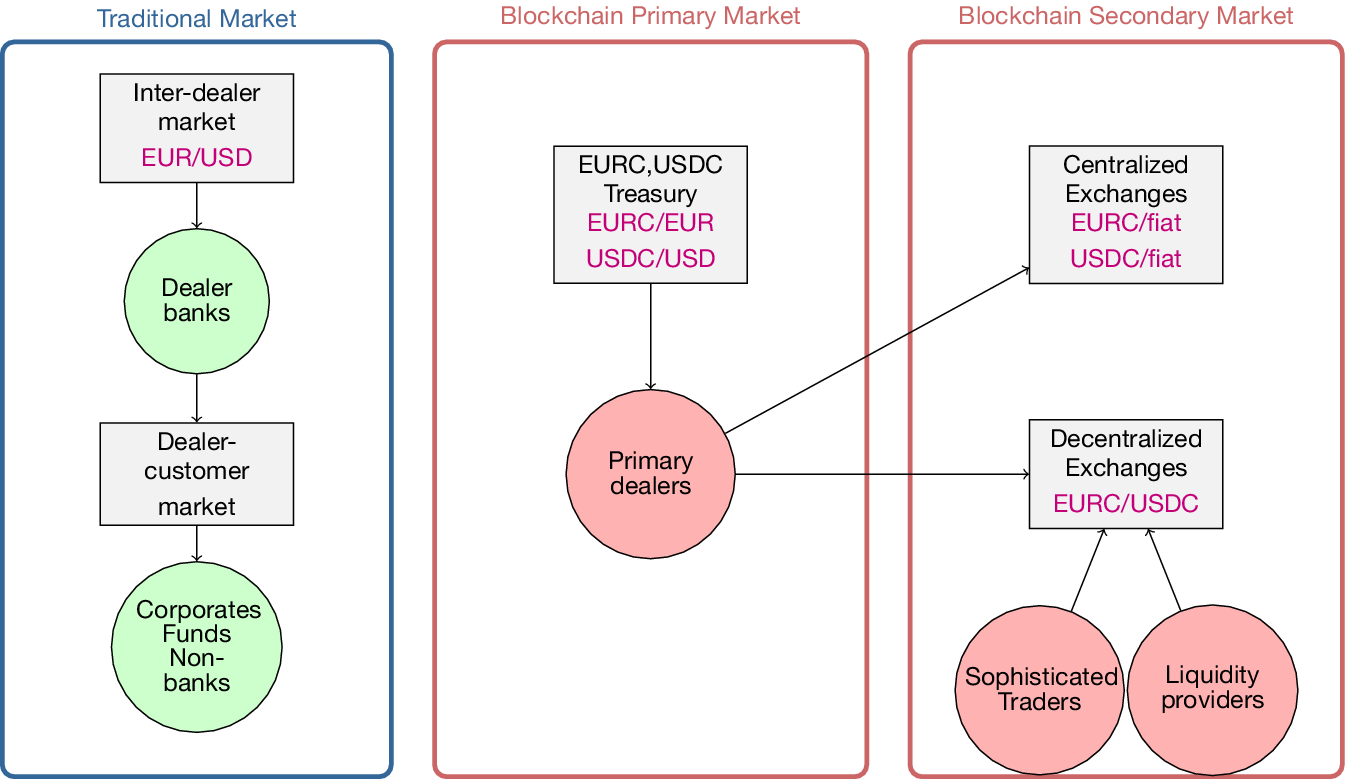
Blockchain currency markets operate under a different structure. Stablecoins such as EURC and USDC are issued by a centralized intermediary, Circle, but trade in a decentralized secondary market. In the primary market, Circle’s treasury mints and redeems tokens at par for participants who transact directly with the issuer, which we refer to as primary dealers. These dealers link primary and secondary markets by arbitraging deviations from par. When a stablecoin trades above par, dealers can mint tokens and sell at a premium; when it trades below par, they can purchase at a discount and redeem for fiat. These flows help stabilize the peg and connect issuance to secondary-market prices. Section A of the Supplementary Material provides additional institutional detail.
In the secondary market, stablecoins are traded across a range of applications, including decentralized and centralized exchanges, lending and liquidity protocols, and cross-border payment systems (Adams et al. (Reference Adams, Lader, Liao, Puth and Wan2023)). On DEXs, trades execute against automated market makers implemented as smart contracts, with liquidity supplied by LPs and demanded by traders. We describe the mechanics of AMMs and the roles of different participants further below.
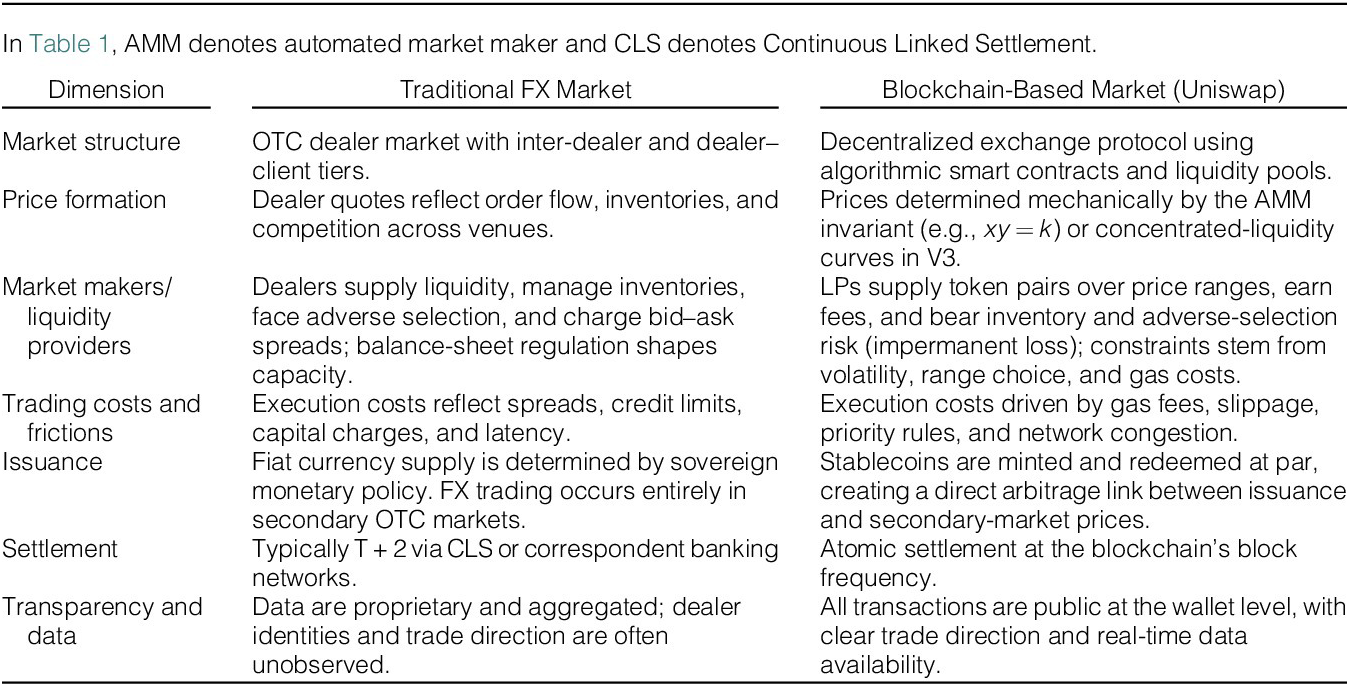
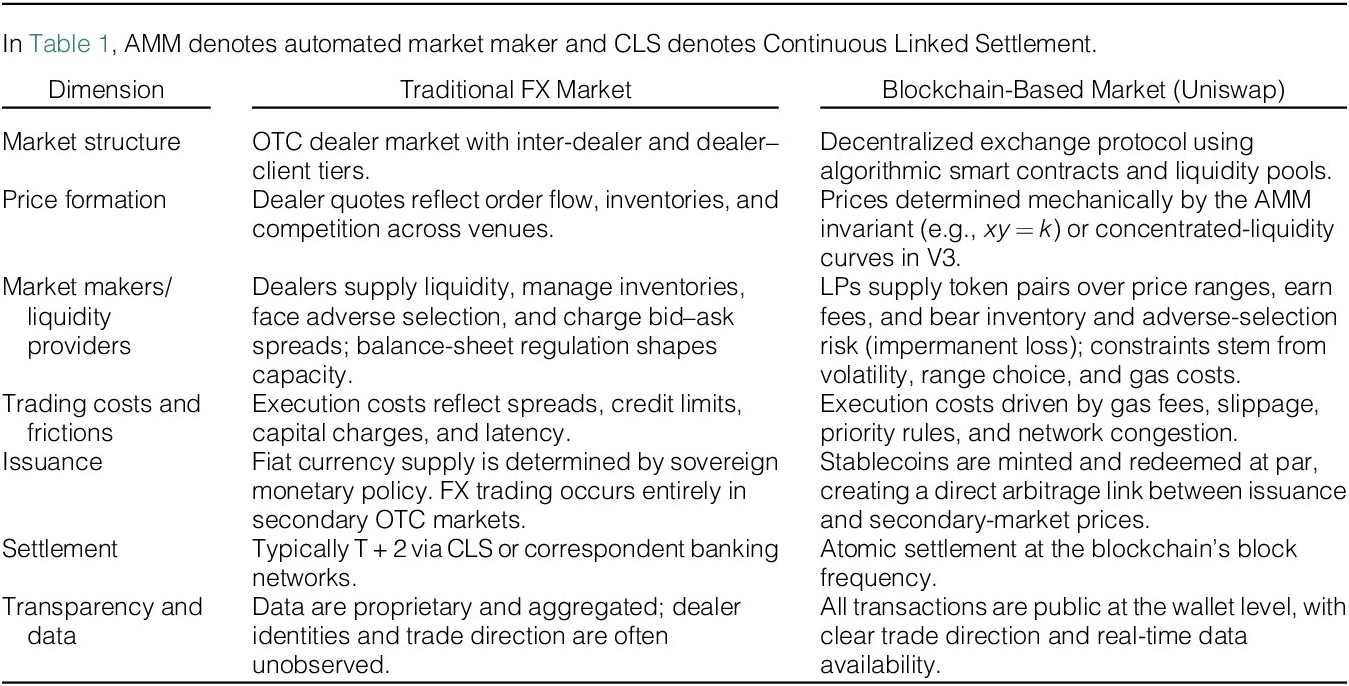
Table 1 highlights several institutional differences between traditional FX and blockchain-based currency markets. For example, FX trades typically settle on a $ T+2 $
basis through CLS or correspondent banking networks, whereas blockchain transactions settle atomically within each block.Footnote
7 Trading frictions also differ, with FX execution shaped by credit limits and balance-sheet constraints, while on-chain execution depends on gas fees, priority rules, and network congestion.
$ T+2 $
basis through CLS or correspondent banking networks, whereas blockchain transactions settle atomically within each block.Footnote
7 Trading frictions also differ, with FX execution shaped by credit limits and balance-sheet constraints, while on-chain execution depends on gas fees, priority rules, and network congestion.
B. Automated Market Making in Uniswap
Uniswap is a DEX implemented as an AMM, in which trading occurs against on-chain liquidity pools managed by smart contracts. Version 1 launched in 2018, followed by V2 in 2020 and V3 in 2021.Footnote 8 We use Uniswap V2 to introduce the basic pricing mechanism and Uniswap V3 to describe the concentrated-liquidity design used in the EURC/USDC market.
1. Uniswap V2 and the Bonding Curve
In Uniswap V2, each pool holds reserves of two tokens, EURC and USDC, denoted by $ x $
and
$ x $
and $ y $
, which satisfy the constant-product invariant
$ y $
, which satisfy the constant-product invariant
 $$ k=x\times y. $$
The marginal price of EURC in terms of USDC is $ {P}_{x/y}=y/x $
. Because reserves and transactions are public on-chain, price setting is deterministic and liquidity is continuously available as long as both tokens remain in the pool.
$ {P}_{x/y}=y/x $
. Because reserves and transactions are public on-chain, price setting is deterministic and liquidity is continuously available as long as both tokens remain in the pool.
Swaps move reserves along the bonding curve defined by (1). If a trader purchases $ \Delta x>0 $
EURC in exchange for USDC, post-trade reserves satisfy
$ \Delta x>0 $
EURC in exchange for USDC, post-trade reserves satisfy
 $$ {x}^{\prime }=x-\Delta x,\hskip1em {y}^{\prime }=\frac{k}{x^{\prime }},\hskip1em {P}_{x/y}^{\prime }=\frac{k}{{\left(x-\Delta x\right)}^2}. $$
Since $ {x}^{\prime }<x $
, the marginal price rises mechanically, generating slippage that increases with trade size. Liquidity mints instead scale up
$ {x}^{\prime }<x $
, the marginal price rises mechanically, generating slippage that increases with trade size. Liquidity mints instead scale up $ k $
and shift the bonding curve outward. To keep
$ k $
and shift the bonding curve outward. To keep $ {P}_{x/y} $
unchanged, LPs add both tokens in proportion to the prevailing price so that
$ {P}_{x/y} $
unchanged, LPs add both tokens in proportion to the prevailing price so that $ y/x $
remains constant. Burns reverse this process.
$ y/x $
remains constant. Burns reverse this process.
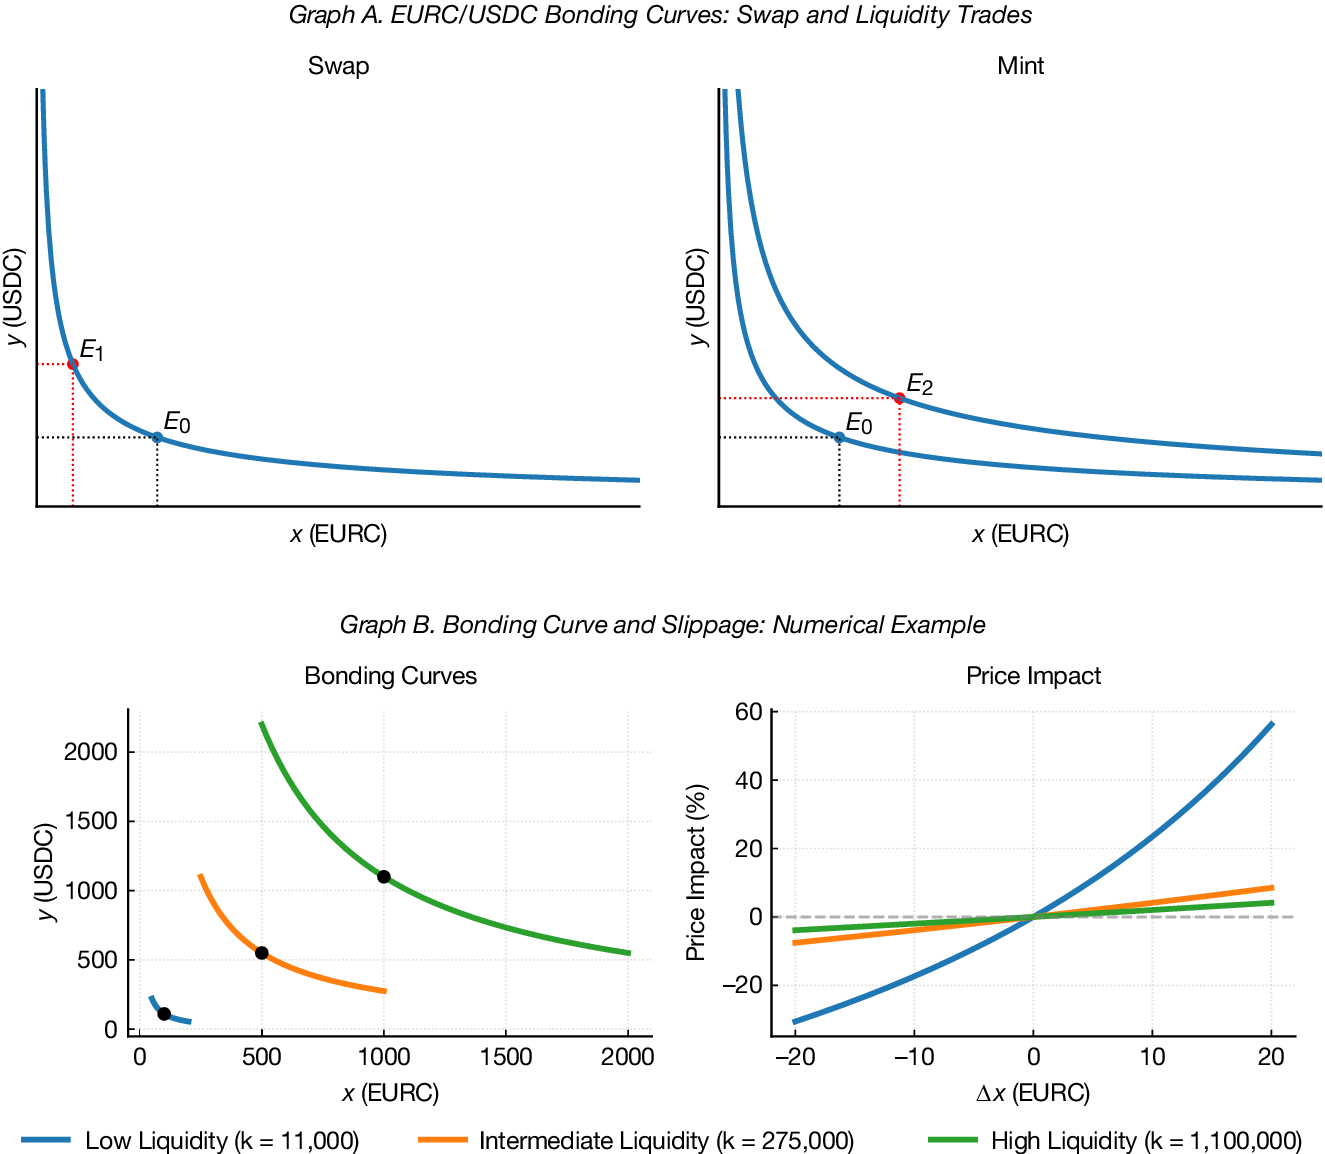
Figure 2 illustrates the relationship between swaps, liquidity provision, and price impact. Graph (a) provides a conceptual illustration in which swaps move the pool along a given bonding curve from $ {E}_0 $
to
$ {E}_0 $
to $ {E}_1 $
, while liquidity mints shift the curve outward by increasing available reserves at the prevailing price, moving the pool from
$ {E}_1 $
, while liquidity mints shift the curve outward by increasing available reserves at the prevailing price, moving the pool from $ {E}_0 $
to
$ {E}_0 $
to $ {E}_2 $
. Graph (b) then proceeds with a numerical example showing how price impact varies with pool depth for a given trade size.Footnote
9
$ {E}_2 $
. Graph (b) then proceeds with a numerical example showing how price impact varies with pool depth for a given trade size.Footnote
9
Graph A of Figure 2 illustrates bonding curves and liquidity provision in Uniswap. Starting from an initial equilibrium $ {E}_0 $
, a swap trade that purchases EURC moves the pool along the bonding curve to
$ {E}_0 $
, a swap trade that purchases EURC moves the pool along the bonding curve to $ {E}_1 $
, while an increase in liquidity at the prevailing price shifts the equilibrium from
$ {E}_1 $
, while an increase in liquidity at the prevailing price shifts the equilibrium from $ {E}_0 $
to
$ {E}_0 $
to $ {E}_2 $
. Graph B illustrates the relationship between pool size and price impact in a constant-product automated market maker for the EURC/USDC pair. The left subgraph shows bonding curves for different liquidity levels, while the right subgraph shows percentage price impact for trades of varying size (in EURC). Price impact is lower in more liquid pools, reflecting reduced slippage.
$ {E}_2 $
. Graph B illustrates the relationship between pool size and price impact in a constant-product automated market maker for the EURC/USDC pair. The left subgraph shows bonding curves for different liquidity levels, while the right subgraph shows percentage price impact for trades of varying size (in EURC). Price impact is lower in more liquid pools, reflecting reduced slippage.
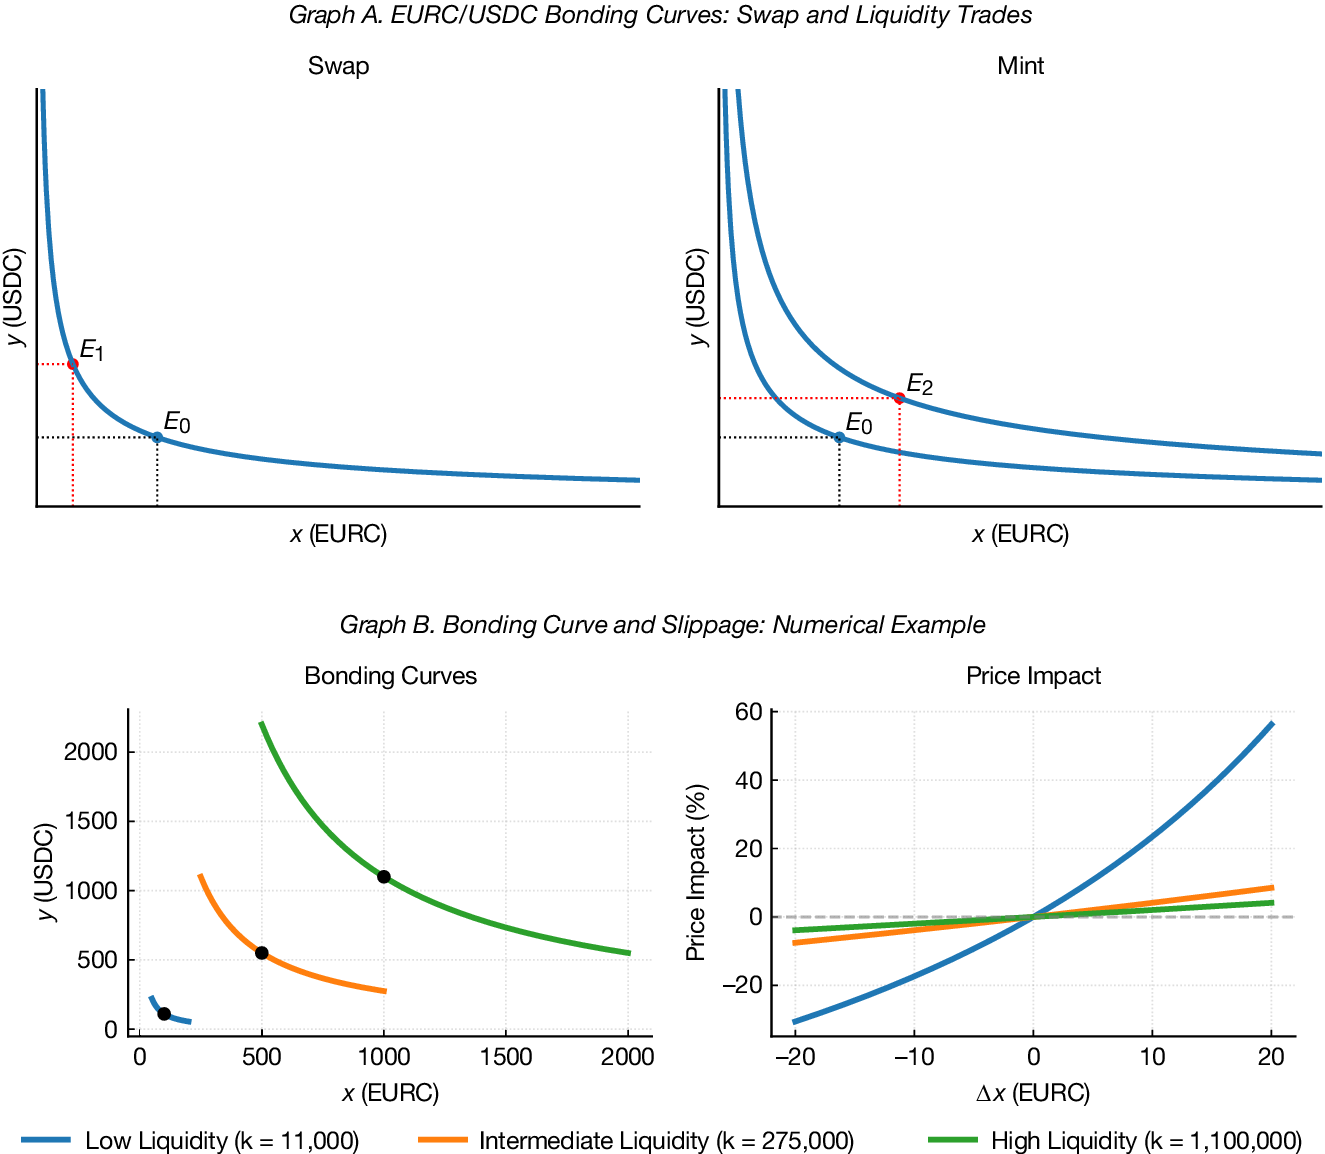
Each pool in Graph (b) starts at $ {P}_{x/y}=1.10 $
but differs in scale. For a low-liquidity pool with
$ {P}_{x/y}=1.10 $
but differs in scale. For a low-liquidity pool with $ \left(x,y\right)=\left(\mathrm{100,110}\right) $
, a purchase of
$ \left(x,y\right)=\left(\mathrm{100,110}\right) $
, a purchase of $ \Delta x=5 $
raises the price to
$ \Delta x=5 $
raises the price to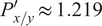 $ {P}_{x/y}^{\prime}\approx 1.219 $
, while the same trade yields
$ {P}_{x/y}^{\prime}\approx 1.219 $
, while the same trade yields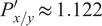 $ {P}_{x/y}^{\prime}\approx 1.122 $
and
$ {P}_{x/y}^{\prime}\approx 1.122 $
and $ 1.111 $
in medium- and high-liquidity pools, respectively.
$ 1.111 $
in medium- and high-liquidity pools, respectively.
More generally, the percentage price impact of a trade of size $ \Delta x $
is
$ \Delta x $
is
 $$ \mathrm{Price}\ \mathrm{Impact}\left(\%\right)=100\times \left[\frac{1}{{\left(1-\frac{\Delta x}{x}\right)}^2}-1\right], $$
which depends on trade size relative to pool depth, with larger pools exhibiting flatter curves and smaller price responses.
2. Uniswap V3 and Concentrated Liquidity
Uniswap V3 generalizes the constant-product design by allowing LPs to concentrate liquidity within a user-defined price range $ \left[{p}_a,{p}_b\right] $
rather than distributing it uniformly over
$ \left[{p}_a,{p}_b\right] $
rather than distributing it uniformly over $ \left[0,\infty \right) $
. This improves capital efficiency by ensuring that liquidity is active only when the market price lies within the specified range. V3 also introduces multiple fee tiers (0.01%, 0.05%, 0.3%, and 1%) that segment liquidity across pools and allow LPs to choose different risk–return profiles.Footnote
10
$ \left[0,\infty \right) $
. This improves capital efficiency by ensuring that liquidity is active only when the market price lies within the specified range. V3 also introduces multiple fee tiers (0.01%, 0.05%, 0.3%, and 1%) that segment liquidity across pools and allow LPs to choose different risk–return profiles.Footnote
10
Within any active range, trades are priced using virtual reserves that satisfyFootnote 11
 $$ \left(x+\frac{L}{\sqrt{p_b}}\right)\left(y+L\sqrt{p_a}\right)={L}^2, $$
where $ L $
is the liquidity parameter governing effective depth within the active range. A higher
$ L $
is the liquidity parameter governing effective depth within the active range. A higher $ L $
implies deeper liquidity and smaller price impact. When the range expands to
$ L $
implies deeper liquidity and smaller price impact. When the range expands to $ \left[0,\infty \right) $
, (4) reduces to
$ \left[0,\infty \right) $
, (4) reduces to $ x\times y={L}^2 $
, so
$ x\times y={L}^2 $
, so $ L $
coincides with the Uniswap V2 constant-product parameter.
$ L $
coincides with the Uniswap V2 constant-product parameter.
3. Tick-Based Pricing and Liquidity Distribution
V3 discretizes prices into ticks indexed by $ i\in \mathrm{\mathbb{Z}} $
, where
$ i\in \mathrm{\mathbb{Z}} $
, where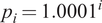 $ {p}_i={1.0001}^i $
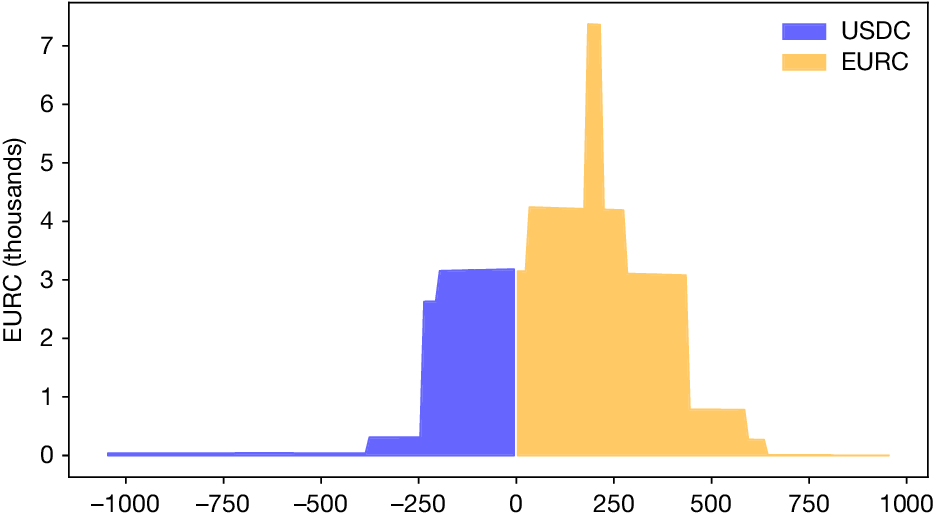
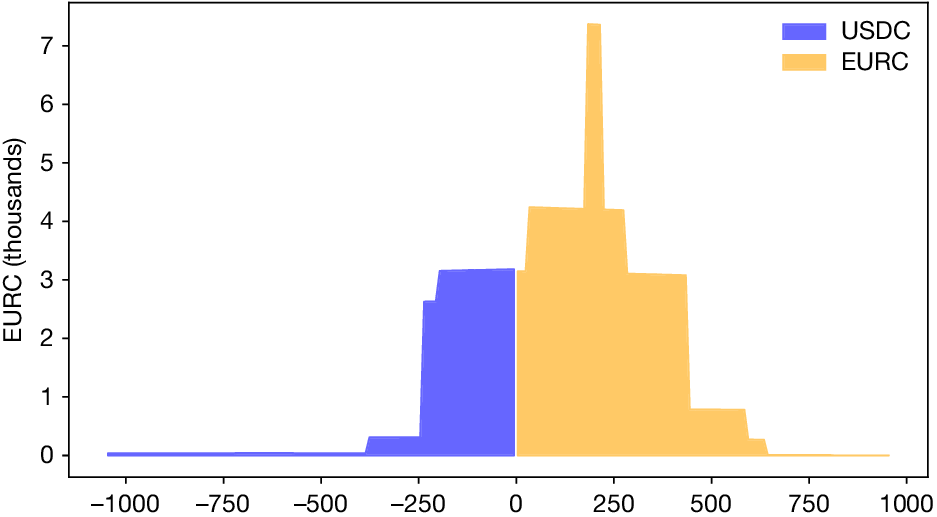
. Tick spacing determines which ticks can host liquidity. In the EURC/USDC 0.05% pool, tick spacing is 10, so liquidity is allocated in 10-tick intervals. Figure 3 plots tick-level liquidity for this pool at block 19,771,559 (Apr. 30, 2024). Liquidity is concentrated near the market price and tapers toward the tails, resembling a tokenized limit order book. Further details on liquidity aggregation and price setting are provided in Sections B.1 and B.2 of the Supplementary Material.
$ {p}_i={1.0001}^i $
. Tick spacing determines which ticks can host liquidity. In the EURC/USDC 0.05% pool, tick spacing is 10, so liquidity is allocated in 10-tick intervals. Figure 3 plots tick-level liquidity for this pool at block 19,771,559 (Apr. 30, 2024). Liquidity is concentrated near the market price and tapers toward the tails, resembling a tokenized limit order book. Further details on liquidity aggregation and price setting are provided in Sections B.1 and B.2 of the Supplementary Material.
Figure 3 shows the tick-level distribution of liquidity around the prevailing pool price for the EURC/USDC 0.05% Uniswap V3 pool. The horizontal axis reports tick distance from the current market price (tick 0), where each tick corresponds to a discrete price interval in log base $ \sqrt{1.0001} $
. The pool has a fixed tick spacing of 10, implying price intervals of approximately 10 basis points. Ticks to the left of zero represent liquidity below the current price and correspond to buy limit orders for EURC, while ticks to the right represent liquidity above the current price and correspond to sell limit orders for EURC. Liquidity at each tick is expressed in 1000 of EURC.
$ \sqrt{1.0001} $
. The pool has a fixed tick spacing of 10, implying price intervals of approximately 10 basis points. Ticks to the left of zero represent liquidity below the current price and correspond to buy limit orders for EURC, while ticks to the right represent liquidity above the current price and correspond to sell limit orders for EURC. Liquidity at each tick is expressed in 1000 of EURC.
C. Data
1. CLS EUR/USD Benchmark and Uniswap EURC/USDC Price
We source a benchmark EUR/USD rate from CLS, which provides a volume-weighted average price of interbank quotes at 5-min intervals. We aggregate these data to hourly and daily frequency. EURC/USDC prices are constructed as the last transaction price at each UTC hour (and day) from the Uniswap V3 EURC/USDC pool, obtained via the Subgraph API.Footnote 12
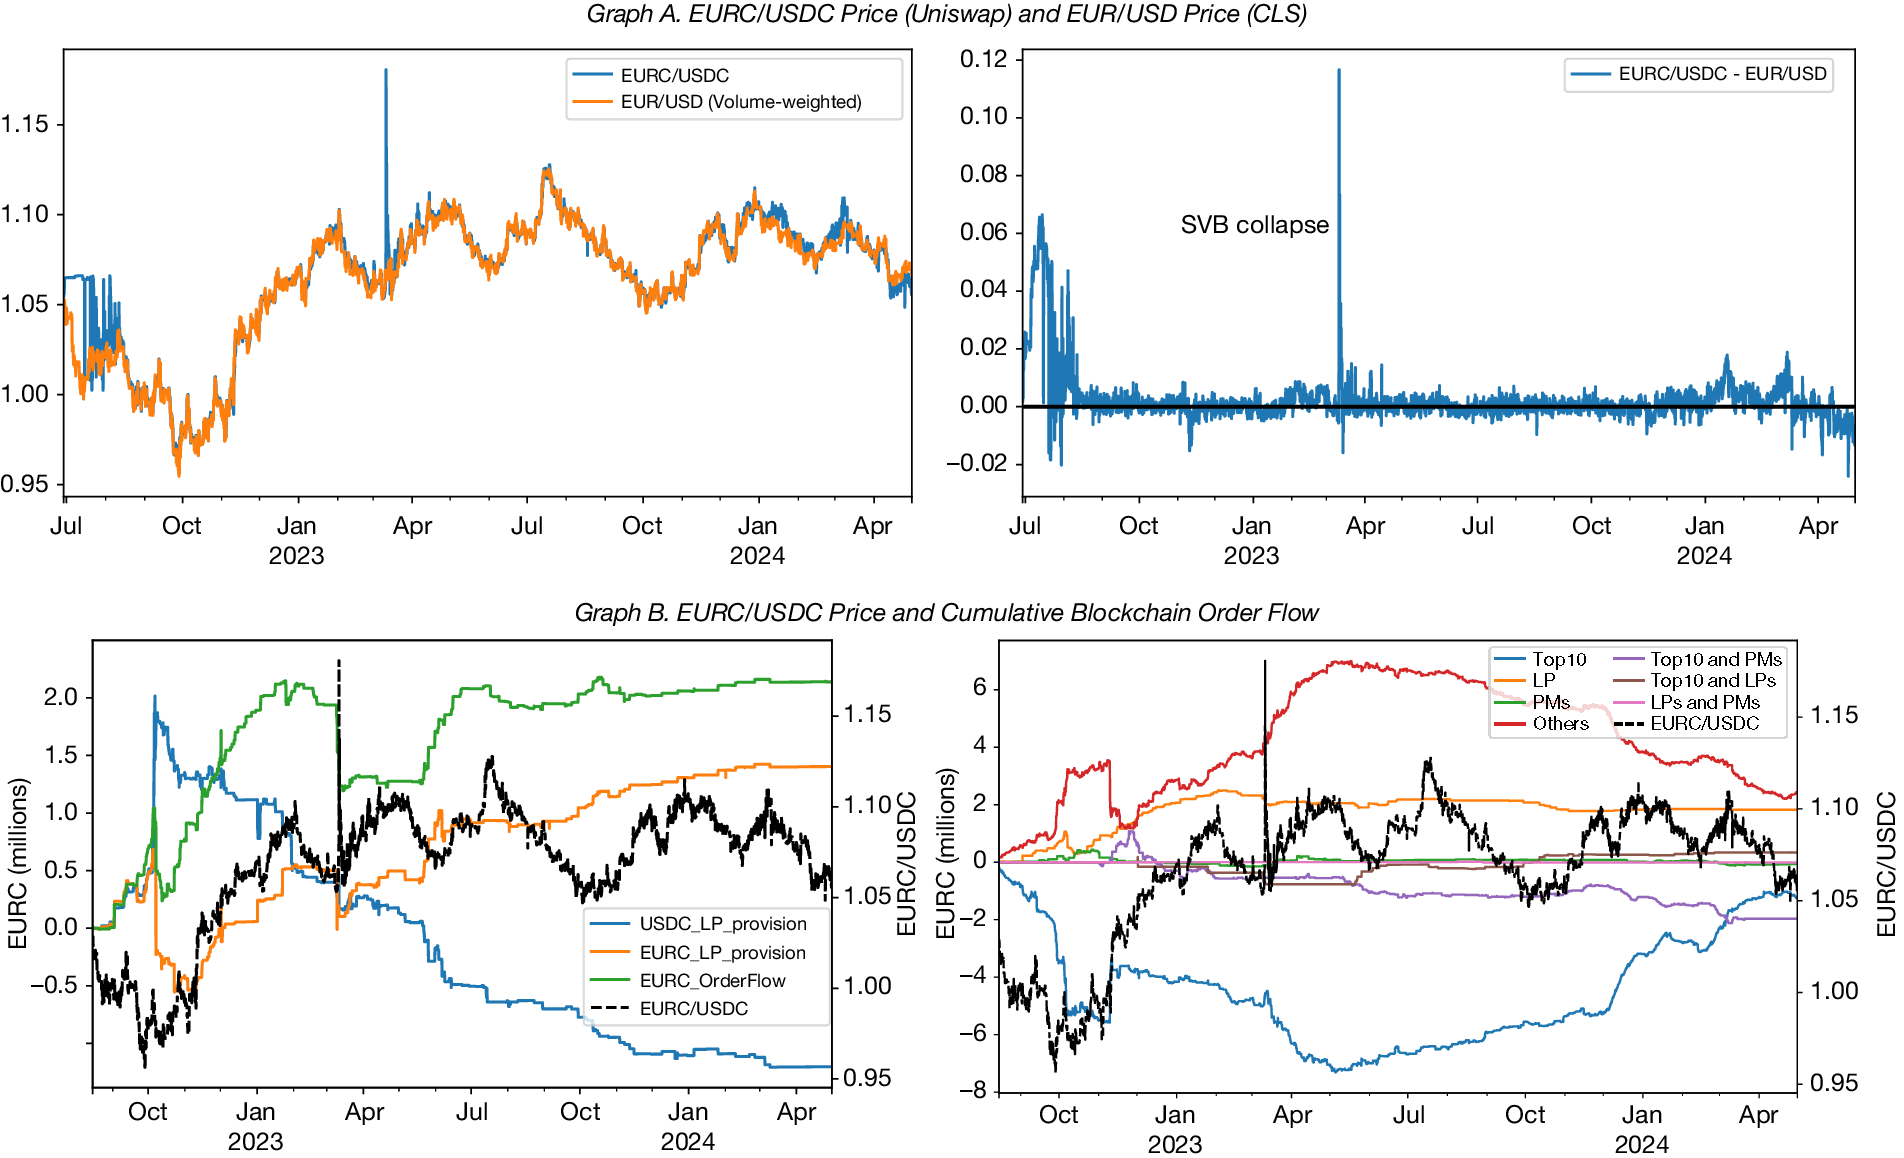
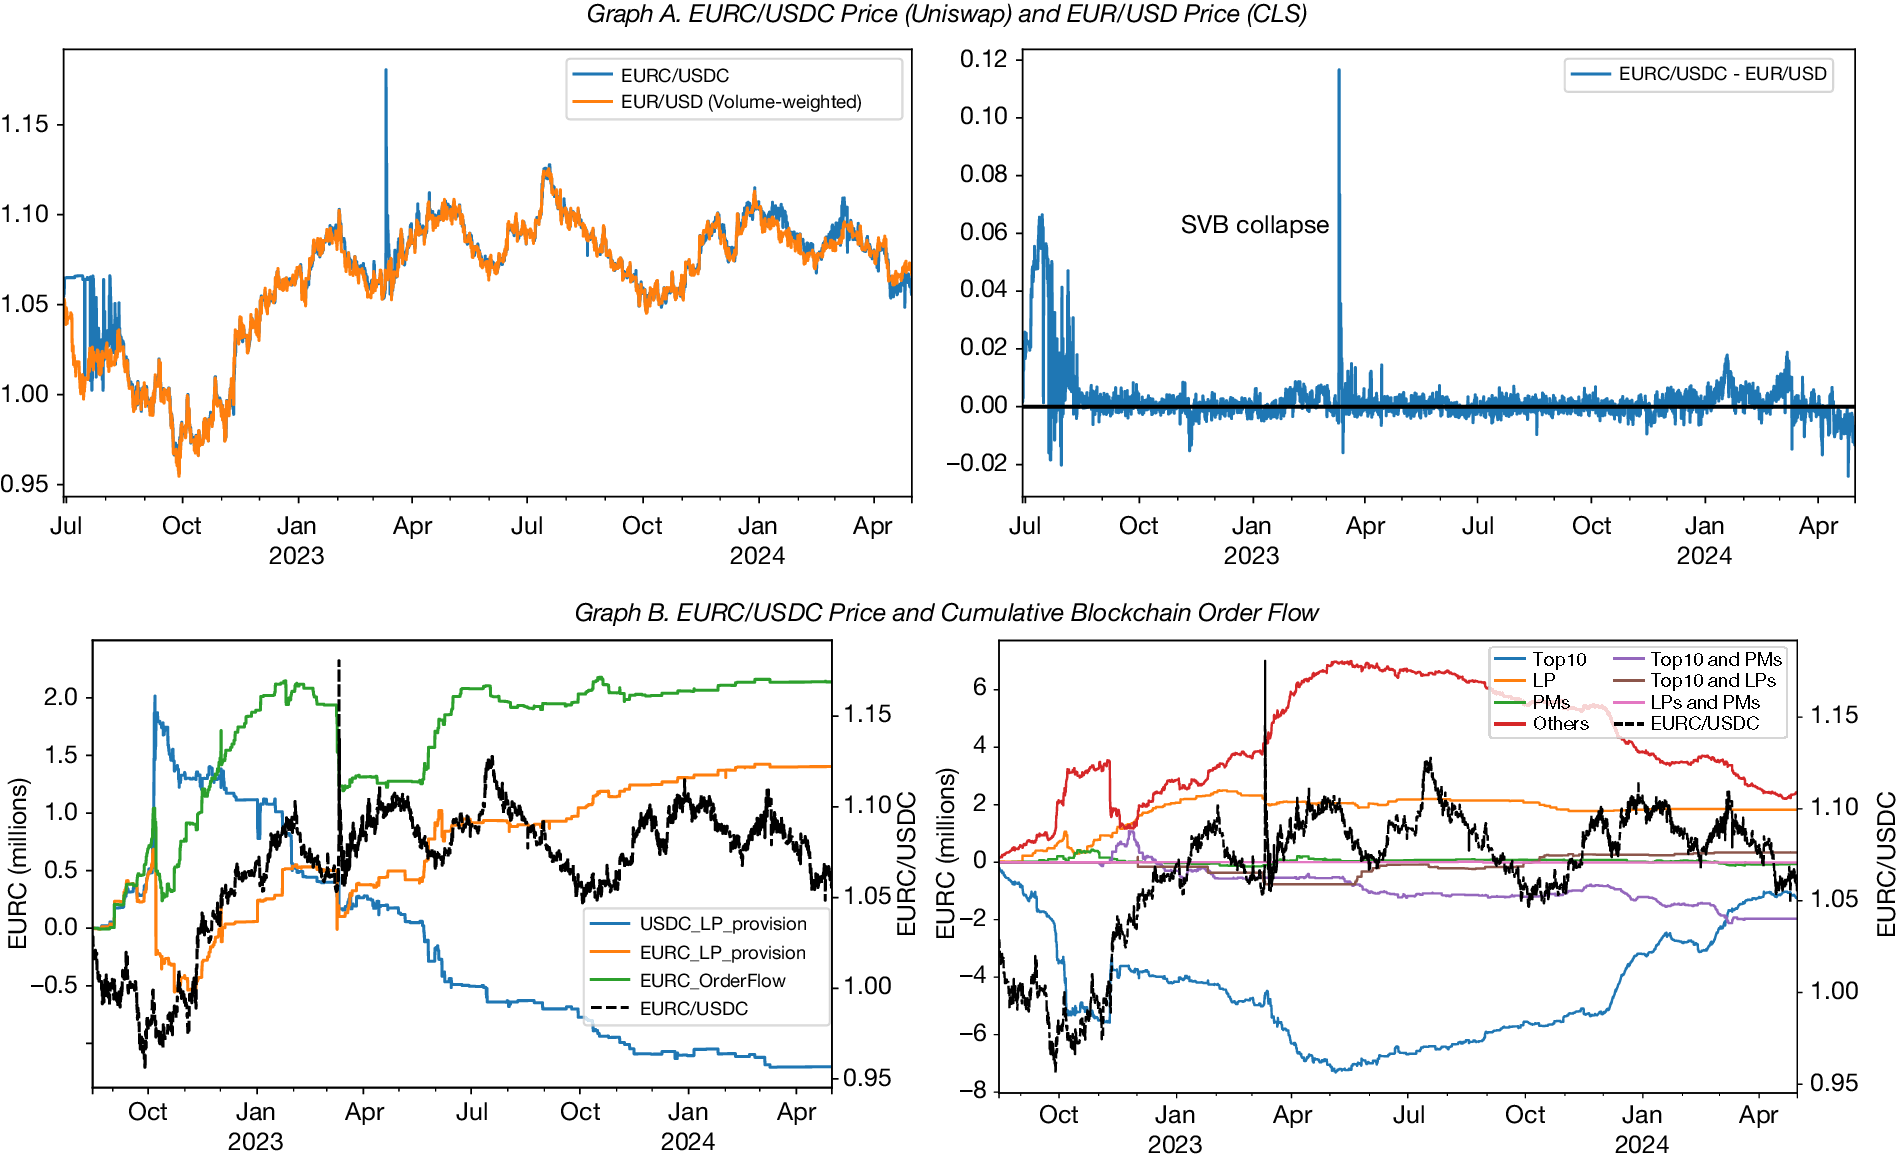
Graph A of Figure 4 compares EURC/USDC and EUR/USD prices and plots their difference. Consistent with Adams et al. (Reference Adams, Lader, Liao, Puth and Wan2023), the DEX rate tracks the benchmark closely, with an average absolute deviation of 24 basis points. Deviations are larger early in the sample when liquidity is low, so our empirical analysis begins on Aug. 15, 2022. A major episode is the March 2023 USDC de-pegging following concerns about reserve exposure to SVB; during Mar. 11–12, 2023, EURC/USDC traded at a relative premium versus EUR/USD.
Figure 4 plots EURC/USDC and EUR/USD prices at the hourly frequency. EURC/USDC prices are sourced from Uniswap V3, and EUR/USD prices are sourced from CLS. Graph A shows the EURC/USDC price, the benchmark EUR/USD price, and their cross-market price difference. Graph B reports cumulative blockchain order flow and prices in the EURC/USDC market. The left subgraph shows aggregate order flow, prices, and liquidity provision in EURC and USDC, while the right subgraph disaggregates cumulative order flow by trader group, including sophisticated traders (Top 10 wallets), primary dealers (PM), liquidity providers (LPs), their intersections, and all remaining traders. The sample period for Graph A is from June 28, 2022 to Apr. 30, 2024, and for Graph B is from Aug. 15, 2022 to Apr. 30, 2024.
2. DEX Trading Volume and Liquidity Provision
Our Uniswap V3 data set contains the complete history of swap transactions in the EURC/USDC market. Each swap is recorded at the wallet level, where a wallet corresponds to an Ethereum address controlling the associated tokens.Footnote 13 We complement swap data with proprietary Kaiko data on liquidity provision, which record mint and burn transactions by LPs, including the quantities of EURC and USDC added or removed and the price ranges over which liquidity is allocated.Footnote 14
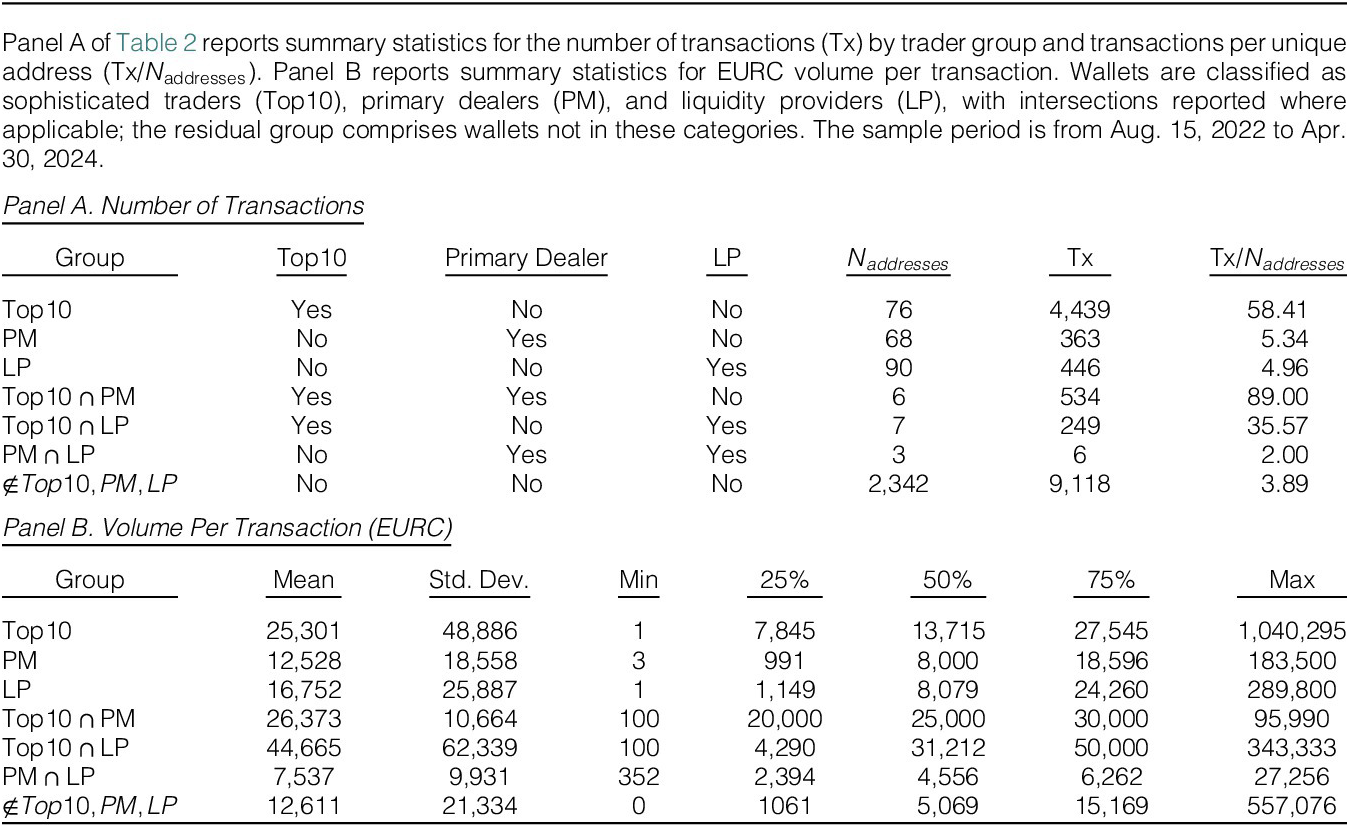
Using wallet histories, we classify market participants into three base groups reflecting trading activity and access to issuance and liquidity provision. Sophisticated traders are defined as the top 10 wallet addresses by trading volume in each month, consistent with the microstructure view that large trades are more likely to reflect informed or institutional participation (Barber, Odean, and Zhu (Reference Barber, Odean and Zhu2008), Easley and O’Hara (Reference Easley and O’Hara1987)). These addresses account for an average of 52% of total trading volume between Aug. 15, 2022 and Apr. 30, 2024. Primary dealers are wallets that transact directly with the EURC or USDC treasury, minting stablecoins by depositing fiat and redeeming them at par.Footnote 15 LPs are wallets that supply or withdraw liquidity by minting and burning positions in the EURC/USDC pool. Each of the latter two groups accounts for approximately 7% of aggregate trading volume.
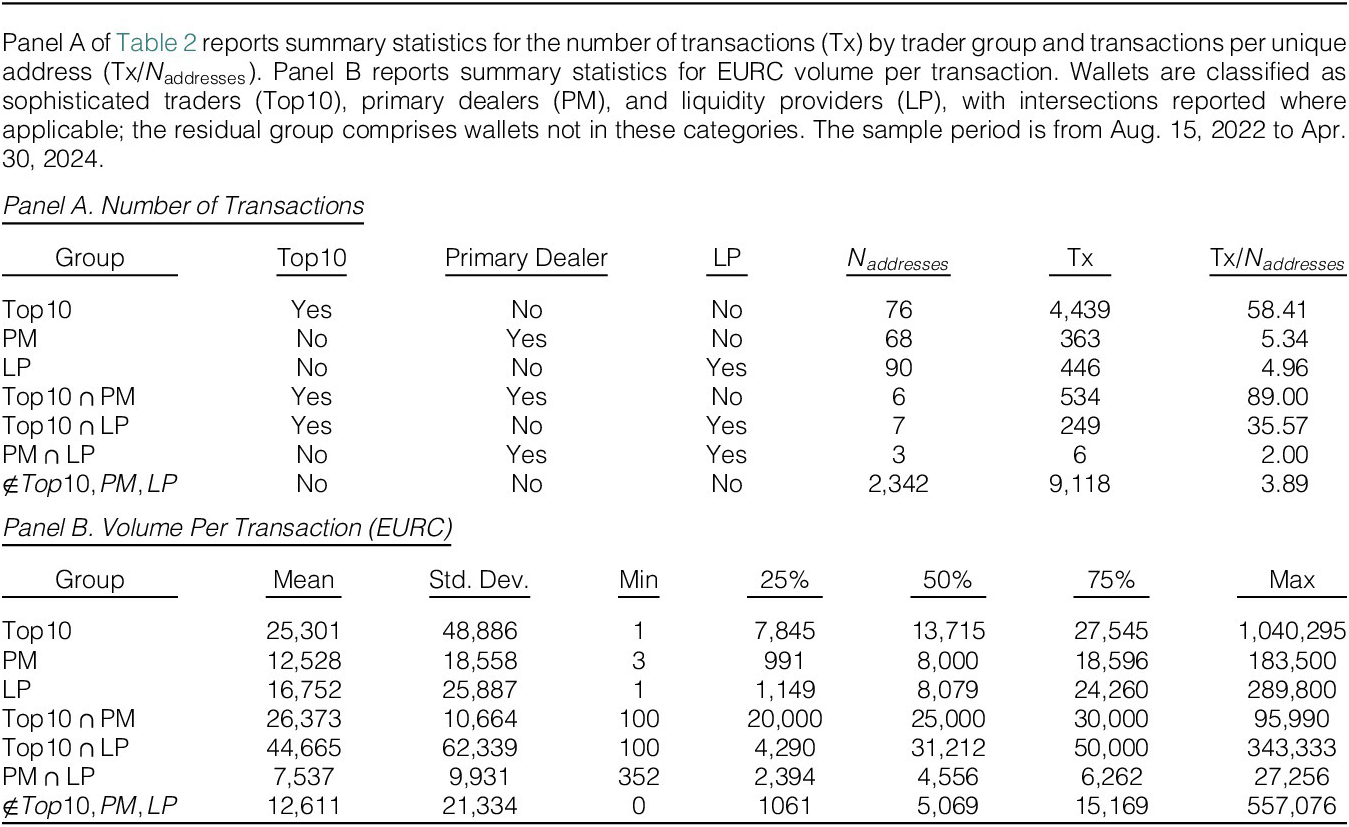
Table 2 reports summary statistics for seven trader groups. These consist of the three base groups, their pairwise intersections, and a residual category. The base groups contain 76 sophisticated traders, 68 primary dealers, and 90 LP addresses. Six addresses are classified as Top 10 $ \cap $
primary dealers, seven as Top 10
$ \cap $
primary dealers, seven as Top 10 $ \cap $
LPs, and three as primary dealer
$ \cap $
LPs, and three as primary dealer $ \cap $
LPs.Footnote
16 The remaining 2342 addresses form the residual category. Additional details on wallet characteristics and trading and liquidity provision behavior are provided in Section C of the Supplementary Material.
$ \cap $
LPs.Footnote
16 The remaining 2342 addresses form the residual category. Additional details on wallet characteristics and trading and liquidity provision behavior are provided in Section C of the Supplementary Material.
Blockchain order flow. We construct signed order flow as net buyer-initiated EURC volume. Each swap reports amount0 (EURC) and amount1 (USDC) from the pool’s perspective. Since EURC is the base currency, amount0 < 0 indicates a buyer-initiated EURC trade, while amount0 > 0 indicates a sale of EURC to the pool. For interval $ t $
,
$ t $
,
 $$ {OF}_t=\sum \limits_{k\in \mathcal{K}(t)}\left(\unicode{x1D7D9}\;\left[{T}_k=B\right]-\unicode{x1D7D9}\left[{T}_k=S\right]\right)\times {V}_k, $$
where $ \mathcal{K}(t) $
indexes swaps in
$ \mathcal{K}(t) $
indexes swaps in $ t $
,
$ t $
, $ {T}_k $
indicates buyer or seller initiation for EURC, and
$ {T}_k $
indicates buyer or seller initiation for EURC, and $ {V}_k $
denotes EURC-equivalent trade size.
$ {V}_k $
denotes EURC-equivalent trade size.
Graph B of Figure 4 plots cumulative order flow alongside prices, showing positive comovement. Disaggregating by trader group reveals that Top 10 traders often take the opposite side of LPs and residual wallets. This pattern is consistent with an asymmetric-information interpretation in which sophisticated traders exploit short-lived mispricing, while LPs and residual wallets supply liquidity on the other side, a channel we test formally in Section IV.
Turning to LPs, their net EURC purchases during periods of EUR appreciation reflect inventory rebalancing rather than informed trading. As swap traders buy EURC from the pool, LP inventories become increasingly tilted toward USDC. LPs respond by withdrawing liquidity from stale price ranges, acquiring EURC through swaps, and re-minting liquidity at updated price bounds. This behavior is documented at the transaction level in Section C.3.3 of the Supplementary Material and is consistent with LPs passively absorbing order flow and rebalancing inventories, in a manner analogous to inventory management by traditional FX dealers (Bjønnes and Rime (Reference Bjønnes and Rime2005), Lyons (Reference Lyons1995)).
Liquidity measurement. To characterize the supply-side response to trading activity, we measure net liquidity using Uniswap V3 mint and burn events following Klein, Kozhan, Viswanath-Natraj, and Wang (Reference Klein, Kozhan, Viswanath-Natraj and Wang2024). These events record additions and withdrawals of liquidity over price intervals $ \left[{P}_a,{P}_b\right] $
at the block level. For each block
$ \left[{P}_a,{P}_b\right] $
at the block level. For each block $ k $
,
$ k $
,
 $$ {\displaystyle \begin{array}{c}{mint}_{(k)}^{net}={mint}_{(k)}^{ask}-{mint}_{(k)}^{bid},\\ {}{burn}_{(k)}^{net}={burn}_{(k)}^{ask}-{burn}_{(k)}^{bid},\\ {}{Liquidity}_{(k)}^{net}={mint}_{(k)}^{net}-{burn}_{(k)}^{net}.\end{array}} $$
A positive $ {Liquidity}_{(k)}^{net} $
indicates that more ask-side (EURC-side) liquidity is added than withdrawn in block
$ {Liquidity}_{(k)}^{net} $
indicates that more ask-side (EURC-side) liquidity is added than withdrawn in block $ k $
. To distinguish between active and passive liquidity provision, we classify positions within
$ k $
. To distinguish between active and passive liquidity provision, we classify positions within $ \pm 1\% $
of the mid-price as best liquidity and positions outside this range as away. We aggregate block-level liquidity measures to the hourly frequency to align them with order flow and returns. Section B.3 of the Supplementary Material provides full construction details.
$ \pm 1\% $
of the mid-price as best liquidity and positions outside this range as away. We aggregate block-level liquidity measures to the hourly frequency to align them with order flow and returns. Section B.3 of the Supplementary Material provides full construction details.
3. Additional Data
CLS volume. To study traditional-market activity, we use the CLS FX Spot Flow data set, which settles around 40% of global FX volume across spot, swaps, and forwards and covers 18 currencies.Footnote 17 The data provide hourly buy and sell volumes between banks and three categories of price takers (funds, nonbank financials, corporates) and are widely used in FX microstructure research (Huang et al. (Reference Huang, O’Neill, Ranaldo and Yu2023), Kloks, Mattille, and Ranaldo (Reference Kloks, Mattille and Ranaldo2023), and Ranaldo and Somogyi (Reference Ranaldo and Somogyi2021)). We construct sector-level volumes for interbank, bank–funds, bank–nonbank financials, and bank–corporates, with interbank volume obtained by subtracting bilateral bank–client flows from the aggregate series.
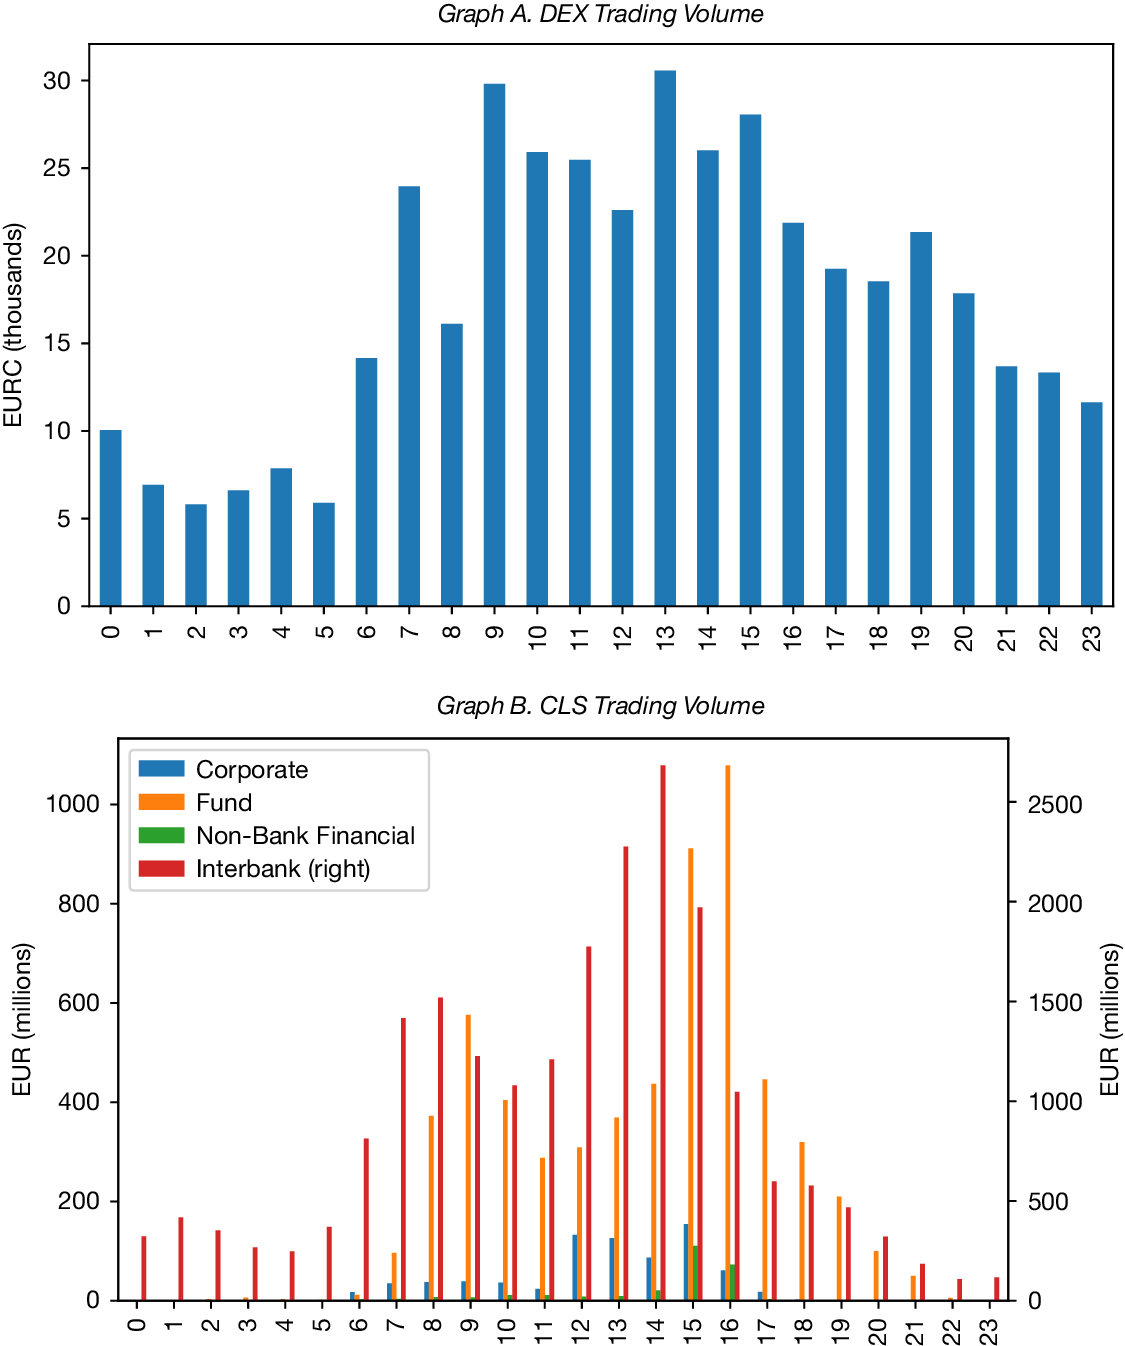
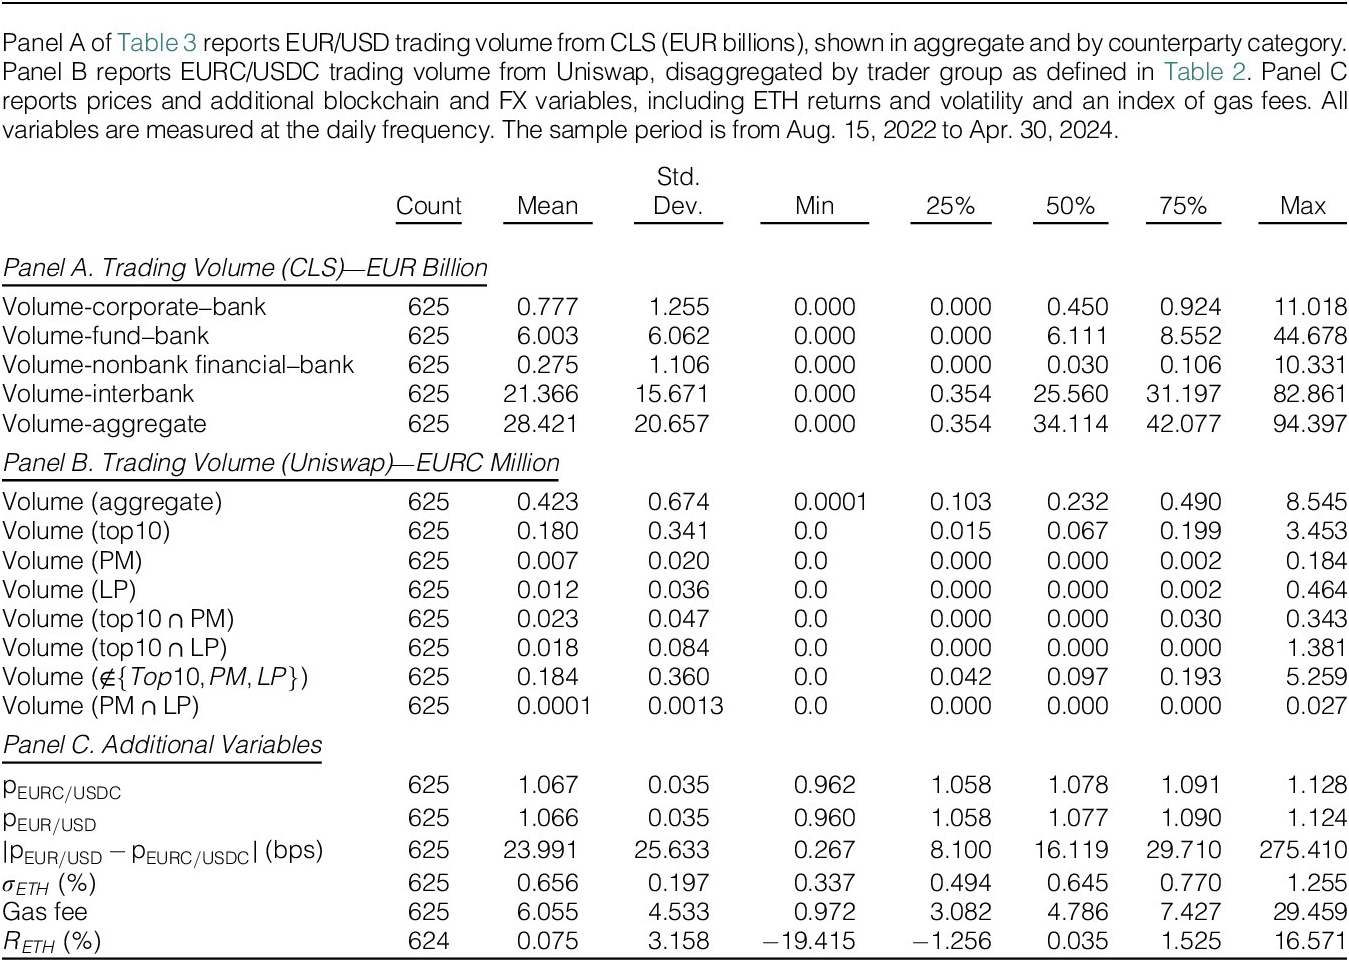
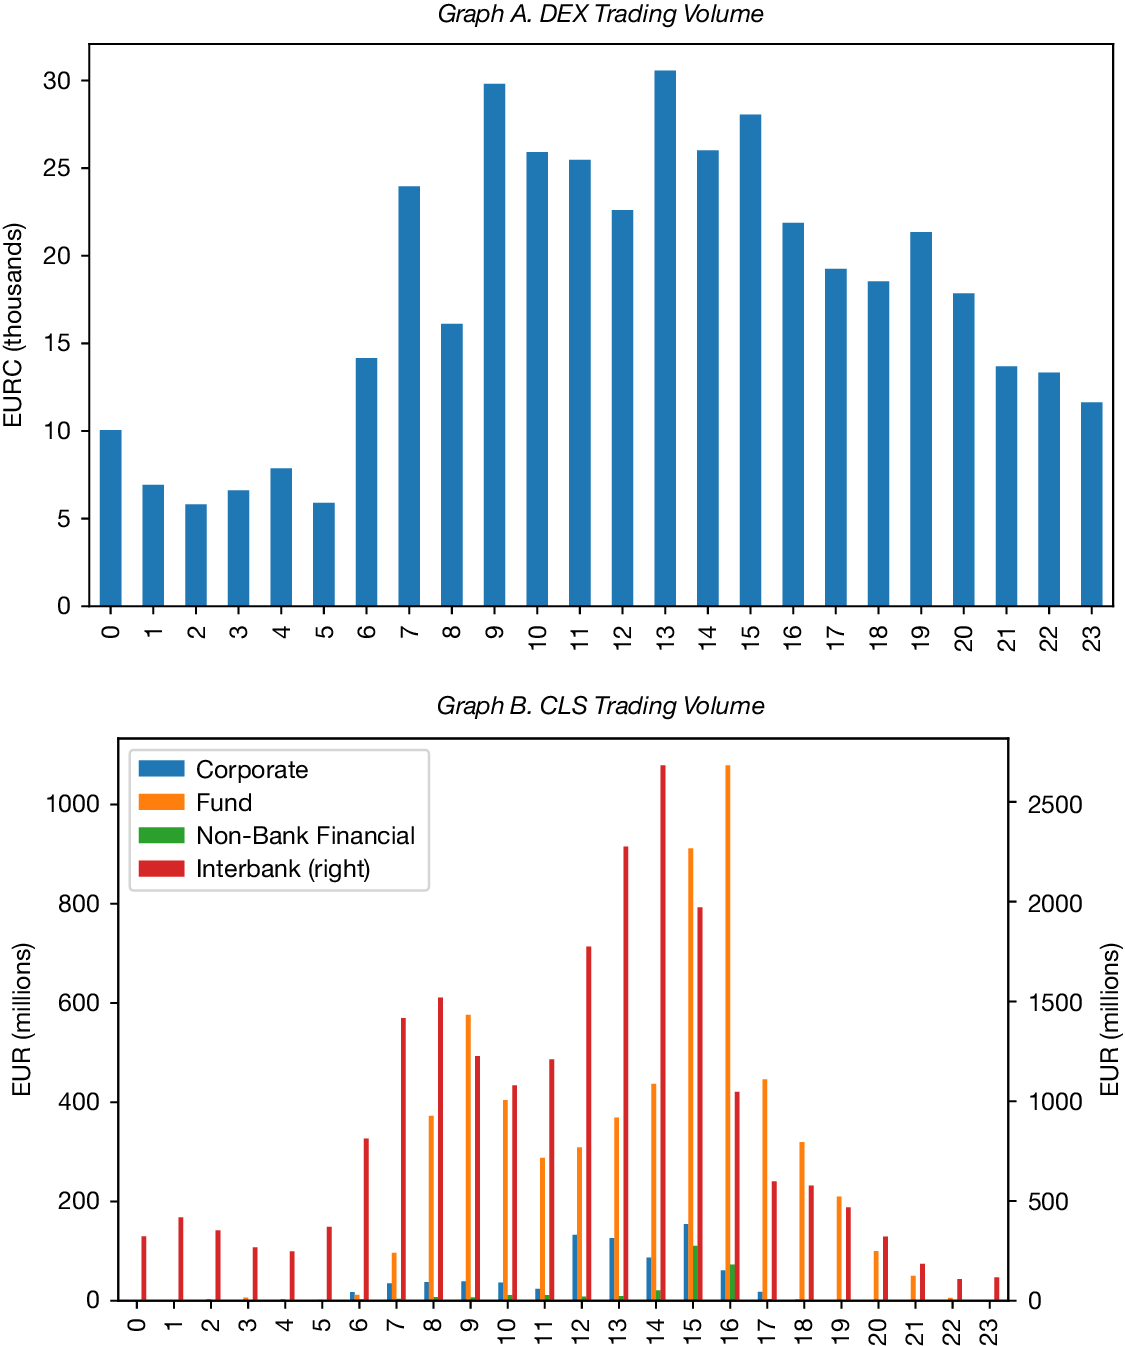
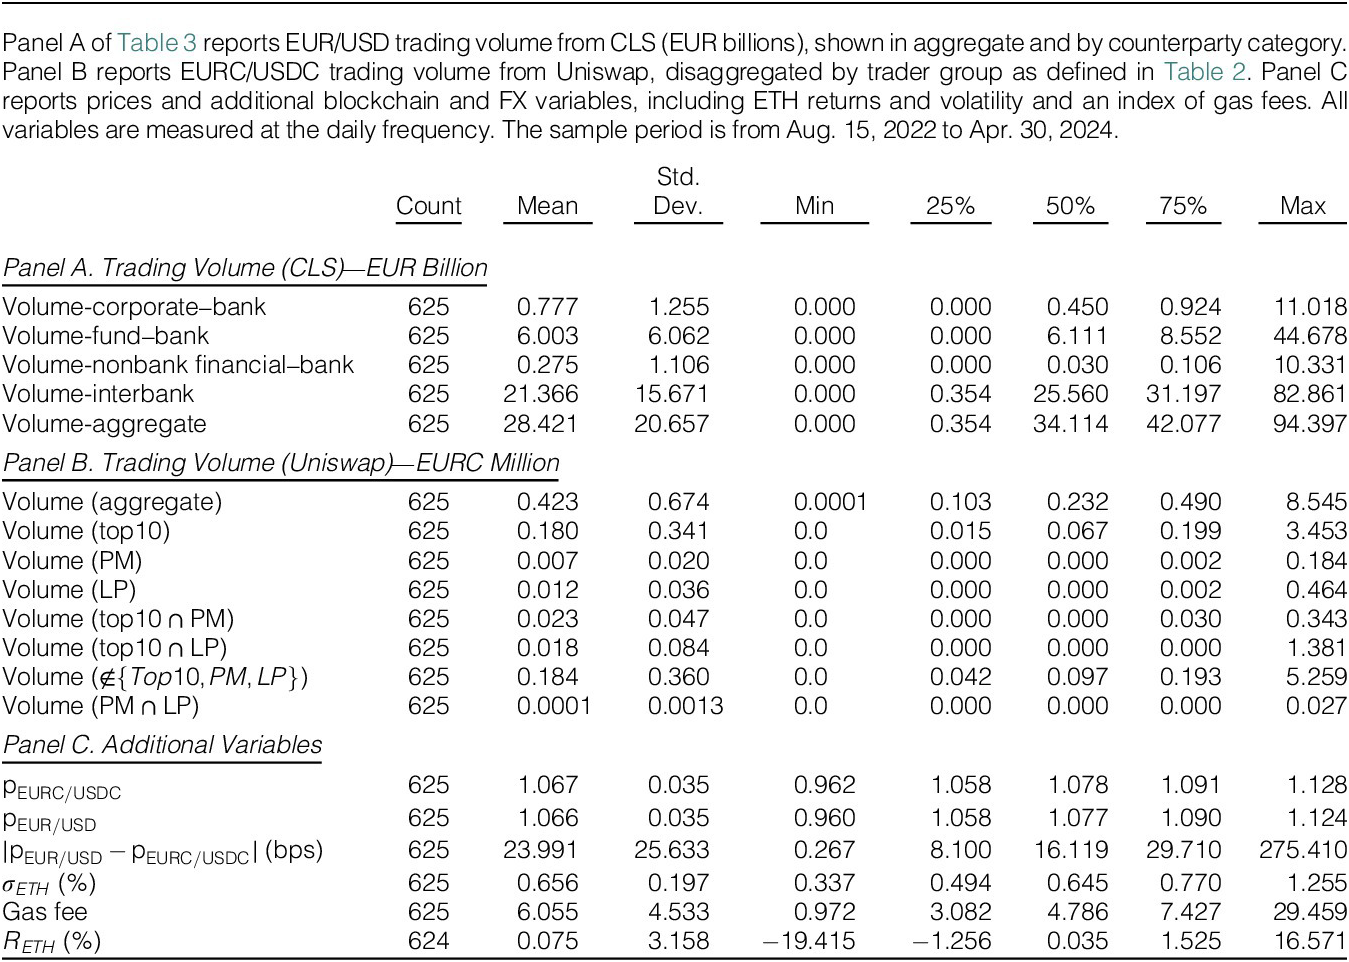
Figure 5 compares hourly Uniswap EURC/USDC activity with EUR/USD CLS volumes by sector. Traditional trading is concentrated between 13:00 and 16:00 UTC and is driven mainly by interbank and fund–bank flows, coinciding with the overlap of London, Frankfurt, and New York trading hours and the 16:00 UTC WMR fix (Krohn, Mueller, and Whelan (Reference Krohn, Mueller and Whelan2024)). Blockchain trading occurs throughout the day, with peaks in the afternoon and around 09:00 UTC, consistent with 24/7 trading and retail participation. Average daily CLS volume is 28.42 billion EUR, compared to 0.423 million EURC on Uniswap, or about 0.0015% (0.15 bps) of total EUR/USD trading. Additional summary statistics and intraday liquidity patterns are reported in Section C.3.2 of the Supplementary Material and Table 3.
Figure 5 plots trading volume at the hourly frequency. Graph A reports trading volume on Uniswap V3 for the EURC/USDC market, expressed in 1000 of EURC. Graph B reports trading volume on CLS for the EUR/USD market, disaggregated by counterparty sector (bank–bank, bank–fund, bank–corporate, and nonbank financial–bank) and expressed in EUR millions. The sample period is from Aug. 15, 2022 to Apr. 30, 2024.
Transaction costs and volatility. Gas fees compensate Ethereum validators for confirming transactions. We retrieve transaction-level gas fees for each swap from Etherscan (in ETH, converted to USDC) and use them to compute arbitrage bounds and trader-level transaction costs.Footnote 18 To capture market-wide conditions, we use the EthVol index from T3 Index as a measure of expected 30-day implied volatility for Ether and a daily gas-fee index from CoinMetrics to study price efficiency at the daily frequency.Footnote 19
Intermediary constraints. We use two measures of intermediary constraints. The first is the intermediary capital risk factor (ICRF) from He, Kelly, and Manela (Reference He, Kelly and Manela2017), defined as AR(1) innovations to the market-based capital ratio of U.S. primary dealers. The second follows Huang et al. (Reference Huang, Ranaldo, Schrimpf and Somogyi2025) and captures violations of the law of one price (VLOOP) in G10 FX markets, constructed from minute-level LSEG quotes on EUR/USD, USD/X, and EUR/X cross rates.Footnote 20 The first principal component of standardized VLOOP series explains about 46% of total variation and captures global inter-dealer pricing distortions. Summary statistics are reported in Table 3.
III. Stylized Facts on Blockchain Prices, Volumes, and Costs
A. Price and Volume Connection
Fact #1: DEX Prices and Volumes Are Closely Connected to Traditional FX Markets
We begin by documenting how decentralized markets comove with traditional FX benchmarks in both prices and quantities. Our baseline measure of price alignment is the absolute deviation between EURC/USDC and the CLS EUR/USD benchmark,
 $$ {\Delta}_t=\left|{p}_{\mathrm{EUR}\mathrm{C}/\mathrm{USD}\mathrm{C},t}-{p}_{\mathrm{EUR}/\mathrm{USD},t}\right|. $$
The average deviation is 24 basis points, with a median of 16 basis points, and exceeds 200 basis points only during the March 2023 USDC de-pegging episode. These moments indicate that decentralized prices generally track the benchmark closely, although short-lived dislocations arise under stress.
Trading volumes on decentralized and traditional venues also display a strong connection. DEX activity follows the intraday pattern of CLS volumes, with a clear peak between 13:00 and 16:00 UTC when European and U.S. markets overlap. Using CLS volumes disaggregated into interbank, nonbank financial, and corporate sectors, and comparing them to DEX activity across sophisticated traders, primary dealers, and LPs, we find that decentralized trading mirrors the pattern of the interbank segment, which the literature identifies as the most informed part of the FX market (Huang et al. (Reference Huang, O’Neill, Ranaldo and Yu2023), Ranaldo and Somogyi (Reference Ranaldo and Somogyi2021)). Section D.1 of the Supplementary Material reports the full set of volume correlations across participant groups and trading hours, confirming that correlations are strongest with the interbank segment and during the core trading window when New York, London, and Frankfurt are open.
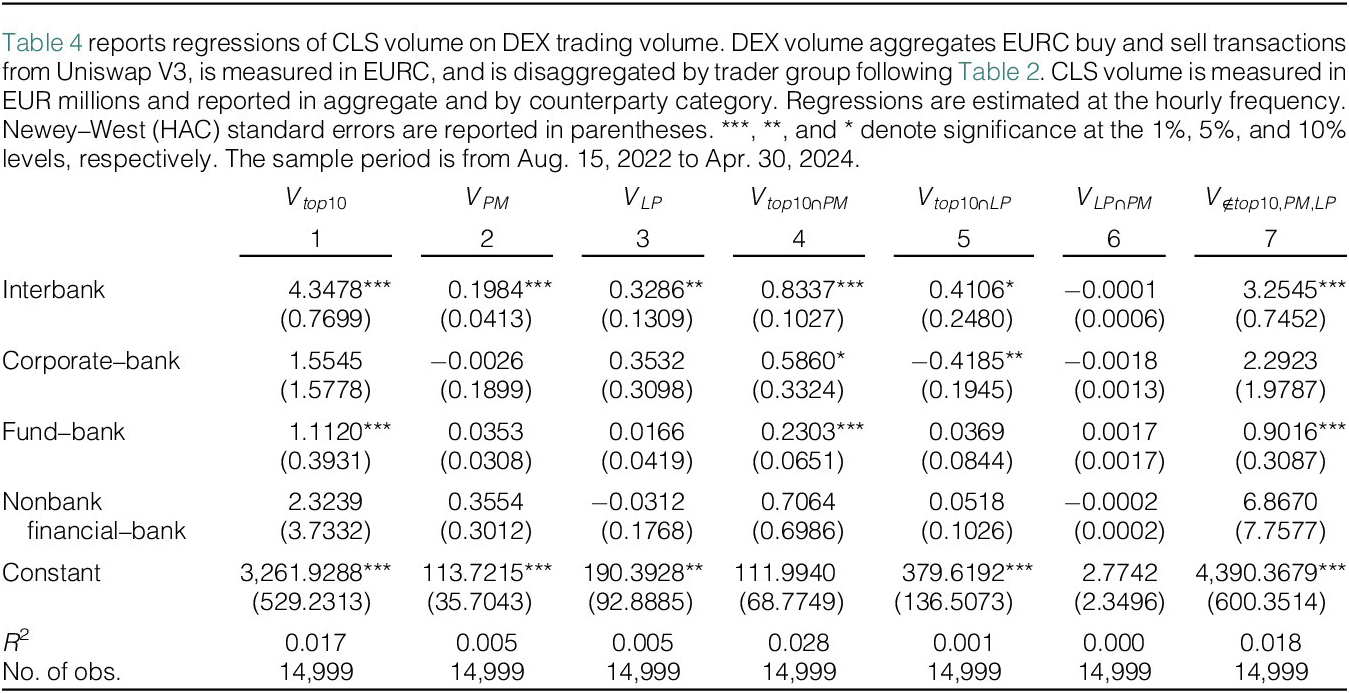
Formally, we estimate the relationship between decentralized and traditional FX volumes at the hourly frequency,
 $$ {V}_{N_{DEX},t}=\alpha +\sum \limits_{i\in {N}_{CLS}}{\beta}_i{V}_{N_{CLS},t}+{\varepsilon}_t, $$
where $ {V}_{N_{DEX},t} $
denotes DEX trading volume by participant type, measured in EURC, and
$ {V}_{N_{DEX},t} $
denotes DEX trading volume by participant type, measured in EURC, and $ {V}_{N_{CLS},t} $
denotes CLS sector-level trading volume, measured in EUR millions. Table 4 shows that interbank trading is most strongly associated with DEX activity. For sophisticated traders, a €1 million increase in interbank CLS volume is associated with approximately 4.35 units of EURC trading on DEXs.
$ {V}_{N_{CLS},t} $
denotes CLS sector-level trading volume, measured in EUR millions. Table 4 shows that interbank trading is most strongly associated with DEX activity. For sophisticated traders, a €1 million increase in interbank CLS volume is associated with approximately 4.35 units of EURC trading on DEXs.
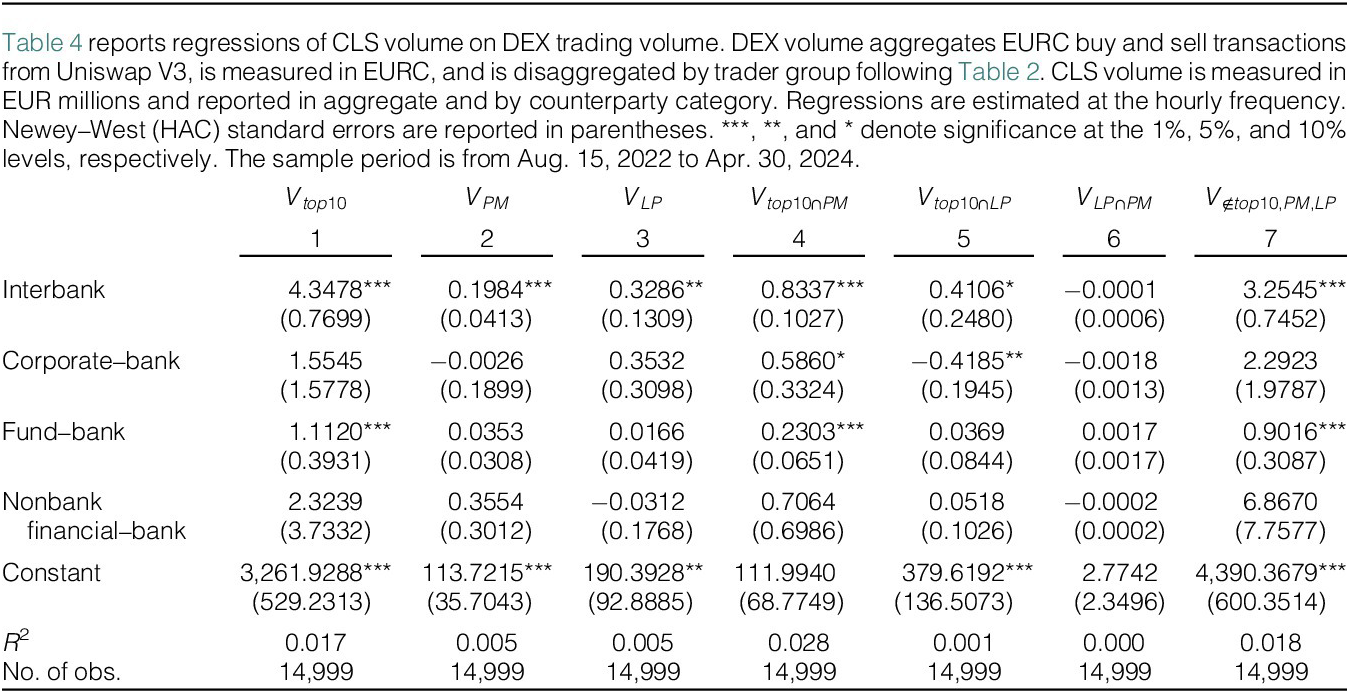
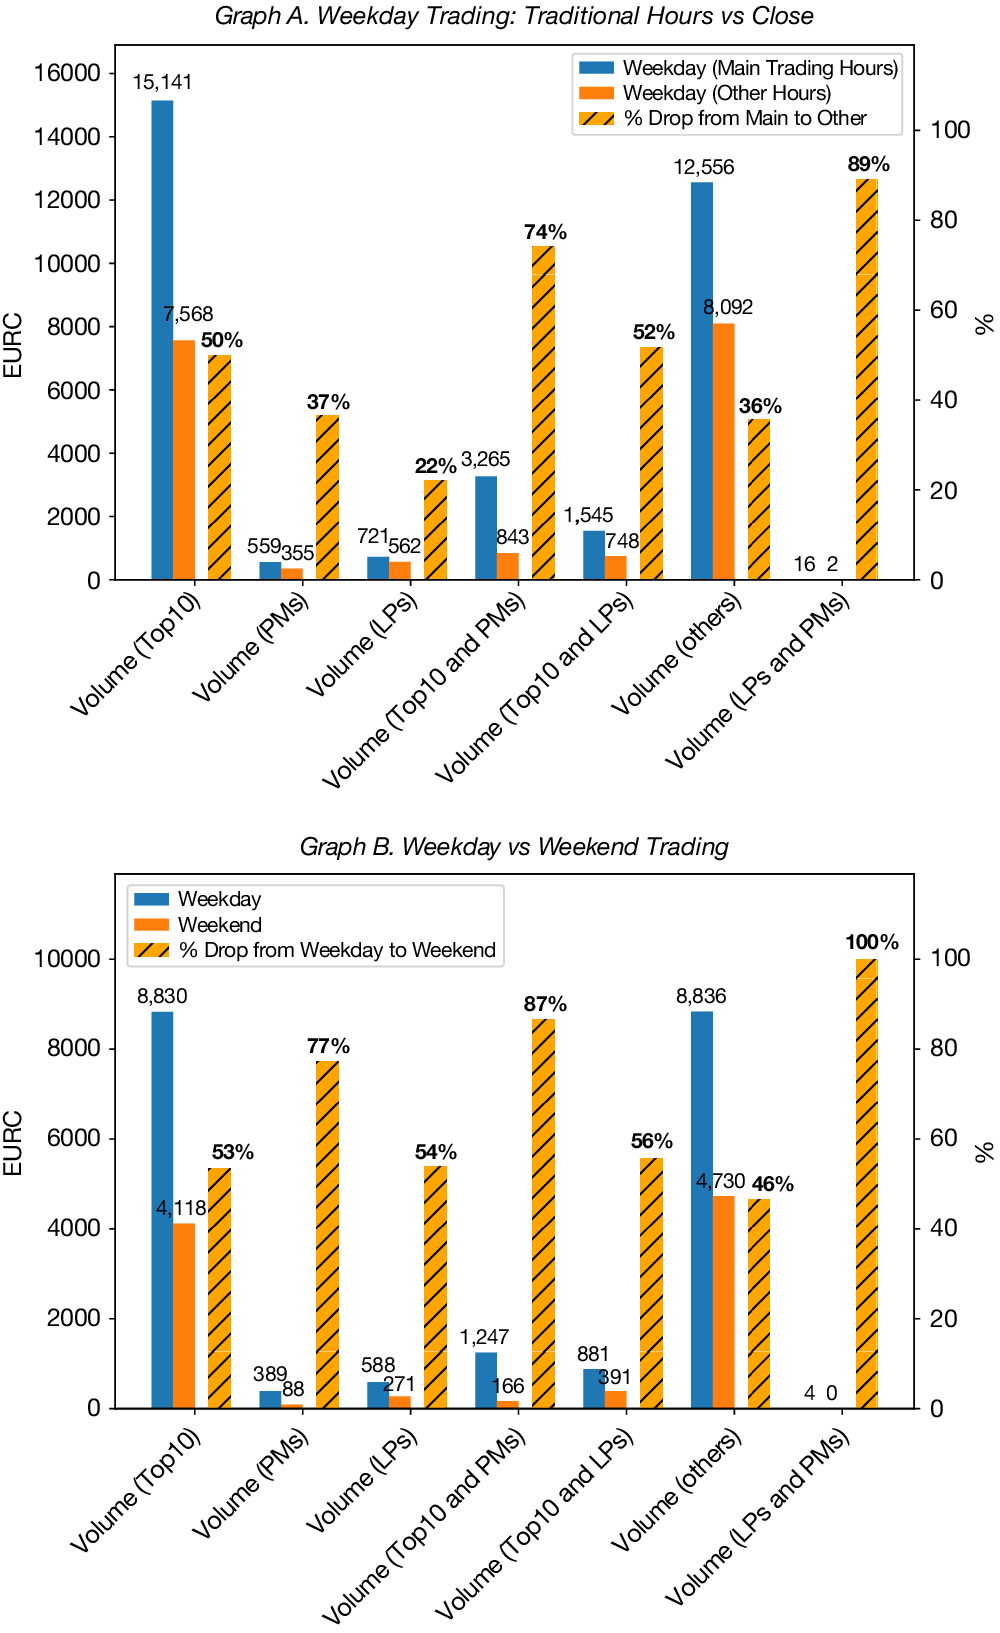
Figure 6 provides additional evidence. Graph A shows that DEX volumes for all trader categories peak between 13:00 and 16:00 UTC and decline outside these hours, with volumes falling by about 50% for sophisticated traders and 37% for primary dealers. For traders classified as both sophisticated and primary dealers, the drop reaches 74%. Graph B shows that weekend activity falls significantly across groups, with the steepest decline of 87% among sophisticated primary dealers. Together, these findings demonstrate that decentralized FX markets move closely with traditional FX markets across both price and quantity dimensions.
Figure 6 plots average trading volume, distinguishing between weekday and weekend trading by trader group. Graph A compares weekday trading volume during traditional primary-market opening hours (13:00–16:00 UTC) with other weekday hours. Graph B compares average trading volume across weekdays and weekends. Volumes are expressed in EURC. Blockchain trading volume is disaggregated by trader group following Table 2. The sample period is from Aug. 15, 2022 to Apr. 30, 2024.

B. Price Efficiency and Blockchain Frictions
Fact #2: Peg Efficiency Is Driven by Blockchain Frictions
In an efficient market, decentralized prices should track benchmark EUR/USD values tightly. Persistent deviations therefore reveal the frictions that limit arbitrage. To identify these frictions, we regress $ {\Delta}_t $
on blockchain execution costs, stablecoin fundamentals, and traditional intermediary constraints at the daily frequency,
$ {\Delta}_t $
on blockchain execution costs, stablecoin fundamentals, and traditional intermediary constraints at the daily frequency,
 $$ {\displaystyle \begin{array}{c}{\Delta}_t={\beta}_0+{\beta}_1{\mathrm{gasfee}}_t+{\beta}_2{\sigma}_{ETH,t}^{IV}+{\beta}_3{R}_{ETH,t}+{\beta}_4\mid {p}_{\mathrm{USDC}/\mathrm{USD},t}-1\mid \\ {}+{\beta}_5\mid {p}_{\mathrm{EURC}/\mathrm{EUR},t}-1\mid +{\beta}_6{\mathrm{VLOOP}}_t+{\beta}_7{\mathrm{ICRF}}_t+{\varepsilon}_t,\end{array}} $$
where $ {\mathrm{gasfee}}_t $
,
$ {\mathrm{gasfee}}_t $
, $ {\sigma}_{ETH,t}^{IV} $
, and
$ {\sigma}_{ETH,t}^{IV} $
, and $ {R}_{ETH,t} $
capture on-chain execution costs and crypto-market risk,
$ {R}_{ETH,t} $
capture on-chain execution costs and crypto-market risk, $ \mid {p}_{\mathrm{USDC}/\mathrm{USD},t}-1\mid $
and
$ \mid {p}_{\mathrm{USDC}/\mathrm{USD},t}-1\mid $
and $ \mid {p}_{\mathrm{EURC}/\mathrm{EUR},t}-1\mid $
measure stablecoin peg deviations, VLOOP is a standardized measure of FX triangular arbitrage violations, and ICRF is the intermediary capital risk factor of He et al. (Reference He, Kelly and Manela2017), which proxies shocks to U.S. dealer balance-sheet constraints.
$ \mid {p}_{\mathrm{EURC}/\mathrm{EUR},t}-1\mid $
measure stablecoin peg deviations, VLOOP is a standardized measure of FX triangular arbitrage violations, and ICRF is the intermediary capital risk factor of He et al. (Reference He, Kelly and Manela2017), which proxies shocks to U.S. dealer balance-sheet constraints.
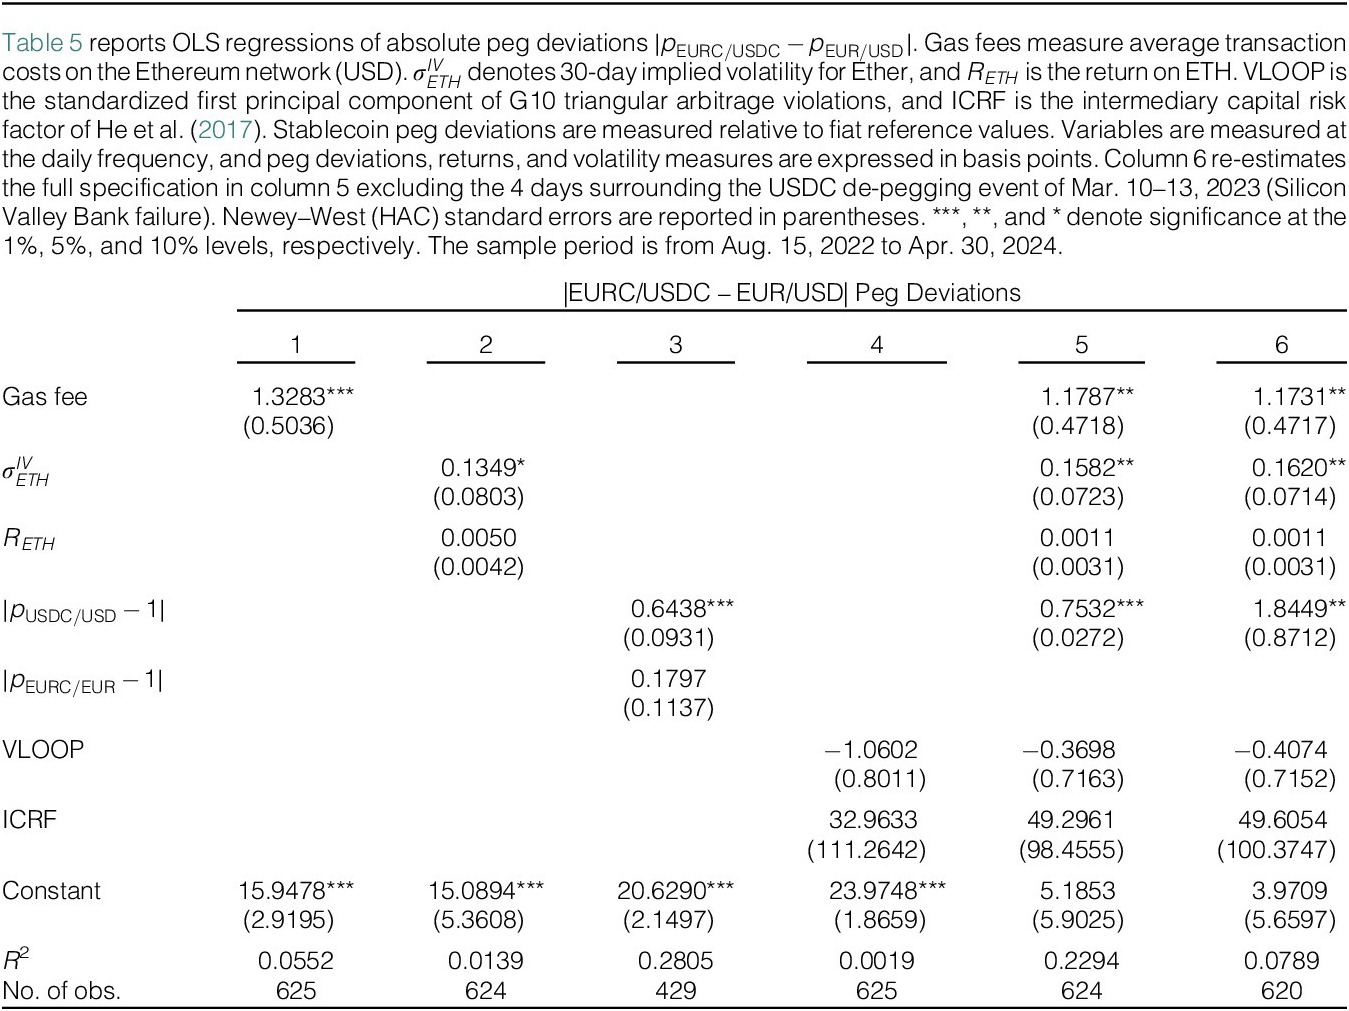
Table 5 shows that blockchain-specific frictions are the primary determinants of price deviations. Both gas fees and Ether volatility consistently explain variation in $ {\Delta}_t $
. A $1 increase in gas fees raises
$ {\Delta}_t $
. A $1 increase in gas fees raises $ {\Delta}_t $
by about 1.3 basis points, while a 1-basis-point increase in implied Ether volatility increases deviations by 0.13–0.16 basis points. Ether volatility matters not because of dealer balance-sheet constraints but because it raises uncertainty for traders holding cryptoasset portfolios, reducing their willingness to deploy capital for arbitrage.
$ {\Delta}_t $
by about 1.3 basis points, while a 1-basis-point increase in implied Ether volatility increases deviations by 0.13–0.16 basis points. Ether volatility matters not because of dealer balance-sheet constraints but because it raises uncertainty for traders holding cryptoasset portfolios, reducing their willingness to deploy capital for arbitrage.
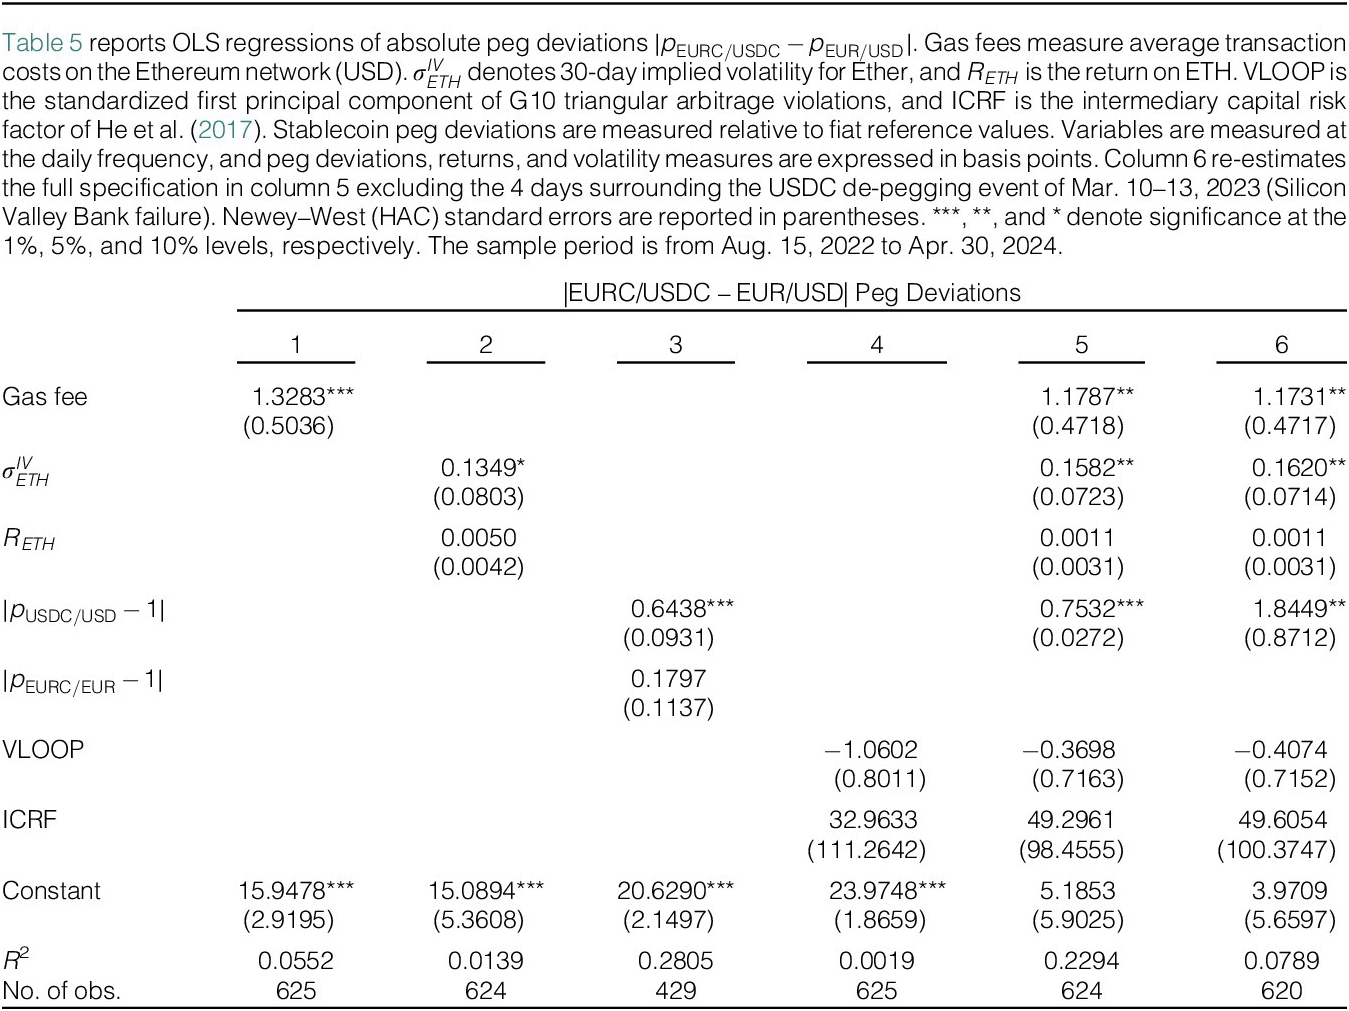
Stablecoin fundamentals also play an important role. The significance of $ \mid {p}_{\mathrm{USDC}/\mathrm{USD}}-1\mid $
reflects spillovers from USDC market conditions into EURC/USDC pricing. Frictions in USDC/USD markets constrain arbitrage capital for participants benchmarking EURC/USDC to EUR/USD, and as the more liquid leg of the pair, USDC/USD conditions provide a more informative proxy for these constraints. This pattern is partly explained by the SVB de-pegging event of March 2023, during which Circle’s disclosure of $3.3 billion in SVB deposits caused USDC to temporarily trade below par, generating sharp spikes in
$ \mid {p}_{\mathrm{USDC}/\mathrm{USD}}-1\mid $
reflects spillovers from USDC market conditions into EURC/USDC pricing. Frictions in USDC/USD markets constrain arbitrage capital for participants benchmarking EURC/USDC to EUR/USD, and as the more liquid leg of the pair, USDC/USD conditions provide a more informative proxy for these constraints. This pattern is partly explained by the SVB de-pegging event of March 2023, during which Circle’s disclosure of $3.3 billion in SVB deposits caused USDC to temporarily trade below par, generating sharp spikes in $ {\Delta}_t $
.Footnote
21
$ {\Delta}_t $
.Footnote
21
Consistent with this mechanism, column 5 shows that a 1-basis-point increase in the USDC/USD peg deviation is associated with a 0.75-basis-point rise in $ {\Delta}_t $
, whereas deviations in the EURC/EUR peg are positive but statistically insignificant. To assess whether this effect holds outside the de-pegging episode, column 6 re-estimates the full specification excluding the 4 days of the SVB episode (Mar. 10–13, 2023). The
$ {\Delta}_t $
, whereas deviations in the EURC/EUR peg are positive but statistically insignificant. To assess whether this effect holds outside the de-pegging episode, column 6 re-estimates the full specification excluding the 4 days of the SVB episode (Mar. 10–13, 2023). The $ {R}^2 $
falls from 0.23 to 0.08 and the coefficient rises to 1.84 with a larger standard error, reflecting more limited variation in the USDC peg outside the event, but the coefficient remains statistically significant.
$ {R}^2 $
falls from 0.23 to 0.08 and the coefficient rises to 1.84 with a larger standard error, reflecting more limited variation in the USDC peg outside the event, but the coefficient remains statistically significant.
All other coefficients remain stable across columns 5 and 6, confirming that the core blockchain-friction results are not driven by the SVB episode. Traditional intermediary constraints such as VLOOP and ICRF are insignificant, suggesting that balance-sheet frictions binding intermediaries in OTC FX markets do not carry over to decentralized venues. Taken together, these results indicate that price inefficiencies in the EURC/USDC market arise primarily from blockchain-specific frictions (execution costs, on-chain congestion, and stablecoin fundamentals) rather than traditional intermediary constraints (Barbon and Ranaldo (Reference Barbon and Ranaldo2024), Foley et al. (Reference Foley, O’Neill and Putniņš2023)).
C. Trading Costs
Fact #3: Transaction Costs Vary by Trader Type; Gas Fees Dominate for Most, Slippage for Large Traders
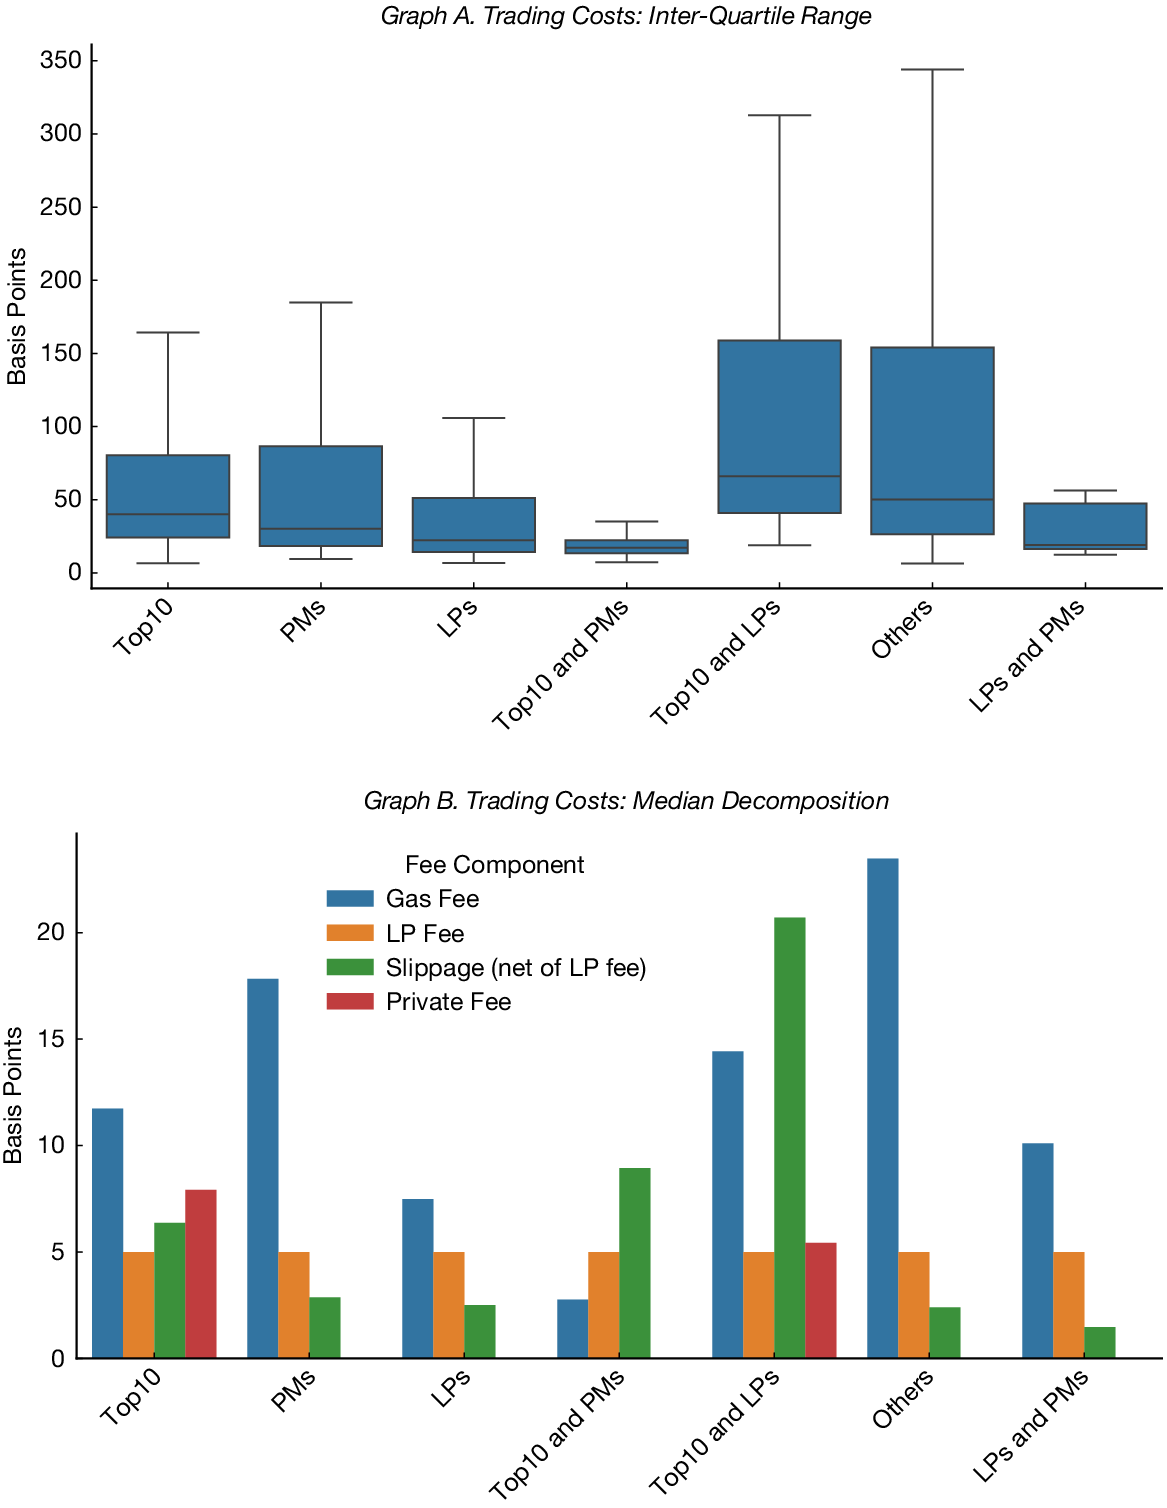
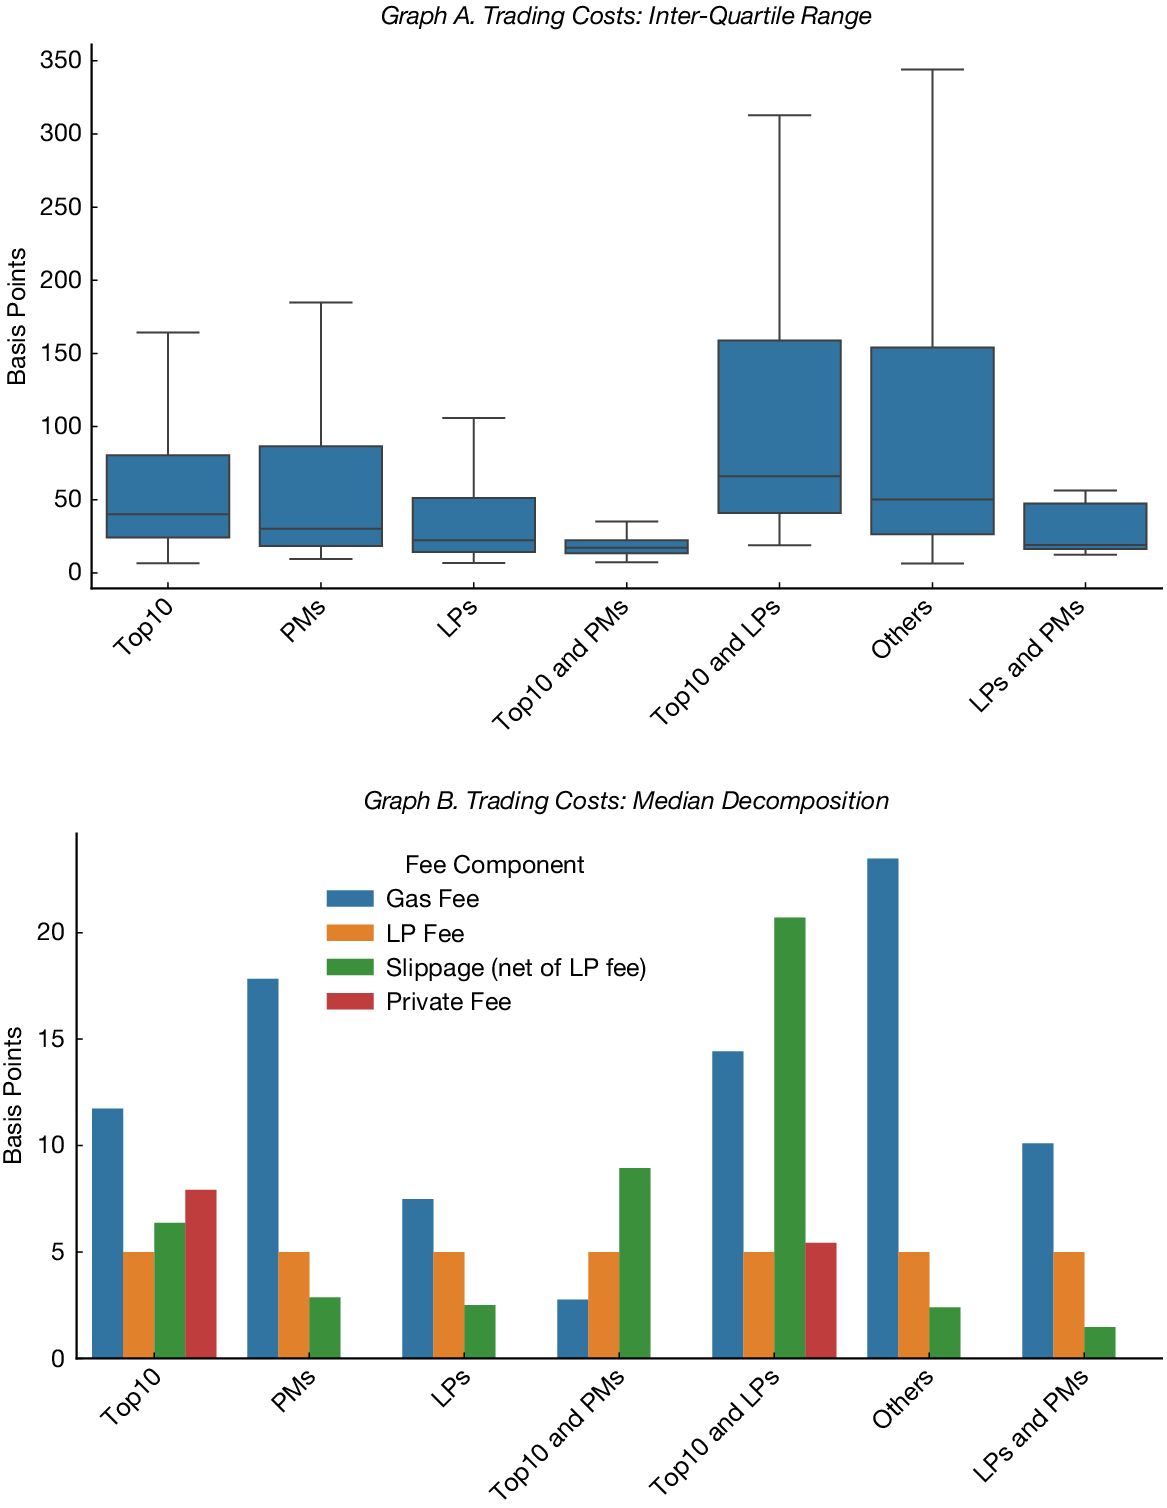
We next examine transaction costs at the trade level. Total cost, expressed in basis points relative to trade size, is the sum of gas fees, LP fees, slippage, and private-routing fees. Gas fees are payments to validators for processing transactions on the public blockchain and are largely fixed per transaction, implying higher proportional costs for small trades. LP fees are constant at 5 basis points in the EURC/USDC pool. Slippage reflects the price impact of consuming liquidity along the bonding curve and is measured as the difference between the execution price and the pool price immediately before the trade. Private-routing fees arise only for privately routed transactions and represent payments to validators for authenticating these orders; they are approximated using transfers to validator addresses, as detailed in Section C.2.4 of the Supplementary Material. Across trader types, median total costs range between 20 and 50 basis points.
Figure 7 shows substantial heterogeneity in trading costs across participants. Graph A indicates that larger traders face lower and more concentrated cost distributions, while smaller or residual wallets incur higher and more dispersed costs. Graph B decomposes median total costs by component. Gas fees are the dominant cost for most users, accounting for roughly 7–23 basis points across groups and representing a larger fraction of total costs for smaller traders. Slippage becomes more important for larger trades, reaching up to about 20 basis points, while LP fees are constant by design at 5 basis points. Overall, median total trading costs range from around 15–17 basis points for LP- and PM-related addresses to roughly 45 basis points for Top 10 $ \cap $
LP wallets, with Top 10 traders facing median costs just above 30 basis points.
$ \cap $
LP wallets, with Top 10 traders facing median costs just above 30 basis points.
Figure 7 presents trading cost measures for the EURC/USDC market at the hourly frequency. Graph A reports the interquartile range of total transaction costs across trader groups. Total costs combine gas fees (Ethereum transaction fees converted to USD), private fees (payments to validators for privately routed transactions), liquidity provider fees (5 basis points for the EURC/USDC pool), and price slippage, all expressed in basis points. Graph B decomposes median transaction costs into these components by trader group. Trader classifications follow Table 2. The sample period is from Aug. 15, 2022 to Apr. 30, 2024.
These results have two main implications. First, trading costs define the effective bounds within which arbitrage can operate. Section D of the Supplementary Material shows that once gas fees, slippage, LP fees, and private-routing fees are incorporated, the share of arbitrage-bound violations is approximately 16%–19%, falling to 3%–5% after accounting for centralized exchange fees and OTC bid–ask spreads. The EURC/USDC market is therefore best characterized as constrained price efficient rather than fully frictionless.
Second, decentralized trading costs compare favorably with those faced by many OTC clients. While on-chain costs exceed inter-dealer spreads (EUR/USD spreads averaged only 0.55 basis points in 2023 (Filippou, Maurer, Pezzo, and Taylor (Reference Filippou, Maurer, Pezzo and Taylor2024)), they are of a similar order of magnitude to those paid by less-privileged OTC clients. Hau et al. (Reference Hau, Hoffmann, Langfield and Timmer2021) show that FX derivatives clients at the 90th percentile face spreads of up to 50 basis points. Liquidity depth remains limited, particularly for large trades, but decentralized venues may nonetheless expand access to FX trading for smaller participants.
IV. Informational Efficiency
A. Blockchain Order Flow and Arbitrage Trading
We examine how information is incorporated into prices in blockchain currency markets, beginning with the arbitrage mechanism. Arbitrage trades exploit price differences across venues and contribute to keeping the on-chain reference rate (EURC/USDC) aligned with the traditional benchmark (EUR/USD). Because transaction costs such as gas fees are largely fixed per transaction, arbitrage incentives are strongest for traders who can execute at scale, making participation uneven across market participants.
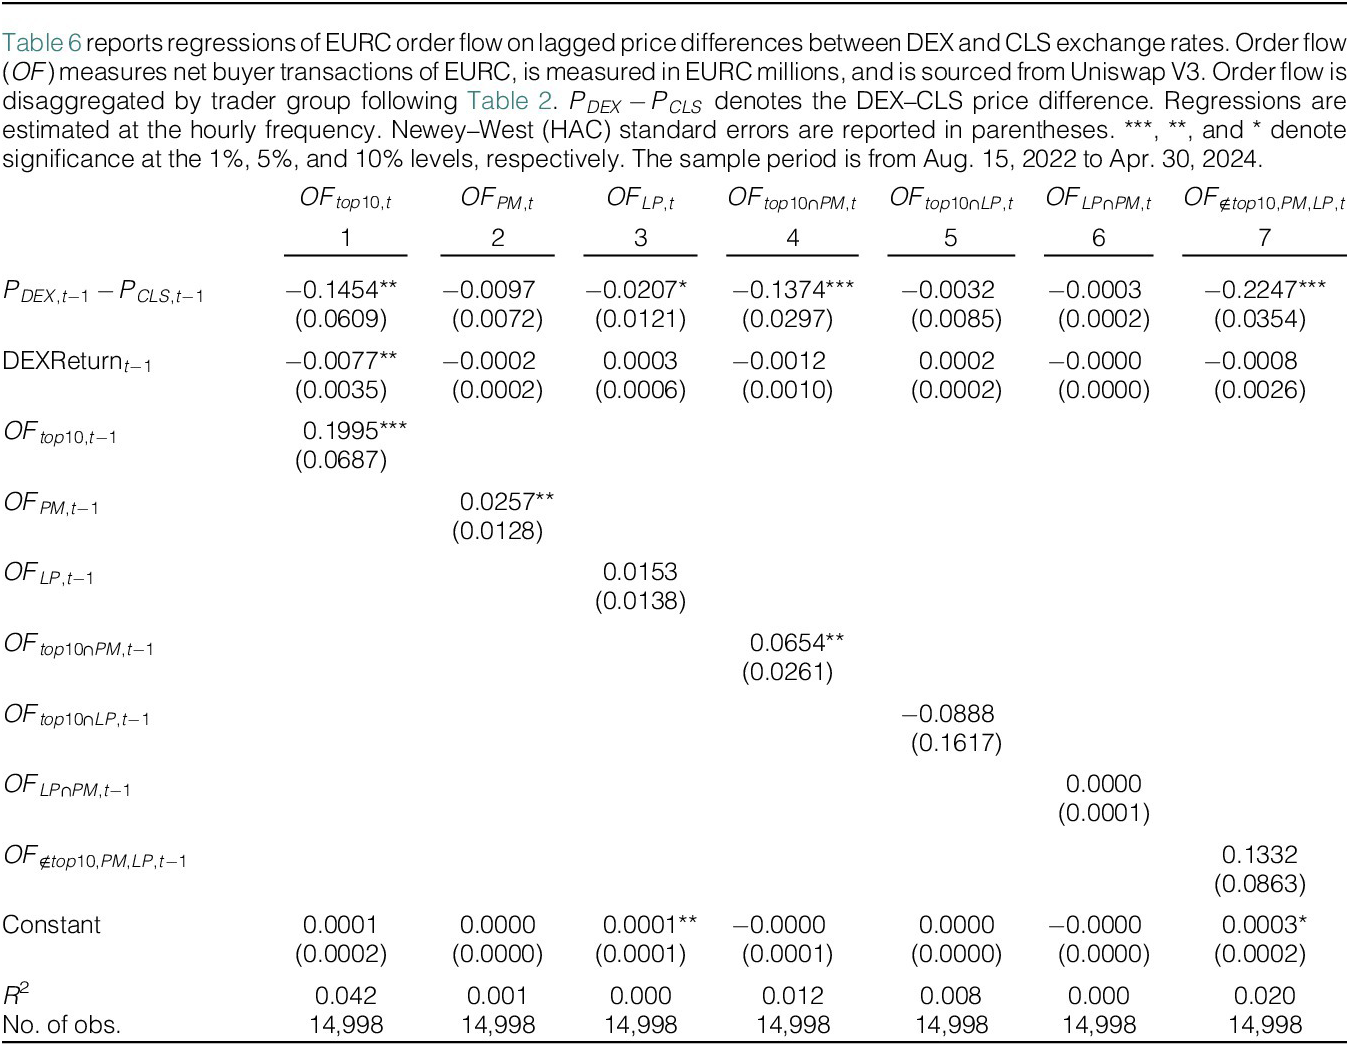
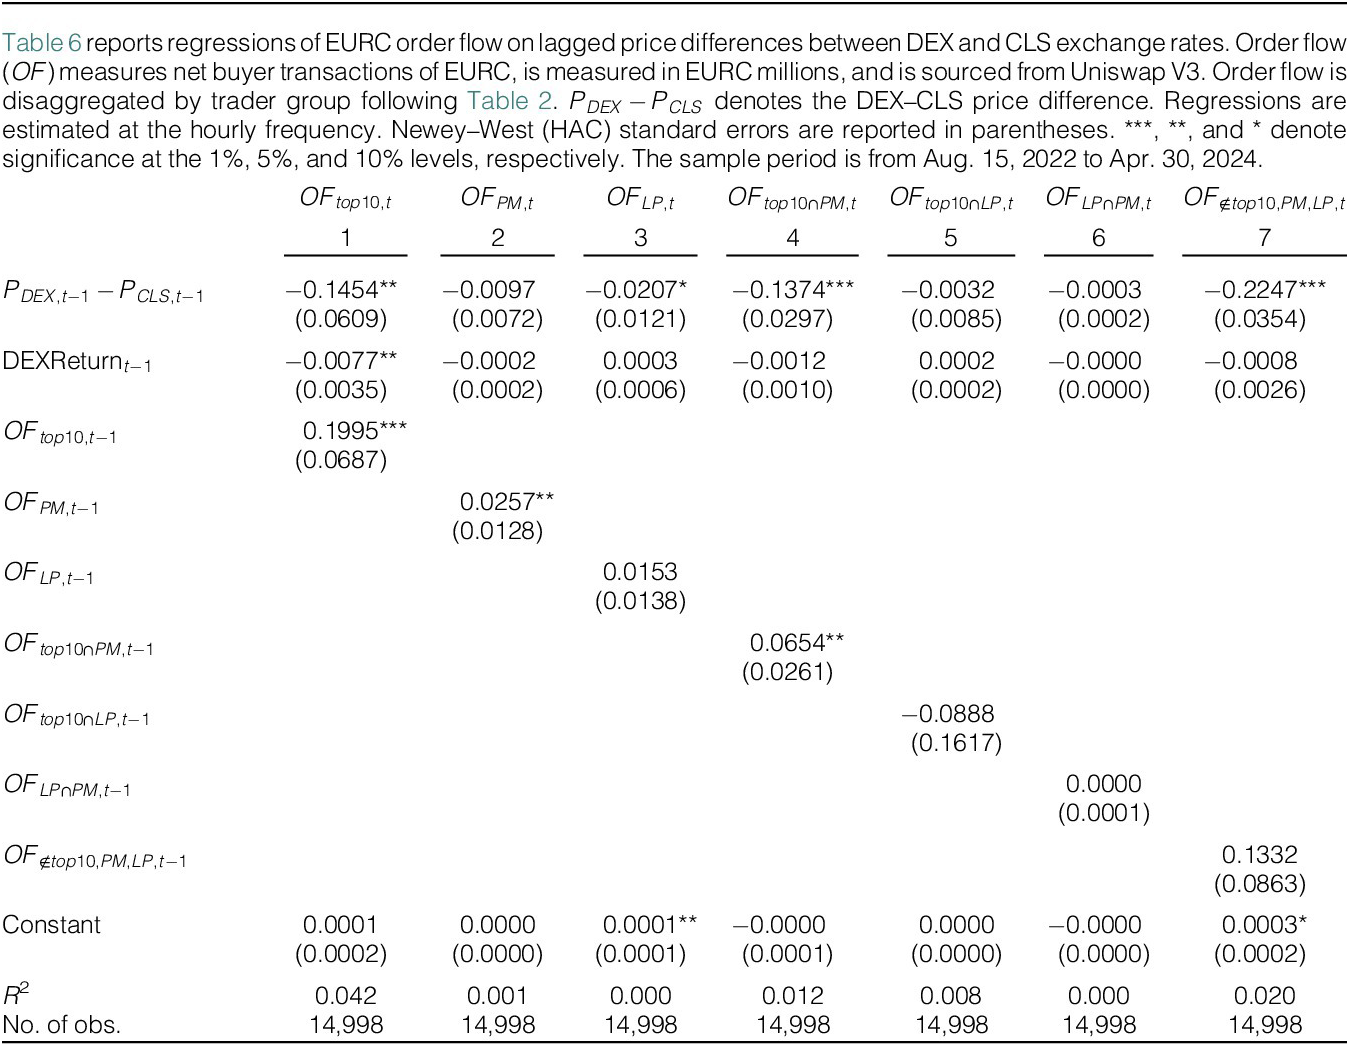
To measure these responses, we test whether DEX order flow adjusts to lagged price differences between the DEX reference rate and the CLS benchmark rate. The analysis is conducted at the hourly frequency to capture short-horizon arbitrage dynamics. Specifically, we estimate equation (10)), regressing blockchain order flow on the lagged DEX–benchmark price differential, with controls that include the lagged EURC/USDC return,
 $$ {OF}_{i,t}=\alpha +{\beta}_1\left({p}_{\mathrm{EUR}\mathrm{C}/\mathrm{USD}\mathrm{C},t-1}-{p}_{\mathrm{EUR}/\mathrm{USD},t-1}\right)+{\mathrm{controls}}_{i,t}+{\epsilon}_{i,t}. $$
Table 6 shows that benchmark deviations predict subsequent order flow primarily for sophisticated traders. In column 1, a one-unit increase in the lagged hourly price deviation between Uniswap and CLS rates is associated with a reduction in aggregate blockchain order flow of 0.15 million EURC. Column 4 shows a similar magnitude for traders who are both sophisticated and primary dealers, with order flow decreasing by 0.14 million EURC. In contrast, the effects for standalone primary dealers and LPs, reported in columns 2 and 3, are statistically insignificant.
Public Information
We next examine trading responses to public information. These episodes provide clean settings to study the arbitrage mechanism, as common shocks generate price dislocations across centralized and on-chain venues. We focus on two types of public information: the March 2023 USDC de-pegging episode and scheduled Federal Reserve announcements.
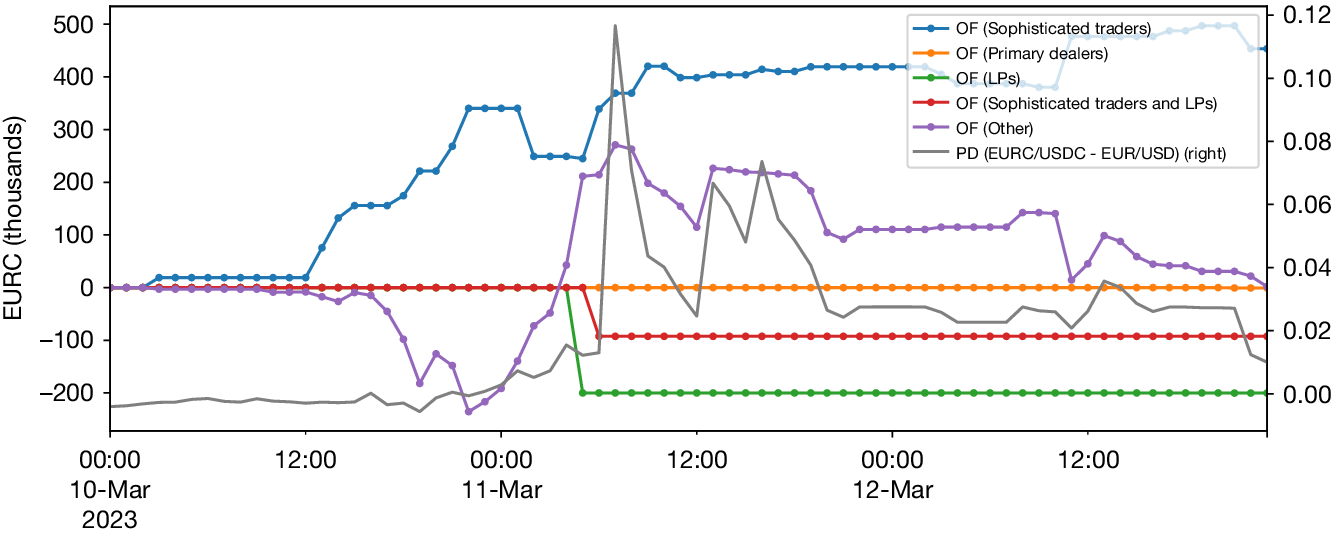
USDC de-pegging event. The USDC de-pegging on Mar. 11, 2023 provides a natural setting to study arbitrage under stress. When it became public that $3.3 billion of USDC reserves were held at SVB, which had entered resolution, concerns about reserve accessibility caused USDC to trade at a discount and fall to 87 cents on centralized exchanges. Confidence recovered on March 13, after the Federal Deposit Insurance Corporation announced that all SVB deposits would be fully protected.Footnote 22
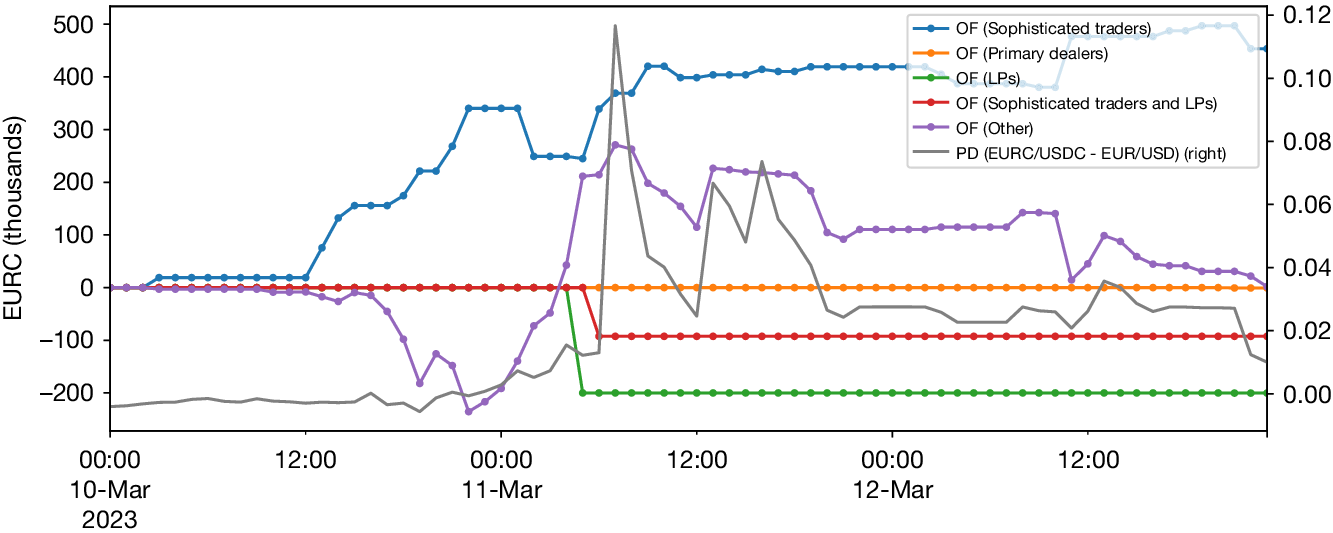
Figure 8 plots deviations of EURC/USDC from the EUR/USD benchmark together with disaggregated blockchain order flow. Sophisticated traders are net buyers of EURC throughout the episode, while primary dealers and smaller wallets exhibit net selling pressure. This behavior is consistent with arbitrage opportunities created by the USDC de-pegging. As USDC traded at a discount on centralized exchanges, sophisticated traders could purchase USDC on those venues and sell it into Uniswap V3 pools where its relative price was higher, thereby arbitraging the temporary dislocation. LPs behaved differently. Their swap and mint–burn activity did not respond to price discrepancies, and their inventories adjusted mechanically as traders executed swaps, consistent with passive liquidity provision. Section E.1 of the Supplementary Material provides additional evidence of repeated cross-market arbitrage across multiple pools, shows that cost and routing advantages favored Top 10 wallets, and documents minimal liquidity re-positioning during the episode.
Figure 8 plots cumulative blockchain order flow around the USDC de-pegging event at the hourly frequency. Price deviations are measured as the difference between EURC/USDC prices from Uniswap V3 and EUR/USD prices from CLS. Order flow ( $ OF $
) measures net buyer transactions of EURC and is sourced from Uniswap V3 trade data. Cumulative order flow is disaggregated by trader group following Table 2. The sample period is from Mar 10, 2023 to Mar 12, 2023.
$ OF $
) measures net buyer transactions of EURC and is sourced from Uniswap V3 trade data. Cumulative order flow is disaggregated by trader group following Table 2. The sample period is from Mar 10, 2023 to Mar 12, 2023.
Monetary announcements. Public information also arrives through scheduled macroeconomic releases. Section E.2 of the Supplementary Material examines Federal Reserve FOMC announcements and shows that EURC/USDC deviations from CLS benchmarks remain small after releases, while trading volumes rise sharply in both markets. Prices in the two venues move together almost immediately, indicating active arbitrage as macroeconomic news is incorporated.
Taken together, the regression evidence and event studies show that arbitrage linking decentralized and traditional FX prices is concentrated among sophisticated traders and primary dealers, consistent with scale economies in blockchain execution costs, while other traders respond weakly to short-horizon price gaps and LPs remain largely passive.
B. Blockchain Order Flow and Fundamental Information
Permanent Price Impact
We study whether blockchain order flow contains information about exchange rate fundamentals beyond arbitrage by examining its permanent price impact. In asymmetric-information models, public news is incorporated rapidly, whereas private information is revealed gradually through order flow (Evans and Lyons (Reference Evans and Lyons2002)). In traditional FX markets, this process operates primarily through inter-dealer trading. Blockchain markets lack such an inter-dealer tier, so informational trading is transmitted directly through trades rather than through dealer inventories. In this sense, informed trading on chain more closely resembles the framework of Kyle (Reference Kyle1985), in which traders with private signals reveal information through their trades.
The presence of informed trading is likely to differ across participants. Primary dealers, with direct access to EUR and USD funding and links to interbank markets, are plausibly more exposed to fundamental signals. Sophisticated traders, operating at scale and facing lower execution costs, can transmit such information across venues. By contrast, LPs primarily supply inventory and are exposed to adverse selection when prices move on fundamentals (Capponi and Jia (Reference Capponi and Jia2025)). This heterogeneity motivates an empirical design that estimates permanent price impact separately by trader type.
We estimate a structural VAR at the hourly frequency to capture the dynamic relationship between order flow and exchange rate changes. To isolate the informational content of blockchain order flow beyond what is already incorporated through institutional trading, we control for traditional FX order flow from CLS. This yields a block SVAR with traditional OTC order flow ( $ {\mathbf{OF}}_t^{OTC} $
), blockchain order flow (
$ {\mathbf{OF}}_t^{OTC} $
), blockchain order flow ( $ {\mathbf{OF}}_t^{DEX} $
), and exchange rate changes (
$ {\mathbf{OF}}_t^{DEX} $
), and exchange rate changes ( $ \Delta {p}_t $
):
$ \Delta {p}_t $
):
 $$ \left[\begin{array}{c}{\mathbf{OF}}_t^{OTC}\\ {}{\mathbf{OF}}_t^{DEX}\\ {}\Delta {p}_t\end{array}\right]=\alpha +\sum \limits_{k=1}^L{\mathbf{A}}_k\left[\begin{array}{c}{\mathbf{OF}}_{t-k}^{OTC}\\ {}{\mathbf{OF}}_{t-k}^{DEX}\\ {}\Delta {p}_{t-k}\end{array}\right]+{\epsilon}_t. $$
The vector $ {\mathbf{OF}}_t^{OTC} $
includes buy-minus-sell imbalances for interbank dealers, funds, nonbank financials, and corporates from CLS data. The vector
$ {\mathbf{OF}}_t^{OTC} $
includes buy-minus-sell imbalances for interbank dealers, funds, nonbank financials, and corporates from CLS data. The vector $ {\mathbf{OF}}_t^{DEX} $
consists of EURC/USDC transaction flows on Uniswap, disaggregated by wallet type: LPs, residual wallets (
$ {\mathbf{OF}}_t^{DEX} $
consists of EURC/USDC transaction flows on Uniswap, disaggregated by wallet type: LPs, residual wallets ( $ \notin \left\{\mathrm{Top}10,\mathrm{PM},\mathrm{LP}\right\} $
), Top10
$ \notin \left\{\mathrm{Top}10,\mathrm{PM},\mathrm{LP}\right\} $
), Top10 $ \cap $
LP, PM, Top10, and Top10
$ \cap $
LP, PM, Top10, and Top10 $ \cap $
PM, as defined in Section II. The variable
$ \cap $
PM, as defined in Section II. The variable $ \Delta {p}_t $
denotes log changes in the EUR/USD exchange rate, measured either from the DEX mid-price or the CLS benchmark.
$ \Delta {p}_t $
denotes log changes in the EUR/USD exchange rate, measured either from the DEX mid-price or the CLS benchmark.
Identification uses a recursive Cholesky ordering $ {\mathbf{OF}}_t^{OTC}\to {\mathbf{OF}}_t^{DEX}\to \Delta {p}_t $
. This allows traditional OTC order flow to affect blockchain order flow and prices contemporaneously, while DEX flows do not contemporaneously affect OTC flows, and prices respond immediately to all order flows. The ordering reflects the hierarchical structure of FX trading venues and standard information transmission assumptions in the microstructure literature. Full details are provided in Section F of the Supplementary Material.
$ {\mathbf{OF}}_t^{OTC}\to {\mathbf{OF}}_t^{DEX}\to \Delta {p}_t $
. This allows traditional OTC order flow to affect blockchain order flow and prices contemporaneously, while DEX flows do not contemporaneously affect OTC flows, and prices respond immediately to all order flows. The ordering reflects the hierarchical structure of FX trading venues and standard information transmission assumptions in the microstructure literature. Full details are provided in Section F of the Supplementary Material.
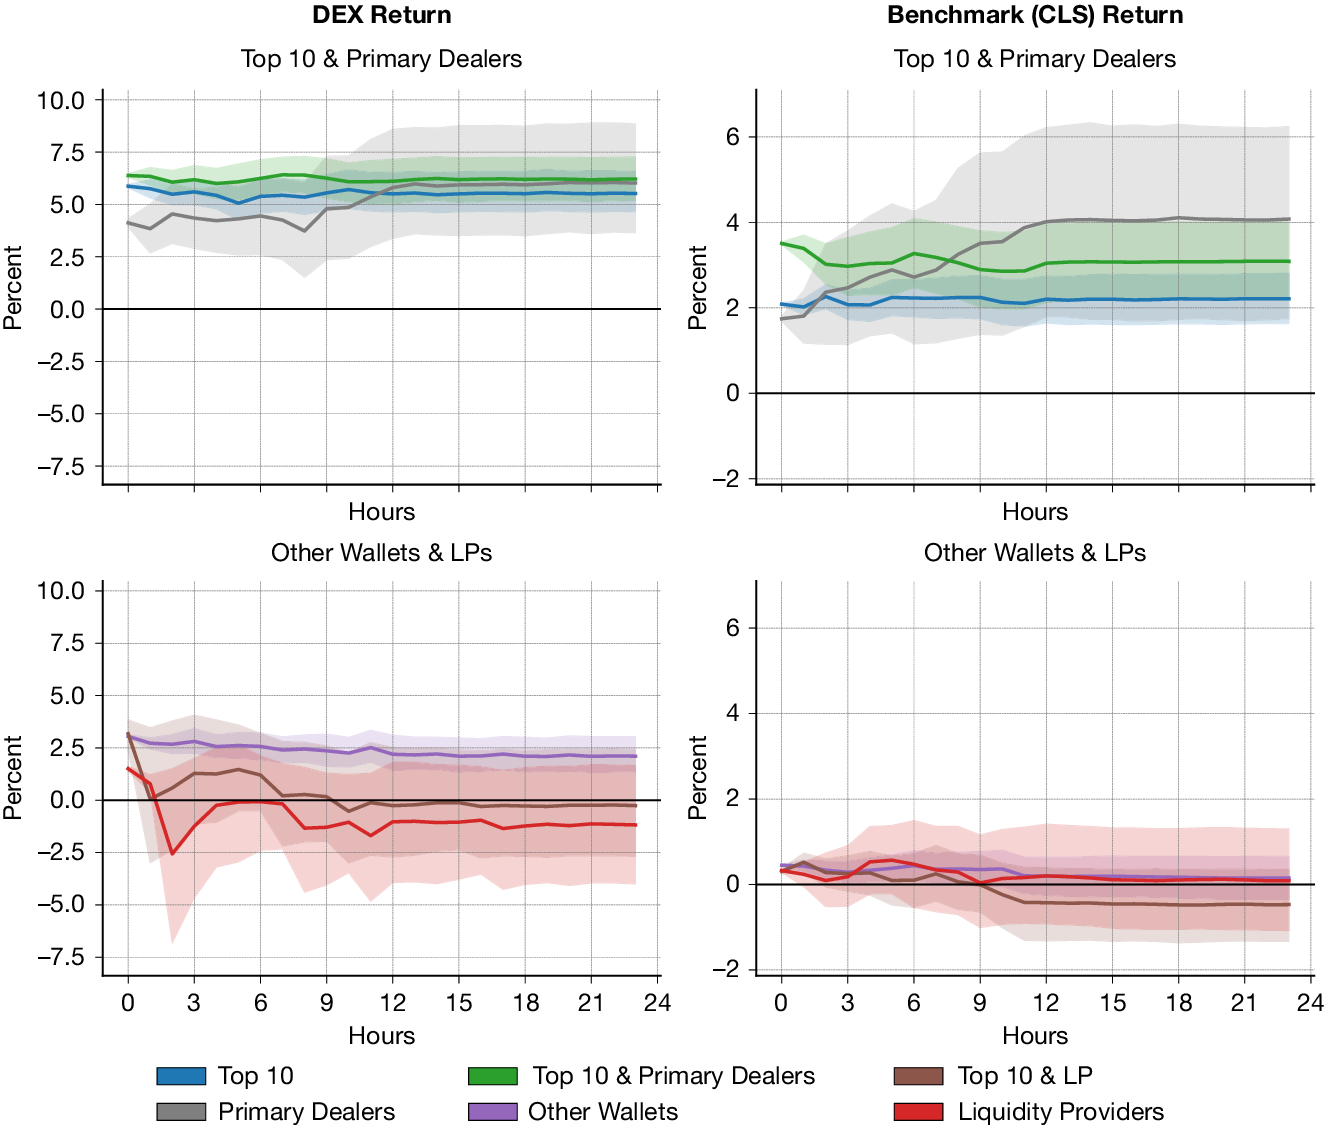
Figure 9 reports impulse response functions over a 24-hour horizon. The figure shows responses of EURC/USDC returns and benchmark EUR/USD returns from CLS to shocks in DEX order flow by participant type. Order flow from sophisticated traders and primary dealers generates the largest and most persistent effects on benchmark returns, whereas flows from LPs have negligible impact.
Figure 9 plots impulse responses of returns to a 1 million EURC shock in blockchain order flow, estimated at the hourly frequency. The figure reports responses for transactions by Top 10 wallets, primary dealers, other wallets, and liquidity providers, for both EURC/USDC returns from Uniswap V3, and benchmark EUR/USD returns from CLS. Responses are estimated using a structural VAR with 1,000 bootstrap replications. The sample period is from Aug. 15, 2022 to Apr. 30, 2024.
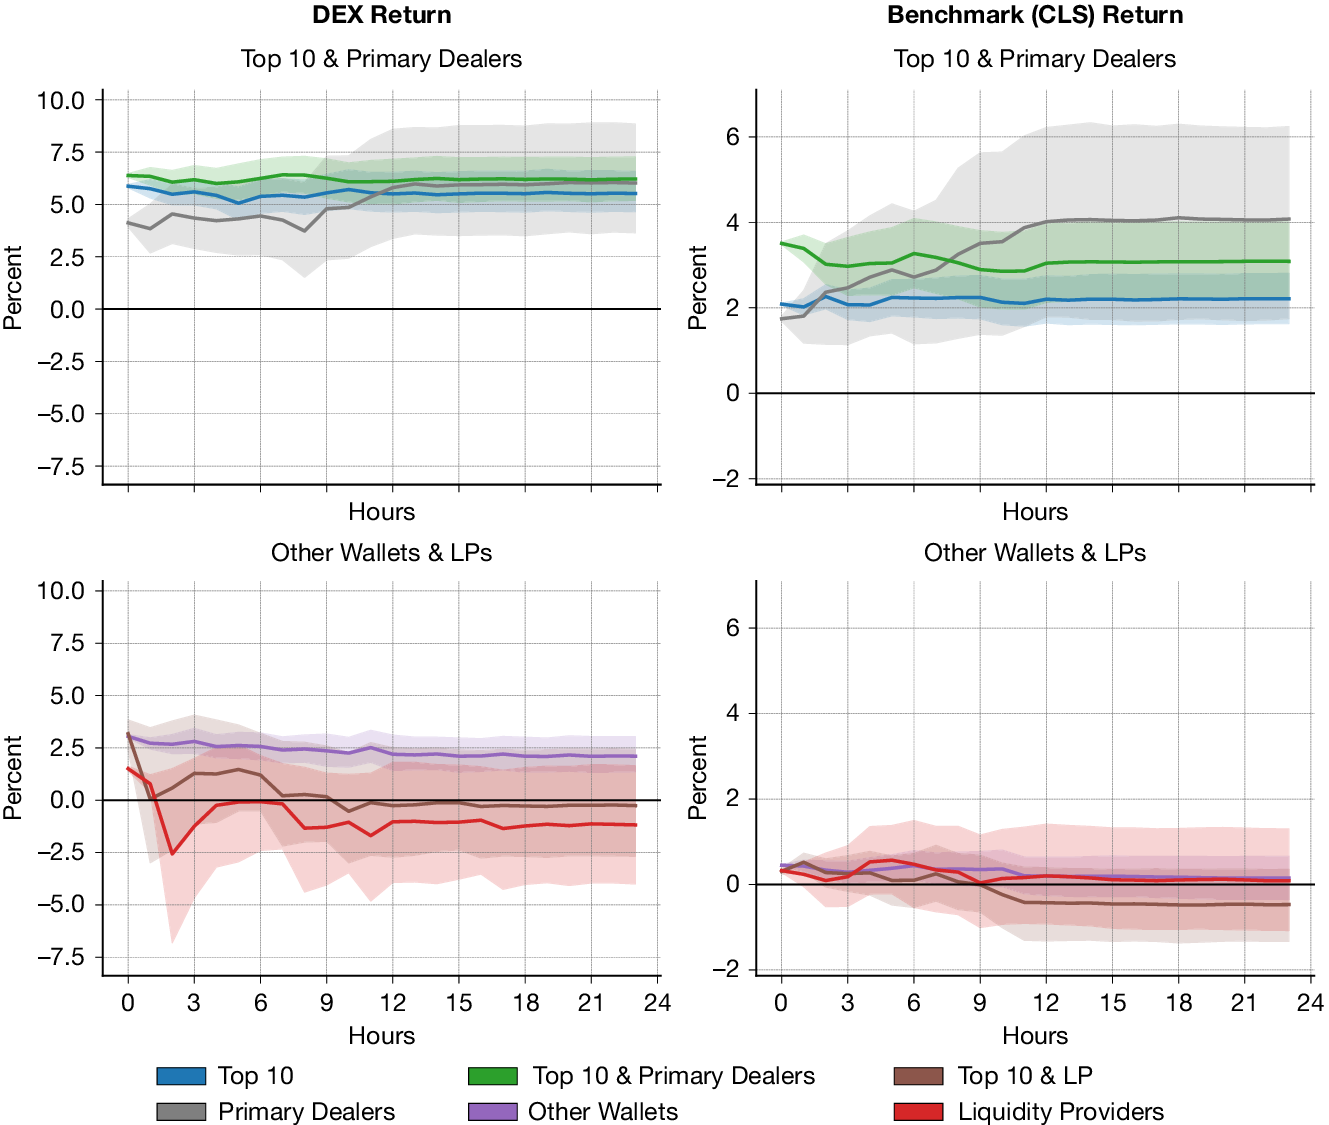
Quantitatively, a 1 million EURC shock to primary dealer order flow produces a cumulative 24-hour impact of approximately 3.95% on CLS benchmark EUR/USD returns, while an equivalent shock to sophisticated trader order flow produces an impact of about 2.2%. The combined group of Top 10 wallets that are also primary dealers generates a cumulative impact of 3.1%. In contrast, order flow from LPs and residual wallets has negligible permanent effects on benchmark returns, with estimated impacts of approximately $ -0.05 $
and 0.2%, respectively, consistent with passive liquidity provision and uninformed trading.
$ -0.05 $
and 0.2%, respectively, consistent with passive liquidity provision and uninformed trading.
Scaling these responses to a 1-standard-deviation shock in daily order flow implies permanent impacts of roughly 1.6 basis points for sophisticated traders and 2.9 basis points for primary dealers.Footnote 23 These effects do not rely on inter-dealer inventory adjustment mechanisms. Instead, they are consistent with persistent price adjustment driven by heterogeneity in trader information and execution, in line with informed trading models such as Kyle (Reference Kyle1985).
Robustness. Section G of the Supplementary Material reports a full set of robustness checks. We re-estimate the baseline SVAR under alternative specifications, including controls for net liquidity provision (within and beyond $ \pm $
1% of the best price), a higher-frequency (5-min) SVAR, and trader-volume quintiles. The main results are stable. Price impacts remain concentrated among top wallets and primary dealers, while LPs and smaller wallets exhibit weaker and less persistent effects. We also examine intraday variation (Section G.2 of the Supplementary Material) and find that price impacts are concentrated between 13:00 and 15:00 UTC, when major global financial markets are simultaneously open. Finally, we examine just-in-time liquidity provision (Capponi, Jia, and Zhu (Reference Capponi, Jia and Zhu2024)). Section G.3 of the Supplementary Material identifies one wallet, ending in “ae13,” that consistently displays this behavior in the EURC/USDC pool.Footnote
24 This behavior is rare in our sample and does not materially affect our estimates of permanent price impact.
$ \pm $
1% of the best price), a higher-frequency (5-min) SVAR, and trader-volume quintiles. The main results are stable. Price impacts remain concentrated among top wallets and primary dealers, while LPs and smaller wallets exhibit weaker and less persistent effects. We also examine intraday variation (Section G.2 of the Supplementary Material) and find that price impacts are concentrated between 13:00 and 15:00 UTC, when major global financial markets are simultaneously open. Finally, we examine just-in-time liquidity provision (Capponi, Jia, and Zhu (Reference Capponi, Jia and Zhu2024)). Section G.3 of the Supplementary Material identifies one wallet, ending in “ae13,” that consistently displays this behavior in the EURC/USDC pool.Footnote
24 This behavior is rare in our sample and does not materially affect our estimates of permanent price impact.
C. Private Information and Permanent Price Impact
The permanent price effects documented in Section IV.B raise an identification issue as to whether these effects reflect private information about exchange rate fundamentals or arbitrage activity that mechanically aligns decentralized prices with traditional benchmarks. We address this distinction using two complementary tests. First, we exploit variation in transaction routing by comparing the price impact of privately routed and publicly broadcast trades. Second, we decompose blockchain order flow into an arbitrage-driven component predicted by cross-venue price differentials and a residual component orthogonal to these differentials, which we interpret as informational order flow. All figures and tables referenced in this subsection are reported in Section H of the Supplementary Material.
Private transactions. First, we exploit variation in transaction routing by separating private transactions, which bypass the public mempool, from public transactions and comparing their price effects within a joint SVAR. Private routing can reflect either strategic execution to avoid frontrunning and MEV extraction when conducting large trades or an attempt to conceal fundamental information during execution. These mechanisms have different implications: MEV-related routing should comove with contemporaneous cross-venue price gaps, whereas information-concealing routing should be associated with more persistent effects on benchmark prices.
We identify private transactions using Blocknative mempool archives (Section C.2.4 of the Supplementary Material). Such transactions are concentrated among Top 10 and Top 10 $ \cap $
LP addresses, while primary dealers and LPs transact almost exclusively through the public mempool. We re-estimate the SVAR by splitting blockchain order flow into public and private components for Top 10 traders, primary dealers, and LPs, ordering each private component immediately after its corresponding public component.Footnote
25
$ \cap $
LP addresses, while primary dealers and LPs transact almost exclusively through the public mempool. We re-estimate the SVAR by splitting blockchain order flow into public and private components for Top 10 traders, primary dealers, and LPs, ordering each private component immediately after its corresponding public component.Footnote
25
Figure H.1 in the Supplementary Material shows that privately routed trades generate larger and more persistent price effects than public transactions, with the strongest responses for sophisticated traders (Top 10) and Top 10 $ \cap $
LP addresses. For benchmark CLS EUR/USD returns, the estimated permanent price impact at a 24-hour horizon of a 1 million EURC shock from Top 10 wallets is 2.75% for private transactions, compared with 1.15% for public transactions. For Top 10
$ \cap $
LP addresses. For benchmark CLS EUR/USD returns, the estimated permanent price impact at a 24-hour horizon of a 1 million EURC shock from Top 10 wallets is 2.75% for private transactions, compared with 1.15% for public transactions. For Top 10 $ \cap $
LP flows, the corresponding estimates are 1.25% and
$ \cap $
LP flows, the corresponding estimates are 1.25% and $ -0.60 $
%, respectively.
$ -0.60 $
%, respectively.
Tables H.1 and H.2 in the Supplementary Material examine whether public and private order flows respond to DEX–CLS price differentials, which proxy for arbitrage incentives. Public transactions display stronger and more systematic sensitivity to these price gaps than private transactions, consistent with an arbitrage channel that contributes to price alignment across venues. By contrast, private transactions, particularly those initiated by Top 10 traders, show little or no response to DEX–CLS price differentials, consistent with information-motivated trading or execution considerations. The only exception is the Top 10 $ \cap $
LP group, whose private transactions exhibit a weak response to price differentials, consistent with LPs using private routing to mitigate frontrunning and MEV extraction during large re-positioning trades.
$ \cap $
LP group, whose private transactions exhibit a weak response to price differentials, consistent with LPs using private routing to mitigate frontrunning and MEV extraction during large re-positioning trades.
We interpret private transactions that are unresponsive to DEX–CLS price differentials as reflecting the trading of fundamental information rather than arbitrage. While private routing may also facilitate MEV-related strategies or high-frequency arbitrage not fully captured at the hourly frequency, we find supporting evidence that arbitrage flows occur through the public mempool: during the March 2023 USDC de-pegging episode, all observed EURC/USDC transactions by the sophisticated trader in Table E.1 in the Supplementary Material were publicly broadcast,Footnote 26 indicating that large traders exploiting cross-pool dislocations did not rely on private routing in this episode. At higher frequencies, such as within-block MEV strategies,Footnote 27 arbitrage may still occur through private channels.
Arbitrage versus informational order flow. Second, we separate informational effects from arbitrage by decomposing blockchain order flow into a component predicted by lagged DEX–CLS price differentials and a residual component orthogonal to these differentials. We estimate this decomposition using equation (10), regressing net EURC order flow on lagged cross-venue price gaps. The fitted values capture arbitrage-driven order flow, while the residual proxies for information-driven trading.
Figure H.2 in the Supplementary Material reports impulse responses of CLS benchmark EUR/USD returns to these components. The residual component generates persistent and statistically significant price effects, particularly for large traders and the intersection of Top 10 traders and primary dealers, whereas the arbitrage component has no significant impact on benchmark returns. Together with the routing evidence, these results indicate that the permanent price effects documented in Sections IV.B and IV.C are driven primarily by the incorporation of fundamental information rather than by cross-venue arbitrage.
V. Conclusion
Decentralized finance introduces a trading architecture based on smart contracts and automated liquidity provision, offering a market structure that differs fundamentally from traditional dealer-intermediated FX trading. Using granular blockchain and CLS data, we study the informational efficiency of the EURC/USDC market on Uniswap V3 and its connection to the traditional EUR/USD market.
We document two main findings. First, decentralized prices and trading activity track traditional FX benchmarks closely. Deviations are generally small and are determined primarily by blockchain-specific frictions such as gas fees, and while on-chain transaction costs exceed inter-dealer spreads, they are comparable to the costs faced by many OTC clients outside preferred pricing tiers.
Second, information is incorporated into decentralized prices through both arbitrage and asymmetric-information channels. Arbitrageurs quickly eliminate cross-market price differences and anchor DEX prices to traditional benchmarks, including during stress episodes and around macroeconomic announcements. In contrast, persistent price effects arise from trades executed by sophisticated investors and primary dealers, whose order flow contains private information about exchange-rate fundamentals. LPs play a largely passive role, supplying liquidity but contributing little to price discovery.
These results highlight that, despite their modest size, blockchain-based currency markets already function as informationally linked extensions of traditional FX markets. As blockchain infrastructure matures and frictions decline, decentralized venues may increasingly serve as complementary platforms for trading and settlement, broadening access to FX markets and potentially reshaping the microstructure of cross-border finance.
Supplementary Material
To view supplementary material for this article, please visit http://doi.org/10.1017/S0022109026102841.
Funding Statement
Ranaldo acknowledges financial support from the Swiss National Science Foundation (SNSF grant 204721). Viswanath-Natraj acknowledges support from the Berkeley Ripple University Blockchain Research Initiative. We would like to thank Edouard Mattille and Peteris Kloks for assistance with the CLS Market Data.














 Open access

