


INTRODUCTION
Currently, we do not fully understand how environmental fluctuations may have affected the residential mobility and settlement patterns of Middle Stone Age (MSA) hunter-gatherer populations in southern Africa (Compton, Reference Compton2011; Kandel and Conard, Reference Kandel and Conard2012; McCall and Thomas, Reference McCall and Thomas2012; d'Errico et al., Reference d'Errico, Banks, Warren, Sgubin, van Niekerk, Henshilwood, Daniau and Sánchez Goñi2017). It is, however, likely that variation in the availability of marine and terrestrial resources affected subsistence strategies, hunting technology, and site use (e.g., Klein, Reference Klein1976; Volman, Reference Volman1978; Binford, Reference Binford1984; Thackeray, Reference Thackeray1988; Klein and Cruz-Uribe, Reference Klein and Cruz-Uribe2000; Henshilwood et al., Reference Henshilwood, Sealy, Yates, Cruz-Uribe, Goldberg, Grine, Klein, Poggenpoel, van Niekerk and Watts2001b; Fisher et al., Reference Fisher, Bar-Matthews, Jerardino and Marean2010; Marean et al., Reference Marean, Bar-Matthews, Fisher, Goldberg, Herries, Karkanas, Nilssen and Thompson2010, Reference Marean, Cowling and Franklin2020; Reynard and Henshilwood, Reference Reynard and Henshilwood2017). Some researchers have hypothesized that shifting access to natural resources during the MSA may have led to a fundamental restructuring of hunter-gatherer societies, affecting not only their mobility strategies and settlement patterns, but also impacting the nature and frequency of social interaction within and across different hunter-gatherer groups (McCall and Thomas, Reference McCall and Thomas2012; Mackay et al., Reference Mackay, Stewart and Chase2014; d'Errico et al., Reference d'Errico, Banks, Warren, Sgubin, van Niekerk, Henshilwood, Daniau and Sánchez Goñi2017). Such a restructuring could have stimulated the adoption of more complex social behaviors, in particular those involving more elaborate communication strategies, for example, the adoption of personal ornaments, engraved ostrich eggshells, and systematic use of ochre pigments (e.g., Henshilwood et al., Reference Henshilwood, d'Errico, Yates, Jacobs, Tribolo, Duller, Mercier, Sealy, Valladas, Watts and Wintle2002, Reference Henshilwood, d'Errico, van Niekerk, Dayet, Queffelec and Pollarolo2018; d'Errico et al., Reference d'Errico, Henshilwood, Vanhaeren and van Niekerk2005; Mackay and Welz, Reference Mackay and Welz2008; Texier et al., Reference Texier, Porraz, Parkington, Rigaud, Poggenpoel, Miller and Tribolo2010).
While some regional comparisons of southern African MSA assemblages appear to support a correlation between behavioral innovation and changes in population movement and interaction (Jacobs et al., Reference Jacobs, Roberts, Galbraith, Deacon, Grün, Mackay, Mitchell, Vogelsang and Wadley2008), testing this hypothesis on a local scale requires an analytical framework capable of robustly documenting short-term site use and subtle changes in occupational intensity. At most MSA sites, this type of high-resolution analysis has not been carried out systematically. However, faunal taphonomic studies at Klipdrift Shelter (Reynard et al., Reference Reynard, Discamps, Wurz, van Niekerk, Badenhorst and Henshilwood2016b) and Blombos Cave (Reynard and Henshilwood, Reference Reynard and Henshilwood2018) have linked trampling marks on bones to variations in human occupational activity. Additionally, at both Pinnacle Point (Karkanas et al., Reference Karkanas, Brown, Fisher, Jacobs and Marean2015) and Sibudu (de la Peña and Wadley, Reference de la Peña and Wadley2017), a combination of sediment-based studies and archaeological artifact analyses led to a better understanding of the nature and variation of episodic human activities during the MSA.
However, many key MSA sites are located in caves and rock shelters where the recurrent use of space has led to the destruction of the original prehistoric site configuration and has instead caused the formation of deep sedimentary sequences that are exceedingly difficult to decipher. Geoarchaeological and micromorphological investigations of such MSA contexts have demonstrated that their sedimentary sequences often are composed of centimeter- to millimeter-thick laminations, many of which were formed through frequent interactions between cultural and natural processes (Goldberg et al., Reference Goldberg, Miller, Schiegl, Ligouis, Berna, Conard and Wadley2009; Karkanas and Goldberg, Reference Karkanas and Goldberg2010; Wadley et al., Reference Wadley, Sievers, Bamford, Goldberg, Berna and Miller2011; Miller et al., Reference Miller, Goldberg and Berna2013, Reference Miller, Mentzer, Berthold, Leach, Ligouis, Tribolo, Parkington and Porraz2016). Because of the depositional complexities involved in the formation of MSA deposits, the application of geoarchaeological methods to study the local archaeostratigraphy in high resolution has been central in refining the nature, order, and scale of prehistoric depositional events, as well as characterizing the environmental and occupational setting in which MSA cultural and technological innovations took place (e.g., Goldberg et al., Reference Goldberg, Miller, Schiegl, Ligouis, Berna, Conard and Wadley2009; Karkanas and Goldberg, Reference Karkanas and Goldberg2010; Wadley et al., Reference Wadley, Sievers, Bamford, Goldberg, Berna and Miller2011; Miller et al., Reference Miller, Goldberg and Berna2013, Reference Miller, Mentzer, Berthold, Leach, Ligouis, Tribolo, Parkington and Porraz2016; Karkanas et al., Reference Karkanas, Brown, Fisher, Jacobs and Marean2015).
Encouraged by recent developments in high-resolution geoarchaeological methods (e.g., Goldberg et al., Reference Goldberg, Dibble, Berna, Sandgathe, McPherron and Turq2012; Miller et al., Reference Miller, Goldberg and Berna2013; Aldeias et al., Reference Aldeias, Goldberg, Dibble and El-Hajraoui2014; Haaland et al., Reference Haaland, Friesem, Miller and Henshilwood2017, Reference Haaland, Czechowski, Carpentier, Lejay and Vandermeulen2019), our goal in this paper is to assess whether changes in local site use and occupational intensity occurred at Blombos Cave during Marine Oxygen Isotope Stages (MIS) 5b-4 (ca. 88–72 ka ago). While the recovered archaeological record from this site has yielded a wealth of information on the development of MSA material culture, technology, subsistence strategies, and local paleoenvironment, no detailed investigation of the cave deposits has so far been published (but see Tærud, Reference Tærud2011). Yet, throughout multiple excavation seasons, more than 40 micromorphological block samples (ca. 90 thin sections) and associated bulk sediment samples have been collected. By combining archaeological micromorphology and microspectroscopy with 3D and high-resolution field documentation, we have selected 13 of these blocks to specifically track patterns of site use and occupational intensity in three discrete and laterally extensive MSA occupation phases: M3 CI phase (88 ka), the Upper M2 phase (77 ka), and the M1 phase (72 ka). Based on thin section observations of these occupation phases, we use an archaeological microfacies approach (Courty, Reference Courty, Goldberg, Holliday and Ferring2001; Goldberg et al., Reference Goldberg, Miller, Schiegl, Ligouis, Berna, Conard and Wadley2009; Villagran et al., Reference Villagran, Balbo, Madella, Vila and Estevez2011; Miller et al., Reference Miller, Goldberg and Berna2013; Karkanas et al., Reference Karkanas, Brown, Fisher, Jacobs and Marean2015) to classify distinct human campsite activities and to map the lateral and vertical distribution of these activities across the site and through the MSA sequence. Finally, we discuss how the observed microstratigraphic indicators of site use and occupation intensity allow us to assess continuity and shifts in site use during the MSA at Blombos Cave, and we contextualize our new sediment-based results within the taphonomic, paleoenvironmental, and archaeological framework already established at the site.
Assessing prehistoric site use and occupational intensity from multiple proxies
In previous studies of prehistoric campsites, researchers have applied several strategies to evaluate residential mobility and settlement patterns (e.g., Parkington et al., Reference Parkington, Nilssen, Reeler and Henshilwood1992; Conard, Reference Conard2004 and references therein). One common approach has been the study of physical site structure and campsite configurations (Wadley, Reference Wadley2001; Henshilwood, Reference Henshilwood, D'Errico and Backwell2005; Stiner, Reference Stiner2009) and the assessment of changes in site use and occupational intensity over time (Munro, Reference Munro2004; Conard, Reference Conard2011). Multiple ethnographic and archaeological studies show that hunter-gatherer mobility patterns often reflect the way these groups use, maintain, and physically organize their campsites (e.g., Yellen, Reference Yellen1977; Brooks and Yellen, Reference Brooks, Yellen and Kent1987; Hitchcock, Reference Hitchcock and Kent1987; Kelly, Reference Kelly1992; Koetje, Reference Koetje1994; Binford, Reference Binford, Conard and Wendorf1998; Kent, Reference Kent and Kent1998). Consequently, if significant changes in occupation intensity and residential mobility occurred in southern Africa during the MSA, and in Blombos Cave specifically, this ought to be reflected in the structuring of space within MSA sites.
Munro (Reference Munro2004, p. 7) defines site occupation intensity as “the number of human hours a site was occupied per unit time,” which, for hunter-gatherer societies, can be linked to their degree of mobility across a landscape. An increase in occupational intensity can be the result of multiple factors, including: (1) an increase in the number of people visiting; (2) an increase in the length of occupation; or (3) an increase in the frequency of visits (Munro, Reference Munro2004; Conard, Reference Conard2011).
Many researchers have attempted to assess occupational intensity by examining changes in the density (per unit time) of cultural artifact types or faunal material throughout a sequence (e.g., Henshilwood et al., Reference Henshilwood, Sealy, Yates, Cruz-Uribe, Goldberg, Grine, Klein, Poggenpoel, van Niekerk and Watts2001b; Wurz, Reference Wurz2002; Porraz et al., Reference Porraz, Parkington, Rigaud, Miller, Poggenpoel, Tribolo and Archer2013; Will et al., Reference Will, Bader and Conard2014; Reynard et al., Reference Reynard, Discamps, Wurz, van Niekerk, Badenhorst and Henshilwood2016b). However, this approach has been viewed critically by other researchers, who point out that changes in artifact density alone can be a function of more than just amount of activity, for example, changes in reduction sequence or butchering strategy (Hiscock, Reference Hiscock1981; Barton and Riel-Salvatore, Reference Barton and Riel-Salvatore2014) or variation in sedimentation rates (Jerardino, Reference Jerardino1995, Reference Jerardino2016).
Occupation intensity and hunter-gatherer mobility patterns can also be studied through site-structure analysis (e.g., Kelly, Reference Kelly1992; Koetje, Reference Koetje1994; Goldberg et al., Reference Goldberg, Miller, Schiegl, Ligouis, Berna, Conard and Wadley2009). Many ethnographic studies of hunter-gatherer site use have documented a range physical proxies that might be used to infer depositional processes and patterns indicative of the mode of occupation (e.g., Marshall, Reference Marshall1976; Murray, Reference Murray1980; Lee, Reference Lee1984; Kent, Reference Kent1984; Hitchcock, Reference Hitchcock2004). For example, in the arrangement of living space among San people in the Kalahari, hearths and fireplaces are central features that directly structure the activity areas that surround them (Marshall, Reference Marshall1976). The placement, frequency, and sizes of hearths vary according to the number of users, as well as the frequency and types of use. While the domestic activities around the fireplaces include working, relaxing, and sleeping, Yellen (Reference Yellen1977) observes that when it comes to formal spatial division, few clear distinctions can be made between areas where subsistence and manufacturing processes occur. This is particularly true when occupants have resided in the same place for longer periods. Brooks and Yellen (Reference Brooks, Yellen and Kent1987) report that in !Kung camps that are occupied for shorter periods, debris is left to accumulate in situ around the hearths, but in the case of long-term occupations, refuse, food waste, and ash are periodically dumped outside a defined perimeter of the camp. Kelly (Reference Kelly1992, p. 56) points out that “the distribution of remains may be a better indicator of residential mobility since this appears to be more directly related to the length of time a location is occupied.”
Goldberg et al.'s (Reference Goldberg, Miller, Schiegl, Ligouis, Berna, Conard and Wadley2009) study of site-formation processes at Sibudu demonstrates how prehistoric hunter-gatherer campsite structure may be investigated from a process-oriented and depositional viewpoint in an MSA context. The usefulness of their microcontextual approach is most evident in their identification and discussion of domestic site-maintenance activities, such as structured disposal of secondary waste, hearth cleaning and rake-out, investment in floor preparation and refurbishment and cleaning of bedding. By systematically identifying and tracking these activities vertically through the sequence at Sibudu, both Goldberg et al. (Reference Goldberg, Miller, Schiegl, Ligouis, Berna, Conard and Wadley2009) and Wadley et al. (Reference Wadley, Sievers, Bamford, Goldberg, Berna and Miller2011) were able to document diachronic changes in site structure and occupation intensity, that is, bedding constructions, burning practices, and other forms of site maintenance gradually increased during the Still Bay–Howiesons Poort (HP) transition (73–58 ka). The post-HP levels at Sibudu are in particular characterized by rapid accumulation of anthropogenically derived deposits (Goldberg et al., Reference Goldberg, Miller, Schiegl, Ligouis, Berna, Conard and Wadley2009; Wadley et al., Reference Wadley, Sievers, Bamford, Goldberg, Berna and Miller2011), and de la Peña and Wadley (Reference de la Peña and Wadley2017) have hypothesized that the co-occurrence of: (1) increased technological variability and (2) the intensification of site use and domestic activities indicates that the HP to post-HP transition at Sibudu was characterized by a reduction in residential mobility and an increase of longer-term occupations.
Unlike at Sibudu, Karkanas et al. (Reference Karkanas, Brown, Fisher, Jacobs and Marean2015) do not see any major diachronic changes in the types of anthropogenic deposits at Pinnacle Point (PP 5-6) during the MIS 5 to MIS 4 transition. Instead, they note an increase in the frequency of occupation horizons. Specifically, they found that during MIS 5, the occupations were characterized by numerous, single, and often intact hearth features that they argue conform to a site occupation pattern dominated by shorter visits, presumably by smaller groups. At the onset of MIS 4, this pattern changes with the increased occurrence of thicker anthropogenic lenses and more reworked and burnt deposits. Karkanas et al. (Reference Karkanas, Brown, Fisher, Jacobs and Marean2015) argue that these types of deposits are indicative of more intensive use of the site and note that such intensification coincided with both technological innovation (Brown et al., Reference Brown, Marean, Jacobs, Schoville, Oestmo, Fisher, Bernatchez, Karkanas and Matthews2012) and possibly also with demographic stability or growth, as suggested by the abundance of MIS 4 sites in the Cape region overall (Henshilwood, Reference Henshilwood2012; Lombard, Reference Lombard2012; Mackay et al., Reference Mackay, Stewart and Chase2014).
Microcontextual site-structure research at sites like Sibudu and Pinnacle Point has demonstrated the importance of high-resolution sediment-based studies when assessing the occurrence and variations in prehistoric campsite activities. However, if we consider the ethnographic accounts of site-formation processes at contemporary hunter-gatherer campsites, we must also acknowledge that the spatial distribution of occupational debris can be laterally highly variable. To robustly study diachronic changes in MSA site-use occupation patterns at Blombos Cave, therefore, a laterally extensive, multiscale, and microcontextual investigation of the occupation deposits is adopted in this paper.
BLOMBOS CAVE: THE SITE AND ARCHAEOLOGICAL CONTEXT
Site location, geography, and geologic setting
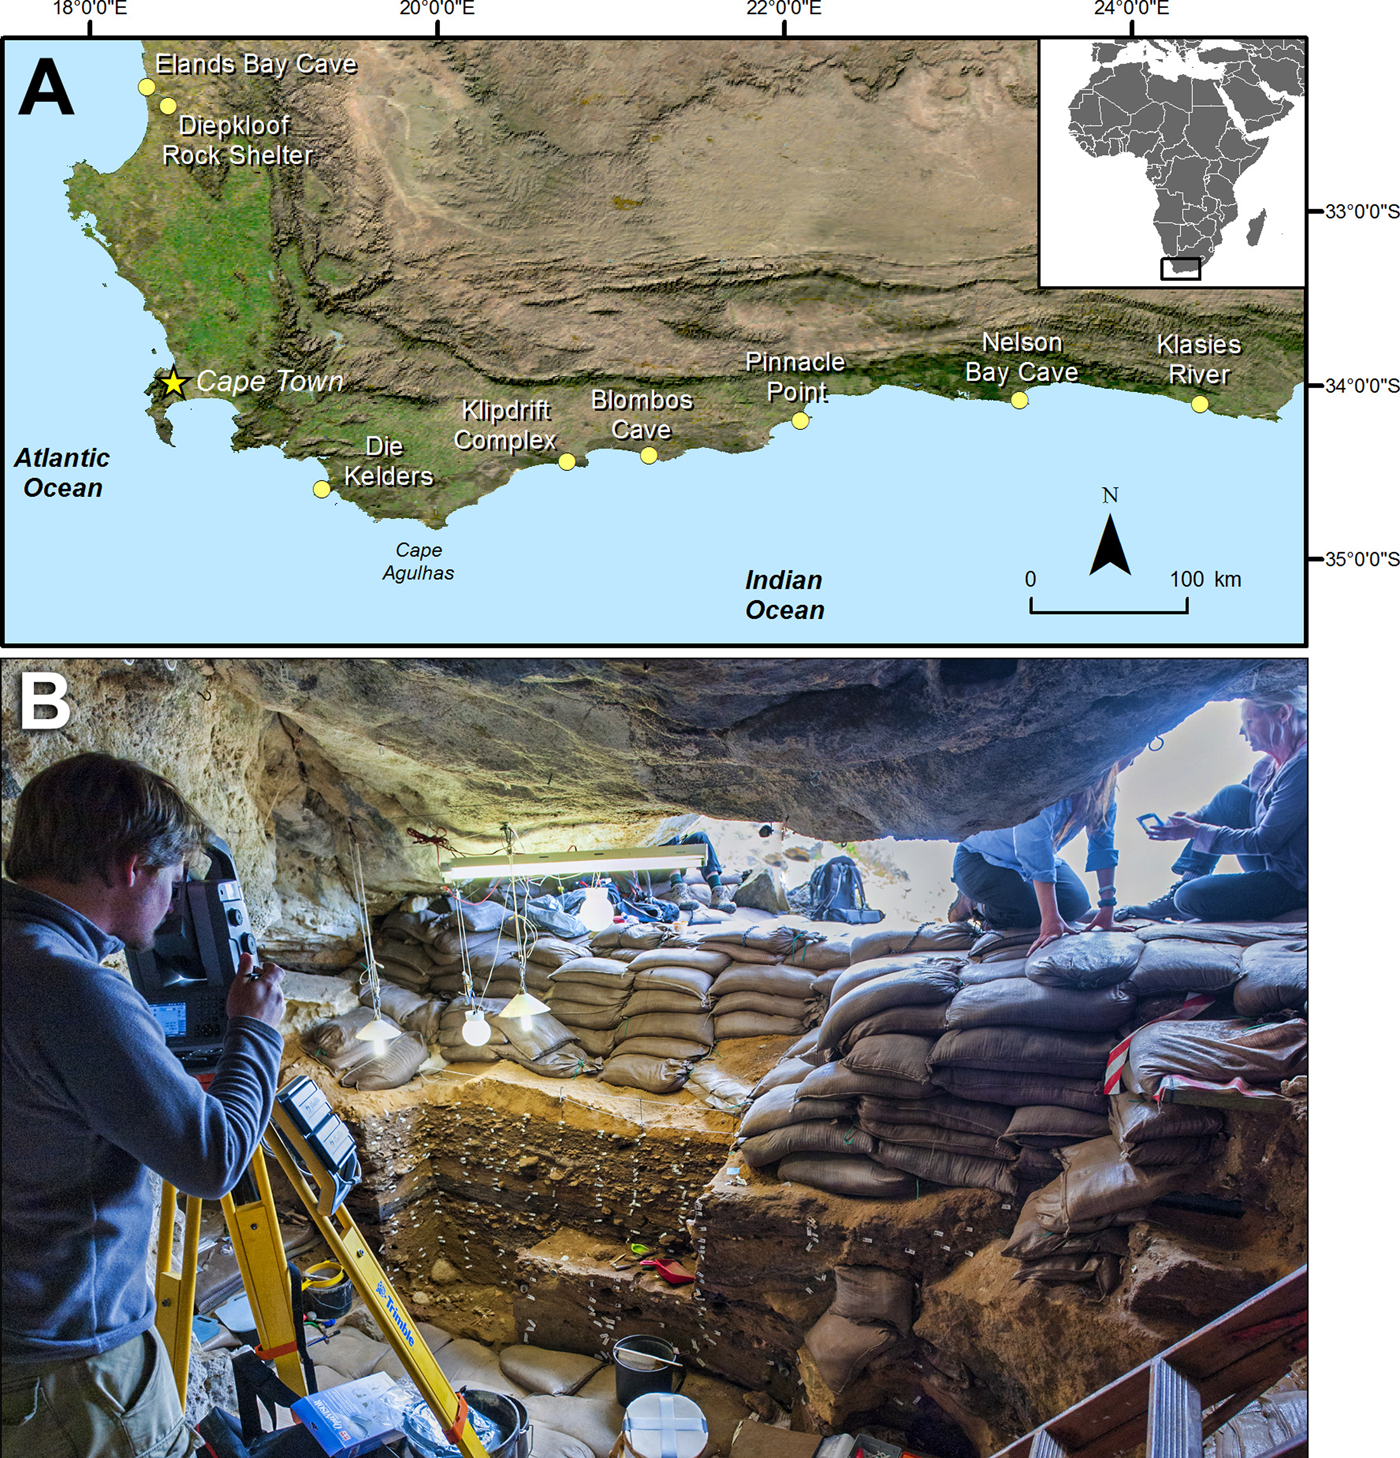
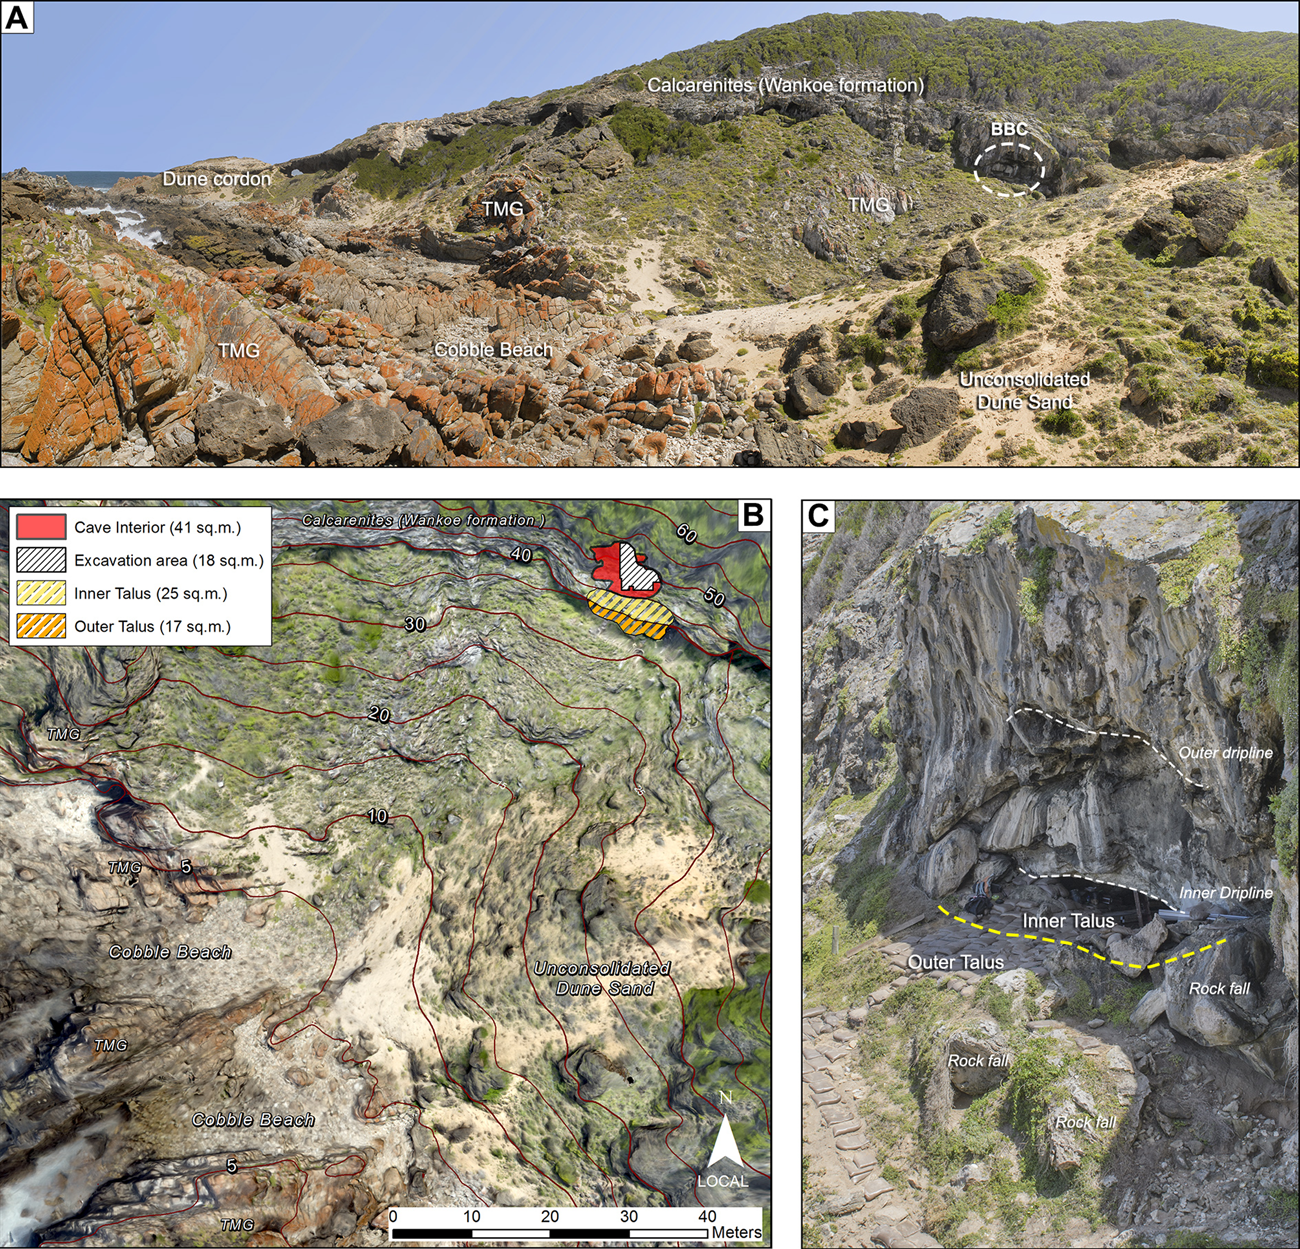
Blombos Cave is located in Blombos Private Nature Reserve ca. 300 km east of Cape Town on the southern coast of South Africa (Fig. 1). The cave is situated in a south-facing calcarenite cliff, around 34.5 m above modern sea level and about 80 m from the present-day shoreline (Fig. 2). The Table Mountain Group (TMG) sandstones (folded and faulted Paleozoic sediments of the Cape Supergroup) constitute the basal geological unit of the Blombos coastline to the east and west of the cave and exhibit a highly irregular topography with major bedrock depressions. The TMG is overlain by the Cenozoic formations of the Bredasdorp group. The Bredasdorp group, which consists of a succession of limestones, sandy limestones, sandstones, and conglomerates, has been divided into several lithostratigraphic formations, each of which has been associated with marine and coastal events (Malan, Reference Malan1990).
(color online) (A) Location of Blombos Cave, South Africa and (B) photograph of Blombos Cave interior, toward the cave mouth.
(color online) (A) Landscape and topographic features outside Blombos Cave (BBC); (B) planar overview of Blombos Cave and its surroundings; and (C) close-up view of the Blombos Cave talus and entrance area. TMG, Table Mountain Group.
At the base, the Bredasdorp group includes the Mio-Pliocene shallow-marine and eolian deposits of the De Hoopvlei and the Wankoe Formations; it is within these that Blombos Cave formed, at the contact with the underlying TMG. The De Hoopvlei Formation is characterized by low-angle cross-bedding, lenses of cobble conglomerate, coarse shelly sands, and gravels, in addition to distinct horizons of green glauconitic grains (Malan et al., Reference Malan, Viljoen, Siegfried and Wickens1994). The calcarenites of the Wankoe Formation, which volumetrically comprises the bulk of the Bredasdorp Group and may be up to 300 m thick in places, consists of eolian cross-bedding and calcrete lenses containing calcareous, shelly, and quartz-rich sands with inclusions of glauconitic minerals (Malan, Reference Malan1990).
At the seaward edge of the reserve, and overlying the Bredasdorp Formation, we find heavily weathered and often capped remains of consolidated late Pleistocene and Holocene eolianites, on top of which partially vegetated unconsolidated dune sand is situated (Fig. 2). Today, therefore, the coastline close to Blombos Cave exhibits a topographically rugged and varied terrain, dominated by steep, wave-cut, and eroded coastal, calcified dune cordons, calcrete hardpans, calcarenites, and eolianites of different ages.
Cave topography and excavation area
At the cave mouth and in front of the dripline, the talus forms a gently sloping platform of about 25 m2 (see Fig. 2B and C, inner and outer talus), before it extends and abruptly drops down 34.5 m southward, toward the shoreline below. The unconsolidated talus, which contains both Later and Middle Stone Age materials, is stabilized by several large rocks and blocks. The blocks, which appear to have fallen from the rock face above sometime during the MSA occupations, have effectively prevented site erosion and allowed sediments to accumulate and stabilize behind them.
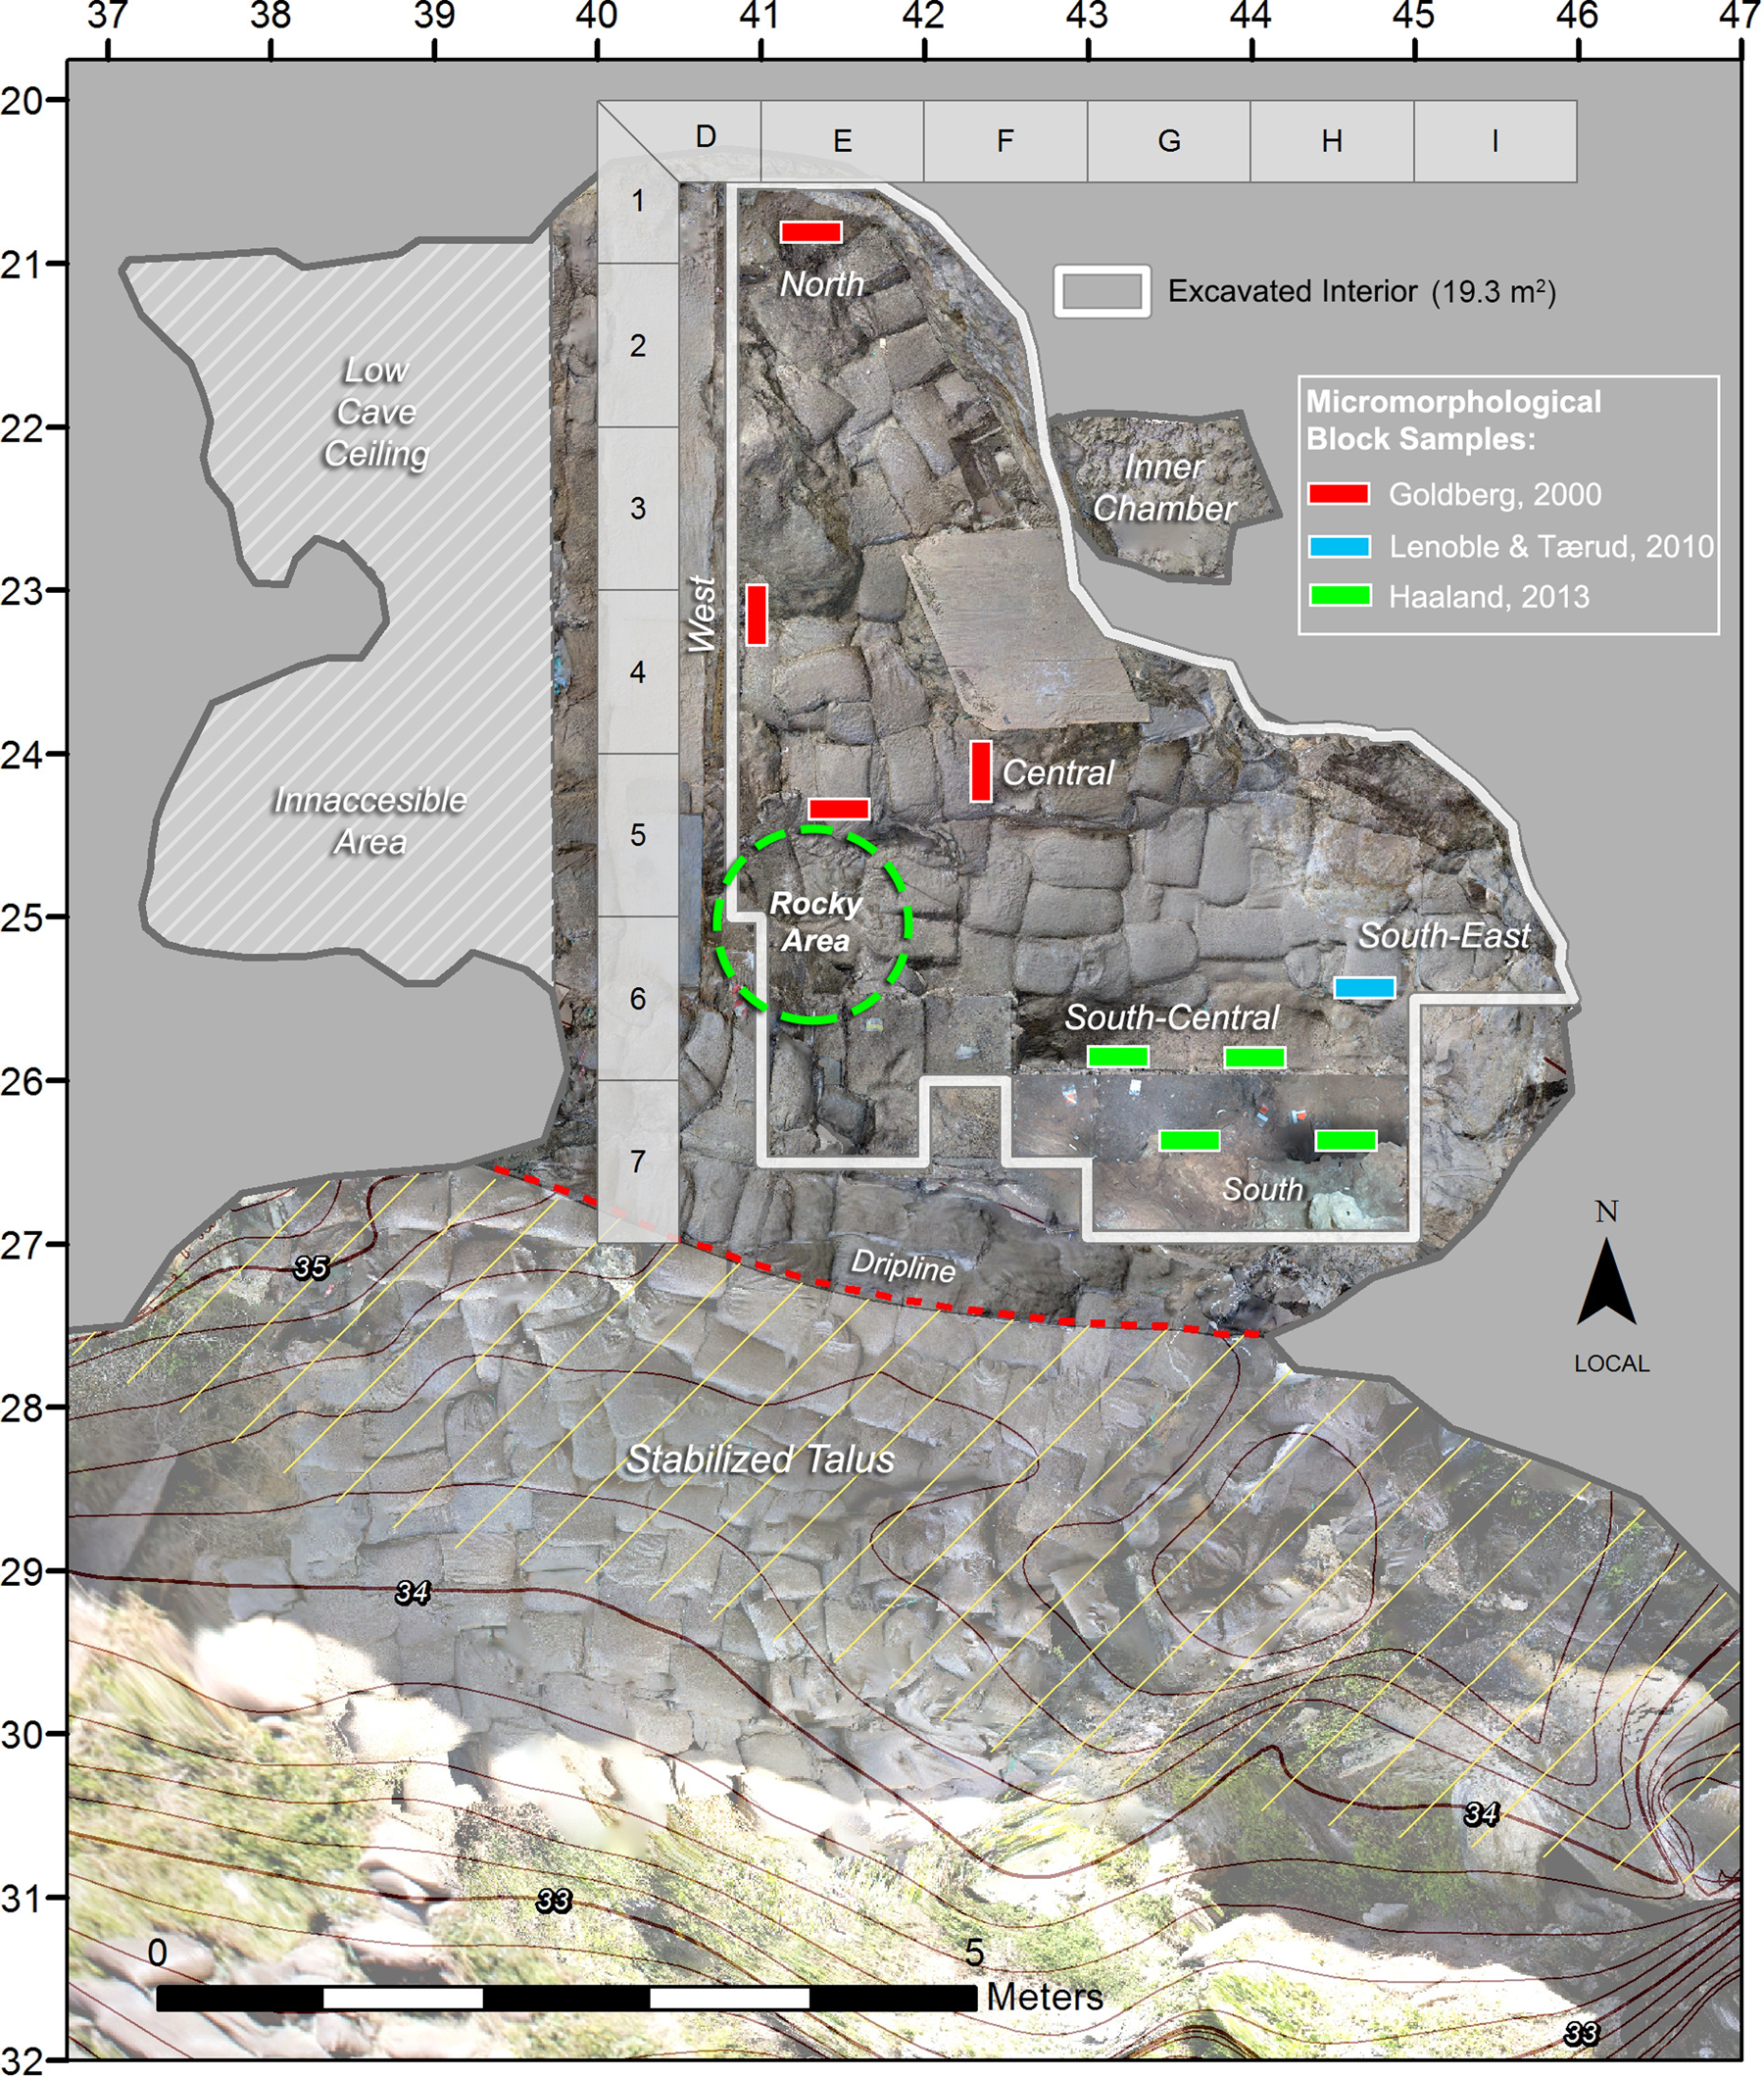
When excavations started at Blombos Cave in 1991, the cave entrance was partially sealed by dune sand, and about 20 cm of sterile eolian deposits covered the interior Later Stone Age deposit (Henshilwood, Reference Henshilwood2008a). The interior excavation of Blombos Cave is now composed of a single excavated area of ca. 19 m2, while the entire interior cave surface amounts to around 41 m2 behind the dripline (Figs. 2 and 3). West of the main excavation area, the surface deposit extends inwardly 3–5 m. Here the cave ceiling lowers to a point where it falls level with the surface, preventing access to the sediments beneath. In the area northeast of the main chamber, deposits extend into a low-lying antechamber; referred to as the Inner Chamber in Figure 3. In our investigation of cave sediments, we divide the interior area of Blombos Cave into seven sectors: north, west, below rocky area, central, south-central, southeast (Fig. 3).
(color online) Site map showing the Blombos Cave topography, excavated area, interior sectors, and geoarchaeological block sampling locations. The season of sampling is indicated after the last name of the collector (e.g. Haaland, 2013).
Archaeostratigraphy and chronology
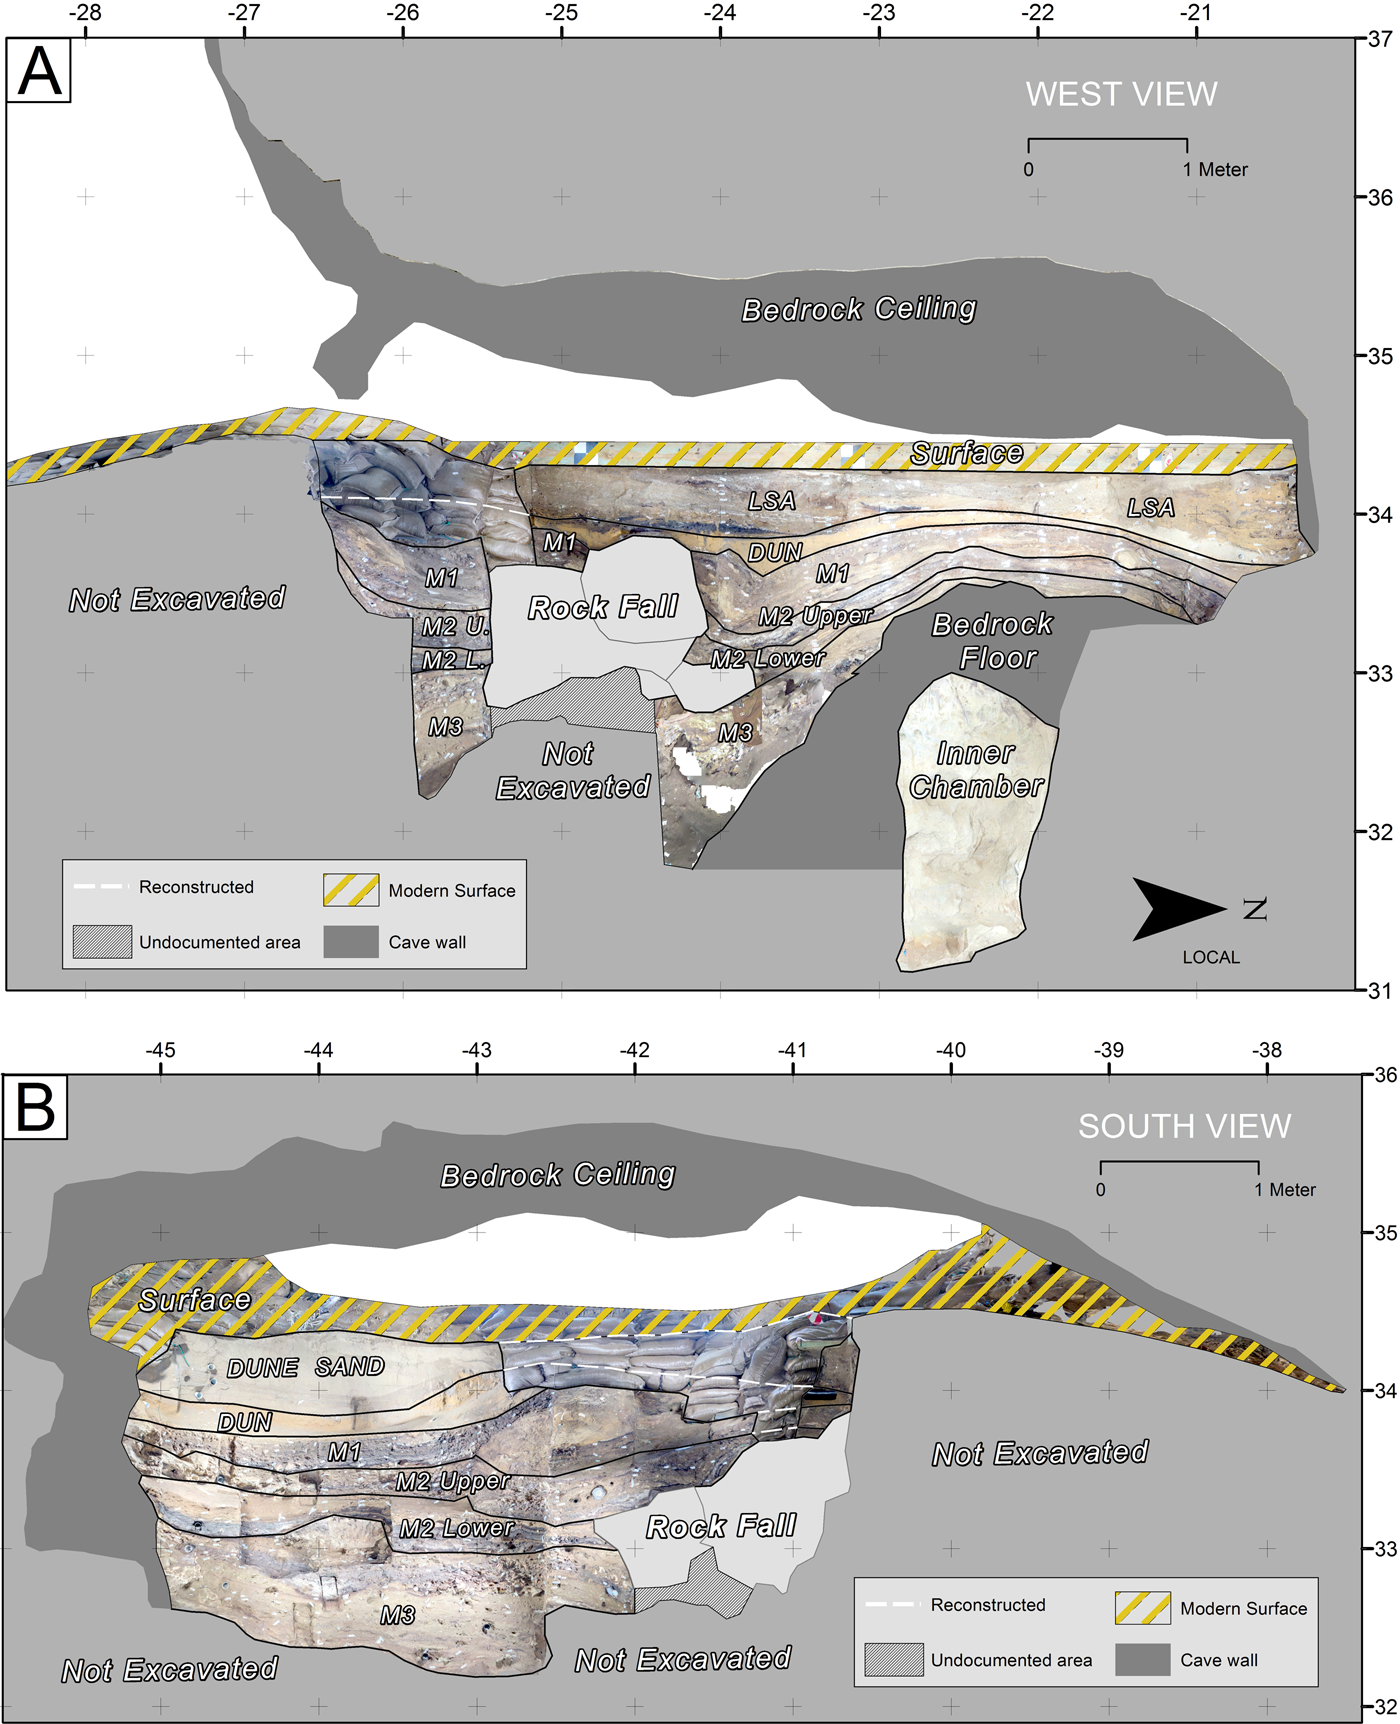
Excavators at Blombos Cave have documented a ca. 3-m-deep, well-stratified sedimentary sequence largely consisting of unconsolidated quartz- and calcareous-rich sand. The sequence can be divided into three major lithostratigraphic layers (Henshilwood et al., Reference Henshilwood, Sealy, Yates, Cruz-Uribe, Goldberg, Grine, Klein, Poggenpoel, van Niekerk and Watts2001b; Henshilwood, Reference Henshilwood2008a; Fig. 4). The basal layer is composed of laminated sandy deposits containing MSA artifacts, shellfish, faunal remains, organic-rich lenses, and combustion features. Above this, in the upper-middle part of the sequence, lies a 5- to 40-cm-thick horizon dominated by iron-stained (yellow), coarse, and shelly sand, which represents an occupational hiatus (layer: DUN). A 30- to 40-cm-thick sandy and laminated deposit is situated on top of DUN and contains Later Stone Age material. The lithostratigraphic layers associated with human occupation of the cave have been further subdivided into broader archaeostratigraphic phases (MSA: M3, Lower M2, Upper M2 and M1; and LSA (Later Stone Age): L3, L2, and L1) (Henshilwood, Reference Henshilwood2008a). These phases have been further subdivided during excavation into centimeter-thick archaeostratigraphic units, based on their sedimentary texture, composition, color, thickness, and content (see Fig. 5). For analytical reasons and original to this paper, we have further divided the M3 phase into three additional subphases: Lower M3, M3 CI, and Upper M3. The subphase M3 CI consists of the following archaeostratigraphic units: CI, CIA, CIB, and CIBh2.
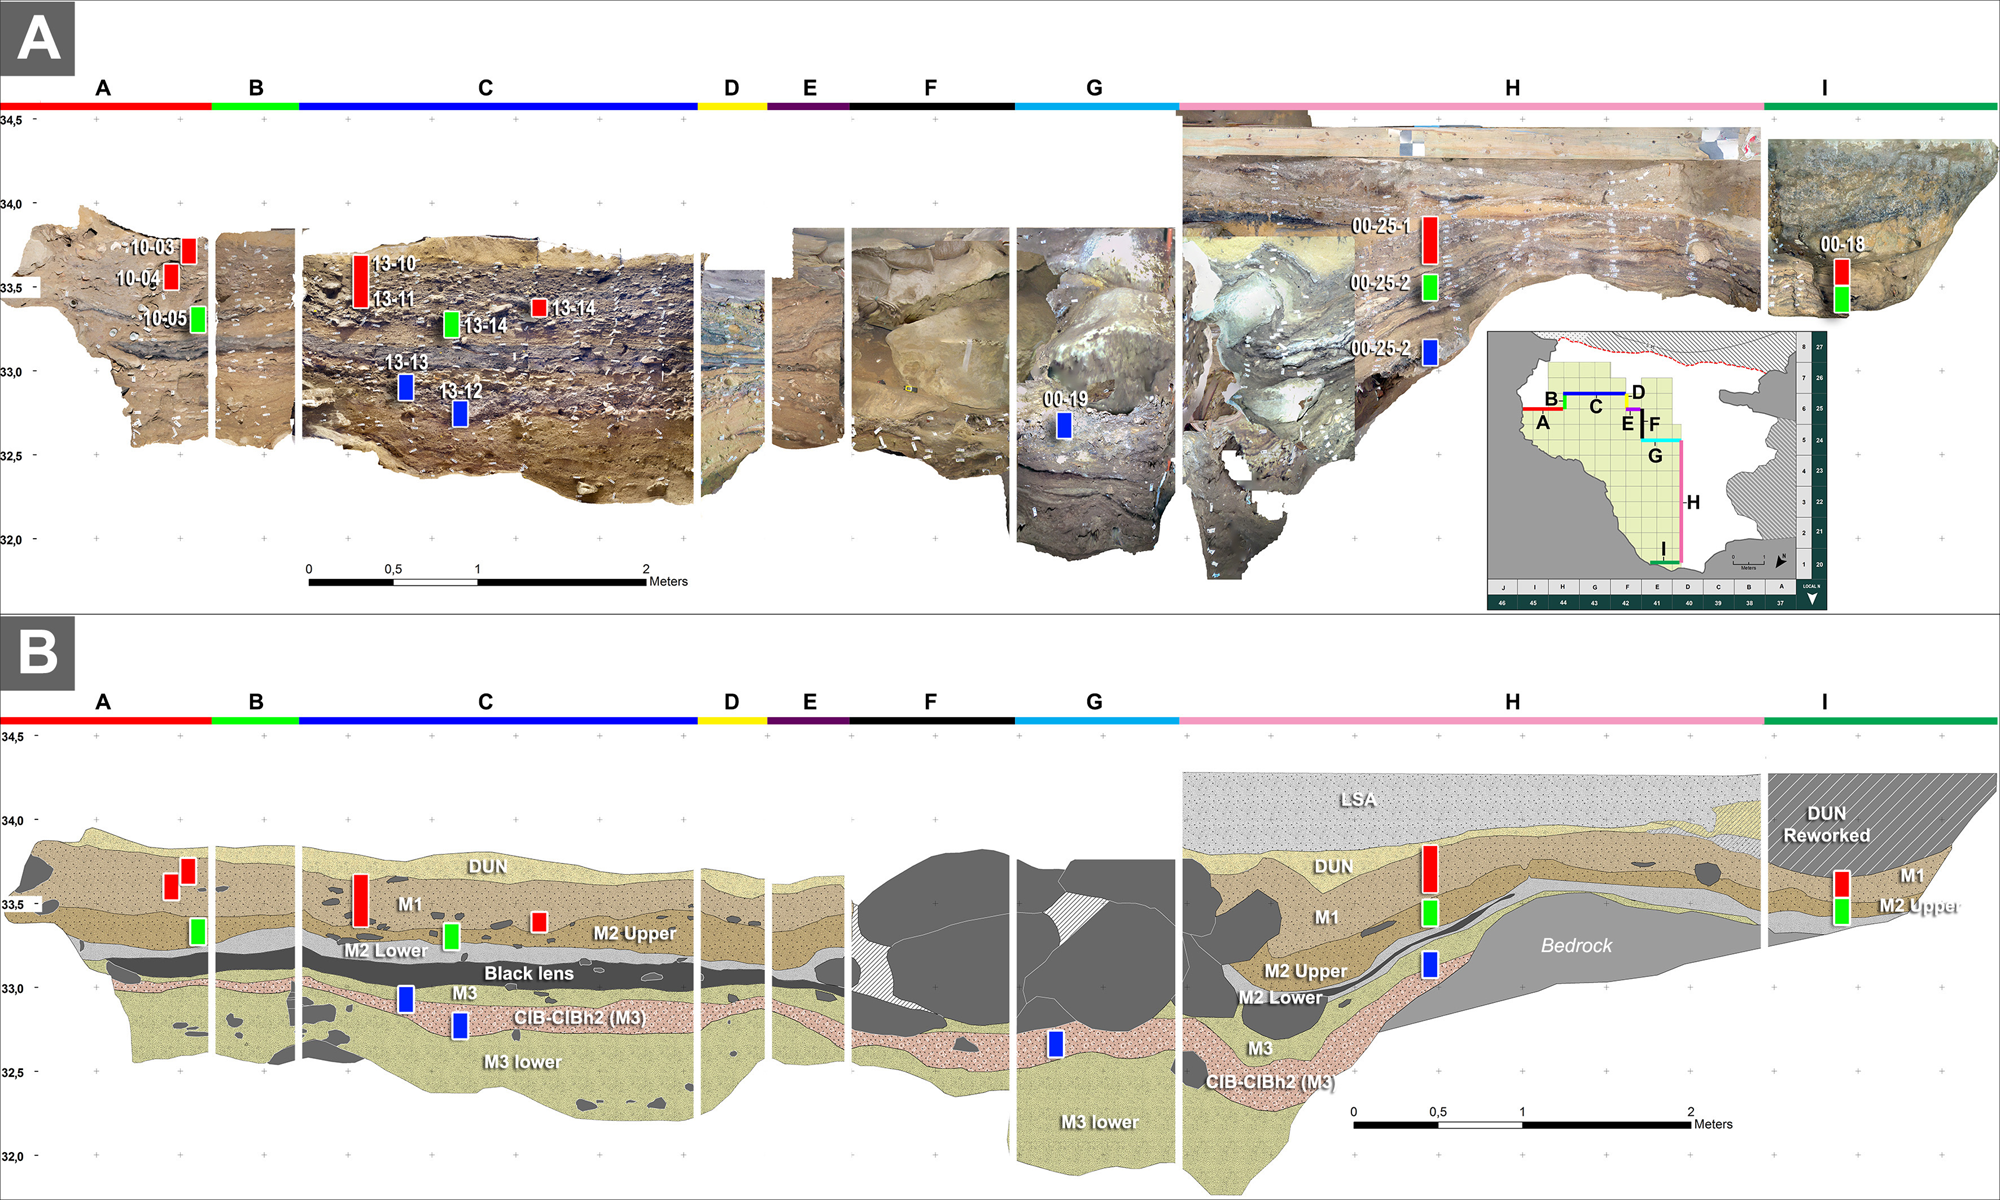
(color online) Blombos Cave interior archaeostratigraphy: (A) west section view (Y = 40.5–41 on Fig. 2); (B) south section view (X = 25.5–26.5 on Fig. 2). Note rockfall area in the central area of the cave, which for a long time prevented a direct comparison of the stratigraphic sequences in the southern and western parts of the cave. LSA, Later Stone Age. DUN, archaeostratigraphic layer Dune.
The Middle Stone Age (MSA) sequence of Blombos Cave (southern section) showing archaeostratigraphic units and main occupation phases. Optically stimulated luminescence (OSL) age estimates from Jacobs et al. (Reference Jacobs, Jones, Cawthra, Henshilwood and Roberts2019) and thermoluminescence (TL) ages from (Tribolo et al., Reference Tribolo, Mercier, Selo, Valladas, Joron, Reyss, Henshilwood, Sealy and Yates2006). A projection of plotted MSA artifacts (n = 895) is shown as green (lithics), blue (faunal material), and red (other material, i.e., ochre, eggshell, personal ornaments) dots on half of the section wall. Occupational phases investigated in this paper are marked in yellow: (1) M1 phase (Still Bay); (2) Upper M2 phase (Initial Still Bay); and (3) M3 CI phase. (For interpretation of the references to color in this figure legend, the reader is referred to the web version of this article.)
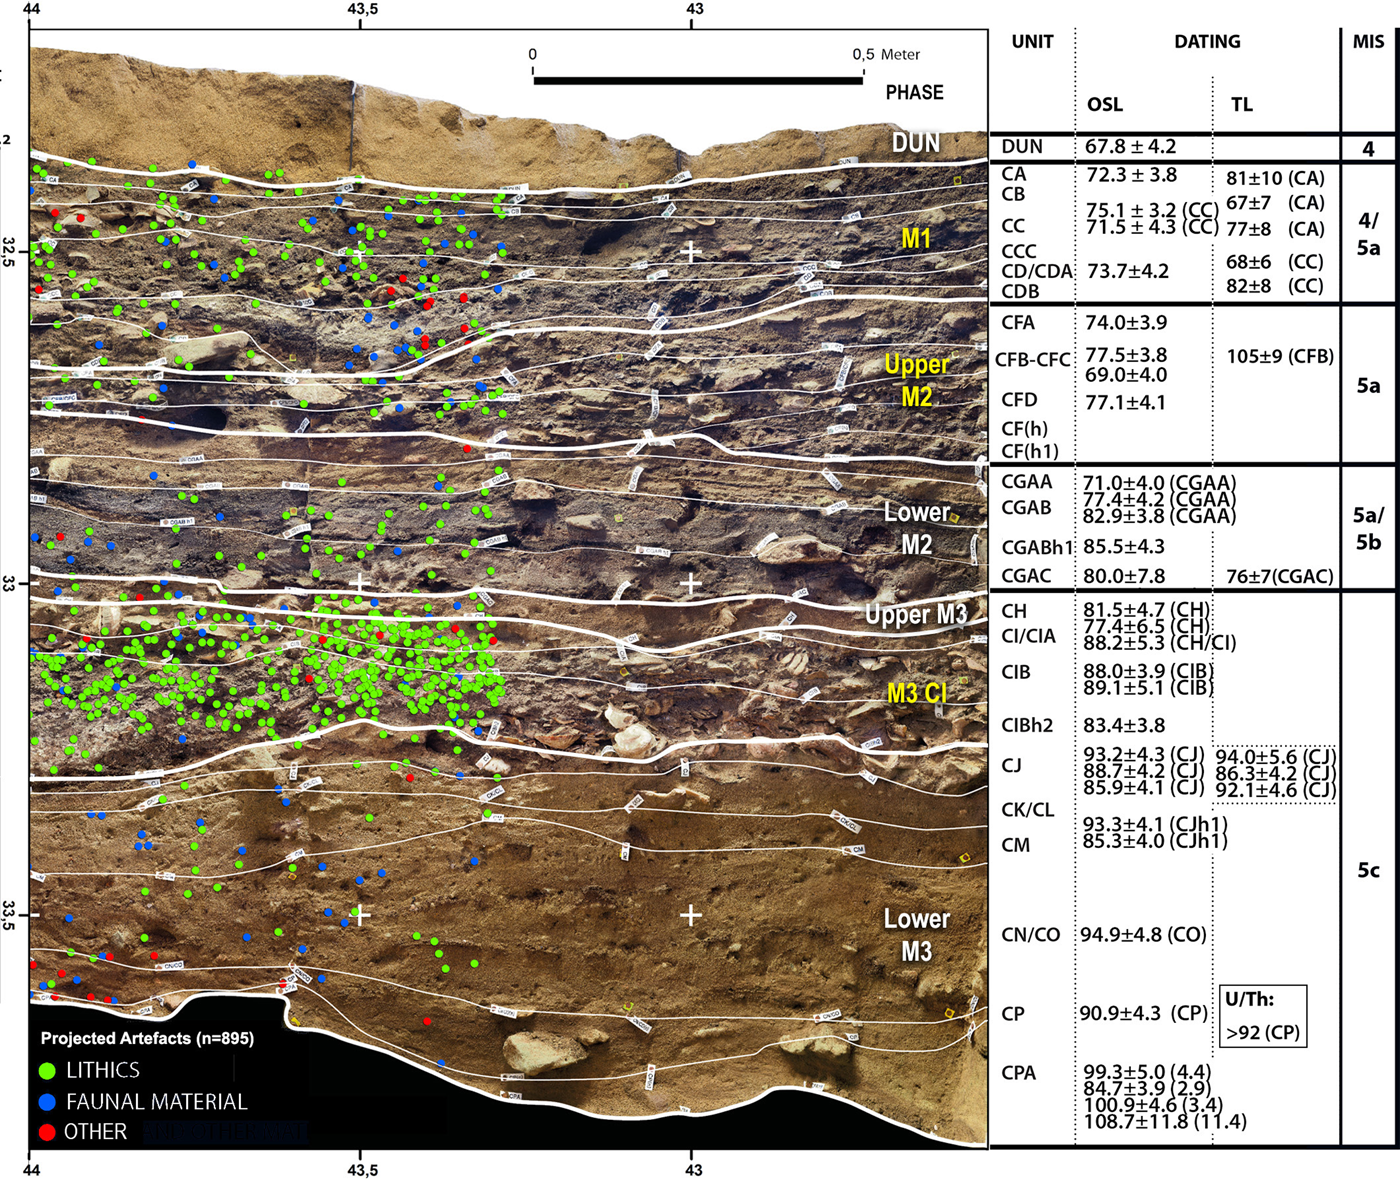
While the LSA sequence has been radiocarbon dated to 2000–290 yr BP (Henshilwood, Reference Henshilwood1995, Reference Henshilwood2008a), the MSA deposits have been dated to ca. 101–72 ka (Fig. 5) through a number of methods, including thermoluminescence (Tribolo et al., Reference Tribolo, Mercier, Selo, Valladas, Joron, Reyss, Henshilwood, Sealy and Yates2006), optically stimulated luminescence (Jacobs et al., Reference Jacobs, Duller, Wintle and Henshilwood2006, Reference Jacobs, Hayes, Roberts, Galbraith and Henshilwood2013, Reference Jacobs, Jones, Cawthra, Henshilwood and Roberts2019; Jacobs and Roberts, Reference Jacobs and Roberts2017), uranium-thorium series (Henshilwood et al., Reference Henshilwood, d'Errico, van Niekerk, Coquinot, Jacobs, Lauritzen, Menu and García-Moreno2011), and electron spin resonance (Jones, Reference Jones2001).
The MSA record in Blombos Cave
Arguably the most significant material from Blombos Cave, which has been assigned to the Still Bay techno-complex (M1 and Upper M2 phase), includes engraved ochre pieces (Henshilwood et al., Reference Henshilwood, d'Errico, Yates, Jacobs, Tribolo, Duller, Mercier, Sealy, Valladas, Watts and Wintle2002; Henshilwood et al., Reference Henshilwood, d'Errico and Watts2009), a cross-hatched pattern drawn on a silcrete flake with an ochre crayon (Henshilwood et al., Reference Henshilwood, d'Errico, van Niekerk, Dayet, Queffelec and Pollarolo2018), engraved bone (d'Errico et al., Reference d'Errico, Henshilwood and Nilssen2001), perforated marine shell beads showing diachronic variation in stringing style (Henshilwood et al., Reference Henshilwood, d'Errico, Vanhaeren, van Niekerk and Jacobs2004; d'Errico et al., Reference d'Errico, Henshilwood, Vanhaeren and van Niekerk2005, Reference d'Errico, Vanhaeren, Van Niekerk, Henshilwood and Erasmus2013; Vanhaeren et al., Reference Vanhaeren, d'Errico, van Niekerk, Henshilwood and Erasmus2013), and formal bone tools (Henshilwood and Sealy, Reference Henshilwood and Sealy1997; Henshilwood et al., Reference Henshilwood, d'Errico, Marean, Milo and Yates2001a; d'Errico and Henshilwood, Reference d'Errico and Henshilwood2007). The Still Bay lithic assemblage at Blombos is dominated by the presence of more than 500 bifacially worked stone points, many of which show signs of pressure flaking and heat treatment (Villa et al., Reference Villa, Soressi, Henshilwood and Mourre2009; Mourre et al., Reference Mourre, Villa and Henshilwood2010; Soriano et al., Reference Soriano, Villa, Delagnes, Degano, Pollarolo, Lucejko, Henshilwood and Wadley2015). The lithics recovered from the lower MSA levels in Blombos (M3) are less abundant and show less variety than in the later MSA phases (M1 and Upper M2) (Henshilwood et al., Reference Henshilwood, Sealy, Yates, Cruz-Uribe, Goldberg, Grine, Klein, Poggenpoel, van Niekerk and Watts2001b). Douze et al. (Reference Douze, Wurz and Henshilwood2015) report that the lithic assemblage from the M3 phase is characterized by the in situ production of blanks, blades, and flakes using multiple core-reduction methods. In the lower parts of the M3 sequence (unit CP/CPA), dated to ca. 101 ka, a multicomponent ochre-processing kit has also been recovered (Henshilwood et al., Reference Henshilwood, d'Errico, van Niekerk, Coquinot, Jacobs, Lauritzen, Menu and García-Moreno2011).
Densities of recovered MSA material in Blombos Cave by archaeostratigraphic units and phases
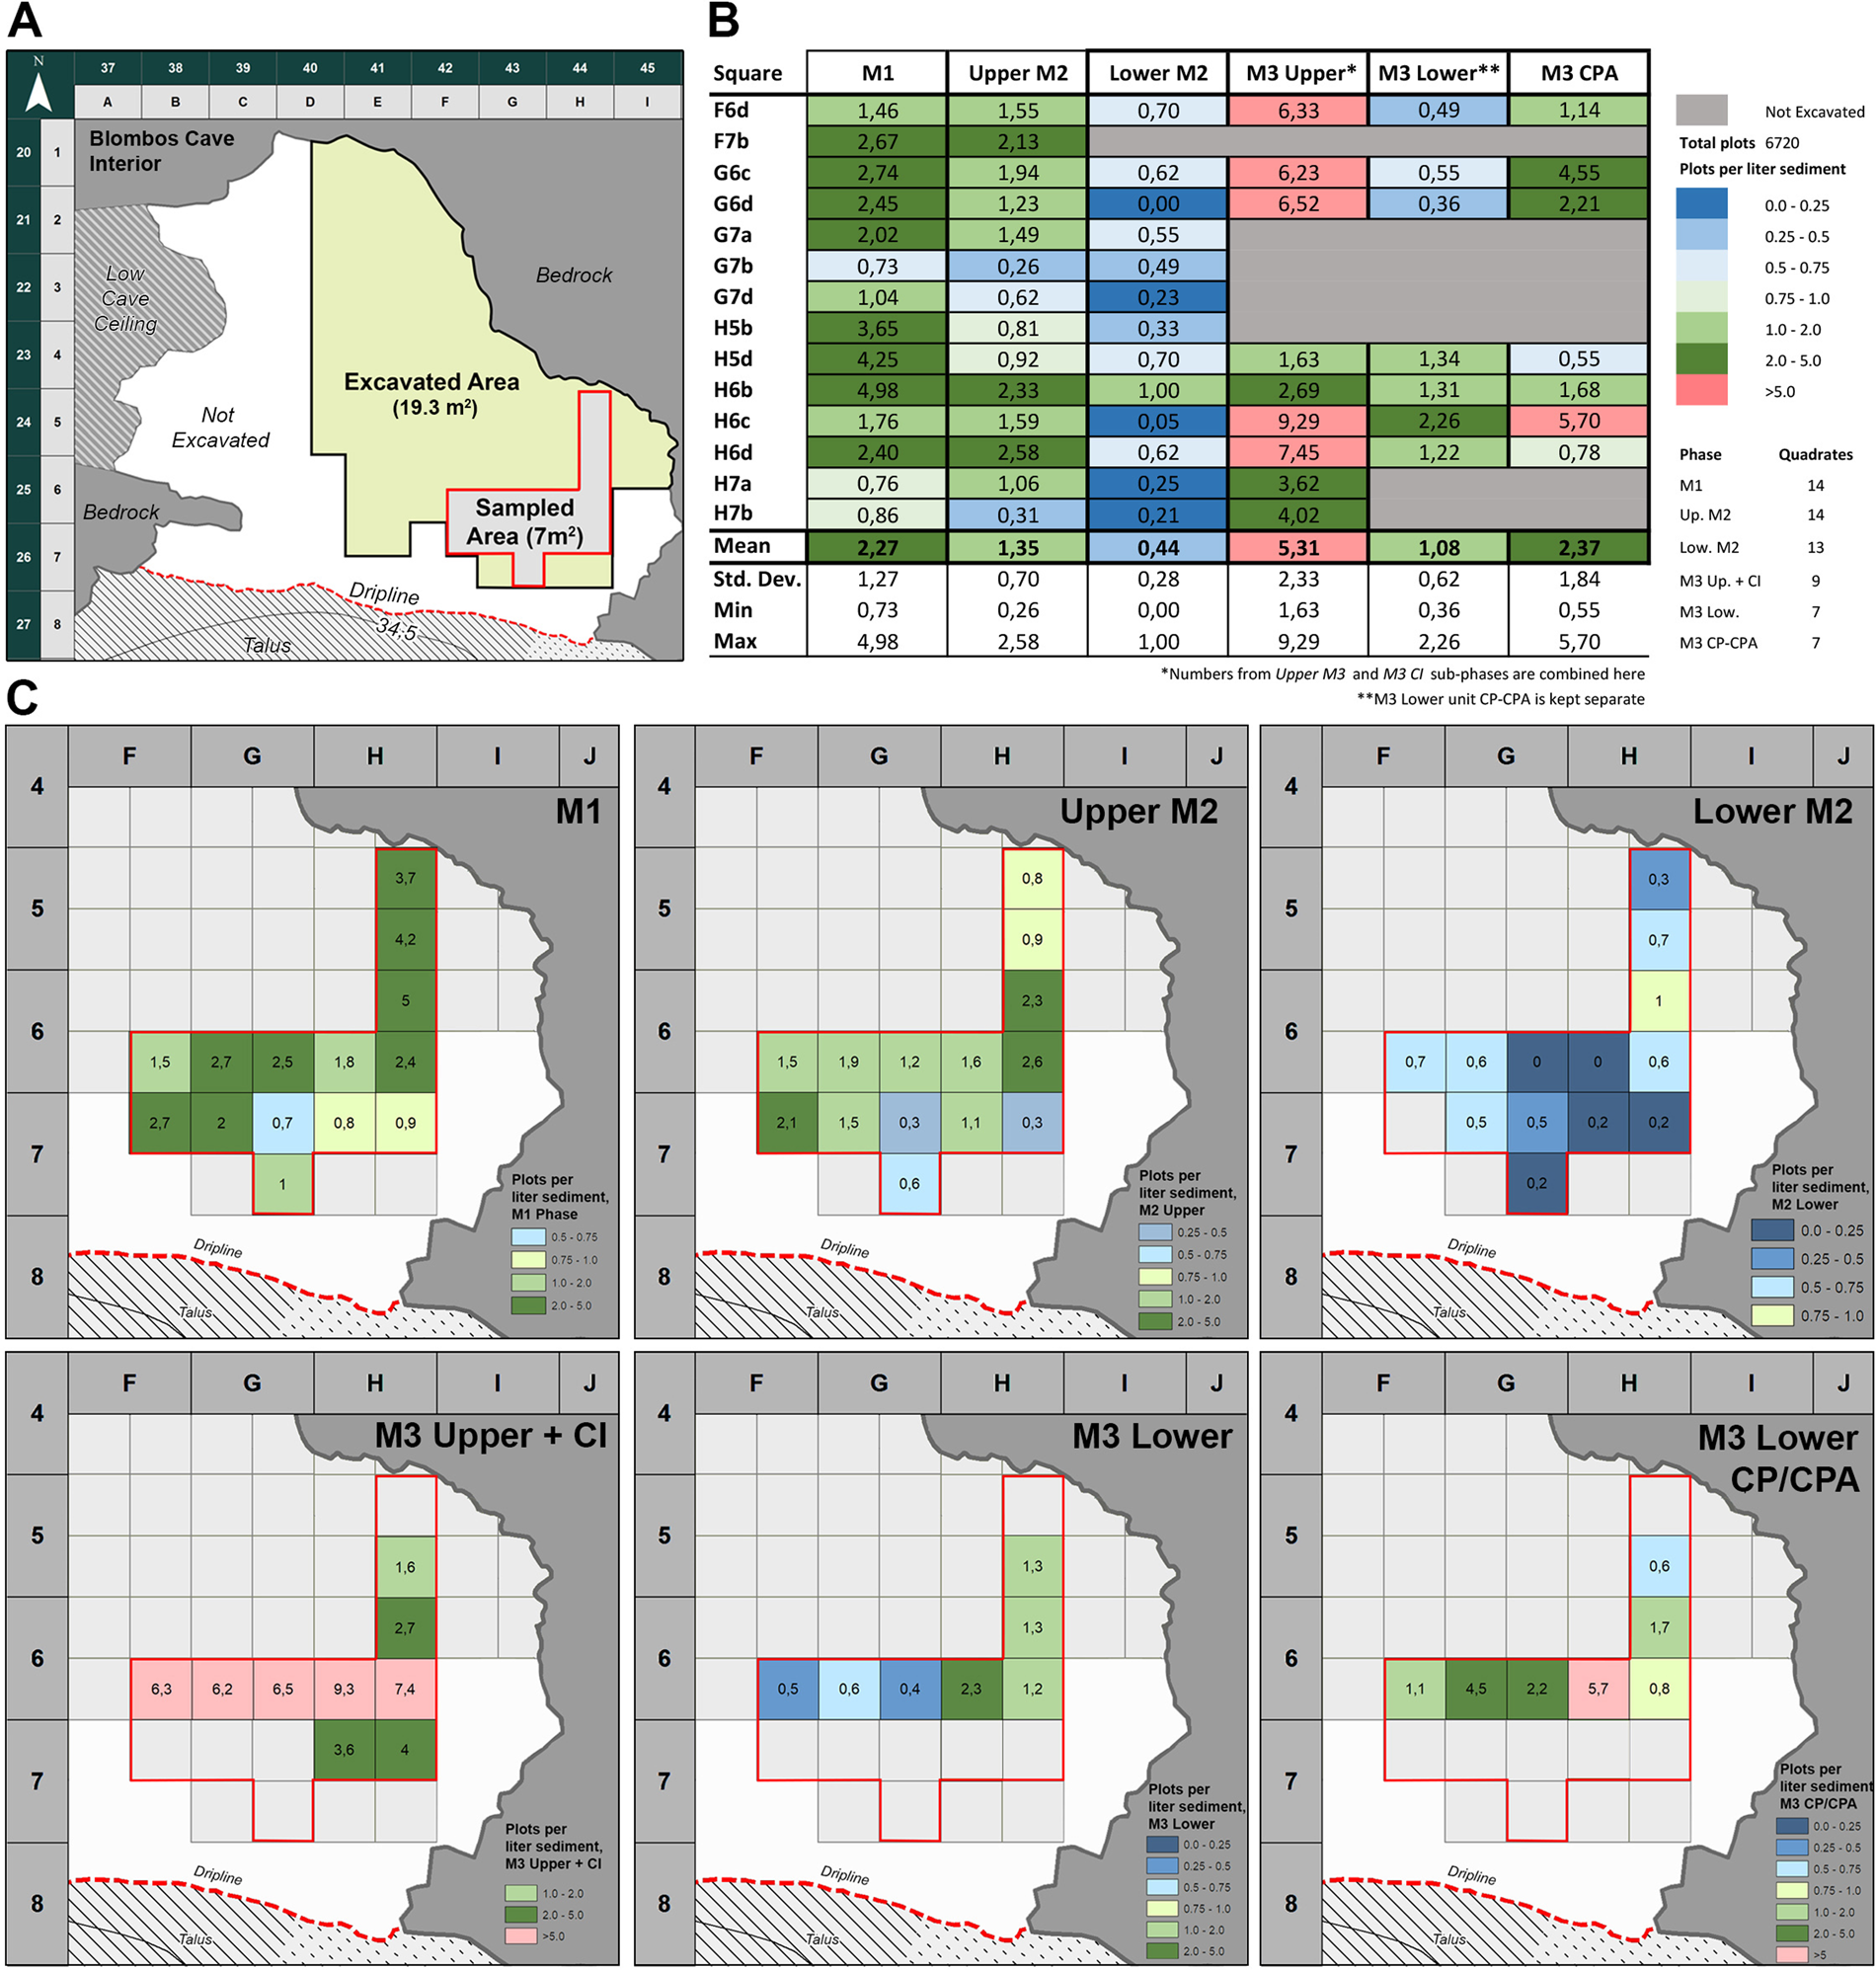
A general overview of plotted MSA artifact densities, that is, plotted artifacts per liter of sediment per quadrate by phase, is provided in Figure 6A and B. The total number of plots in the selected sampling area (7 m2) amount to 6720 and include all archaeological artifacts >20 mm (e.g., lithics, bone, ochre, eggshell, and personal ornaments), except for shellfish fragments. The sampling area was excavated following the same protocol, thus making the plotted data within it suitable for comparative analysis. An overview of the lateral variation of plotted artifact density, by MSA phase, is provided in Figure 6C. In Figure 7A, we also present a higher-resolution data set, breaking down the plot numbers (per liter of sediment) by individual archaeostratigraphic unit. Five quadrates in the south-central area of the cave, represented by a 2.5-m-long continuous section wall (Fig. 7B) were selected for this purpose. These five quadrates are particularly suited for a high-resolution analysis because: (1) they are very well documented; (2) they contain a low amount of large roof spalls; (3) the microstratigraphy is well defined, intact, and relatively horizontal; and (4) the quadrates are located in a central area of the cave, and not adjacent to the cave walls or the dripline.
(color online) (A) Site map of Blombos Cave showing total excavated area and the area selected for plot-density analysis. (B) Overview of plotted archaeological artifacts (>20 mm in size) per liter sediment by quadrate and Middle Stone Age (MSA) phase. Shellfish data are not included. (C) Maps showing the spatial distribution and variability of artifact plot density by quadrate and MSA phase.
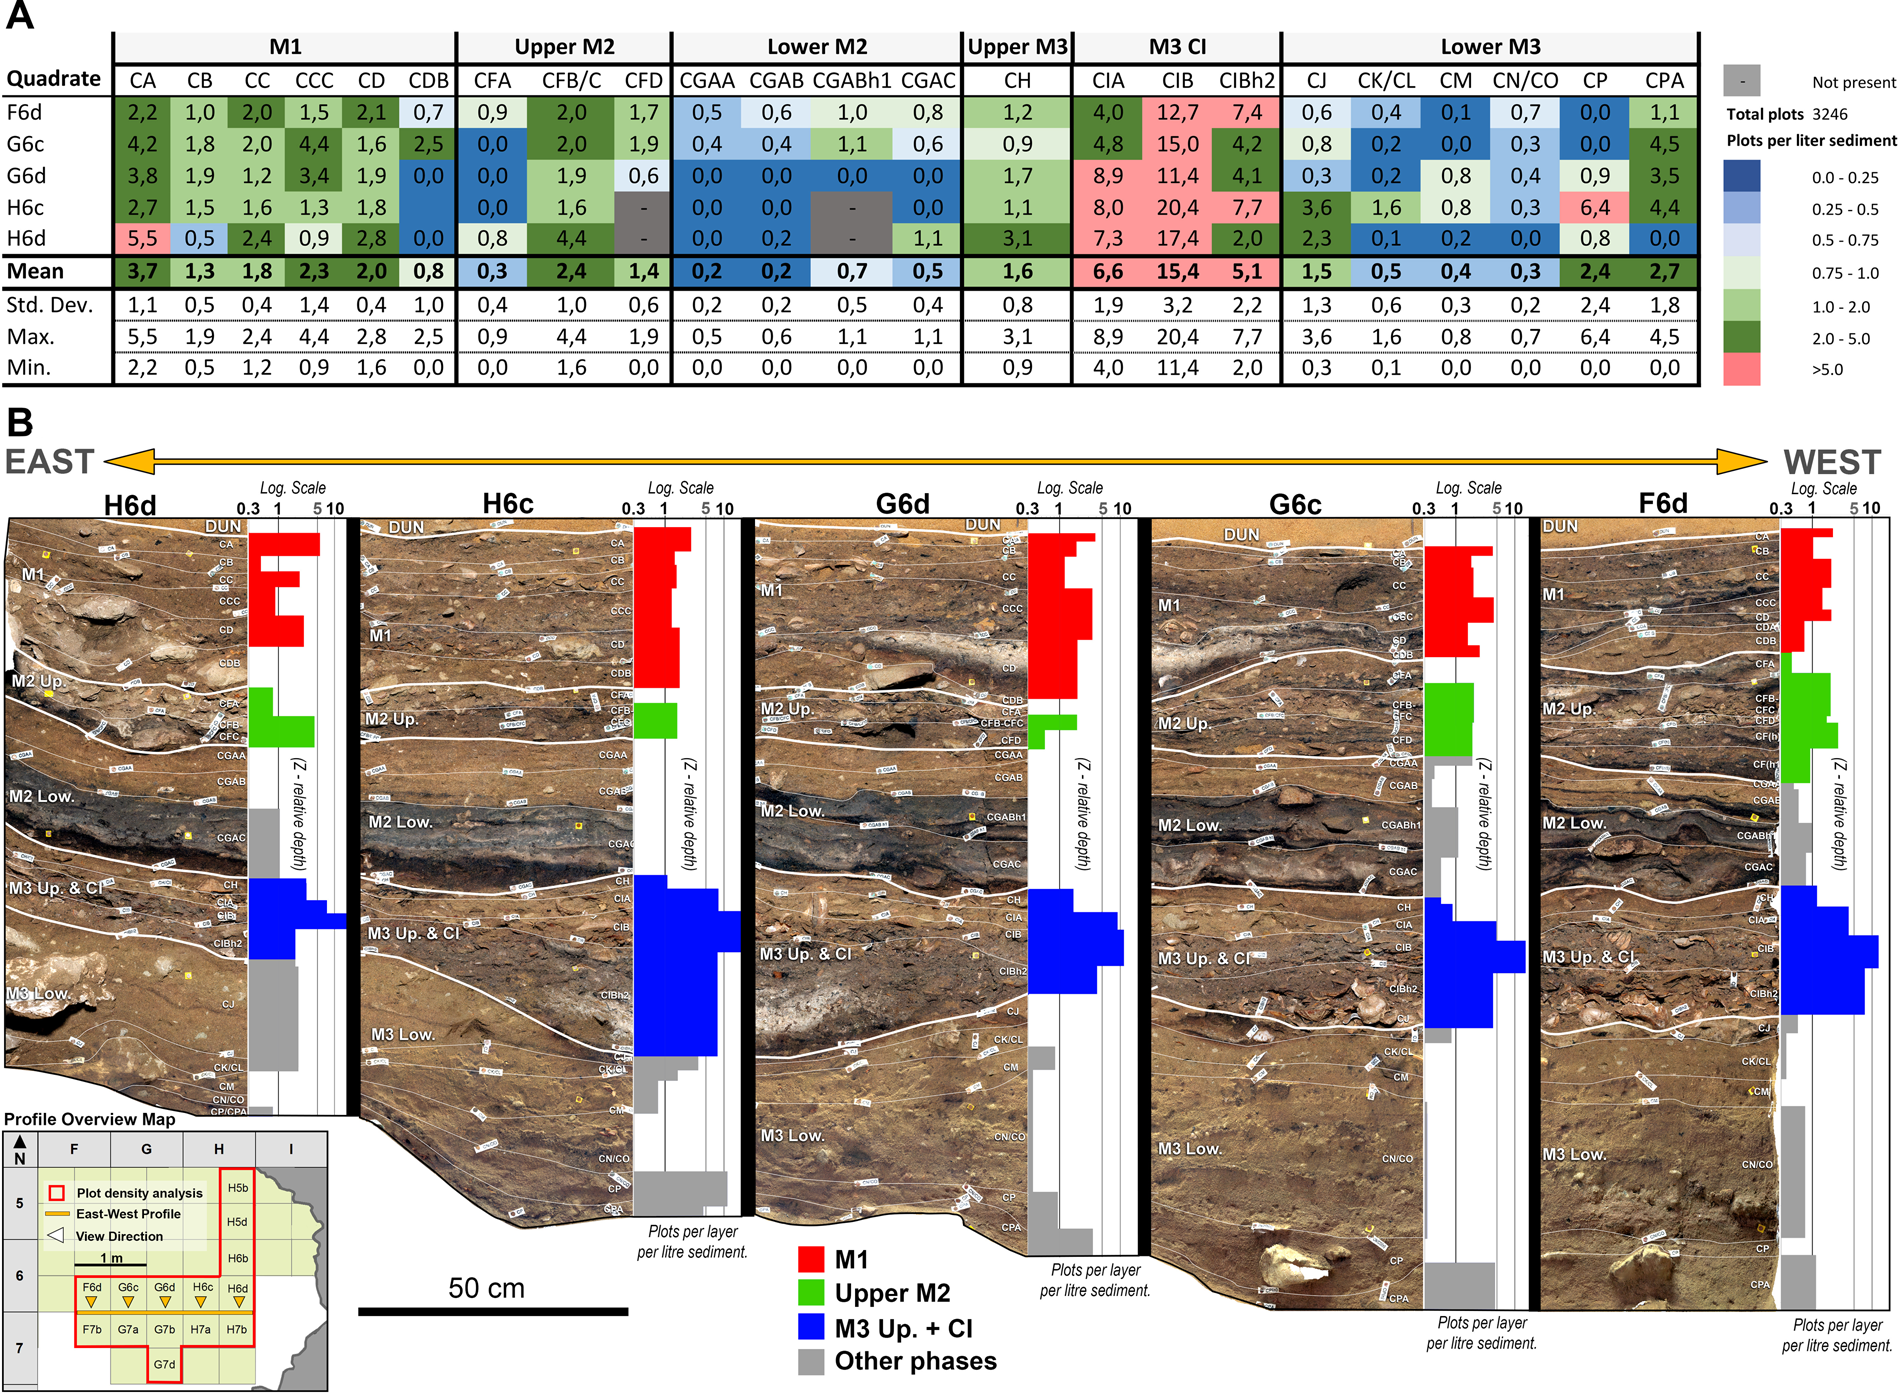
(color online) (A) Overview of plotted archaeological artifacts (>20 mm) per liter sediment by individual archaeostratigraphic units in five adjacent quadrates in the south-central area of the cave: H6d, H6c, G6d, G6c, and F6d. (B) Orthophotographic profile wall views of each selected quadrate, in which Middle Stone Age (MSA) phases and archaeostratigraphic units have been drawn. Each profile wall and archaeostratigraphic unit is visually and spatially correlated with their associated plot densities through a variable width stacked bar chart displaying plotted density values between 0.3 and 20 plots/L of sediment (logarithmic scale). The bar width (Z) corresponds to the relative depth (cm) of each archaeostratigraphic unit.
From Figures 6 and 7, we observe that some lateral variation in artifact plot density occurs within each of the MSA phases at Blombos Cave. Yet some broader diachronic patterns appear to be present throughout the sampled excavation area, allowing us to draw some general conclusions. For example, occupation phases with relatively high densities of plotted material, such as the M1 and Upper M2 phases, are characterized by having an average of 2.3 (±1.3) and 1.4 (±1.3) plotted artifacts per unit per quadrate per liter of sediment, respectively. By comparison, the Lower M2 phase contains very few plotted artifacts (0.4 ± 0.3), as is expected, given that the archaeologists have defined this phase as anthropogenically sterile. Plotted density data from the M3 subphases cover fewer quadrates (n = 7–9) than the later MSA phases (n = 14), and this should be kept in mind when evaluating density patterns from these older phases (excavations of these deeper layers are still ongoing). For the M3 upper and M3 CI phases, some quadrates in the south-central area of the cave are extraordinarily rich in plotted artifacts (density values between 6 and 9). Quadrates in the more peripheral areas of the cave are also high but contain values similar to those in the M1 and Upper M2 phases (i.e., 1.4–4). Note that in Figure 6, we decided to separate the archaeostratigraphic units CP and CPA from the rest of the units in the LowerM3 phase. Instead, we aggregated CP and CPA data into a separate analytical unit, due to their relatively high plot densities (2.4 ± 1.8), which are not representative for most other M3 lower units (1.1 ± 0.6).
Although the density values presented in Figure 7 confirm the more generalized patterns described in Figure 6, this higher-resolution data set enables us to make additional observations. First, we note that the transitional archaeostratigraphic units between M1 and Upper M2 phases (i.e., CDB and CFA) are characterized by relatively low plot densities (0.3–0.8). This observation is consistent with what on-site archaeologists have previously referred to as a brief low-intensity occupation period between the early (Upper M2) and later (M1) Still Bay phases. We may also note that the uppermost units of the Lower M2 phase (CGAA and CGAB) consistently have some of the lowest numbers of plotted artifacts throughout the entire MSA sequence (0.2 ± 0.2). In Figure 7, we can also see that the Upper M3 phase (i.e., CH layer) only has an average plot density of 1.6 ± 0.8. In contrast, the M3 CI phase has averaged values between 6.6 and 15.4, with the highest density number for a single quadrate being 20.4. Most of the plotted artifacts from the Lower M3 phase derive either from unit CJ (1.5 ± 1.3) or the CP/CPA units (2.4–2.7), while the rest of the Lower M3 units all have values below 0.5.
MATERIAL AND METHODS
Analytical scope
Our ability to chronologically and temporally link local environment, demography, and prehistoric mobility to specific periods or moments of cultural and technological innovation has been, and still is, challenging at most MSA sites (Jacobs et al., Reference Jacobs, Roberts, Galbraith, Deacon, Grün, Mackay, Mitchell, Vogelsang and Wadley2008; Guérin et al., Reference Guérin, Murray, Jain, Thomsen and Mercier2013; Tribolo et al., Reference Tribolo, Mercier, Douville, Joron, Reyss, Rufer and Cantin2013; Feathers, Reference Feathers2015; Jacobs and Roberts, Reference Jacobs and Roberts2015), including Blombos Cave (Jacobs et al., Reference Jacobs, Duller and Wintle2003, Reference Jacobs, Duller, Wintle and Henshilwood2006, Reference Jacobs, Hayes, Roberts, Galbraith and Henshilwood2013; Henshilwood, Reference Henshilwood2008b; Henshilwood et al., Reference Henshilwood, d'Errico, van Niekerk, Coquinot, Jacobs, Lauritzen, Menu and García-Moreno2011; Jacobs and Roberts, Reference Jacobs and Roberts2017). This is particularly due to two factors: (1) Poor absolute chronometric control and age estimations with large margins of error (typically > ±2–5 ka); and (2) low relative temporal resolution due to the lack of systematic high-resolution geoarchaeological evaluation of relative microstratigraphy. While absolute age estimates are essential for conducting regional and global comparisons between various site sequences, most sites do not presently have the necessary analytical resolution to differentiate between regional trends and more local and short-lived events (but see Smith et al., Reference Smith, Jacobs, Johnsen, Ren, Fisher, Oestmo, Wilkins, Harris, Karkanas and Fitch2018). And whereas high-resolution, site-specific relative chronological frameworks (i.e., archaeostratigraphy) have been carefully defined for a number of MSA sites, only a handful of these have been systematically investigated and evaluated through geoarchaeological methods (Goldberg et al., Reference Goldberg, Miller, Schiegl, Ligouis, Berna, Conard and Wadley2009; Miller et al., Reference Miller, Goldberg and Berna2013, Reference Miller, Mentzer, Berthold, Leach, Ligouis, Tribolo, Parkington and Porraz2016; Karkanas et al., Reference Karkanas, Brown, Fisher, Jacobs and Marean2015; Larbey et al., Reference Larbey, Mentzer, Ligouis, Wurz and Jones2019).
To enable the investigation of short-term site use at Blombos Cave, we adopt here a microcontextual and geoarchaeological approach capable of mapping and characterizing the nature, scale, and order of fine-grained depositional processes associated with MSA occupation deposits. For this purpose, three MSA occupation phases were specifically selected based on their high densities of archaeological material: M1 (ca. 72 ka), Upper M2 (ca. 77 ka), and M3 CI (88 ka) (see Figs. 6 and 7). To facilitate a multiscale investigation, we also established a digital spatial framework that allowed all microstratigraphic observations to be georeferenced and linked with macroscopic field observations. This framework consists of six main procedural steps:
1. the mapping of cave topography and the documentation of the interior excavation area using image-based 3D reconstruction techniques (photogrammetry);
2. the lateral and vertical sampling of micromorphological blocks and the petrographic examination of thin sections combined with microspectroscopy, that is, what Goldberg et al. (Reference Goldberg, Miller and Mentzer2017) refer to as a microcontextual approach;
3. the high-resolution documentation and georeferencing of micromorphological block samples and thin sections;
4. the application of a single-grain, thin section-based, heat-distribution analysis (Haaland et al., Reference Haaland, Friesem, Miller and Henshilwood2017);
5. the implementation of a site-specific microfacies classification scheme within a digital spatial framework (GIS); and
6. the integration of faunal taphonomy associated with sediment-based observations.
Site-scale field documentation
The interior and exterior of Blombos Cave were documented in 2013 using image-based 3D modeling techniques (Unhammer, Reference Unhammer2016). In this paper we use the high-resolution 3D model of Blombos Cave to: (1) map and visualize the interior cave topography; (2) render and trace the archaeostratigraphic sequence across the site interior; and (3) georeference and plot the location of the micromorphological block samples (see Figs. 3, 4, and 6). A site-wide archaeostratigraphic sequence had not previously been produced due to the lack of spatial correlation between earlier (before 2000) and more recent (after 2010) fieldwork at the site (Haaland, Reference Haaland2012). In this study we were able to produce a full 3D reconstruction of both current and previously undocumented section walls, effectively connecting the archaeological profile walls in both the eastern and southern part of the site (Fig. 6) (for details, see Unhammer, Reference Unhammer2016). From this digital reconstruction, we then generated orthophotographic images of each section wall (Figs. 9A and 10A), from which we produced georeferenced vector drawings (Figs. 9B and 10B).
Micromorphology and associated microanalytical techniques
From the 13 blocks selected for this study, 30 thin sections were produced, covering three MSA occupation phases: the M3 CI, the Upper M2, and the M1 (see Figs. 3 and 6–8, Table 1). The block samples were collected from the exposed profile walls and then stabilized by plaster bandages before transportation. The exact location of each block was photographed and georeferenced using the 3D photogrammetric cave model. All block samples were dried at 40°C for 48 h and then impregnated with resin under vacuum, in a 7:3 mixture ratio of unpromoted polyester resin (Viscovoss N 55S) and styrene, in addition to 5 ml/L hardener (Methyl Ethyl Ketone Peroxide, MEKP). The hardened blocks were then cut to 6 × 9 × 3 cm slices; mounted on glass; and subsequently cut, ground, and polished to a thickness of 30 μm.
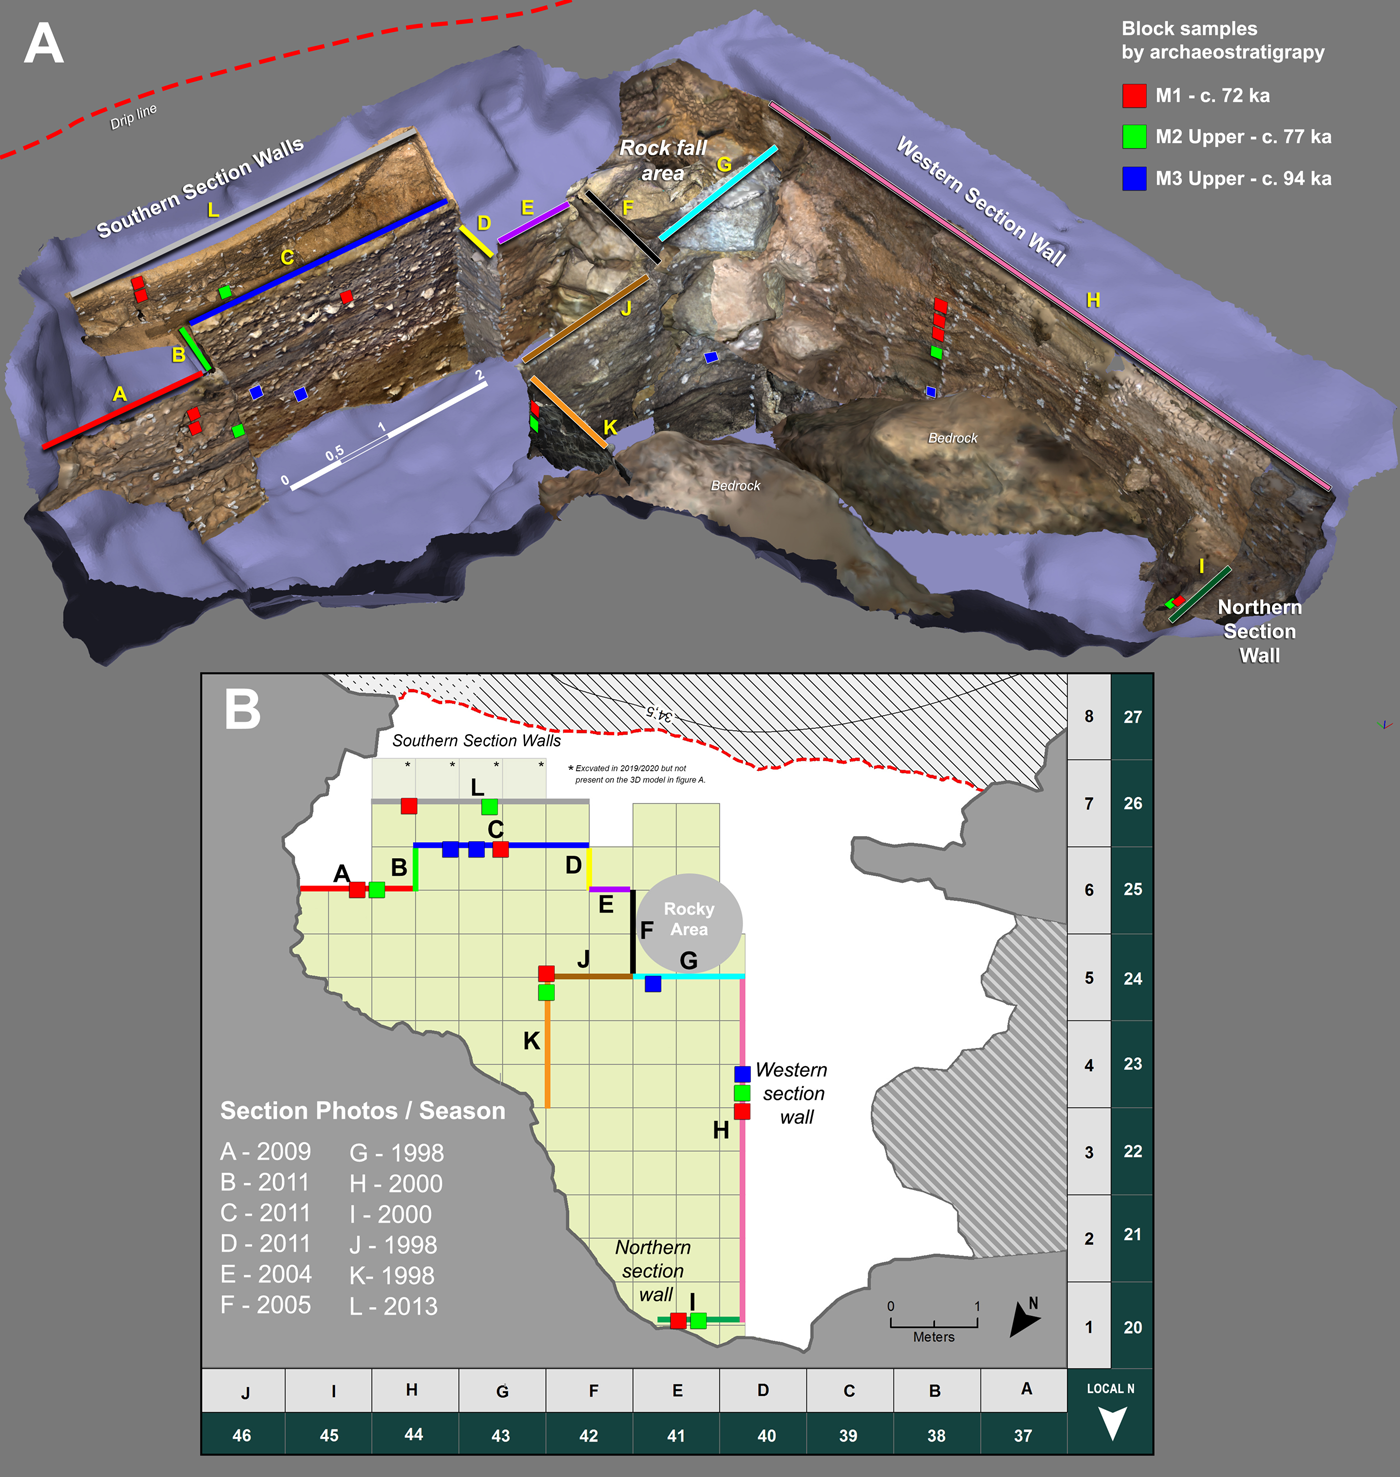
(color online) (A) Perspective view of the excavated interior of Blombos Cave (note: not to be used to make accurate metric measurements). The georeferenced section walls were documenting during multiple excavation seasons reconstructed in 3D using image-based 3D modeling techniques (photogrammetry). Micromorphological block samples analyzed in this paper are plotted and categorized according to archaeostratigraphy. (B) Site map of Blombos Cave interior showing the planar extent of the reconstructed section walls in Figure 5A and the spatial distribution of block samples. Overlapping blocks have been cascaded for better visibility.
(color online) Documenting lateral extent of archaeological horizons in east, south, west, and north sectors: (A) Georeferenced orthophotos of section walls created from 3D photogrammetric models from various excavation seasons (see Fig. 5A). (B) Digitized section drawing of section walls seen in Figure 6A. Location of micromorphological samples indicated and categorized by archaeostratigraphic phases. LSA, Later Stone Age. DUN, archaeostratigraphic layer Dune.
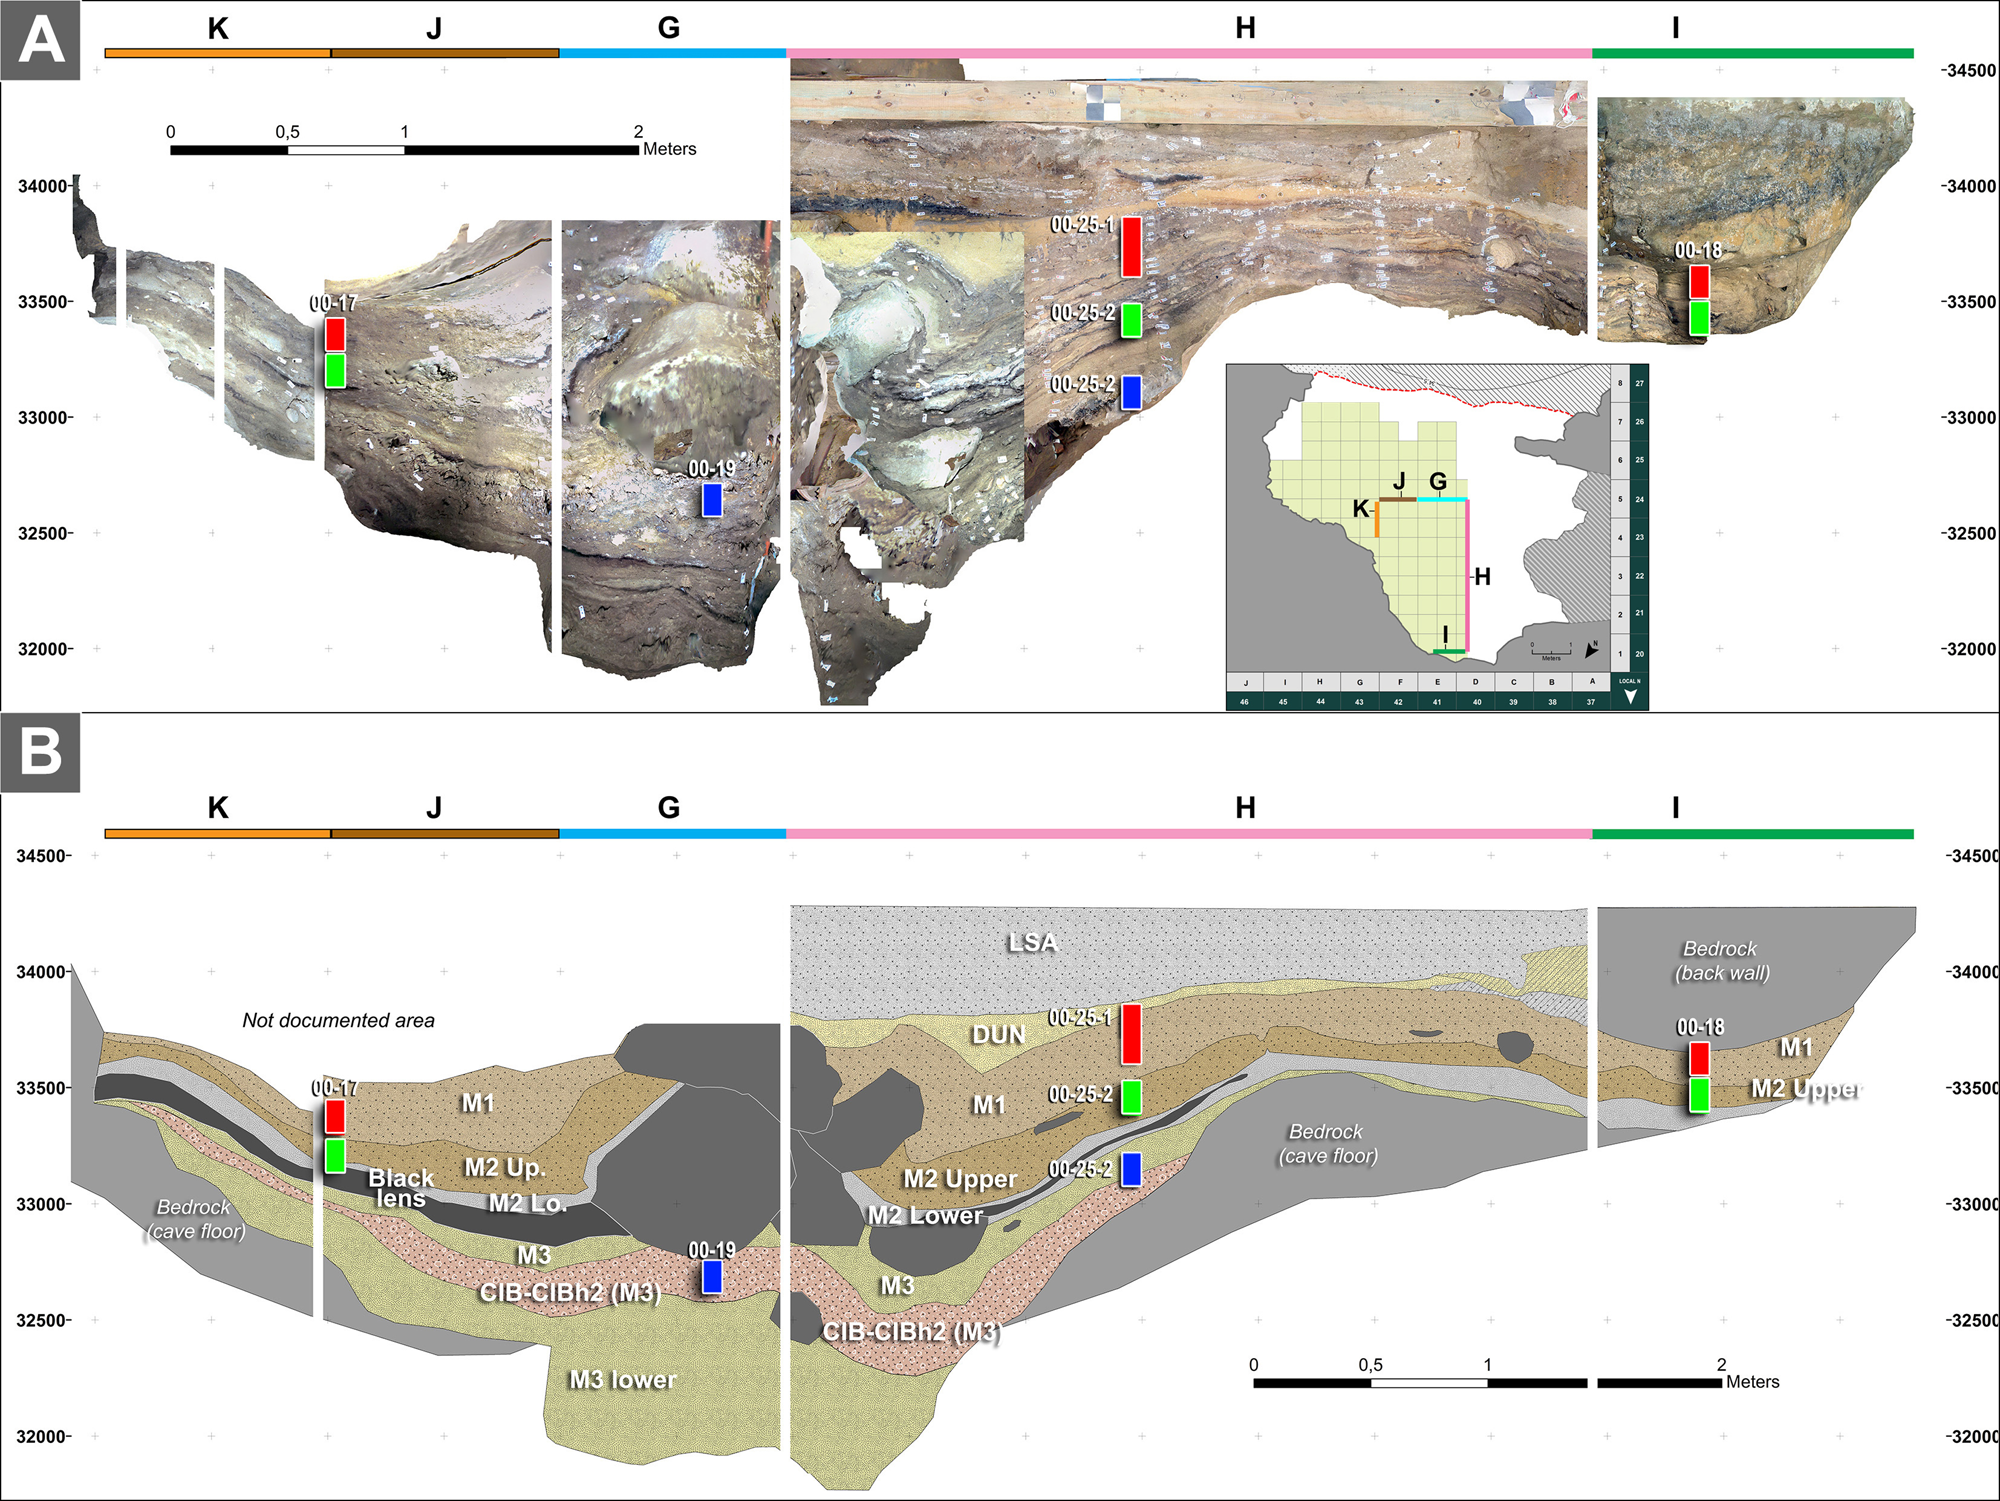
(color online) Documenting the lateral extent of archaeological horizons in central, west, and north sectors: (A) Georeferenced orthophotos of section walls created from 3D photogrammetric models from various excavation seasons (see Fig. 5A). (B) Digitized section drawing of section walls in Figure 7A. Location of micromorphological samples indicated and categorized by archaeostratigraphic phases. LSA, Later Stone Age. DUN, archaeostratigraphic layer Dune.
List of micromorphological block samples analyzed by sampling area (sector).
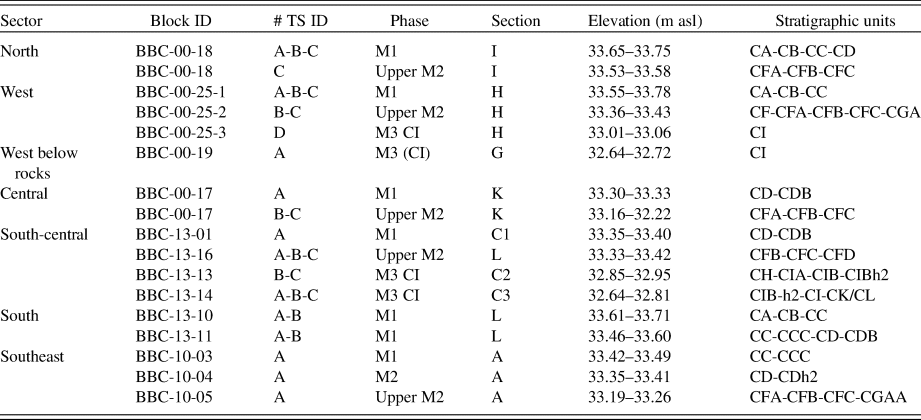
Abbreviations: m asl, meters above sea level; BBC, Blombos Cave; TS ID, thin section identification number.
The final thin sections were examined using petrographic microscopes under magnification ranging from 6.7× to 400× with different light settings—plane-polarized (PPL), cross-polarized (XPL), reflective (RL), and fluorescence (470 nm)—and described following established protocols (Courty et al., Reference Courty, Goldberg and Macphail1989; Stoops, 2003). We also scanned and georeferenced the sliced block samples (flatbed scanner, 1200 DPI, reflective mode) and the thin sections (Nikon Coolscan LS-8000 ED Film Scanner, 4000 DPI in PPL and XPL) (Haaland et al., Reference Haaland, Czechowski, Carpentier, Lejay and Vandermeulen2019). The block and thin section scans were later imported into a GIS application (ArcGIS ArcMap 10.3) and georeferenced using the local coordinate system of the archaeological excavation (Figs. 11 and 12).
(color online) Orthophotographic section walls and georeferenced block and thin sectionthin section scans. Archaeostratigraphic phases and block sample IDs indicated: (A) BBC-00-17-A/B/C; (B) BBC-13-01; (C) BBC-10-03, 10-04 and 10-05; and (D) BBC-13-10-A/B, 13-11-A/B and 13-12-A/B/C. See Tables 2 and 3 for field descriptions and sampling details. DUN, archaeostratigraphic layer Dune.

Orthophotographic section walls and georeferenced blocks (black squares) and thin sections (yellow squares). Archaeostratigraphic phases and sample IDs indicated: (A) BBC-25-1-A/B/C, 00-25-2-A/B, 00-25-3-D; (B) BBC-00-18-A/B/C; (C) BBC-00-19; and (D) BBC-13-13-A/B/C, BBC-13-14-A/B/C. See Tables 2 and 3 for field descriptions and sampling details. (For interpretation of the references to color in this figure legend, the reader is referred to the web version of this article.) DUN, archaeostratigraphic layer Dune.

To chemically characterize the mineralogical components in the thin sections, microscopic Fourier transform infrared spectrometry (micro-FTIR) was carried out using a Cary 610 FTIR microscope attached to a Cary 660 bench (Agilent Technologies). Micro X-ray fluorescence (micro-XRF) elemental mapping was conducted directly on thin sections and sliced sediment blocks using a Bruker M4 Tornado table-top instrument equipped with a Rh X-ray tube, polycapillary optics, and dual 30 mm2 X-Flash silicon drift detectors. For the characterization of the organic matter measurements of plant tissue, reflectance was conducted on finely polished blocks using a Leica DMRX/MPV-SP microscope photometer in reflected white light (RL), reflected plane-polarized (RPPL), in reflected cross-polarized light (RXPL), all under oil immersion (Taylor et al., Reference Taylor, Teichmüller, Davis, Diessel, Littke and Robert1998).
Heat-distribution analysis of sediments in thin sections
Based on methods established in Haaland et al. (Reference Haaland, Friesem, Miller and Henshilwood2017), all thin sections were subjected to a single-grain heat-distribution analysis. In a GIS application, using the georeferenced thin section scans as visual guidance, single glauconite grains were digitized as point data and classified to binary temperature classes by their colors. Green grains were classified to a <25–200°C nonburnt category, while red or black grains were classified into a >400°C burnt category (>90% accuracy; see Haaland et al., Reference Haaland, Friesem, Miller and Henshilwood2017). Glauconitic minerals are distributed fairly evenly within the general cave sediments of Blombos Cave at a density of 11.25 (±3) grains/3 mm2. In this study, we selected 1 grain/3 mm2, amounting to ca. 535 grains per thin section. The spatial distribution of the recorded points, combined with the qualitative colorimetric assessment of temperature, allowed us to interpolate point temperature data across the entire thin section, using inverse distance weighted interpolation techniques (Haaland et al., Reference Haaland, Friesem, Miller and Henshilwood2017). It should be noted that in undisturbed and rapidly deposited sediments (e.g., in situ non-reworked ash-rich features or allochthonous eolian sand) the frequency of glauconitic minerals can be much lower than that of normal cave sediment. Inferring distribution of burnt material in these types of sediments needs to take this into account.
Microfacies analysis
In this paper, we build on the archaeological microfacies approach that has been developed at several MSA sites across southern Africa (Goldberg et al., Reference Goldberg, Miller, Schiegl, Ligouis, Berna, Conard and Wadley2009; Miller et al., Reference Miller, Goldberg and Berna2013, Reference Miller, Mentzer, Berthold, Leach, Ligouis, Tribolo, Parkington and Porraz2016; Karkanas et al., Reference Karkanas, Brown, Fisher, Jacobs and Marean2015). A microfacies approach allows for efficient identification and categorization of complex depositional and postdepositional processes, many of which are directly related to human depositional activities and behaviors. The archaeological microfacies concept, first put forward by Courty (Reference Courty, Goldberg, Holliday and Ferring2001) and later fine-tuned and adopted at multiple MSA sites (Goldberg et al., Reference Goldberg, Miller, Schiegl, Ligouis, Berna, Conard and Wadley2009; Miller et al., Reference Miller, Goldberg and Berna2013; Karkanas et al., Reference Karkanas, Brown, Fisher, Jacobs and Marean2015) involves the systematic classification of multicomponent deposits, by their dominant trait, into sedimentary classes and subclasses (i.e., microfacies types). As a descriptive classification system, it relies on pattern recognition and the underlying assumption that microfacies that share close morphological similarities at different scales can be genetically linked to the same depositional process, source, agent, or environment (Courty, Reference Courty, Goldberg, Holliday and Ferring2001). Hence, in deposits dominated by anthropogenic input, individual microfacies can be closely associated with the human action(s) and campsite activities that once formed them (Villagran et al., Reference Villagran, Balbo, Madella, Vila and Estevez2011).
Whereas the potential of performing site-wide (lateral) distribution analysis of microfacies has been theoretically discussed (Courty, Reference Courty, Goldberg, Holliday and Ferring2001) and has also been practically demonstrated at prehistoric sites in other parts of the world (e.g., South America, open-air site: Villagran et al., Reference Villagran, Balbo, Madella, Vila and Estevez2011), no South African MSA contexts have been subjected to a laterally extensive microfacies approach (for discussion, see Miller et al., Reference Miller, Goldberg and Berna2013). At Blombos Cave we take advantage of the extensive micromorphological sampling conducted over multiple excavation seasons that cover the same occupational phases at different sectors of the cave (cf. Figs. 3, 6, 7, and 8, Table 1).
The main principles for our microfacies classification of the Blombos Cave thin sections are outlined in Table 2 and Figure 13. This classification system involves the systematic mapping of microfacies units (MF-units) on digitally documented thin sections and the subsequent classification of these MF-units into analytical categories operating on different spatial scales: (macro)facies, microfacies groups (MF-groups), microfacies types (MF-types), and microfacies subtypes (Table 2, sections 1 and 2). We supplement the microfacies classification scheme by introducing two sets of analytical modifiers that may be applied to the MF-types: conditions and frequency mode (Table 2, sections 3 and 4). Microfacies conditions refer to syn- or postdepositional processes that have altered the general matrix or the content within it, often irrespective of which MF-type it is (burnt, phosphatized, bioturbated, etc.). Microfacies conditions do not have to occur in a uniform or homogenous way within the thin sections, and some MF-types may be more closely associated with certain conditions than others. Microfacies frequency modes (I, II, and III) refer to the frequency or density of the content or property that defines that MF-type (amount of fine material, sandy inclusions, etc.). The frequency modes do not refer to strict, absolute values, but to the relative quantity of the defining property compared with the default value (default mode I) observed within an MF-type.
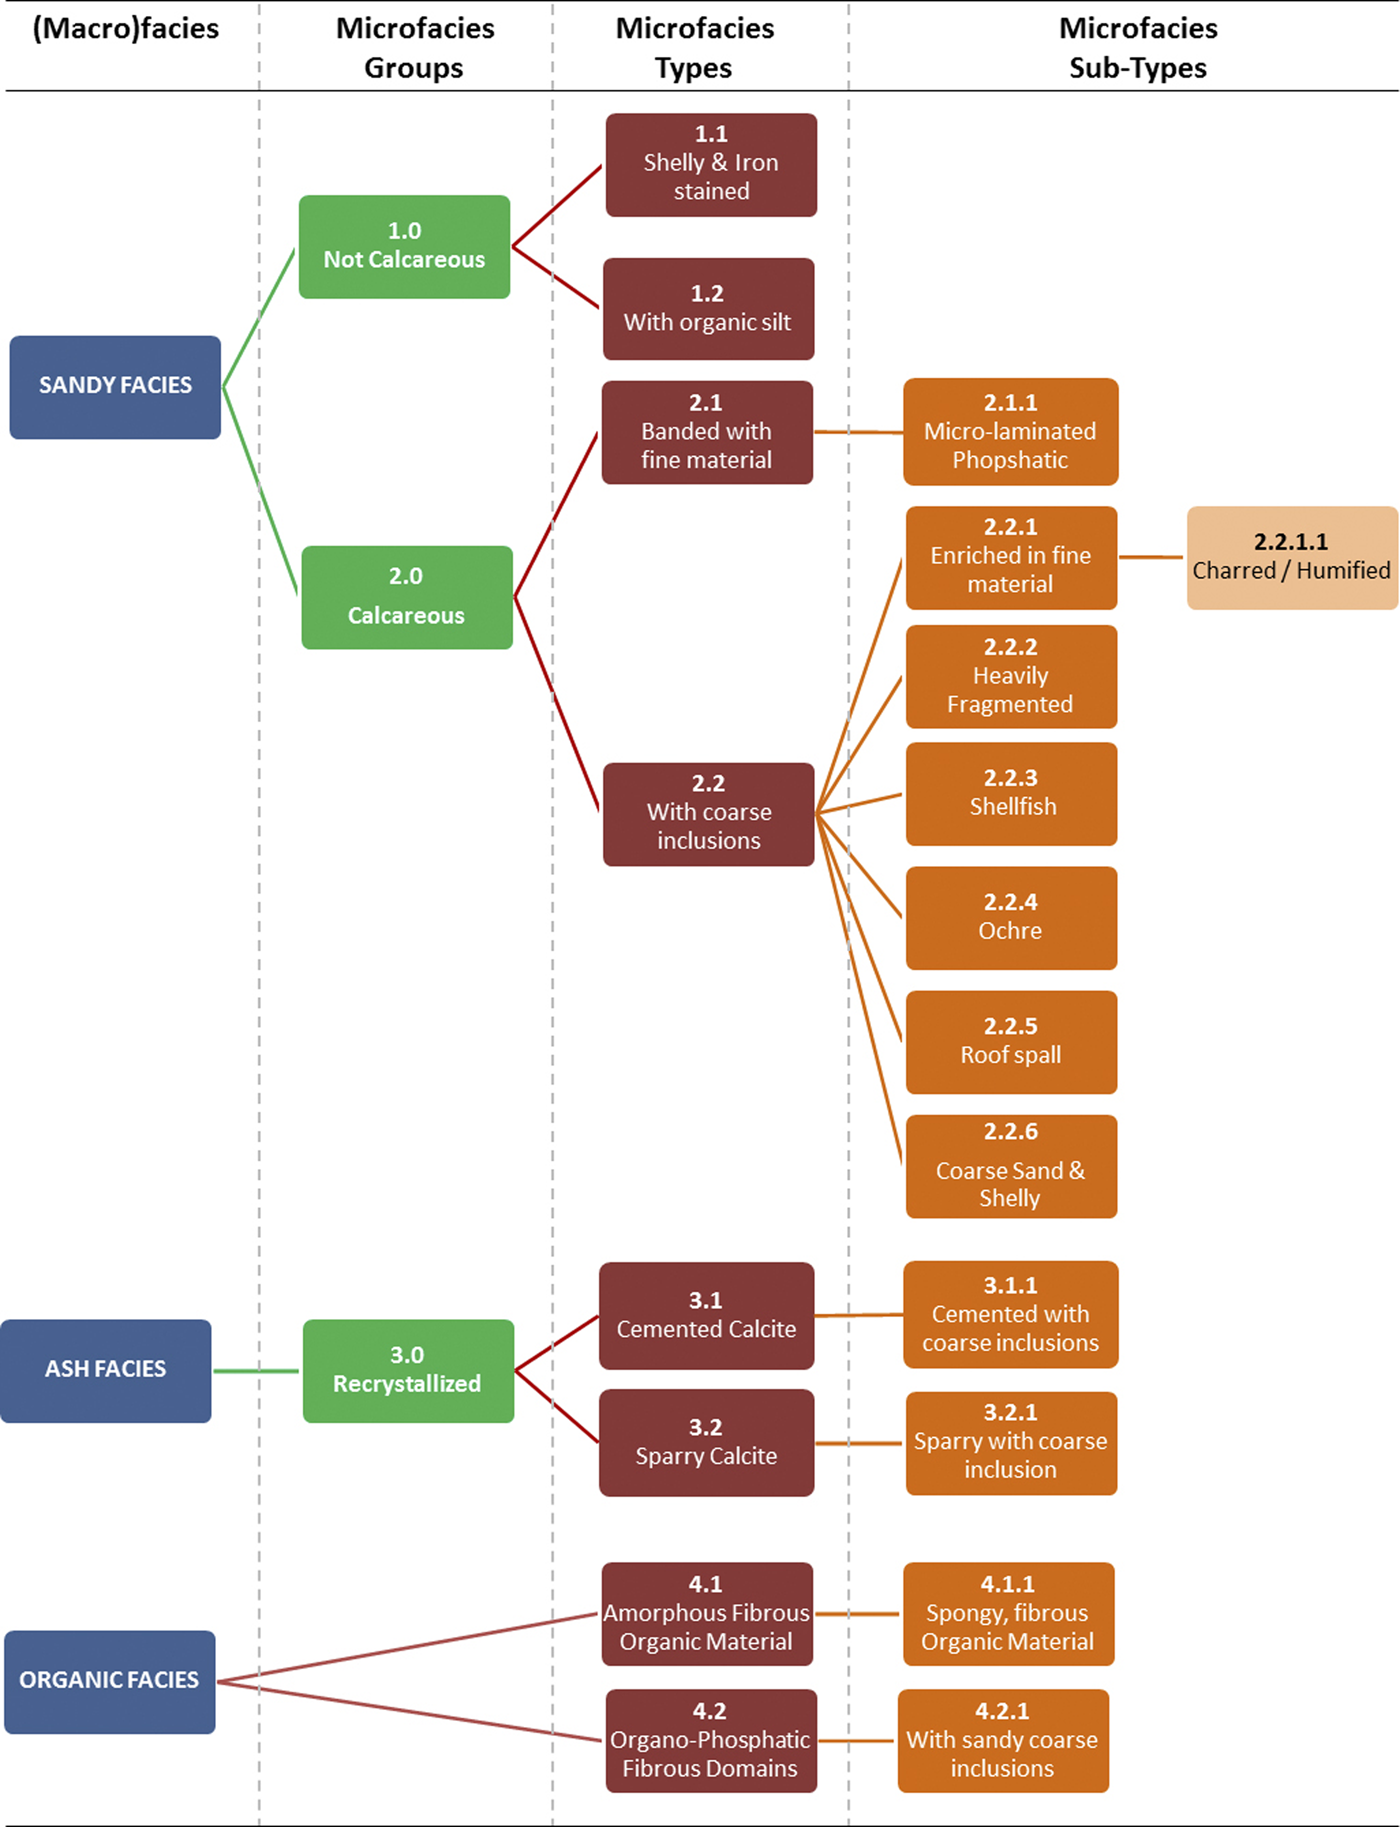
(color online) Microfacies classification scheme for Blombos Cave. See Figures 11 and 12 for corresponding micrographs, Table 4 for detailed descriptions, and Table 5 for interpretations. DUN, archaeostratigraphic layer Dune.
Principles for Blombos Cave microfacies classification.
Faunal taphonomy
We examined a sample of faunal specimens (identified either to class level or as unidentified remains) larger than 2 cm for evidence of surface abrasion from the M1 and Upper M2 phases. Faunal material from the M3 CI phase was not available for this study. The material we did analyze was recovered from squares E6, F6, F7, G7, H6, H7, and I6. The proportion of faunal specimens with “polish” or abrasion marks per layer was used to determine the extent of trampling throughout the sequence. Abrasion was noted when specimen surfaces were “smoothed” (i.e., based on surface tactility and exhibiting no roughness) and displayed polish/sheen and when edges of fragments were “rounded.” Only specimens that retain a cortical surface were used in the analysis of abrasion. Because thermally altered specimens sometimes exhibit a glossy polish, only unburnt fragments were analyzed. All faunal remains were examined with a Nikon binocular light microscope (5×–40× magnification) under oblique, unidirectional, incandescent lighting.
RESULTS
The MSA deposits at Blombos Cave consist of numerous sedimentary lenses and laminations that can be macroscopically distinguished by color, texture, and content (Figs. 11 and 12). Detailed field descriptions arranged by phases are provided in Table 3. While the stratigraphic sequence appears relatively heterogeneous in the field, we note that, on a microscale, a predictable number of key sedimentary components make up the sequence. We relate the variable distribution and quantity of these components to three distinct macroscopically visible (macro)-facies: sandy facies, ash-rich facies, and organic-rich facies (Fig. 13).
Description of archaeostratigraphy and sedimentary components in Blombos Cave by sampling area (sector).
Archaeostratigraphy and sedimentary components
The sandy facies (A) constitutes the most dominant sediment type in the MSA sequence, and we classify them into two main groups: the one being noncalcareous (MF-type 1) and the other calcareous (MF-type 2). The noncalcareous sandy facies (MF-type 1) corresponds to the weakly laminated sandy deposits located between the MSA and LSA levels (layer DUN on Fig. 5). DUN is dominated by a few well-sorted components, including silt to sand-sized grains of subrounded to rounded quartz grains and bioclastic material (sand-sized and rounded shellfish fragments) (see MF-types 1.0, 1.1, and 1.2 on Fig. 14). The calcareous sandy facies (MF-type 2) makes up most of the MSA sequence. These facies contain silt to sand-sized grains of subrounded to rounded quartz grains, glauconite grains, and bioclastic material, all of which are randomly dispersed within a microaggregated calcareous matrix displaying calcitic crystallitic b-fabric. Also, the calcareous sandy facies contains a much wider variety of coarse fraction than the noncalcareous one, including but not limited to: millimeter- to centimeter-sized bone and shellfish fragments, lithic debitage (silcrete, quartz, quartzite), pale yellow apatite nodules/domains, phosphatic coprolite fragments, decayed guano, quartzite fragments (TMG bedrock), silt-sized humified and charred material, land snail shells, cemented bedrock fragments (roof spall), rounded and opaque iron-rich grains, gypsum nodules, travertine fragments (rare), and clay aggregates (very rare) (see Table 4 for more details).
(color online) Photomicrographs (XPL, cross-polarized; PPL, plane-polarized) of microfacies types and subtypes (part 1 of 2). (1.0) Noncalcareous sand; (1.1) shelly, iron-stained noncalcareous sand; (1.2) noncalcareous sand with inclusions of organic silt; (2.0) calcareous sand; (2.1) calcareous sand enriched in fine micromass; (2.1.1) calcareous sand embedded in microlaminated and phosphatized fine micromass; (2.2) calcareous sand with coarse anthropogenic inclusions; (2.2.1) calcareous sand with coarse anthropogenic inclusions enriched in fine micromass (frequency mode [I–III] reflects relative micromass-to-coarse ratio, where I is lowest, and III is highest); (2.2.1.1) calcareous sand with coarse anthropogenic inclusions enriched in fine micromass dominated by humified or charred organic material; (2.2.2) calcareous sand with heavily fragmented coarse anthropogenic inclusions enriched in fine micromass. See Table 4 for detailed descriptions and Table 5 for interpretations.

List and description of microfacies types and subtypes identified in Blombos Cave.
a TMG, Table Mountain Group.
In the field, the ash-rich facies (B) consists of laterally confined, lenticular-shaped features that typically show a white-gray and powdery appearance. These features are found throughout the MSA sequence, but in higher frequencies in the Upper M2 and M1 phase. Microscopically the white-gray sediments consist almost entirely of recrystallized calcite (micrite and sparry), which are frequently bioturbated (insects burrows are dominant), phosphatized, iron-stained, or cemented. Sometimes they also include components from the sandy facies that surrounds them, including anthropogenically derived fractions such as millimeter- to centimeter-sized burnt material including bone and shellfish fragments, lithic debris, and ochre fragments. The overall morphology, mineralogy, and burnt content of these calcareous facies suggest that they represent the ashes of prehistoric human burning activity, thus warranting the facies’ name. Articulated ashes are commonly encountered within these facies in thin section, yet preservation of charcoal is infrequent, and calcareous pseudomorphs (after calcium oxalate crystals) are only occasionally encountered (see Table 4 for details).
The organic-rich facies (C) constitutes laminated, dark red-brown to black organic deposits that often can be traced laterally throughout larger parts of the cave interior, frequently as millimeter-thick stringers or centimeter-thick lenticular structures. The organic-rich facies are often, but not always, found below the ash-rich facies. Macroscopically, it is difficult to discriminate between different forms of organic content, yet on a microscale, we define two main MF-types based on their content: one dominated by humified, fibrous organic material; the other being characterized by weakly laminated fibrous to microaggregated, phosphatized domains embedded in a calcareous matrix (see Table 4 for details).
Microfacies classification
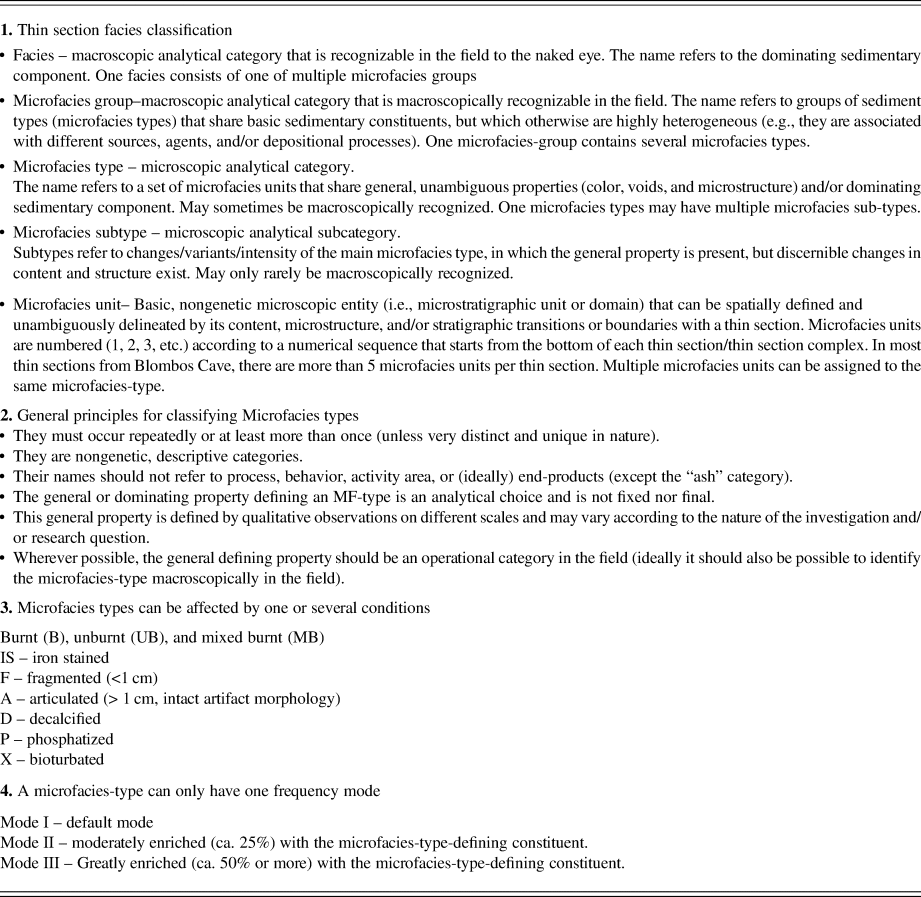
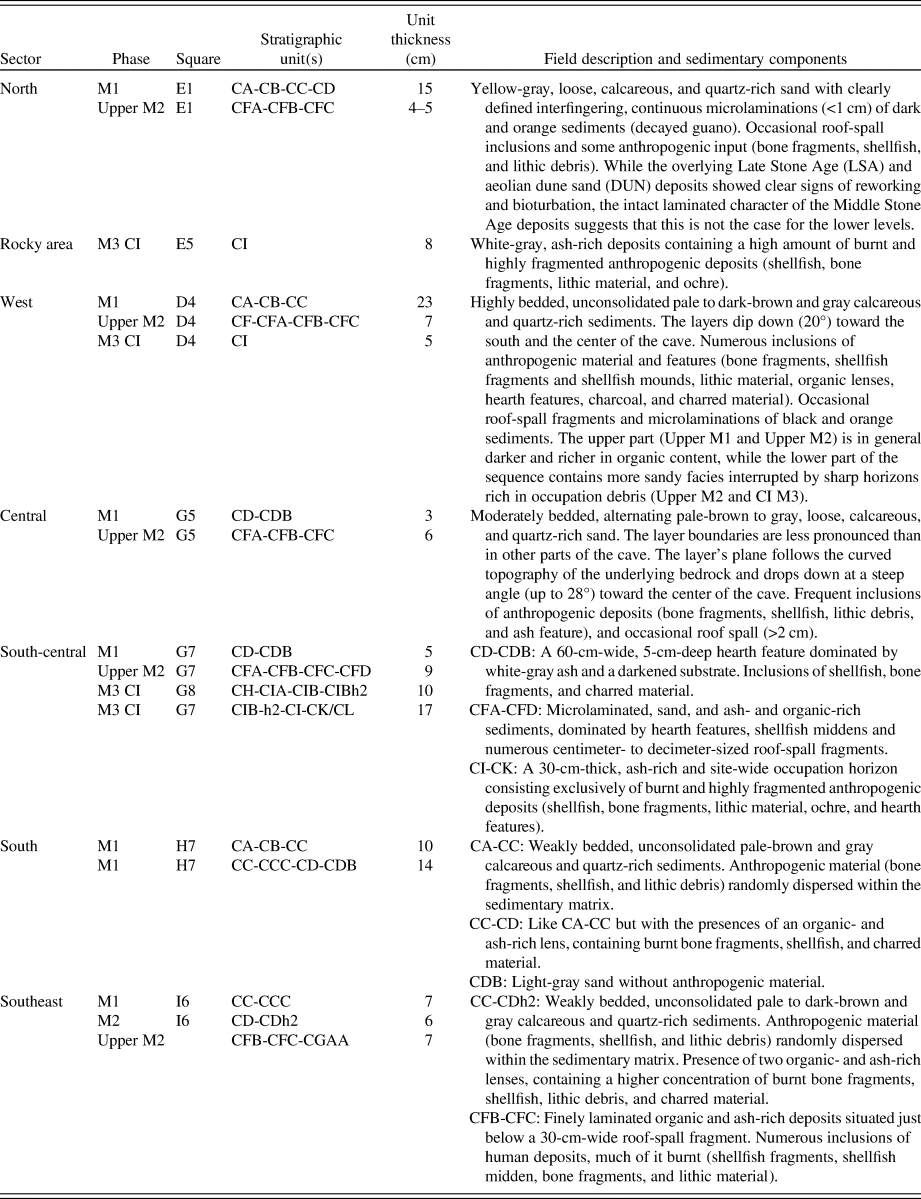
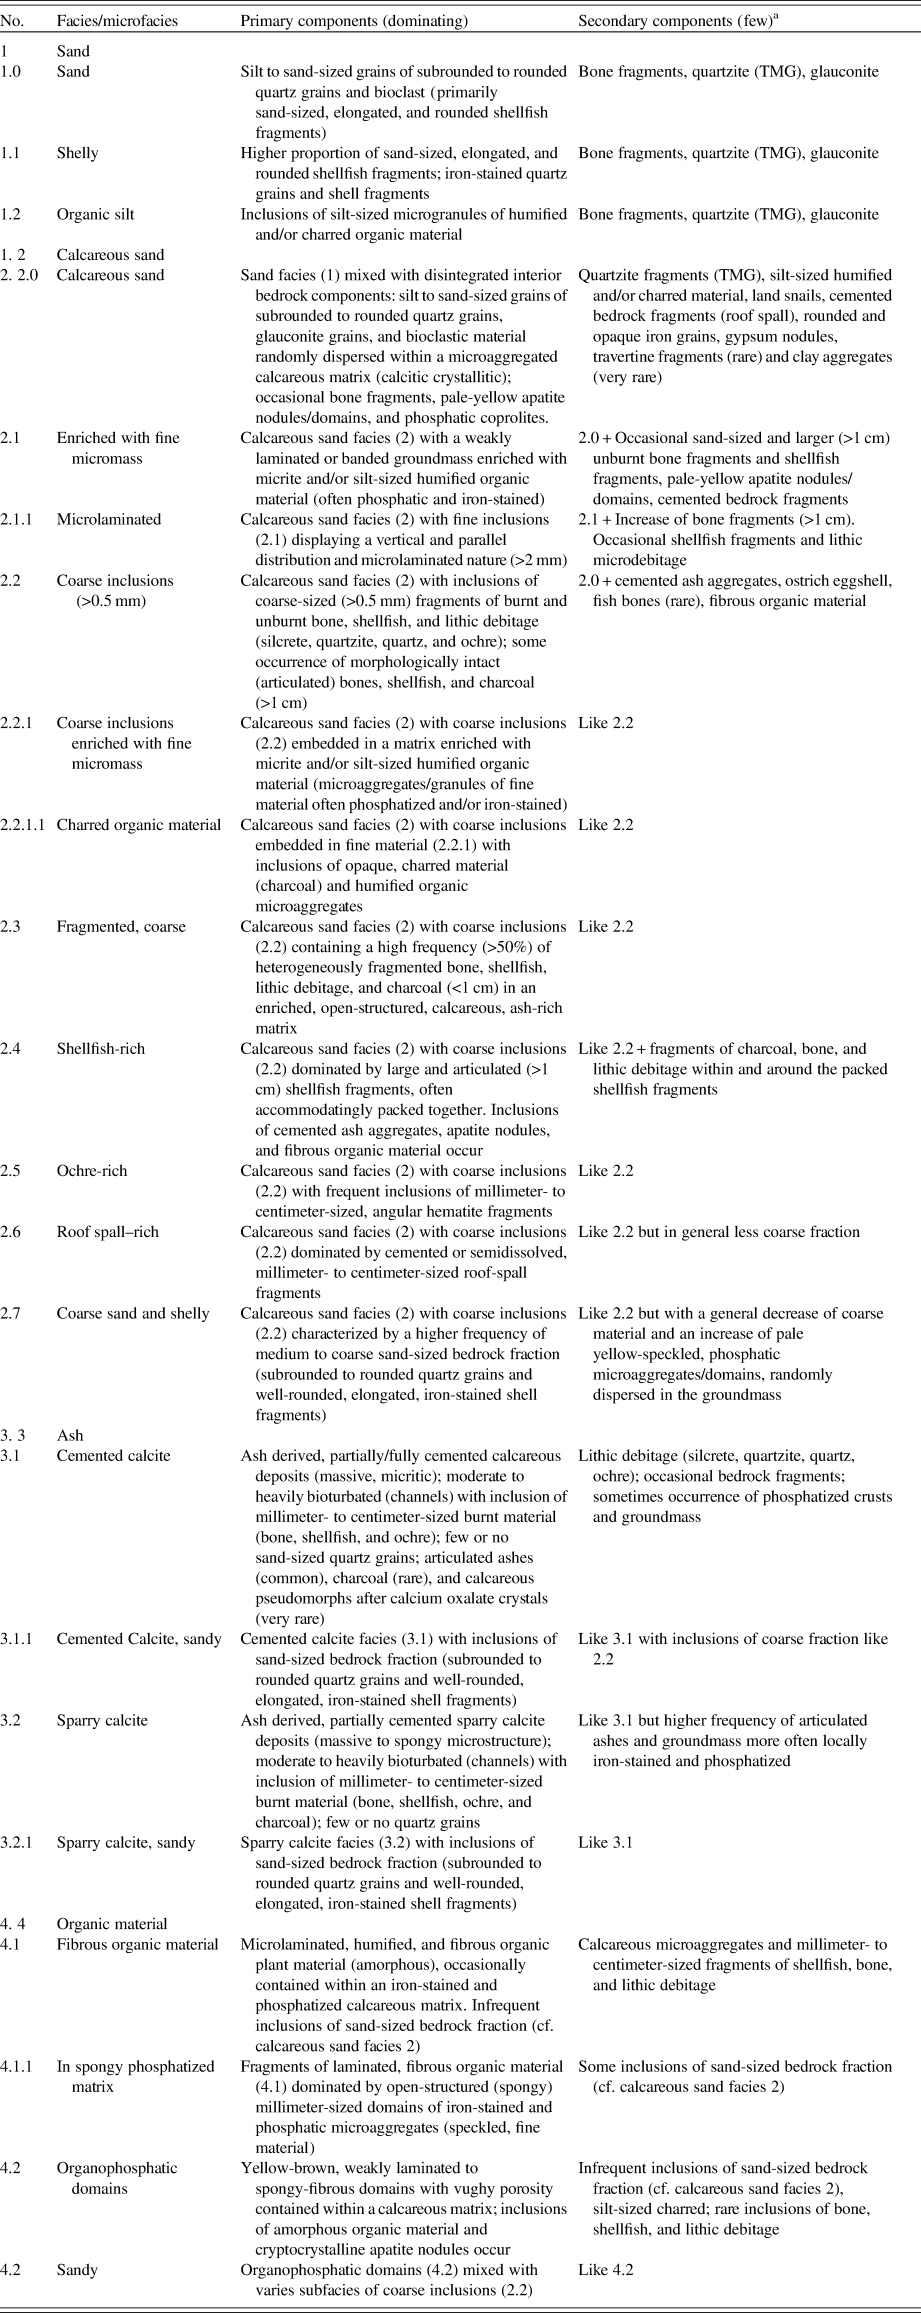
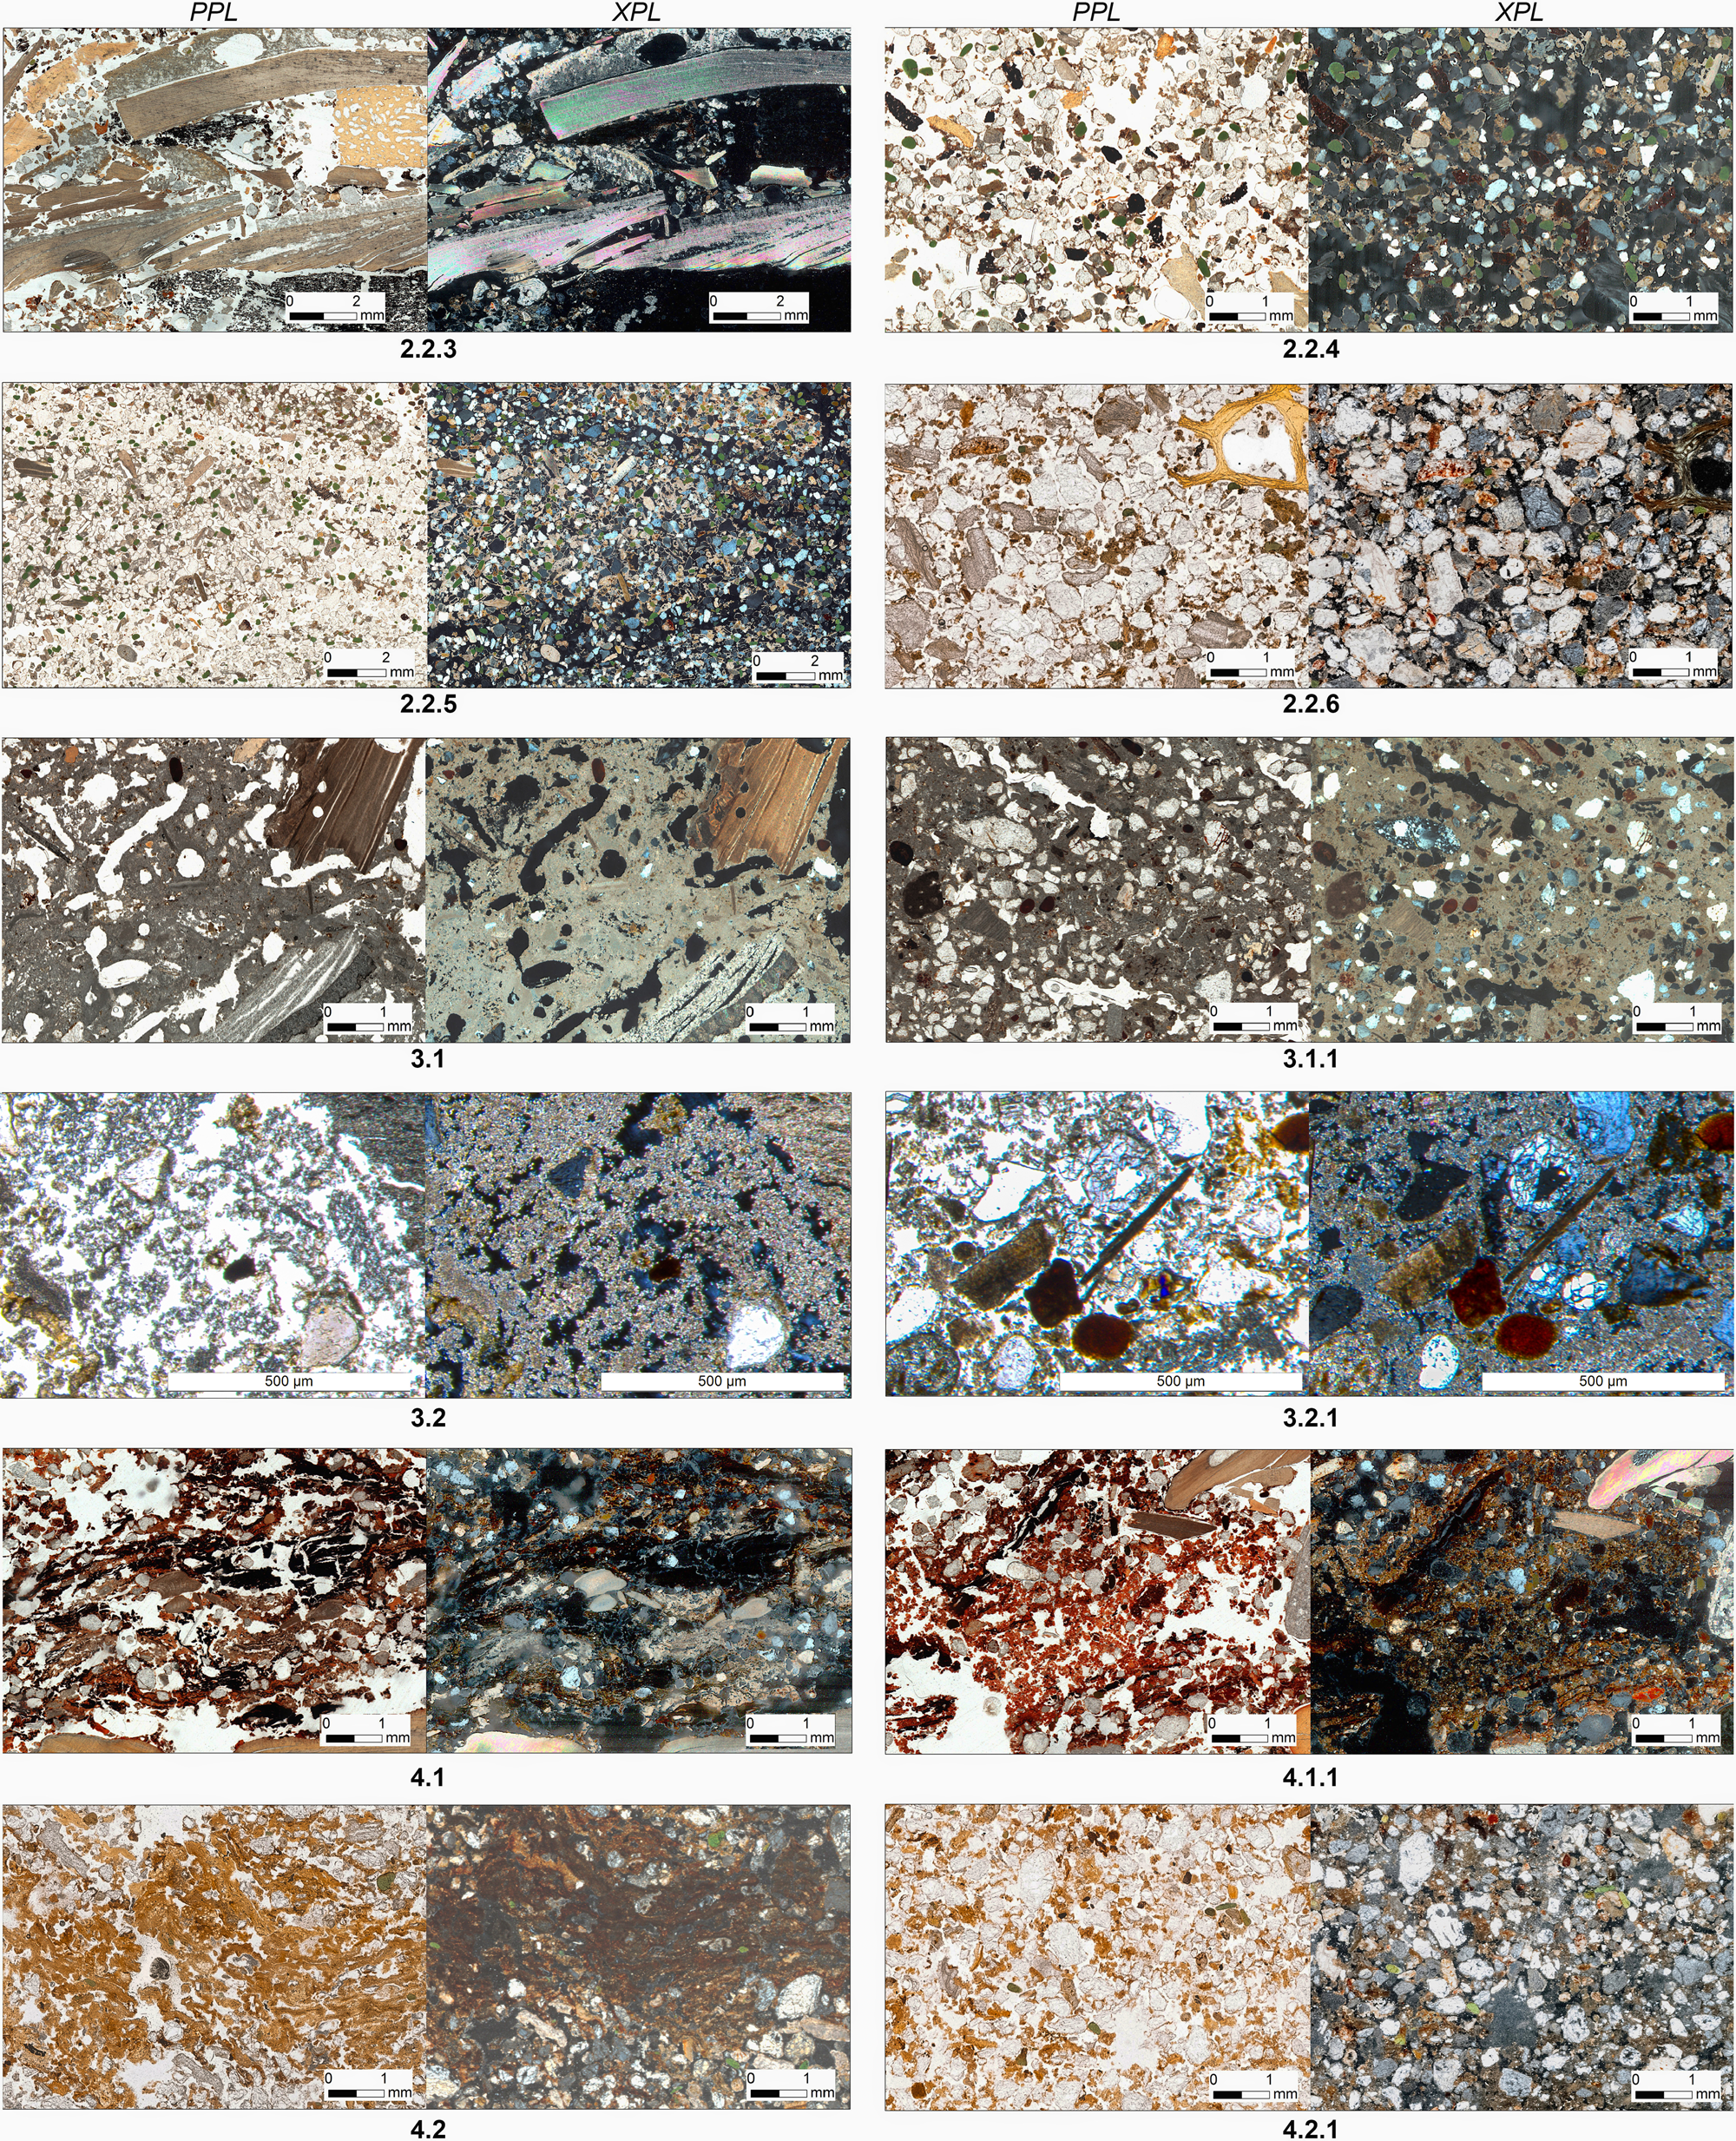
Following the criteria for microfacies classification (Table 2), we identified 8 main MF-types and 13 MF subtypes (Fig. 13). Descriptions for each MF-type and subtype are provided in Table 4, and corresponding photomicrographs (PPL and XPL) are provided in Figures 14 and 15.
(color online) Photomicrographs (XPL, cross-polarized light; PPL, plane-polarized light) of microfacies types and subtypes (part 2 of 2). (2.2.3) Calcareous sand with coarse anthropogenic inclusions dominated by articulated and fragmented shellfish fragments; (2.2.4) calcareous sand with coarse anthropogenic inclusions including sand to millimeter-sized ochre fragments; (2.2.5) calcareous sand dominated by sand to millimeter-sized roof-spall fragments with a few coarse anthropogenic inclusions; (2.2.6) calcareous coarse and shelly sand with anthropogenic inclusions; (3.1) cemented ash; (3.1.1) cemented ash mixed with sandy facies; (3.2) recrystallized ash (sparry calcite); (3.2.1) recrystallized ash (sparry calcite) mixed with sandy facies; (4.1) fibrous organic material; (4.1.1) fibrous organic material embedded in phosphatized and iron-stained spongy material; (4.2) microlaminated, fibrous organophosphatic domains; (4.2.1) organophosphatic domains mixed with coarse sandy facies. See Table 4 for detailed descriptions and Table 5 for interpretations.
Microcontextual analysis
Once we established the microfacies classification scheme (Table 4), we applied it to all thin sections in this study (Table 1), during which MF-units were spatially mapped and classified as MF-types. A complete analysis of all thin sections, including systematic close-up photomicrographs and elemental mapping, are provided in Supplementary Appendix A. A general summary of both field and microscale observations, along with microcontextual synthesis figures (Figs. 16–24), are provided in the following sections and presented by phase.
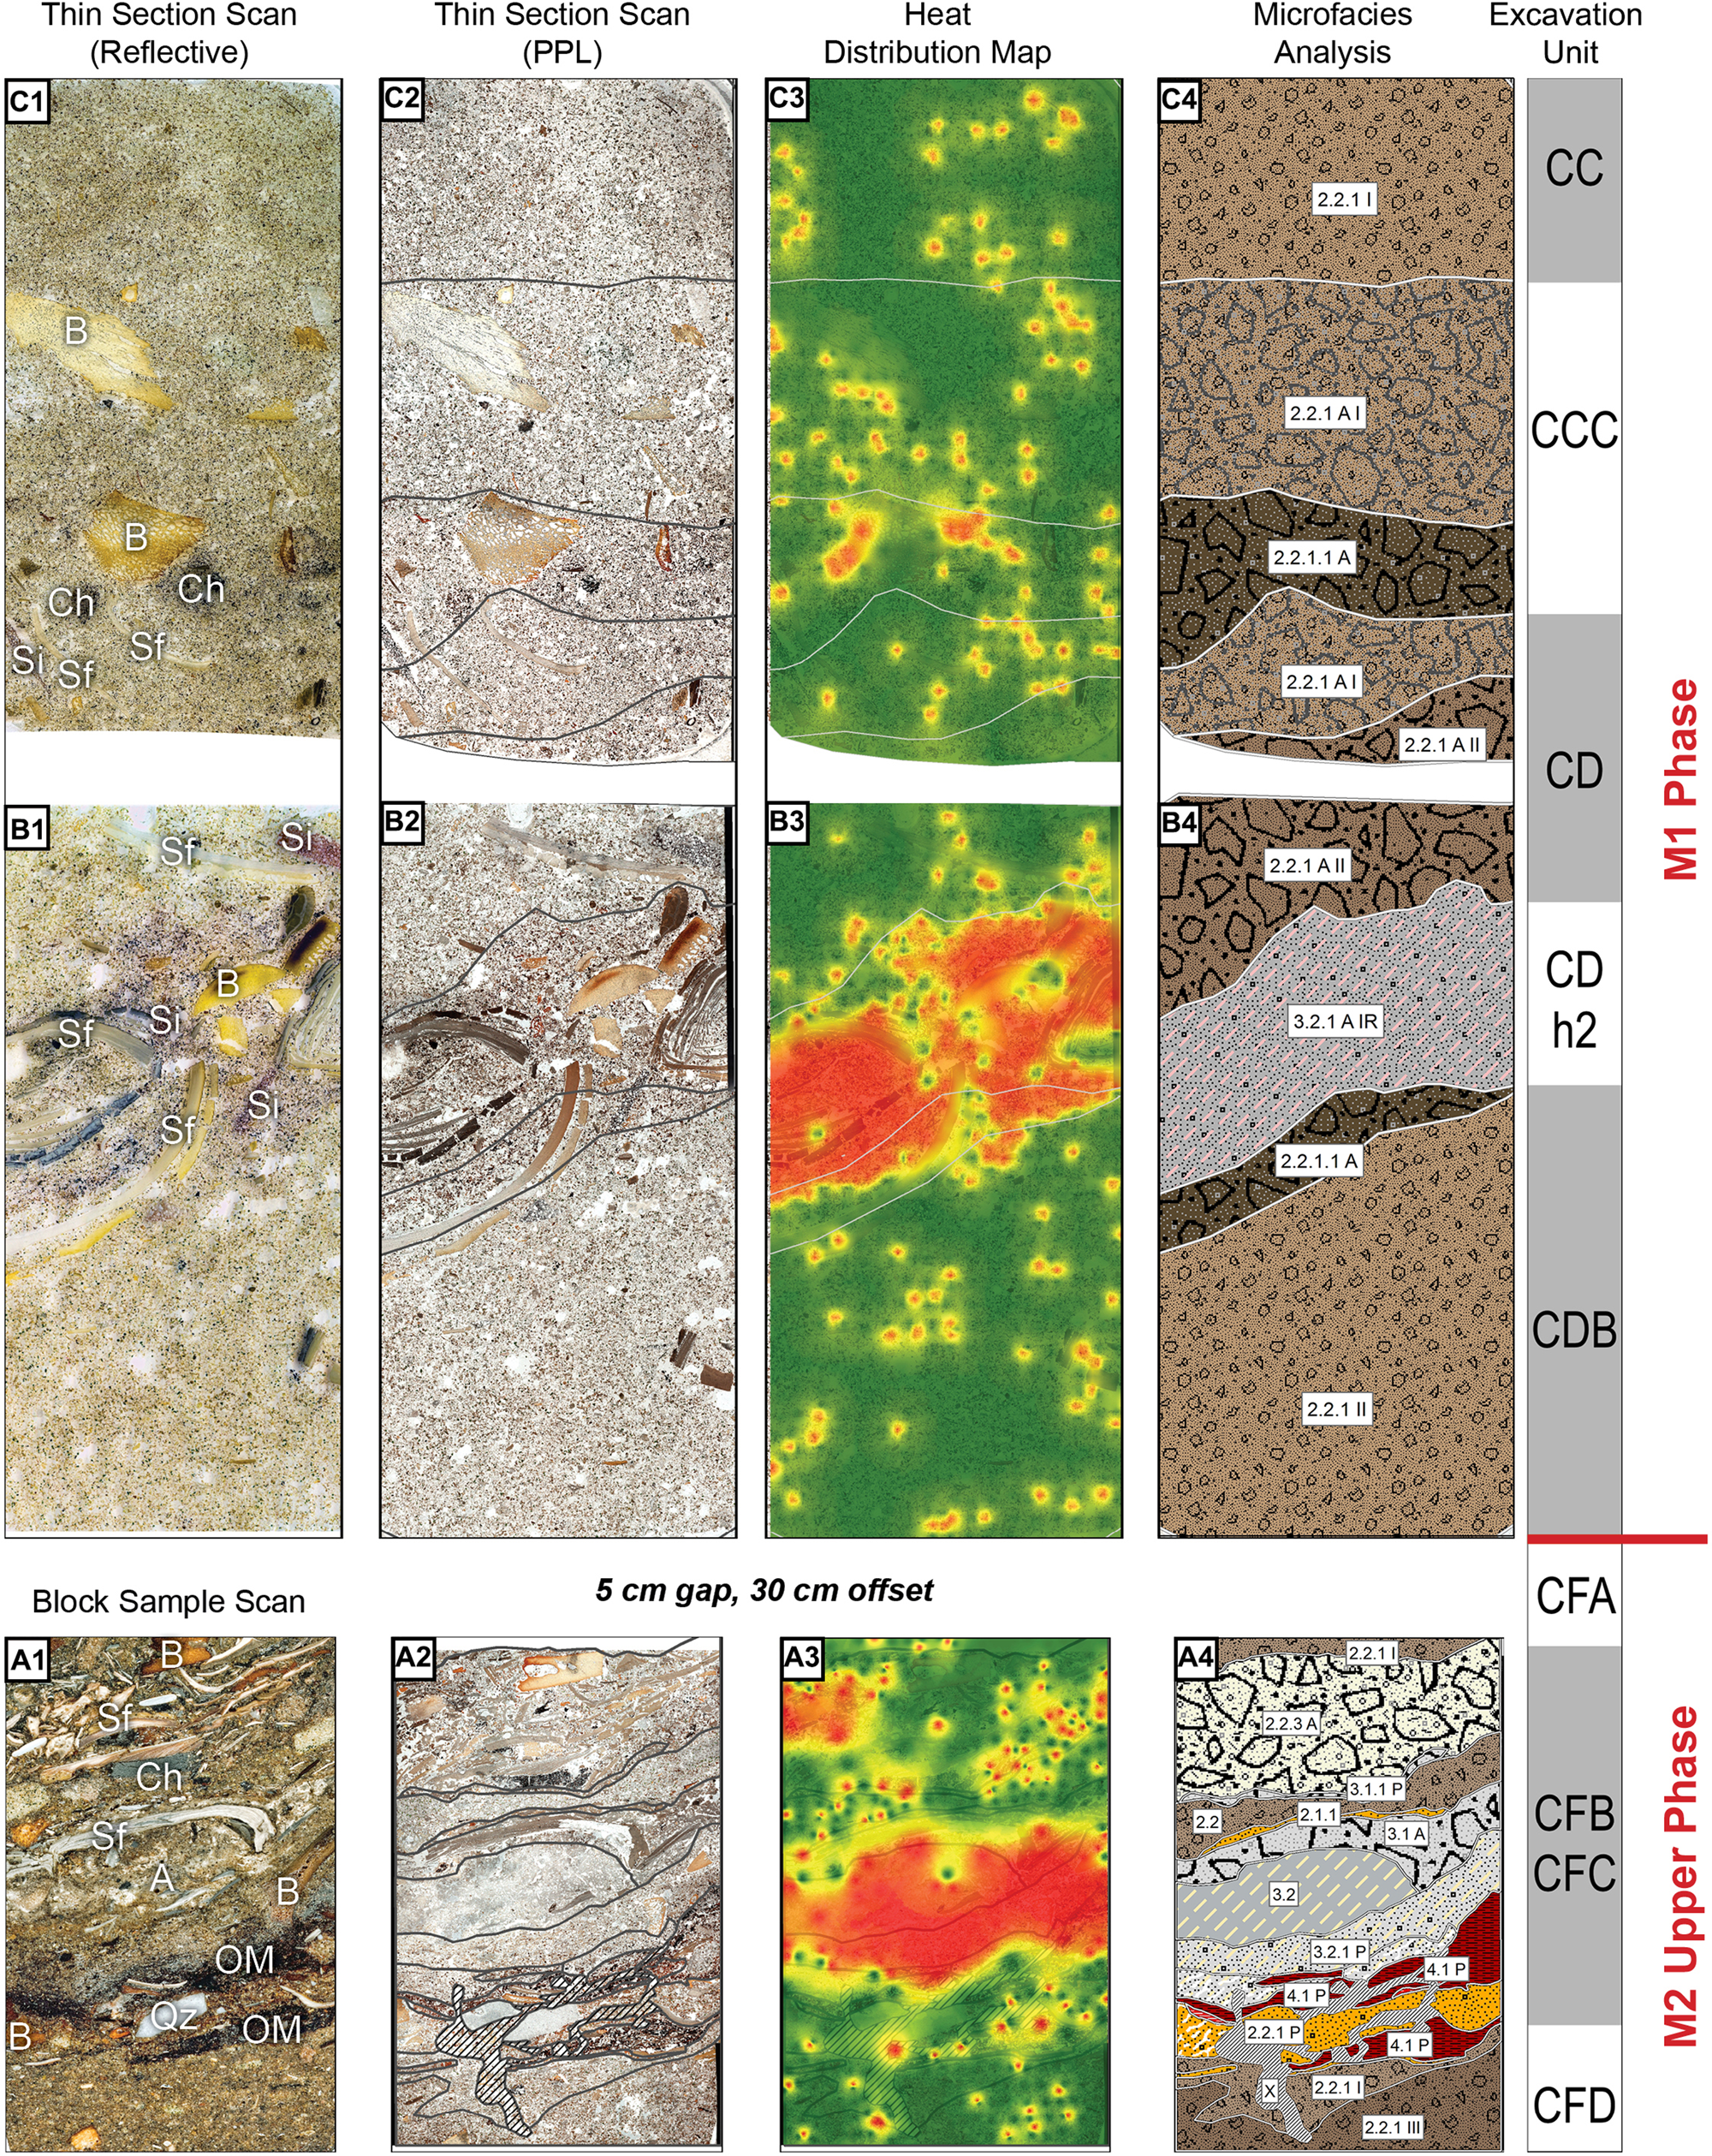
Microscale analysis of block samples BBC-13-14 (A) and BBC-13-13 (B) from the M3 CI phase in the south-central sector. Corresponding archaeostratigraphic excavation units and Middle Stone Age (MSA) phase(s) indicated. (A1, B1) thin sectionthin section reflective flatbed scan. Abbreviations: A, ash; B, bone fragment; Br, bedrock fragment; Ch, charcoal; O, ochre fragment (hematite); OM, organic material; Sf, shellfish; Sil, silcrete fragment; Qz, quartz fragment. (A2, B2) Thin sectionThin section film scan (PPL, plane-polarized light); (A3, B3) heat-distribution maps; (A4, B4) microfacies analysis. Yellow dots indicate areas of elongated domains of phosphatized cemented ash; orange dotted lines indicate weak bedding planes. Thin sectionThin section width: 75 mm. See Supplementary Appendix A Figures A4 and A5 for detailed microstratigraphic outlines and Figures A4.1 and A5.1 for associated photomicrographs. (For interpretation of the references to color in this figure legend, the reader is referred to the web version of this article.)
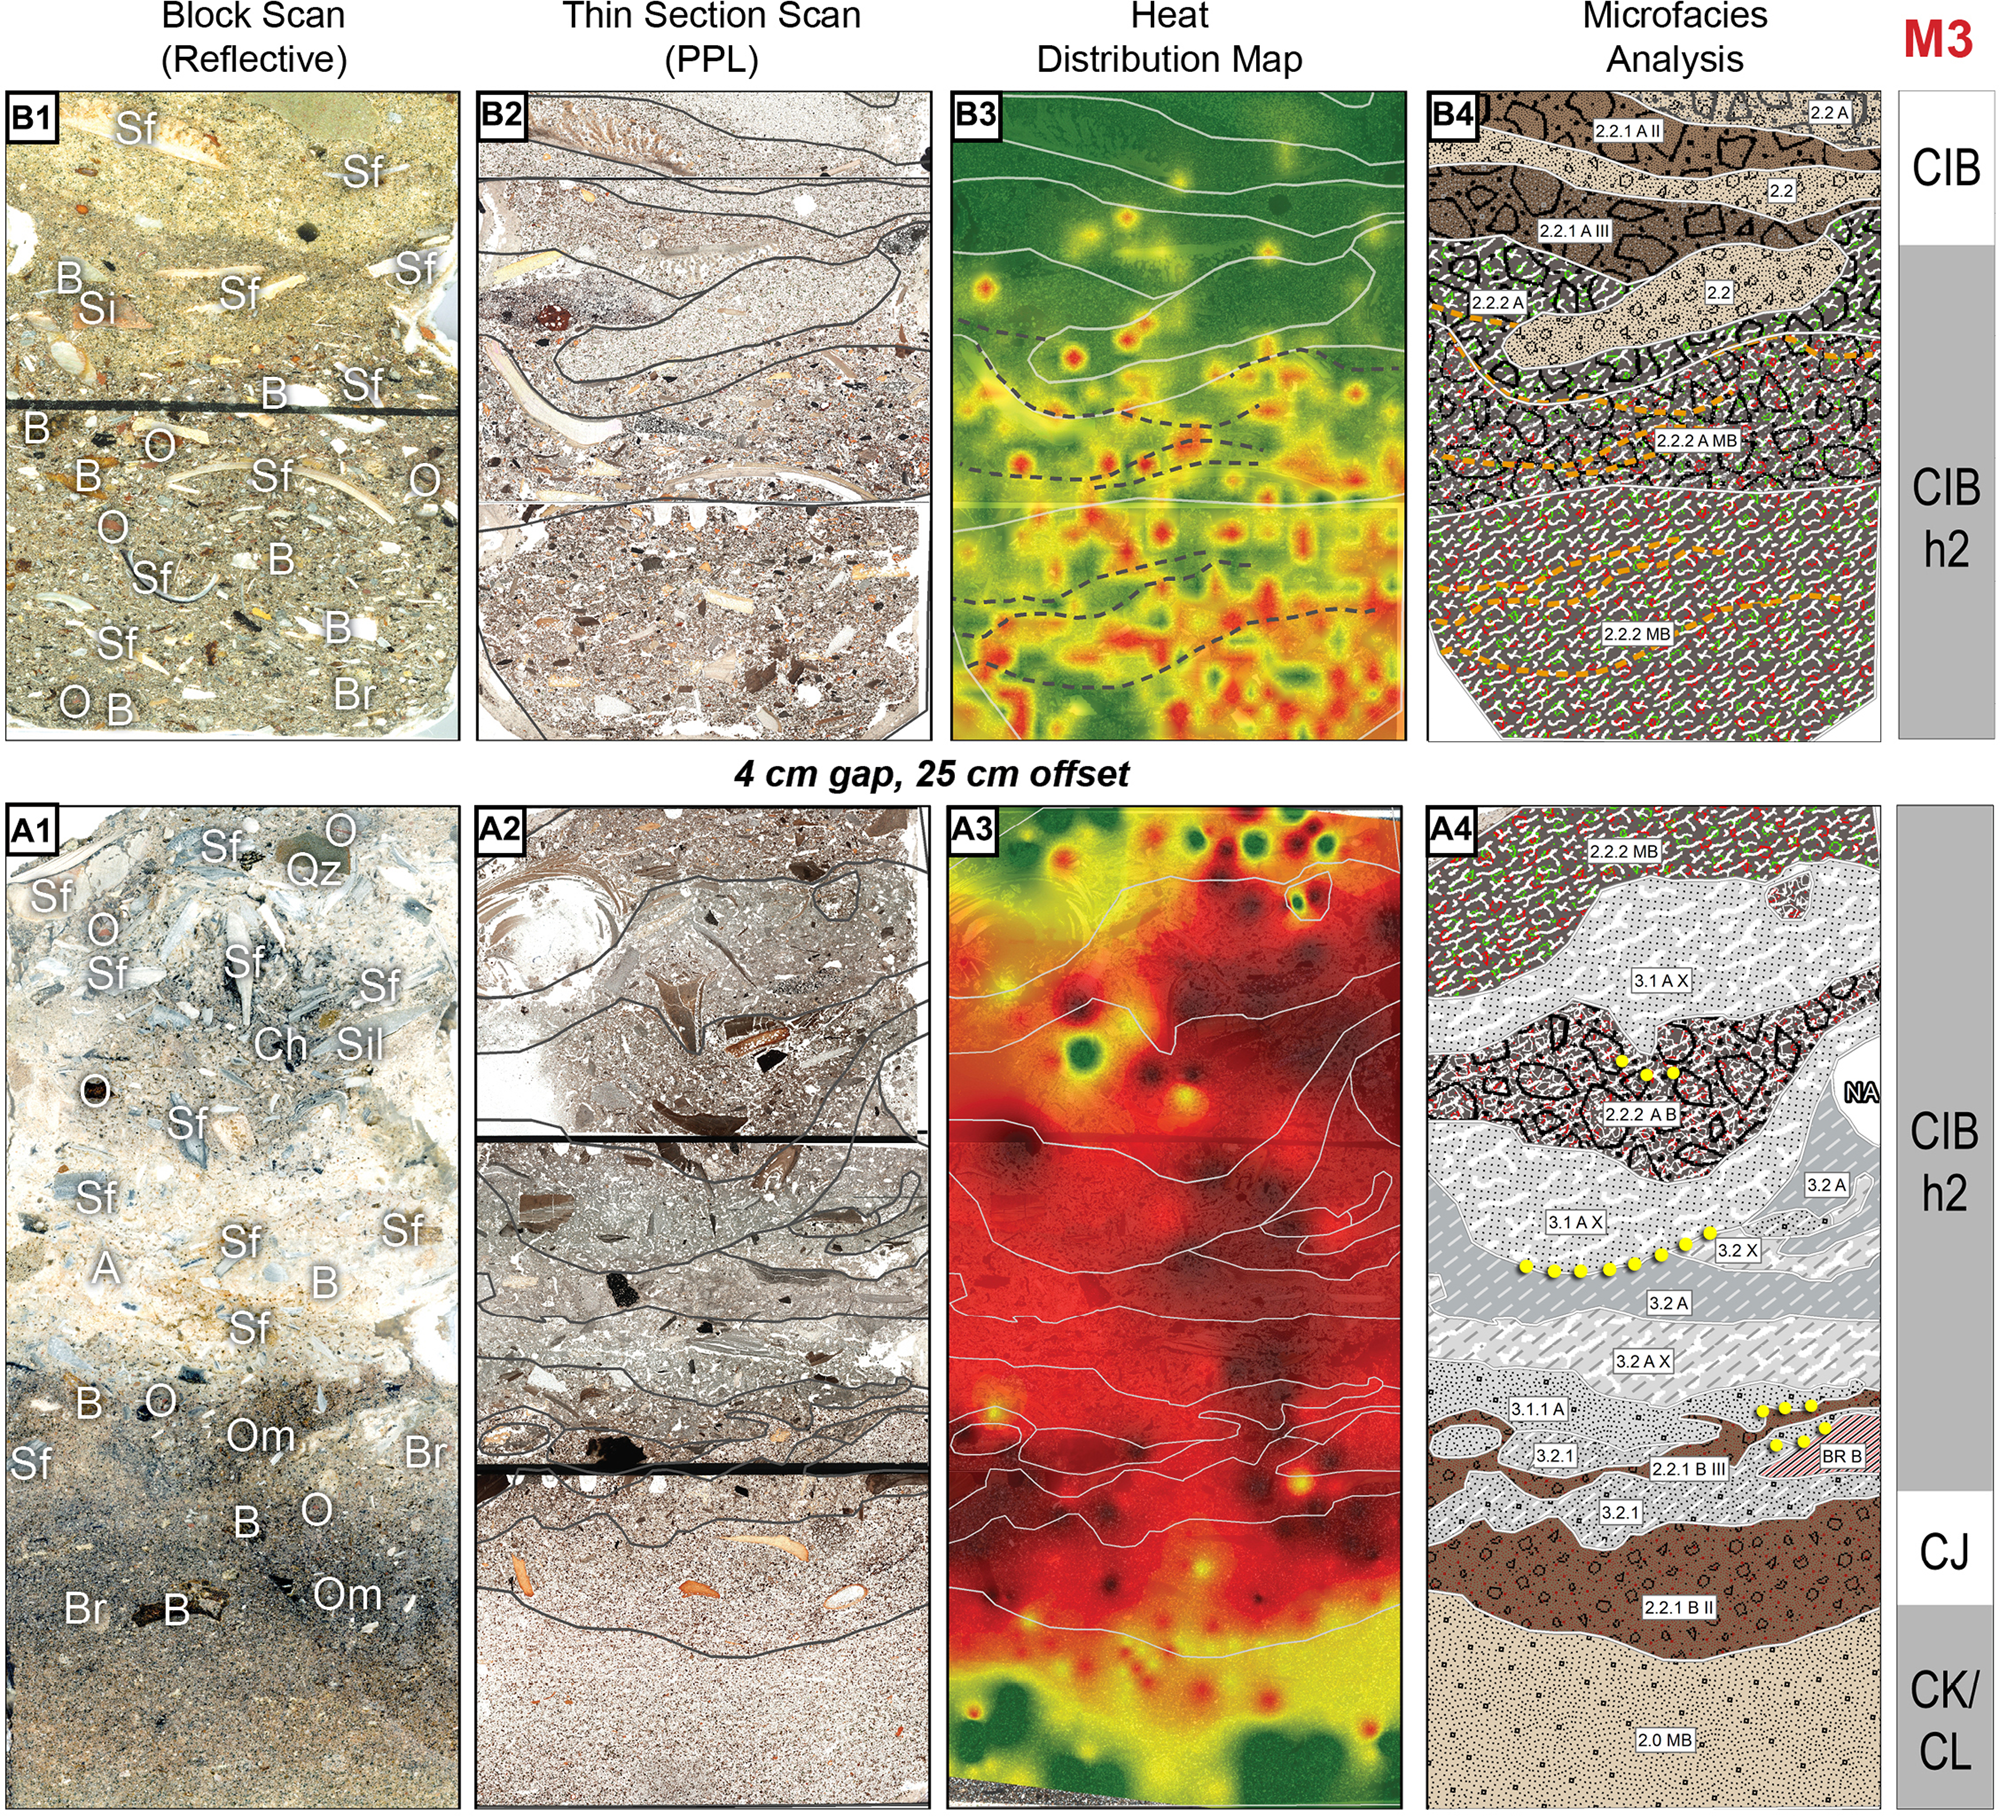
(color online) Microscale analysis of block samples BBC-00-25-3 (A) and BBC-00-19 (B) from the M3 CI phase in the west sector (A) and below the rocky area (B). Corresponding archaeostratigraphic excavation units and Middle Stone Age (MSA) phase(s) indicated. (A1, B1) Block scan. Abbreviations: A, ash; B, bone fragment; Br, bedrock fragment; Ch, charcoal; O, ochre; Sil, silcrete; Sf, shellfish. (A2, B2) Thin section film scans (PPL, plane-polarized light); (A3, B3) heat-distribution maps; (A4, B4) microfacies analysis. Thin section width: 50 mm. See Supplementary Figures A10 and A11 for detailed microstratigraphic outlines and Figures A10.1 and A11.1 for associated photomicrographs.

(color online) Microscale analysis of block samples BBC-00-25-2 (A) from the Upper M2 phase in the west sector. Corresponding archaeostratigraphic excavation units and Middle Stone Age (MSA) phase(s) indicated. (A1) Block scans. Abbreviations: A, ash; B, bone fragment; Br, bedrock fragment; OM, organic material; Sf, shellfish. (A2) Thin section film scans (PPL, plane-polarized light); (A3) heat-distribution maps; (A4) microfacies analysis. Thin section width: 50 mm. See Supplementary Figure A12 for detailed microstratigraphic outlines and Figure A12.1 for associated photomicrographs.
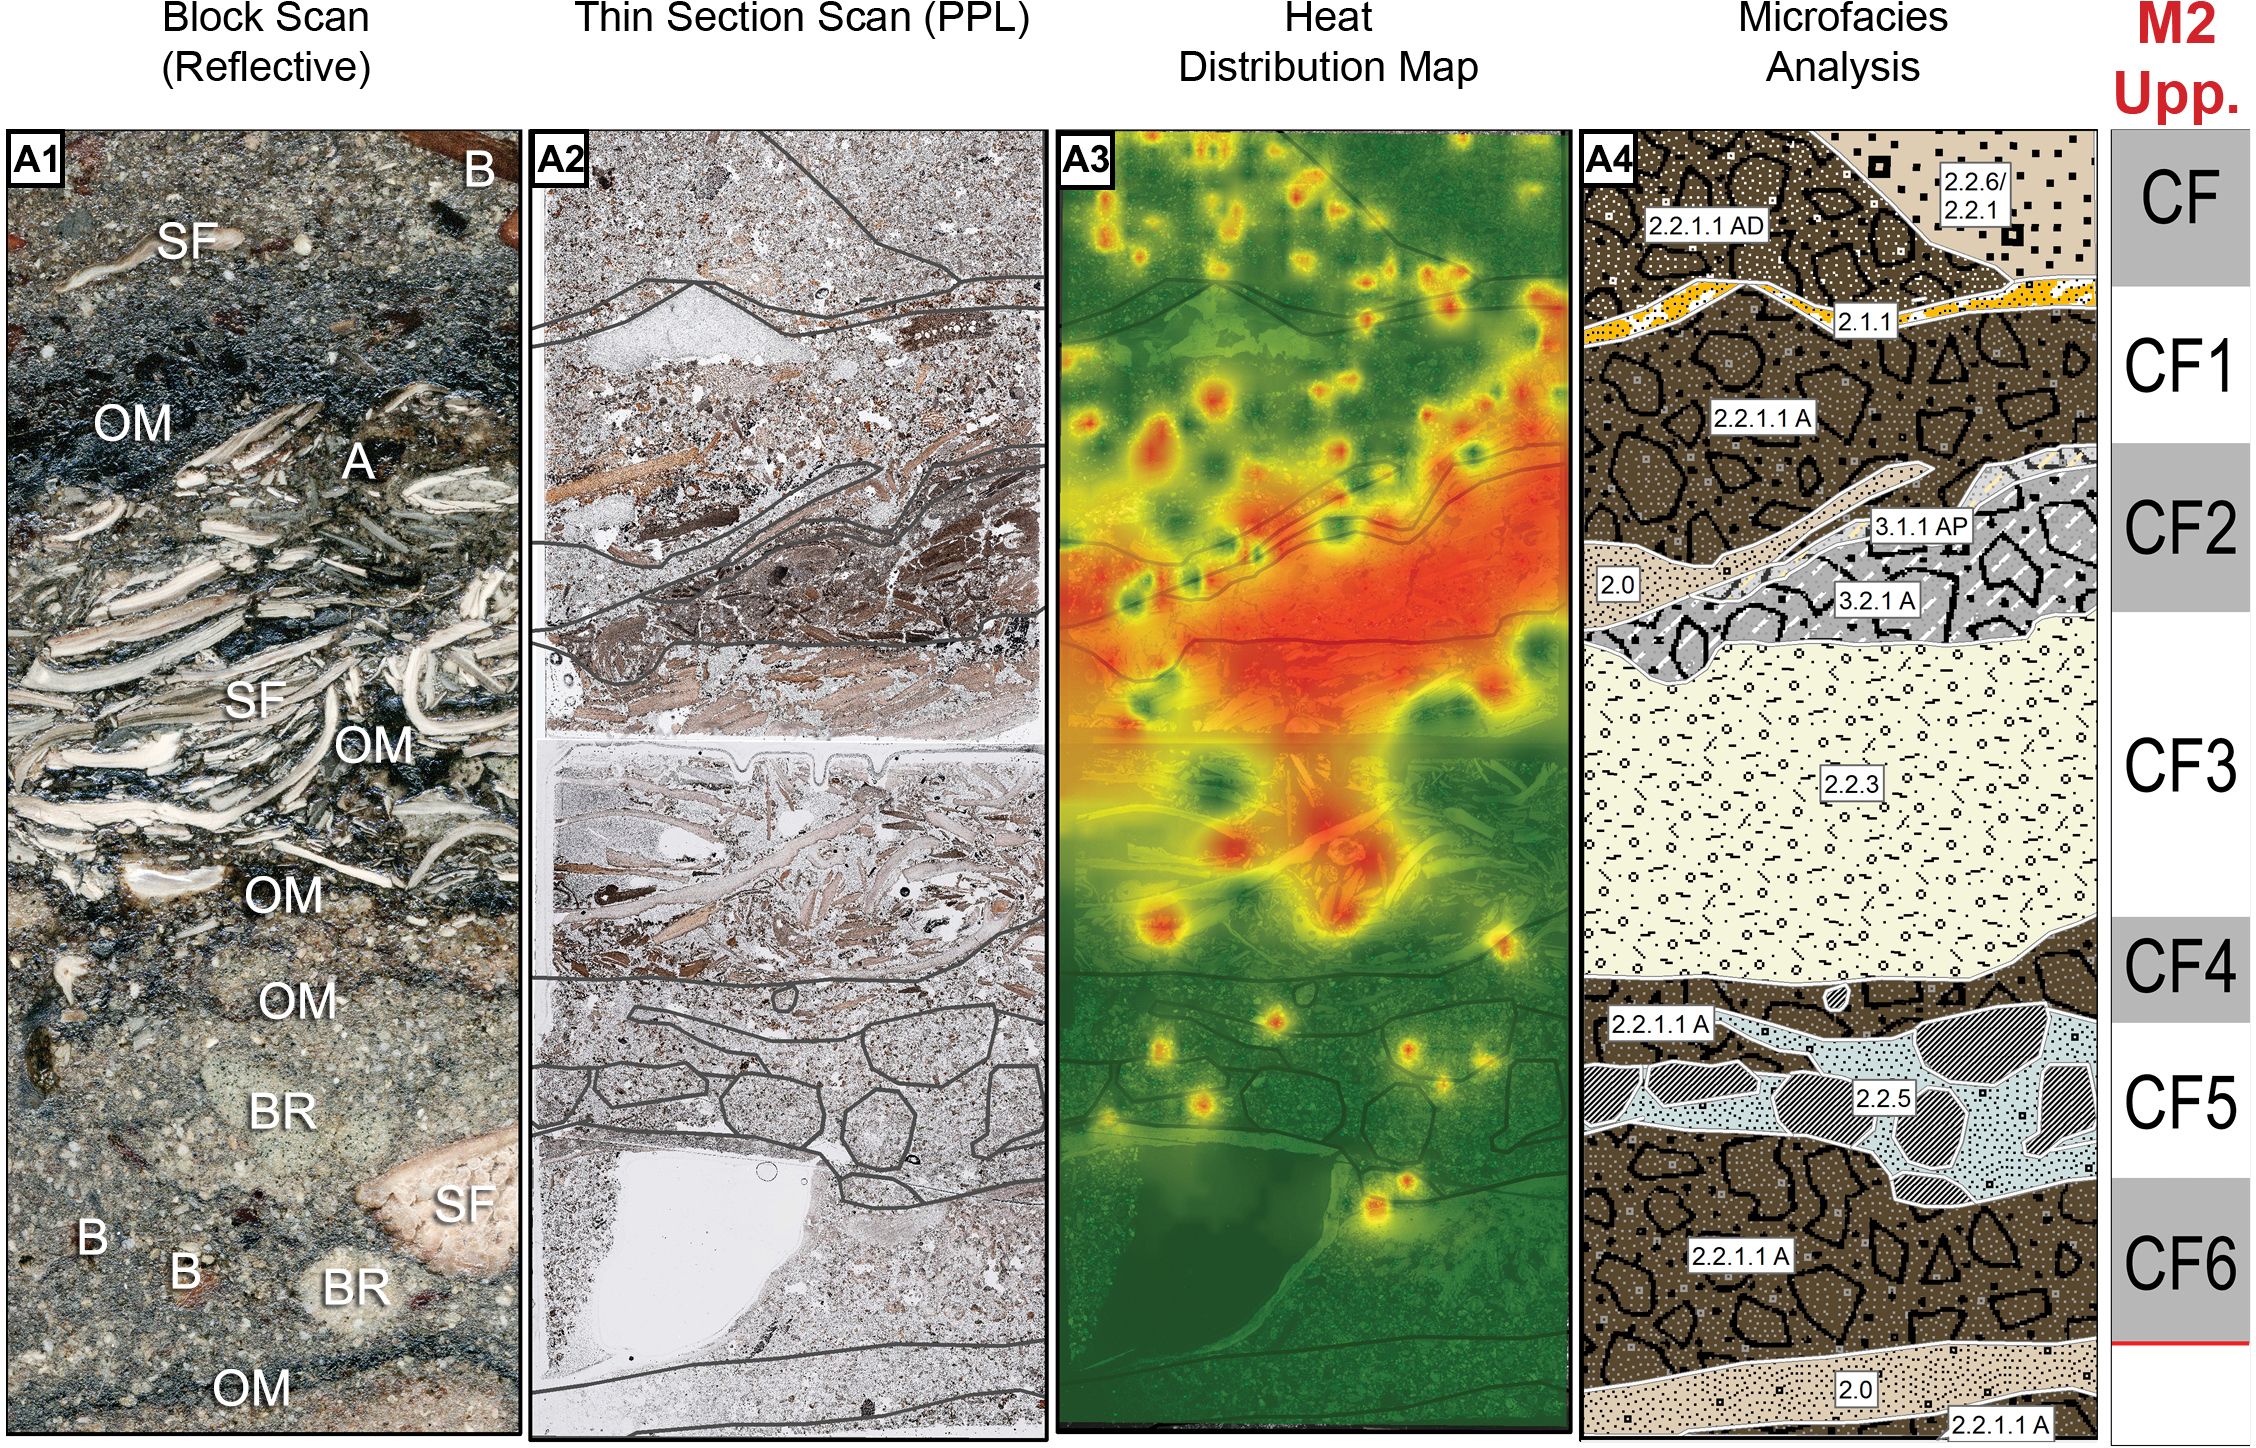
(color online) Microscale analysis of block samples BBC-13-16 (A) and BBC-13-01 (B) from the M1 and Upper M2 phases in the south-central sector. Corresponding archaeostratigraphic excavation units and Middle Stone Age (MSA) phase(s) indicated. (A1, B1) Block scan; Abbreviations: A, ash; B, bone fragment; Br, bedrock fragment; O, ochre fragment (hematite); OM, organic material; Sf, shellfish. (A2, B2) thinsection film scan (PPL, plane-polarized light); (A3, B3) heat-distribution maps; (A4, B4) microfacies analysis. Thin section width: 50 mm (top) and 75 mm (bottom). See Supplementary Appendix A Figures A6 and A7 for detailed microstratigraphic outlines and Figures A6.1 and A7.1 for associated photomicrographs.
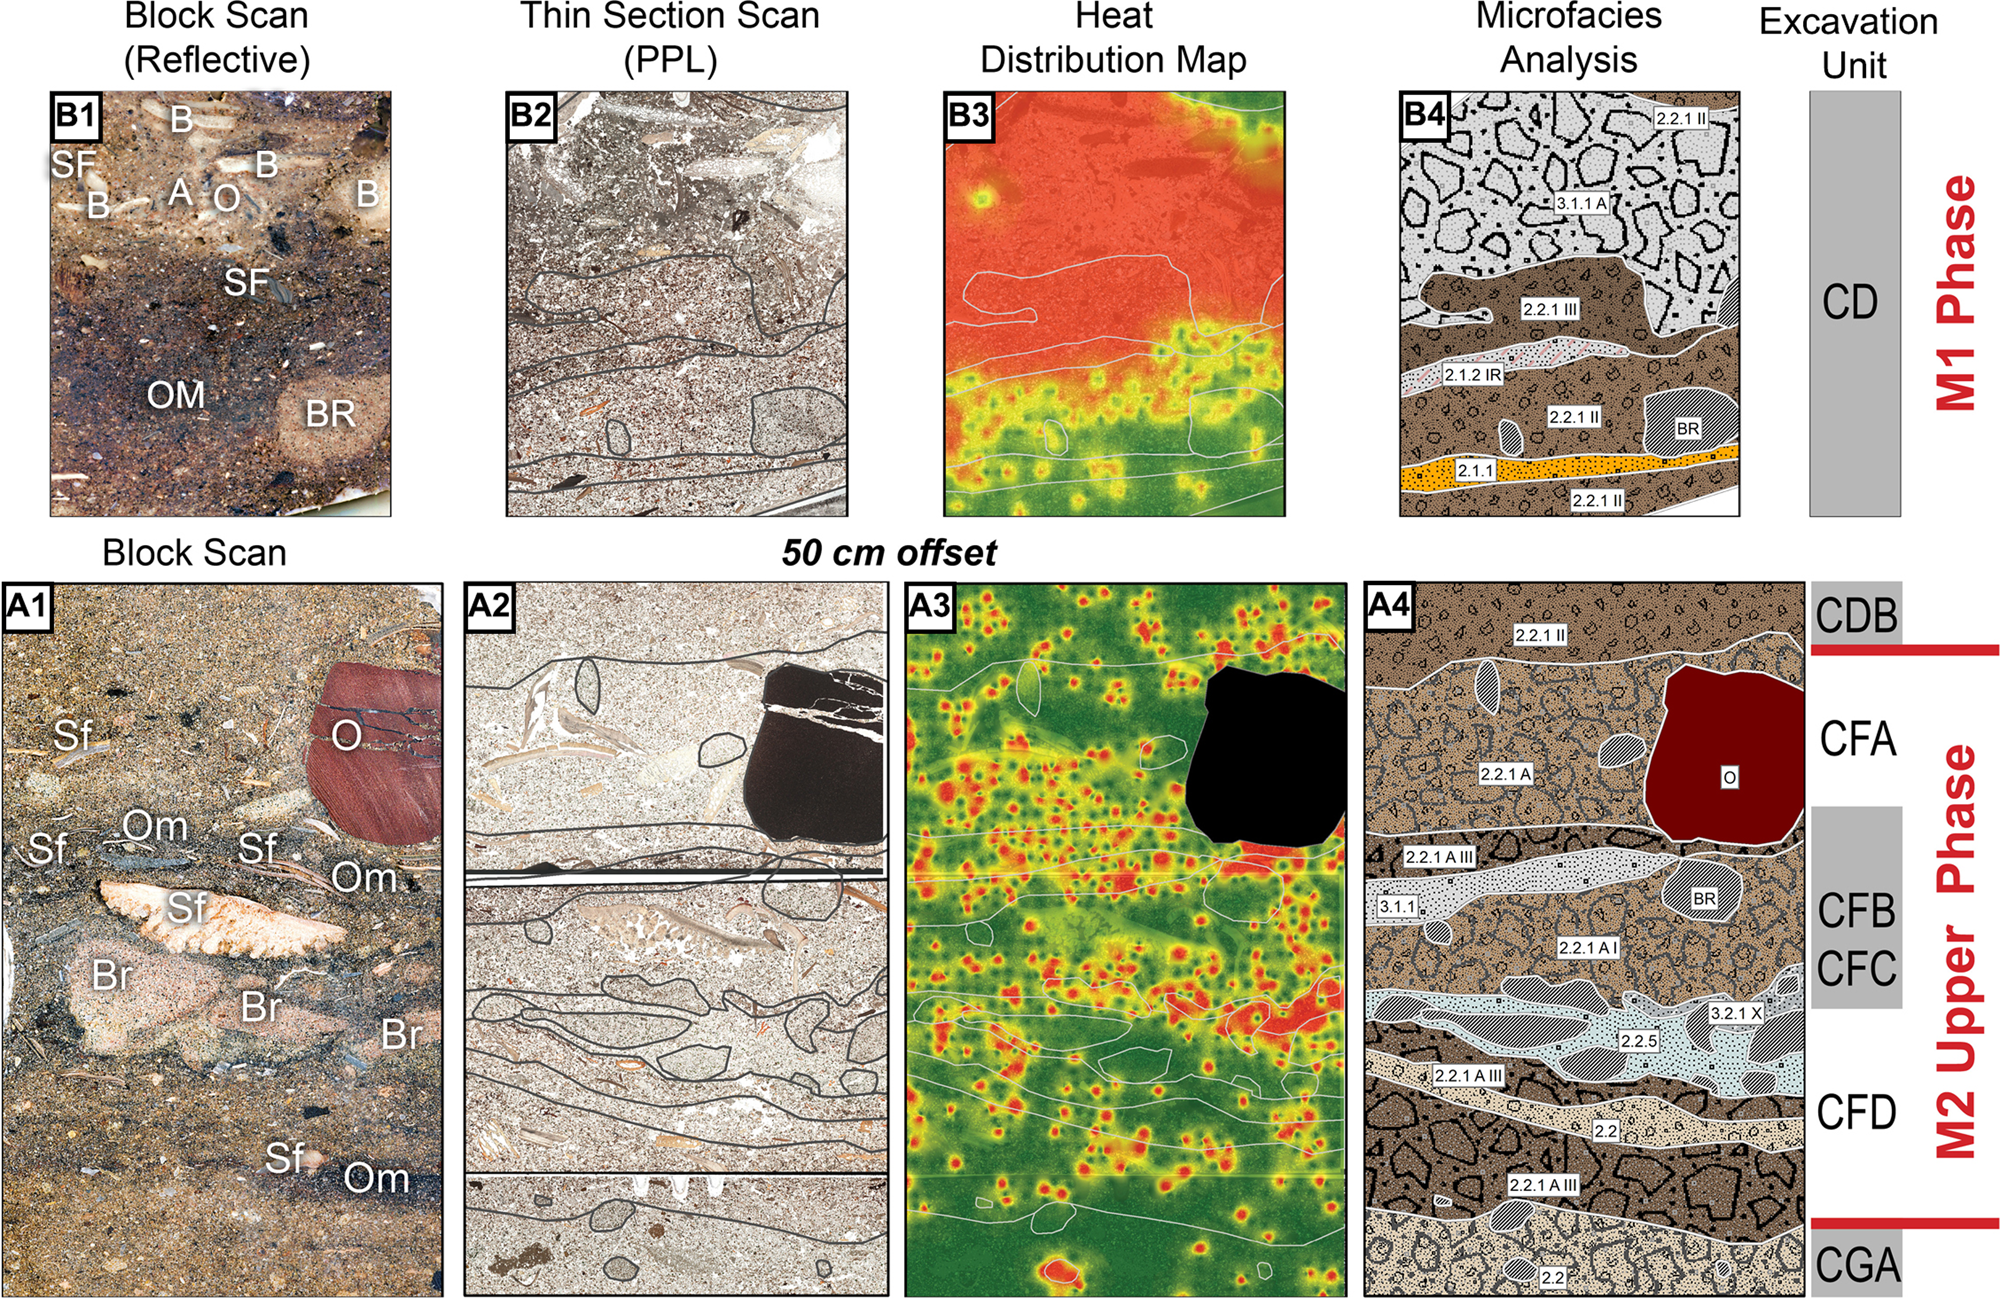
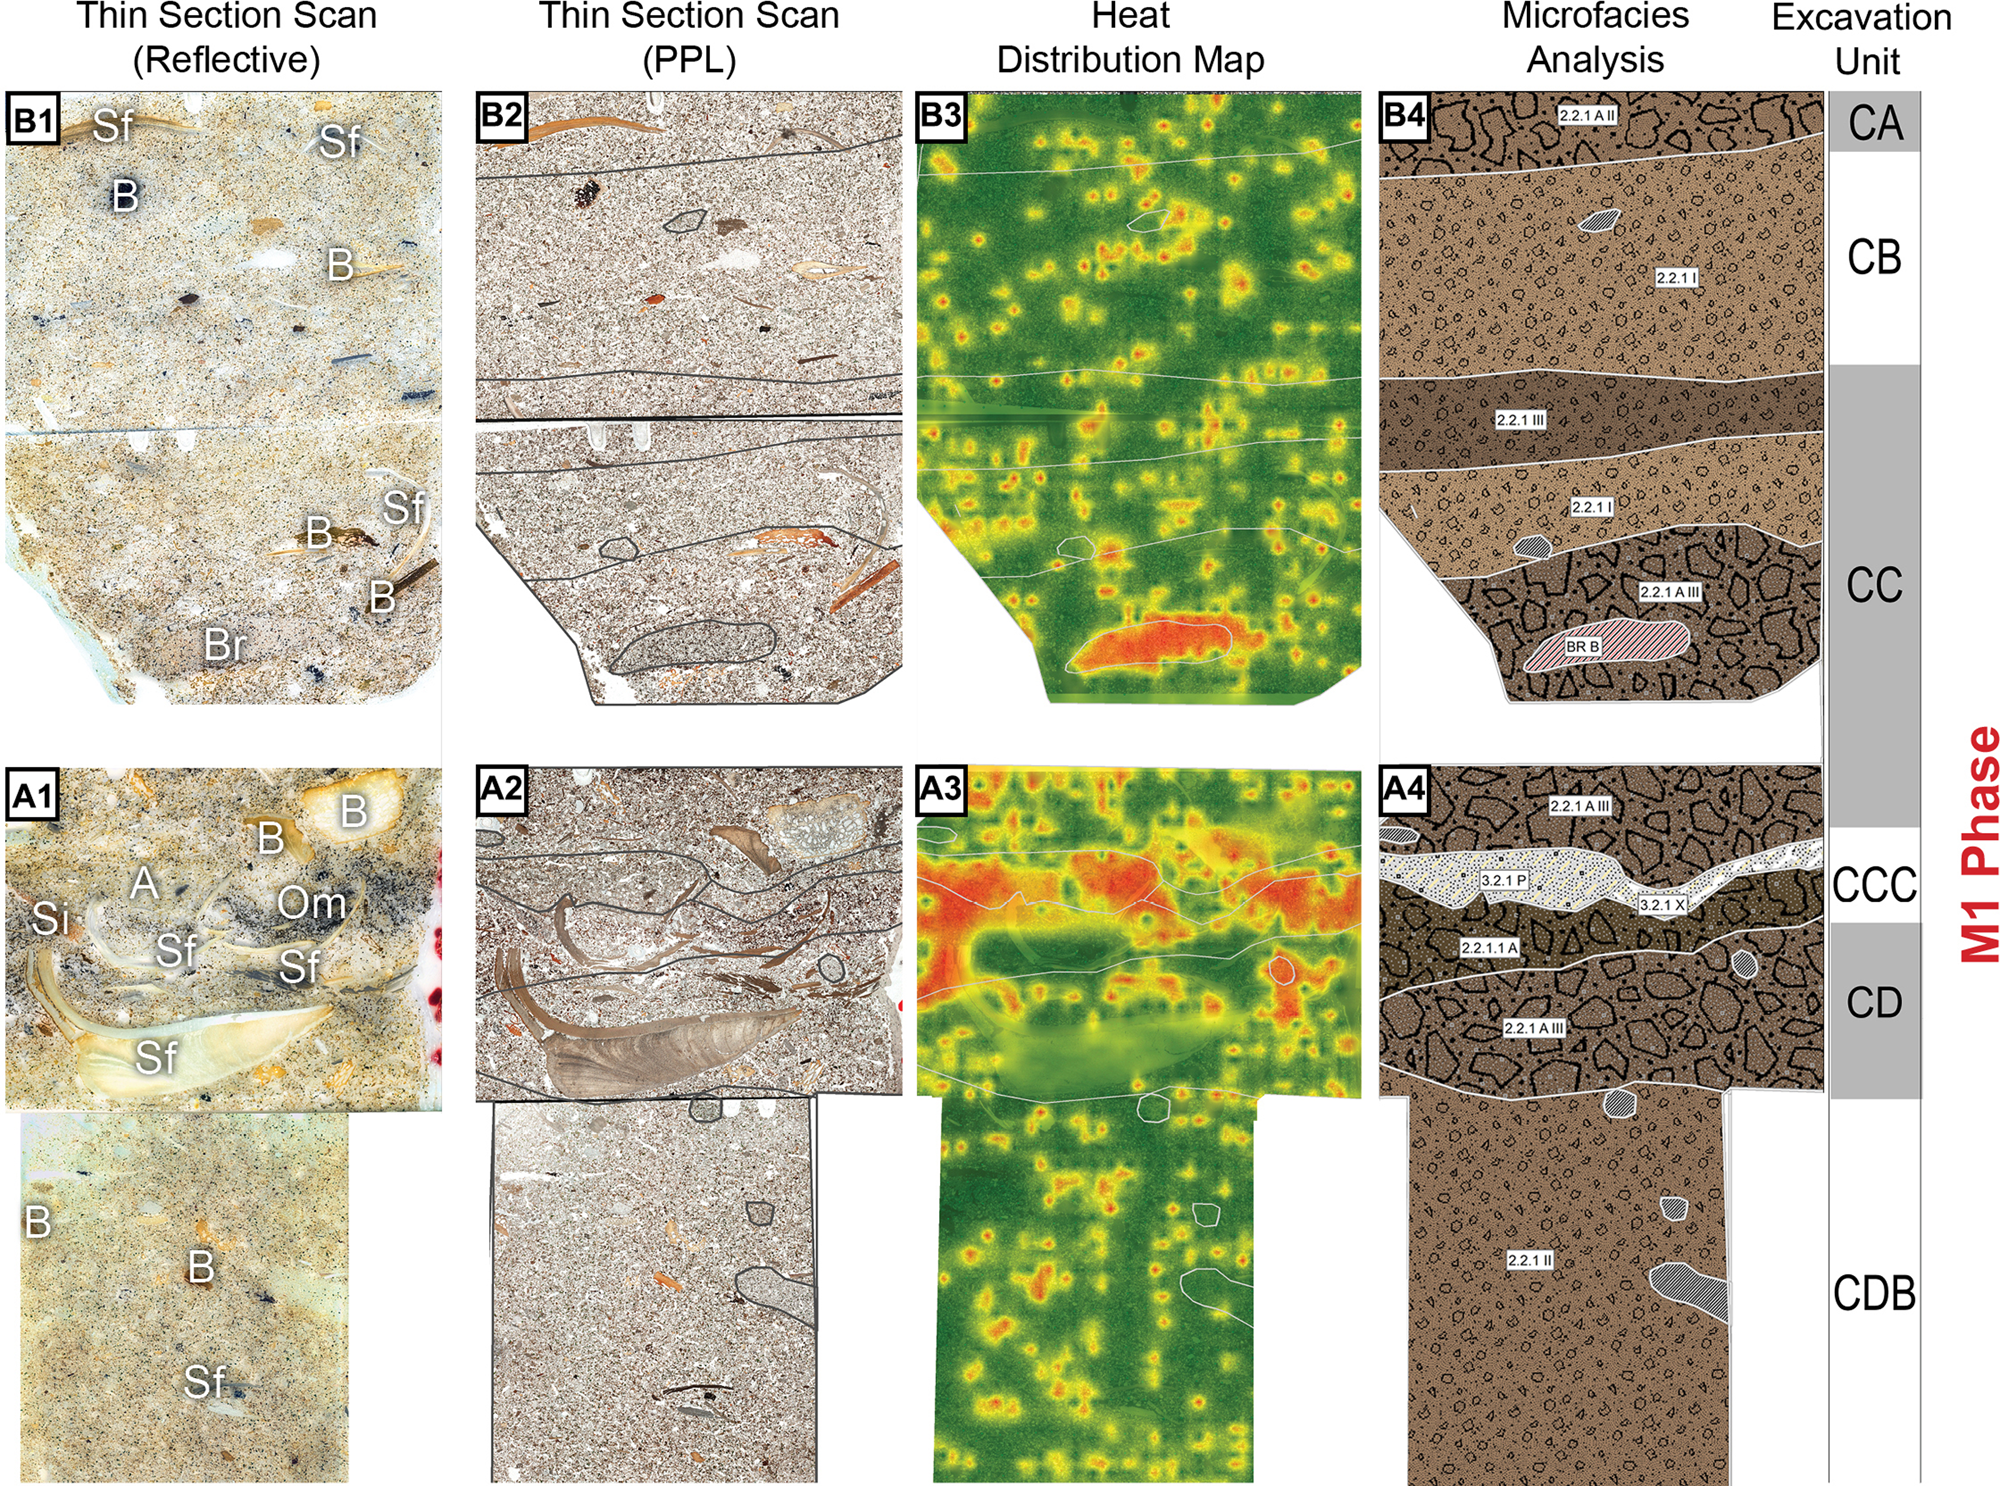
(color online) Microscale analysis of block samples BBC-00-17 from the M1 (B) and Upper M2 (A) phases in the central sector. Corresponding archaeostratigraphic excavation units and Middle Stone Age (MSA) phase(s) indicated. (A1, B1) Block scans. Abbreviations: A, ash; B, bone fragment; Br, bedrock fragment; OM, organic material; Sf, shellfish; Si, silcrete fragment. (A2, B2) Thinsection film scans (PPL, plane-polarized light); (A3, B3) heat-distribution maps; (A4, B4) microfacies analysis. Thin section width: 50 mm. See Supplementary Appendix A Figures A8 and A9 for detailed microstratigraphic outlines and Figures A8.1 and A9.1 for associated photomicrographs.
(color online) Microscale analysis of block samples BBC-10-05 (A), BBC-10-04 (B), and BBC-10-03 (C) from the phases Upper M2 and M1 in the southeast sector. Corresponding archaeostratigraphic excavation units and Middle Stone Age (MSA) phase(s) indicated. (A1) block scan; (B1, C1) thin section reflective flatbed scan. Abbreviations: A, ash; Ch, charcoal; B, bone fragment; OM, organic material; Sf, shellfish; Sil, silcrete fragment; Qz, quartz fragment. (A2, B2, C2) Thin section film scan (PPL, plane-polarized light); (A3, B3, C3) heat-distribution maps; (A4, B4, C4) microfacies analysis. Thinsection width: 70 mm (top). See Supplementary Figures A1 and A2 for detailed microstratigraphic outlines and Figures A1.1 and A2.1 for associated photomicrographs.
(color online) Microscale analysis of block samples BBC-13-11 (A) and BBC-13-10 (B) from the M1 phase in the south sector. Corresponding archaeostratigraphic excavation units and Middle Stone Age (MSA) phase(s) indicated. (A1, B1) Thin section reflective flatbed scan; (A2, B2) thin section film scan (PPL, plane-polarized light). Abbreviations: A, ash; B, bone fragment; BR, burnt bedrock fragment; OM, organic material; Sf, shellfish; Sil, silcrete fragment; Qz, quartz fragment. (A3, B3) Heat-distribution maps; (A4, B4) microfacies analysis. Thin section width: 75 mm (top). See Supplementary Figure A3 for detailed microstratigraphic outlines and Figure A3.1 for associated photomicrographs.
(color online) Microscale analysis of block samples BBC-00-25-1 (A and B) from the M1 phase in the west sector. Corresponding archaeostratigraphic excavation units and Middle Stone Age (MSA) phase(s) indicated. (A1, B1) Block scans. Abbreviations: A, ash; B, bone fragment; Br, bedrock fragment; Ch., charcoal; OM, organic material; Sf, shellfish; Si, silcrete fragment; Qz., quartz fragment. (A2, B2) Thin section film scans (PPL, plane-polarized light); (A3, B3) heat-distribution maps; (A4, B4) microfacies analysis. Thin section width: 50 mm. See Supplementary Figure A13 for detailed microstratigraphic outlines and Figure A13.1 for associated photomicrographs.

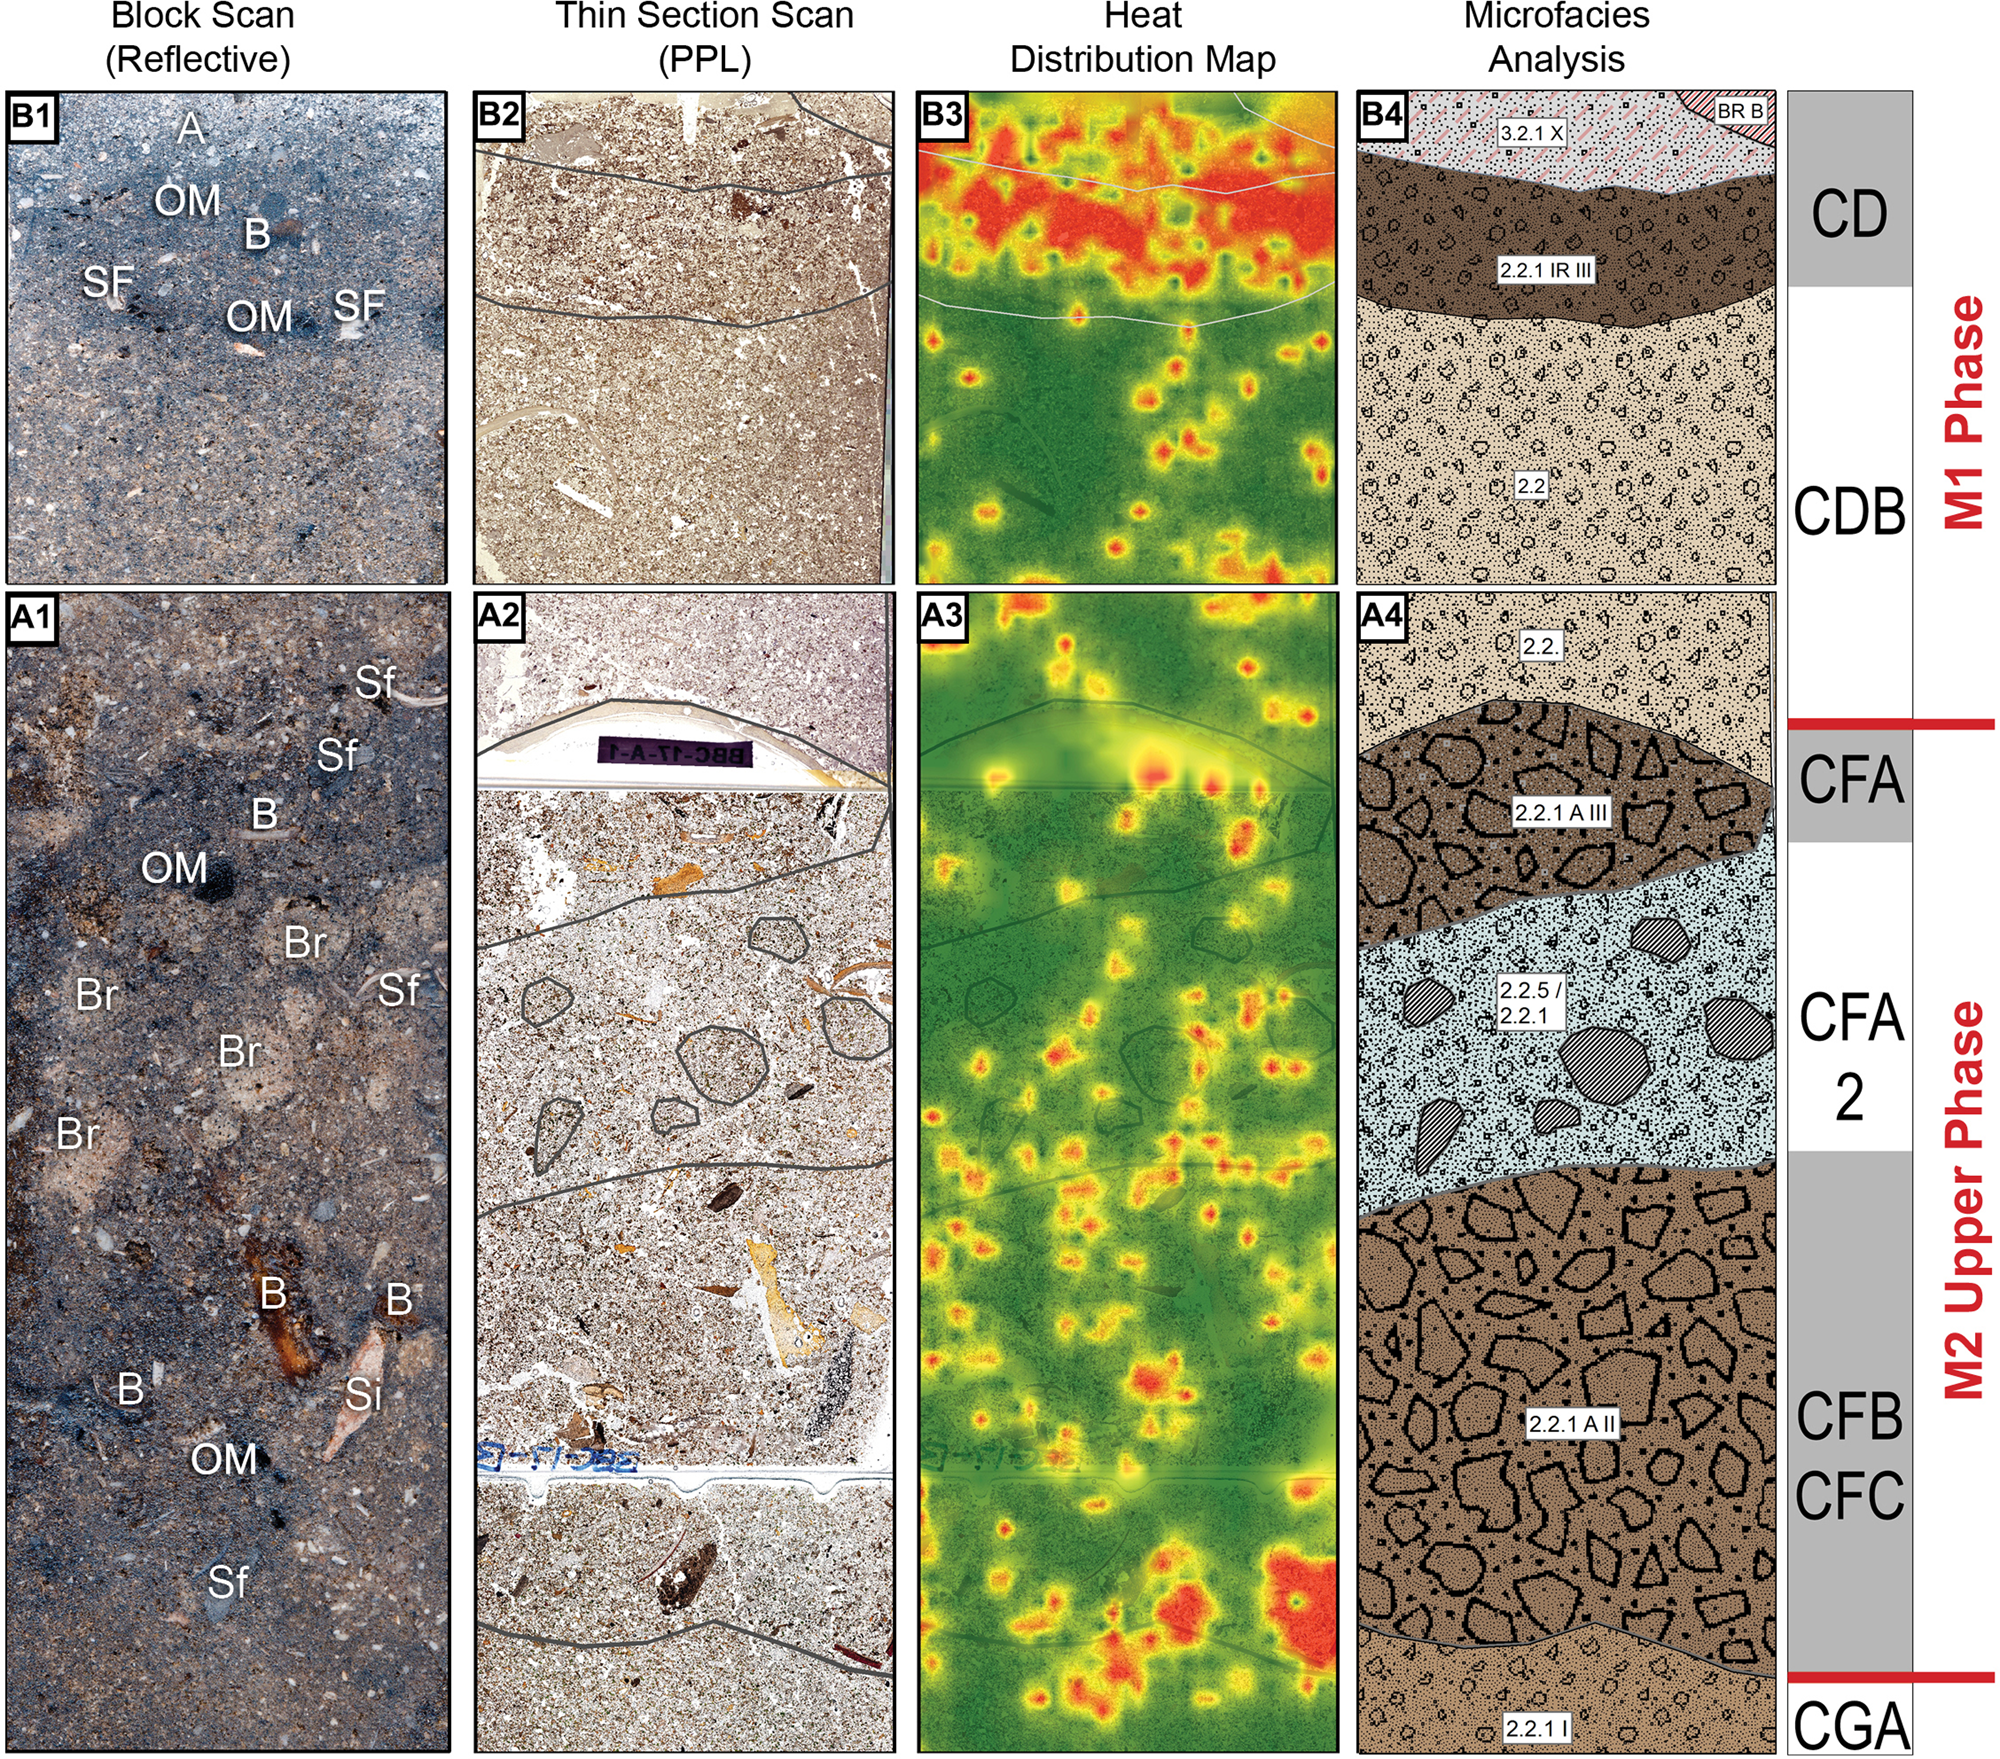
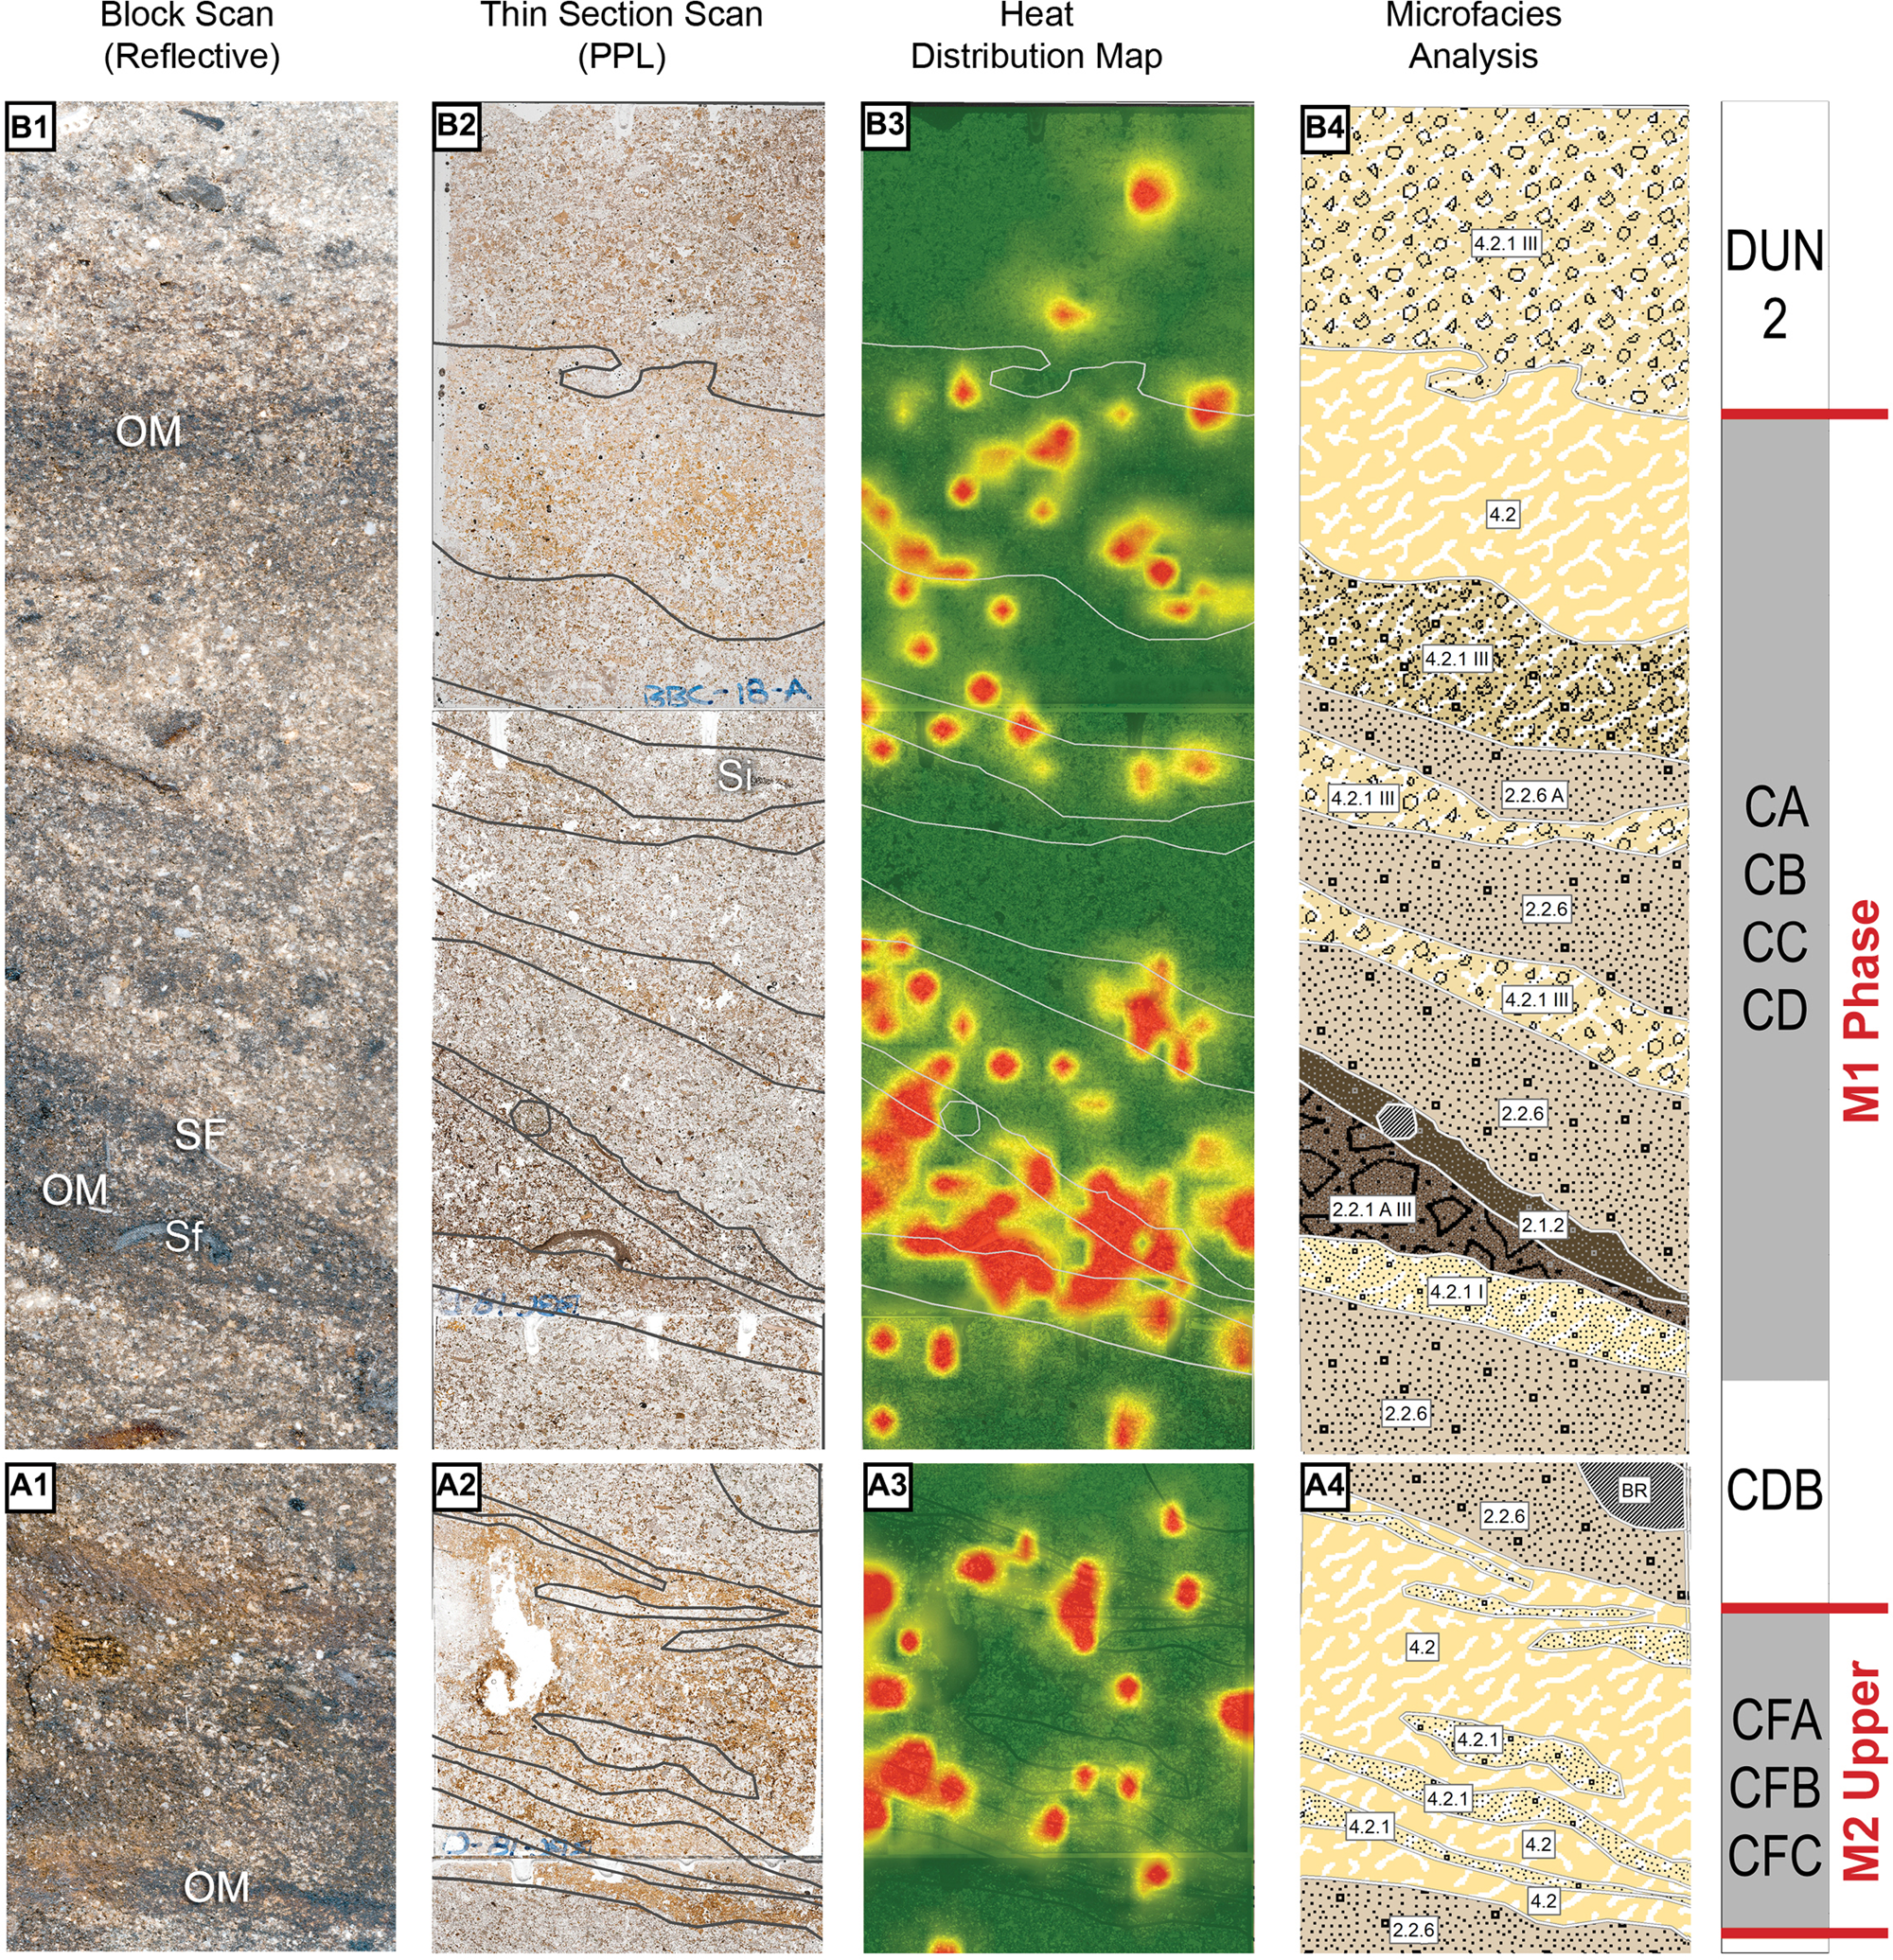
(color online) Microscale analysis of block samples BBC-00-18 from phases M1 (A) and Upper M2 (B) in the north sector. Corresponding archaeostratigraphic excavation units and Middle Stone Age (MSA) phase(s) indicated. (A1, B1) Block scans. Abbreviations: OM, organic material; Si, Silcrete; Sf, shellfish. (A2, B2) Thin section film scans (PPL, plane-polarized light); (A3, B3) heat-distribution maps; (A4, B4) microfacies analysis. Thin section width: 50 mm. See Supplementary Figures A14 and A15 for detailed microstratigraphic outlines and Figures A14.1 and A15.1 for associated photomicrographs. DUN, archaeostratigraphic layer Dune.
Macrostratigraphy: M3 CI phase
The macrostratigraphy of the M3 CI (units CIA, CIB, CIBh2) is in general characterized by laterally extensive, 15- to 20-cm-thick, white-gray deposits containing a very high amount of burnt and highly fragmented anthropogenic materials (millimeter- to centimeter-sized shellfish, bone, lithics, ochre) (Fig. 12A, B, and D). In the western, central, and southern sections of the cave, larger ash features (60–80 cm wide, 5–15 cm thick) are clearly visible in the section wall (e.g., Fig. 12C). These features are also rich in burnt and fragmented anthropogenic material. At the base, the stratigraphic transition toward the Lower M3 phase (unit CJ) is sharply defined by a homogenous, yellow-gray sandy base with few archaeological inclusions. The M3 CI transition toward the Upper M3 (CH) is more gradual. Here, the sequence becomes sandier toward the top (CIA/CH), and articulated shellfish can be seen linearly distributed in the pale-brown matrix.
Microstratigraphy: M3 CI phase
The microstratigraphy of the M3 CI phase is relatively consistent across the site. Two MF-types dominates the sequence: (1) the ash-rich deposits associated with thick combustion features (MF-type 3, Fig. 16, lower part of unit CIBh2, and Fig. 17, unit CI), and (2) sandy and calcareous MF-types that are particularly rich in highly fragmented anthropogenic coarse fraction (MF-type 2.2.2, Fig. 16, upper part of unit CIB h2). The massive ashy deposits contain numerous fragments of heavily burnt bone and shellfish and the heat-distribution model indicates that they were burnt to high temperatures (>600°C) (Figs. 16A3 and 17A3 and B3). In general, the sampled combustion features are characterized by alternating microlaminations of ash (MF-types 3.1 and 3.2). The variations of stacked ashy microfacies reflect subtle microstratigraphic differences in: (1) microstructure and calcite recrystallization (massive, cemented, and open, sparry); and (2) the amount of sandy inclusions. The boundaries between ashy MF subtypes are often defined by localized, microlaminated, phosphatized ash (see yellow dots on Fig. 16A4 and Supplementary Fig. A4.2 for fluorescence light microscopy). Most of the ashy MF-types also display a channel microstructure indicative of postdepositional insect burrowing.
The calcareous and sandy MF-types contain a large quantity of burnt and unburnt coarse fraction (MF-type 2.2.2, Fig. 16, upper part of unit CIB h2). The associated heat map (Fig. 16B3) is indicative of a highly reworked deposit in which burnt and unburnt materials are highly mixed. Weak bedding planes, defined by the presence of horizontally oriented elongated material, are also documented (see orange dotted line in Fig. 16B4). The upper parts of the M3 CI phase (excavation unit CIB in Fig. 16B) are defined by alternating microlaminated deposits containing sandier and nonburnt microfacies (MF-type 2.2), some of which have inclusions of coarse fraction (articulated shellfish and lithic debris) embedded in a micromass enriched in silt-sized organic material (MF-type 2.2.1).
Macrostratigraphy: Upper M2 phase
The macrostratigraphy of the Upper M2 phase (units CIA, CIB, and CIBh2) is in large parts of the cave dominated by laterally extensive, microlaminated, medium-brown sandy deposits containing multiple 40- to 60-cm-long, 2- to 4-cm-thick hearth features (Figs. 11C and D and 12A). The base of these white-gray, ash-rich hearth features is often defined by laminations of fine, dark, organic material. Inclusions of anthropogenic material are visible in the section wall, including articulated and broken-up shellfish, bone fragments, and lithic debris. In some parts of the cave, numerous centimeter- to decimeter-sized roof-spall fragments are also present within the sequence. In the south-central area of the cave, the stratigraphic transitions toward the Lower M2 phase (unit CGAA) and the overlying M1 phase (unit CDB) are both marked by a sandier deposit containing little or no anthropogenic coarse fraction. In the central cave area (Fig. 11A), microlaminations are absent, and the stratigraphic transitions between the thicker beds are less pronounced.
In the back of the cave (north sector), the macrostratigraphy is markedly different from that of the more central areas toward the cave's dripline. Here, the sequence is characterized by a laterally extensive 6- to 8-cm-thick layer of organic-rich, dark orange sediments (Fig. 12B). Thin, light-gray, sandy laminations interfinger these darker sediments. No macroscopic anthropogenic material is observed in the section wall, but burnt shellfish and charred material were recovered during excavation (unpublished field report, Henshilwood, 1991–1992).
Microstratigraphy: Upper M2 phase
Microscopically, the types of sediment of the Upper M2 phase is not consistent across the site. In the east, south-central, and western sectors, the deposit is characterized by microstratigraphic sequences dominated by calcareous sandy deposits (MF-type 2.2.1) containing a variable amount of anthropogenic coarse fraction embedded in a micromass enriched in silt-sized organic and calcareous material (Figs. 18 and 19, Upper M2 phase). In several parts of the cave (south-central, central, and western sectors), a consistent roof-spall layer (MF-type 2.2.5) is documented (Figs. 18, CF5, 19, CFD, and 20, CFA 2). Both in the eastern and the western sectors of the cave, ash-rich, moderately phosphatized hearth features are observed in close spatial proximity to very shellfish rich deposits (MF-type 2.2.3).
Below the hearth feature in the eastern sector, we also document the presence of microlaminated, fibrous plant material embedded in a phosphatized matrix (MF-type 4.1P). Fragments of bone, shellfish, and lithic debris (quartzite) are scattered within and between these organic-rich layers. The organic petrologic study shows that most of the organic material displays fine structures and thin cell walls, and thus is likely to have originated from leaves or herbaceous plants (Supplementary Fig. A1.2). These tissues (see Supplementary Fig. A1.4A for fluorescent light) are finely broken (inertodetrinite, 30 μm–1 mm in size) and display a bogen structure (Supplementary Fig. A1.2D and E). Reflectance measurements conducted directly on the plant tissues show values between 0.60 and 0.92% mean random reflectance (Ro)(Supplementary Fig. A1.3), which corresponds to low reflecting fusinite (semifusinite) that normally forms at temperatures around 180 to 280°C (Jones et al., Reference Jones, Scott and Cope1991). The presence of perforated and collapsed tissues indicates that the plant tissue may have been affected by fungal degradation and suffered an humification before being burned.
The microstratigraphy in the northern sector is markedly different from that of any other part of the cave during the Upper M2 phase. In this area of the cave, the sediments are characterized by a sequence of recurring MF-types rich in weakly laminated fibrous to microaggregated, phosphatized, and iron-stained domains, all embedded in a calcareous matrix containing inclusions of silt-sized dark organic matter (MF-type 4.2 or 4.2.1) (Fig. 24A). The fluorescence light microscopy shows that the MF-types 4.2 and 4.2.1 emit yellow and brownish colors (Supplementary Fig. A16.2D–G), and the micro-XRF elemental mapping shows a strong presence of phosphorus (Supplementary Fig. A16.2H–J). The micro-FTIR spectra of the yellow-brown domains confirm that they are composed of carbonated hydroxyapatite (Supplementary Fig. A16.3).
In general, the heat-distribution models for the Upper M2 deposits indicate that burnt and unburnt sediments are frequently intermixed throughout the sequence (Figs. 18A3, 19A3, and 20A3). We note, however, that areas of homogenous concentrations of burnt sediments are usually spatially associated with the ashy hearth features. At the same time, the sandier phases below (unit CGAA, Lower M2) and above (CDB, M1) the Upper M2 sequence, in general, contain little or no burnt deposit.
Macrostratigraphy: M1 phase
The macrostratigraphy of the M1 phase (units CA, CB, CC, CCC, CD, and CDB) is laterally variable across the cave floor. The M1 sequence is at its thickest (40 cm) in the western section (Fig. 12A) and thins out toward the eastern and northern cave walls (15–20 cm) (Figs. 11B and 12D). In the southeast and southern sectors, the M1 deposits are in general defined by weakly laminated, light-brown, and unconsolidated sandy deposits containing many centimeter- to decimeter-sized roof-spall fragments (Fig. 11C and D). Anthropogenic material (centimeter-sized bone fragments, shellfish, and lithic debris) is macroscopically visible in the section wall and often horizontally and linearly dispersed within the sandy matrix. Whereas the lowermost light-brown M1 unit (CDB) is light gray and appears to be anthropogenically sterile, the overlying dark-brown units CC, CCC, and CD are enriched in human occupation debris and contain multiple microlaminated and laterally extensive ash features. These combustion features are usually 30–50 cm long and 1–3 cm thick and are documented in multiple areas of the cave (Fig. 11A, B, and D, units CC and CD). The bases of the M1 hearths are often defined by an organic-rich, black, and reddened sandy substrate. The stratigraphic transition between the upper part of the M1 phase (unit CA) and the overlying DUN layer is characterized by a sharp boundary, defined by the occurrence of coarse, yellow eolian sand with no anthropogenic inclusions (Figs. 11B and D and 12D).
The M1 phase in the north sector stands out by being dominated by coarser shelly sand, which is interfingered by thin sandy lenses of dark and orange sediments (Fig. 12B). Occasional roof-spall fragments and anthropogenic material (bone fragments, shellfish, and lithic debris) are also visible in the section wall, and according to the field reports (Henshilwood, 1991–1992), several bifacial points were recovered from this area. In the north sector, the overlying DUN and Later Stone Age deposits show clear signs of postdepositional reworking. Yet the laminated MSA sequence appears to be intact. Localized bioturbation is, however, observed (see burrow [“B”] in Fig. 12B.)
Microstratigraphy: M1 phase
In general, the microstratigraphic sequence of the M1 phase is dominated by laminated sandy MF-types with a high amount of coarse anthropogenic inclusions embedded in a micromass enriched with silt-sized organic and calcareous material, that is, MF-type 2.2.1 (Figs. 19–24: M1 phase). The alternating sequence of 2.2.1 MF-type variants reflects subtle microstratigraphic changes in: (1) preservation of coarse material (fragmented or articulated); (2) the frequency of fine and coarse material; and (3) the amount and types of organic material present (silt-sized humified or sand-sized charred). The highest amount of anthropogenic coarse fraction is observed in associated with the archaeological units CD/CDh2 and CA/CB. Within these units, we also document several centimeter-thick ashy deposits that are rich in burnt bone fragments, shellfish, lithic debris (silcrete), and charred material (MF-types 3.1.1 and 3.2.1) (see Figs. 19, unit CD, 20, unit CD, 21, unit CDh2, 22, unit CCC, and 24, unit CB3).
Several of the ash-rich M1 combustion features are defined by a tripartite microstratigraphic sequence (e.g., Fig. 20B4):
1. at the base, a calcareous and nonburnt sandy deposit with few coarse fraction inclusions (MF-type 2.2);
2. in the middle, a mixed burnt and sandy deposit enriched in silt-sized organic and calcareous material with inclusions of shellfish and bone fragments (MF-type 2.2.1); and
3. on top, a massive ashy deposit with inclusions of sand components (MF-type 3.2.1).
In general, we also note that the M1 sediments rich in anthropogenic material (MF-type 2.2.1 III) also contain more microscopic bone fragments. In thin section, these bones show a light-green fluorescence when excited, while the general matrix surrounding them does not fluoresce (Supplementary Fig. A3.2B–D). The M1 sediments containing less anthropogenic occupation debris (i.e., MF-type 2.2.1 I) show an increase of silt-sized fluorescent material randomly scattered within the matrix (Supplementary Fig. A3.2B).
The heat-distribution models associated with the M1 combustion features typically display burnt areas of sediments in close spatial association with the ash-rich deposits. A few of the ashy features appear to have been homogenously burnt and structurally preserved (see Fig. 19B3), while most seem to have been moderately reworked, as indicated by the frequent intermixing of sandy, nonburnt components (see Figs. 20B3, 21B3, 22B3, and 2B3)
The microstratigraphic M1 sequence in the western and northern part of the cave differs from that observed in the rest of the cave. In the western profile (Fig. 12A), we document the presence of roof-spall layers (MF-type 2.2.5) and nonanthropogenic deposits enriched in phosphatized organic matter (MF-type 4.2) (Fig. 23). The microstratigraphic sequence in the northern sector is dominated by laminated sandy calcareous deposits containing a higher ratio of sand-sized shelly components and coarser sand-sized quartz grains (MF-type 2.2.6) (Fig. 23B). Interfingering these coarser sandy facies are calcareous sandy deposits that are enriched with a phosphatized and iron-stained micromass (MF-type 4.2.1). While most of the sequence shows few inclusions of anthropogenic coarse fraction, an MF-type toward the base (Fig. 23, CD) contains several fragments of burnt shellfish fragments. The heat-distribution model suggests that while heated sediments are infrequently found throughout the M1 cave deposits in the northern sector, some areas of more concentrated burnt material can be observed in unit CD (Fig. 24A3).
Analysis of trampled bone from M1 and Upper M2 phases
Because polished bone tools are relatively common in the M1 and Upper M2 phases at Blombos Cave (Henshilwood et al., Reference Henshilwood, d'Errico, Marean, Milo and Yates2001a; d'Errico and Henshilwood, Reference d'Errico and Henshilwood2007), it was important to differentiate between deliberate polish and unintentional abrasion. In general, we note that natural abrasion tends to occur over the whole specimen, while intentional polish is more likely to be evident around specific areas, such as the working tip (Shipman and Rose, Reference Shipman and Rose1988). Even when specimens are extremely fragmented, anthropogenic polish could be confidently distinguished from natural abrasion by the orientation of striations and edge wear (Shipman and Rose, Reference Shipman and Rose1988; Reynard, Reference Reynard2014). Specimens judged as intentionally polished or those that displayed use-wear were not included in the data set (for details on the definition and quantification of abrasion, see Reynard and Henshilwood, Reference Reynard and Henshilwood2018). Water-worn specimens may mimic intentional sheen (Boschian and Saccà, Reference Boschian and Saccà2010), but based on previous research (Thompson, Reference Thompson2008; Reynard, Reference Reynard2012), it is unlikely any of the specimens in our sample may have been affected by water wear.
In total, 1807 identified faunal remains (both plotted specimens and faunal specimens recovered from coarse fraction from 3 mm sieves) and 1442 unidentified specimens were assessed. Abrasive modification on our sample of faunal specimens follows a bimodal pattern through the Blombos Cave sequence, with peaks in both the M1 and Upper M2 phases (Fig. 25). Abrasive marks are most common in units CC (number of specimens [NSP] = 190; 36.5%) and CF/CFA (NSP = 31; 21%) and are rarest in unit CDB (NSP = 7; 1%). A chi-square tests show significant differences between all layers except between CFB/CFC and CFD (χ2 = 102.792; df = 4; P < 0.0001). The highest chi-square difference was between CB and CC (χ2 = 18.268; df = 1; P < 0.0001).
(color online) Frequency of abrasion on bone in the M1 (units CA, CB, CC, CCC, CD, and CDB) and Upper M2 (units Cf/CFA, CFB/CFC, and CFD) phases at Blombos Cave by archaeostratigraphic unit. Numbers of abraded specimens above the columns.

DISCUSSION
To support an archaeological interpretation and discussion of our results, we provide below a genetic interpretation of the MF-types we defined in the results section. We then evaluate each MF-type in terms of its lateral and vertical distribution across the entire site to reconstruct diachronic and synchronic patterns of deposition and site use in each of the three selected MSA occupation phases (M1, Upper M2, and M3 CI). We then discuss and compare our observations with the behavioral and paleoenvironmental framework already established at Blombos Cave. Finally, we consider the broader archaeological implications of our finds and approach by discussing what changes in site use and occupation intensity may reveal about regional patterns of residential mobility and settlement dynamics in the southern Cape during the MIS 5b-4, and how these changes may have influenced technological and cultural innovation during the MSA.
Genetic interpretation of Blombos Cave MSA microfacies types
Within the MSA deposits at Blombos Cave, we recognized three general facies based on their main sedimentary constituents: the sandy facies, the ashy facies, and the organic-rich facies (Fig. 4). Within these, we further identified 8 MF-types and 13 MF-subtypes. In our discussion of the formation and significance of these MF-types, we considered the following factors:
• the general macroscopic field context (lateral and vertical site distribution);
• the specific microstratigraphic setting (occurrence and microstratigraphic associations);
• the sedimentary content and microstructure (micromorphological observations);
• the frequency and distribution of burnt deposits (heat-distribution maps); and
• the elemental mapping and mineralogical identifications (diagenesis and chemical alteration).
Based on a combined evaluation of the macro- and microcontextual evidence, we have put forward in Table 5 the most likely primary and secondary depositional agents involved in the formation of each MF-type (anthropogenic, biogenic, or geogenic). In the same table, we have also characterized the most likely sediment sources and transportation processes involved.
Genetic and process-oriented interpretation of microfacies types and subtypes identified in Blombos Cave.
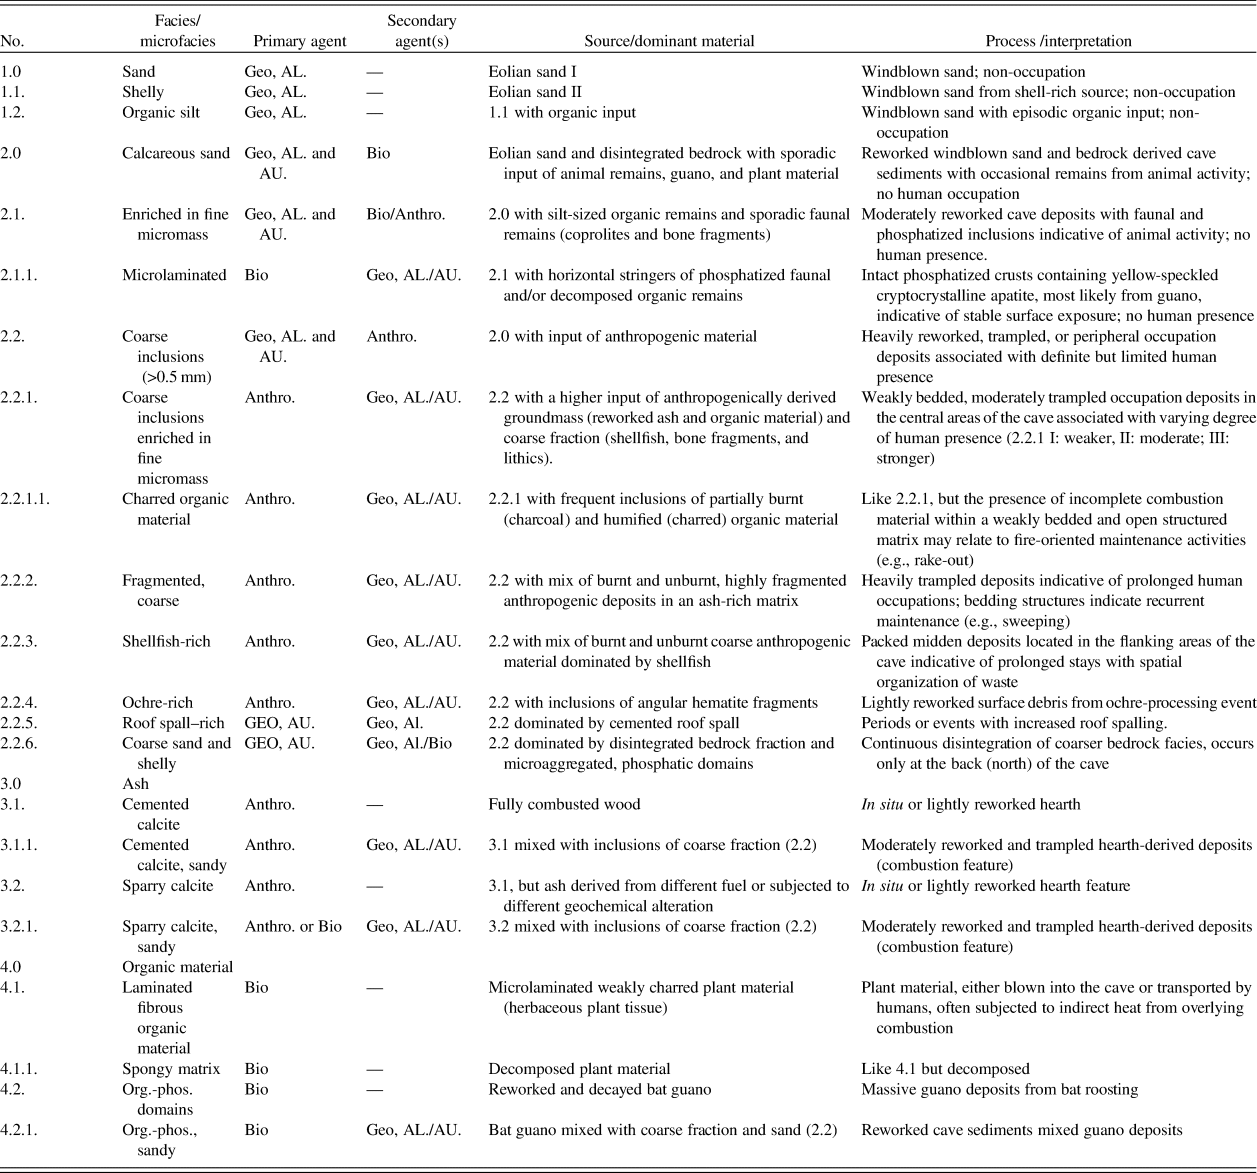
aAbbreviations: Anthro., anthropogenic; BIO., biogenic; Geo, AL., geogenic, allochthonous; Geo, AU, geogenic, autochthonous; Org.-Phos., organo-phosphatic.
Noncalcareous sandy MF-types
The noncalcareous sandy MF-types (1.0, 1.1, and 1.2) are exclusively found directly above the M1 phase and constitute the layer designated “DUN.” Before the excavation started, DUN covered more than 90% of the interior floor. While the thickest part of DUN (>40 cm) is recorded in southern section walls toward the dripline, it thins out considerably toward the back of the cave (<5 cm). The main sedimentary components of DUN are well-rounded, well-sorted, sand-sized quartz and rounded shelly grains. Compared with the calcareous sandy facies, there is a noticeable lack of coarse fraction larger than 5 mm. The absence of glauconite grains indicate that a minimal amount of autochthonous bedrock material disintegrated and mixed with the DUN sand.
Considering the content, morphology, and spatial distribution of the noncalcareous sandy MF-types, we interpret them to represent bodies of sand that were blown in from sources (dunes) outside the cave (Courty et al., Reference Courty, Goldberg and Macphail1989; Stoops, 2003). During the deposition of these decalcified eolian sands, neither humans nor animals appear to have occupied the cave. The weakly bedded structures within the noncalcareous facies (DUN) attest to their general structural, and the observed variations in sand-sized content may be indicative of either changing eolian sand sources (MF-type 1.1) or episodic input of silt-sized organic material (MF-type 1.2).
Calcareous sandy MF-types
We divide the calcareous sandy deposits (MF-type 2) into two major MF-types: sediments with little or no coarse fraction (MF-type 2.1) and sediments with a distinct coarse fraction component (>5 mm; MF-type 2.2). MF-type 2.1 typically constitutes centimeter-thick, weakly laminated deposits that are enriched in silt-sized, iron-stained, and occasionally phosphatized fine material, in which faunal remains are occasionally embedded (e.g., bone fragments and coprolites). Considering these biogenically derived waste components, and lack of anthropogenic input, we suggest that MF-type 2.1 is closely associated with periods of increased faunal activity within the cave, primarily in the absence of human occupation.
We also relate the MF-subtype 2.1.1 to biogenic activity within the cave, but given their content (yellow-speckled cryptocrystalline apatite) and morphology (microlaminated, millimeter thick, and laterally extensive) we interpret these MF-types to represent well-preserved phosphatized crusts. These crusts, which typically emit yellow-red colors in fluorescent light (470 nm), all have micro-XRF measurements showing that they contain phosphorous. In other Paleolithic caves, similar phosphatized crusts have been described and associated with guano deposits (e.g., from birds or bats) (Marean et al., Reference Marean, Goldberg, Avery, Grine and Klein2000). When found as structurally intact laminations, these crusts have also been viewed as markers of surface preservation and stability, as well as indicators of (temporary) human abandonment (Karkanas, Reference Karkanas, Nicosia and Stoops2017).
Due to the anthropogenic origin of the coarse-fraction components (bones, shellfish, lithics, and charred material) within MF-type 2.2, we relate most of these MF-types to periods of increased human site use and deposition. The only exception to this is the subtypes containing larger (>1 mm) roof-spall fragments (MF-type 2.2.5) and coarse shelly sand (MF-type 2.2.6); both of which we relate to periods of increased degradation of the calcareous bedrock ceiling. Some of the MF 2.2 subtypes are dominated by a single type of coarse fraction, and we propose that these may be linked to more specific human activities. For example, we relate the presence of spatially confined shellfish-rich deposits (2.2.3) to waste deposition events and the presence of microstratigraphic lenses of angular, centimeter- to millimeter-sized, iron-oxide fragments (2.2.4) to episodes of human pigment processing.
By far the most common coarse fraction–rich MF-types we encountered are those that contain a mix of quartz-rich calcareous sand and a mix of anthropogenic material types such as bone fragments, shellfish, lithic debris, and organic matter directly associated with human presence. Many of these MF-types (2.2.1, 2.2.1.1, and 2.2.2) are weakly bedded to microlaminated and contain fragmented or chipped coarse fractions (e.g., snapped shell fragments and crushed bone) that show a generally horizontal orientation and parallel distribution. We interpret some of these laminations of concentrated occupation debris, intermixed with sandy and ashy constituents, to be the result of intentional site maintenance (sweeping). In the M3 CI phase, these deposits are laterally extensive, and they can be traced across the entire interior cave floor (i.e., an occupation horizon). Often, these occupation horizons are separated by sandier nonanthropogenic deposits that contain little or no coarse fraction (MF-types 2.0, 2.1, 2.1.1, and 2.2.5). We associated the sandy cave deposits enriched in anthropic coarse fraction to phases of increased human presence and occupation.
The distribution, orientation, fragmentation, and densities of the anthropic coarse fractions vary greatly within the identified MF 2.1 subtypes. Sometimes, the coarse fraction inclusions are infrequent, and they are randomly scattered throughout the sandy matrix (MF-type 2.2.1). Other times, the coarse fraction components are horizontally aligned and constitute centimeter-thick stringers of concentrated occupation debris (e.g., MF-type 2.2.1.1). In the M3 CI phase, the very high quantities of fragmented occupation debris form a massive, decimeter-thick, laterally continuous occupation deposit, in which burnt and unburnt material is heavily intermixed (MF-type 2.2.2). While we associate most of the MF 2.1 deposits to human occupation, we suggest that their variable content, frequency, and morphology can be used to infer modes and scales of human occupation (see Table 5 for detailed interpretations).
Ashy MF-types
While the entire sedimentary sequence at Blombos is calcareous, due to the continuous disintegration of bedrock (calcarenites), the deposits we define as ash-derived (MF-type 3) can be distinguished based on their overall morphology (lenticular and confined features), their massive input of micrite and sparry calcite (most likely derived from wood ash), and the frequent inclusion of burnt content within them (burnt bone and shellfish, charcoal, and charred material) (Mentzer, Reference Mentzer2014, Reference Mentzer and Gilbert2017). The heat-distribution maps also indicate that the ashy MF-types are consistently associated with higher concentrations of deposits burnt to above 600°C. In some cases, the sandy substrate below the ashy deposits is also altered by heat, suggesting that the overlying ashy combustion features are in situ (Haaland et al., Reference Haaland, Friesem, Miller and Henshilwood2017).
We divide the ashy MF-types into two subtypes: cemented micrite (3.1) and sparry calcite (3.2). Often, we find both subtypes present within a single combustion feature. In these cases, the cemented micrite (3.1) is usually superimposed on the sparry ash deposits (3.2). The processes behind the two types of calcite recrystallization are not entirely clear, but given the close spatial association between them, we hypothesize that it may relate to differential postdepositional chemical alteration (also described by Shahack-Gross et al., Reference Shahack-Gross, Ayalon, Goldberg, Goren, Ofek, Rabinovich and Hovers2008; Mentzer, Reference Mentzer2011; Miller et al., Reference Miller, Goldberg and Berna2013; Karkanas et al., Reference Karkanas, Brown, Fisher, Jacobs and Marean2015). However, we cannot rule out that other factors may be involved, for example, change in fuel type, burning sequence, or local depositional conditions (e.g., moisture, wind direction, size and morphology of the combustion feature) (Bentsen, Reference Bentsen2012; March et al., Reference March, Lucquin, Joly, Ferreri and Muhieddine2014; Esteban et al., Reference Esteban, Marean, Fisher, Karkanas, Cabanes and Albert2018).
On multiple occasions, both the cemented micrite (MF-type 3.1) and the sparry ash deposits (MF-type 3.2) contain sandy components, primarily in the form of quartz and glauconite grains derived from the surrounding matrix (MF-types 3.1.1 and 3.2.1). We interpret these ashy deposits to have been subjected to postdepositional reworking, during which ash and sandy components intermixed, for example, due to trampling or sweeping, but not to the extent that the overall macroscopic morphology of the original ash features was lost. Our notion that these ashy deposits have been only moderately reworked is further supported by the associated heat-distribution maps, which often show that the MF-types 3.1.1 and 3.2.1 contain semihomogenous areas of burnt sediments combined with irregularly shaped domains of unburnt deposits (Haaland et al., Reference Haaland, Friesem, Miller and Henshilwood2017). One should also note that the MF-subtypes 3.1.1 and 3.2.1 we have defined at Blombos Cave bear a clear resemblance to the combustion microfacies defined by Karkanas et al. (Reference Karkanas, Brown, Fisher, Jacobs and Marean2015) at PP 5-6.
Finally, in some cases the ashy deposits in Blombos Cave are locally phosphatized, often in the form of millimeter-thick stringers that cap the ash below. These stringers typically run parallel to, or even constitute, the microstratigraphic transition between the underlying ashy deposits and overlying sandy MF-types (e.g., yellow dots on Fig. 16A4). Comparable phosphatized features, overlying otherwise unaltered ashy deposits, have at other cave sites been interpreted as derived from guano (Goldberg et al., Reference Goldberg, Dibble, Berna, Sandgathe, McPherron and Turq2012). Their physical preservation and orientation attests to a (minimum) period of surface stability, and combined with their nonanthropogenic origin, intact phosphatized crusts have thus been viewed as an indicator of (temporary) human abandonment of a site.
Organic MF-types
Two organic-rich MF-types were identified at Blombos Cave: one dominated by microlaminated, amorphous fibrous organic material (4.1) and the other by yellow-brown, weakly laminated, fibrous, and phosphatized domains (4.2). The organic petrology analysis shows that MF-type 4.1 consists of organic tissues that are characterized by very thin cell structures, like those of leaves or herbaceous plants(see Supplementary Fig. A.1.2). The MF-subtype 4.1.1 contains the same type of organic matter, but it is intermixed with sandy components. Both MF-types 4.1 and 4.1.1 show a black appearance in the field and may resemble deposits associated with incomplete combustion. The location of the plant tissues, often immediately below the hearth features, has led us to attribute this to a moderate charring at relatively low temperatures (<300°C). Currently, we do not know how the fibrous plant tissues got into the cave and whether they are directly associated with human activity. They may represent leaves that were carried into the cave by natural processes (wind). Alternatively, they may have been used as fire fuel (Esteban et al., Reference Esteban, Marean, Fisher, Karkanas, Cabanes and Albert2018) or as bedding material (Wadley et al., Reference Wadley, Sievers, Bamford, Goldberg, Berna and Miller2011).
Based on the microstructure (spongy and fibrous), the elemental and molecular composition (rich in phosphorus, fluorescent and IR spectra consistent with carbonated hydroxyapatite), we interpret the second organic MF-type (4.2) to represent decayed guano, most likely deposited during periods of bat roosting (Shahack-Gross et al., Reference Shahack-Gross, Berna, Karkanas and Weiner2004; Bergadà et al., Reference Bergadà, Villaverde and Román2013; Karkanas, Reference Karkanas, Nicosia and Stoops2017).
Identifying diachronic changes in site use, site structure, and occupation patterns through vertical and lateral distribution of microfacies
Many of the MF-types identified in Blombos Cave (Fig. 4, Table 5) occur only in certain areas of the cave or in specific parts of the MSA sequence. In contrast, other MF-types are either mutually exclusive or regularly co-occur in associated or predictable spatial patterns. Consequently, it is not only the mere existence of the MF-types but also their specific locations and spatial associations with one another that are of importance when assessing their depositional and behavioral significance (for discussions on microfacies association analysis, see Miller et al., Reference Miller, Goldberg and Berna2013, Reference Miller, Mentzer, Berthold, Leach, Ligouis, Tribolo, Parkington and Porraz2016; Karkanas et al., Reference Karkanas, Brown, Fisher, Jacobs and Marean2015). Isolated, our genetic interpretations of MF-units (Table 5) enable us to characterize the types of depositional and postdepositional processes that took place in Blombos Cave during the MSA. It is, however, the systematic microcontextual mapping of these processes that allow us to convert complex microstratigraphic relationships into process-oriented interpretations of MSA site use and site structure.
To facilitate a consistent site-wide evaluation of MF-associations and relationships, we provide in Fig. 26 a visual overview of the vertical distribution of all microfacies observed in this study, sorted by location, occupational phase, and archaeostratigraphic units. Accompanying Fig. 26, we also put forward a complete overview of the distribution of burnt sediments (Fig. 27). On both Figures 26 and 27, we have indicated the types of depositional agents present (anthropogenic, biogenic, and geogenic) as well as the density of (high–low) the anthropogenic coarse fraction. While our geoarchaeological and taphonomic observations of MSA occupation deposits in Blombos Cave have allowed us to infer changes in local site use, the proposed site-occupation models (Figs. 28 and 29) can also be linked directly to the archaeological and paleoenvironmental records that have been recovered from the same MSA sequence. In Table 6, we provide a schematic overview of the Blombos Cave MSA archaeostratigraphy and chronometric framework, in which associated archaeological, faunal, taphonomic, bathymetric, and paleoenvironmental data are compared with our microcontextual observations. In the following sections we summarize some of the most significant trends identified from this interdisciplinary data comparison.
Vertical and lateral variations of microfacies by location in cave, phases, and sector-specific archaeostratigraphy. The density of anthropogenic material and primary depositional agents are indicated by color. DUN, archaeostratigraphic layer Dune. (For interpretation of the references to color in this figure legend, the reader is referred to the web version of this article.)

Vertical and lateral variations in sediment heat distribution by location in cave, phases, and sector-specific archaeostratigraphy. The density of anthropogenic material and primary depositional agents are indicated by color. DUN, archaeostratigraphic layer Dune. (For interpretation of the references to color in this figure legend, the reader is referred to the web version of this article.)

Schematic outline of the lateral and vertical variability of microfacies, as we have interpreted them in terms of (A) primary depositional agents and (B) density of human occupation debris. Note that the lack of sampling in the central and south-central sectors of the cave gives (dotted line) results in an incomplete view of the M1 phase; (C) structural preservation. Note that the red areas (intact) primarily represent in situ hearth features or structurally intact surface features (e.g., phosphatized microlaminations). Sector abbreviations: S-E, southeast; S, south; S-C, south-central; C, central; W, west; N, north. (For interpretation of the references to color in this figure legend, the reader is referred to the web version of this article.)
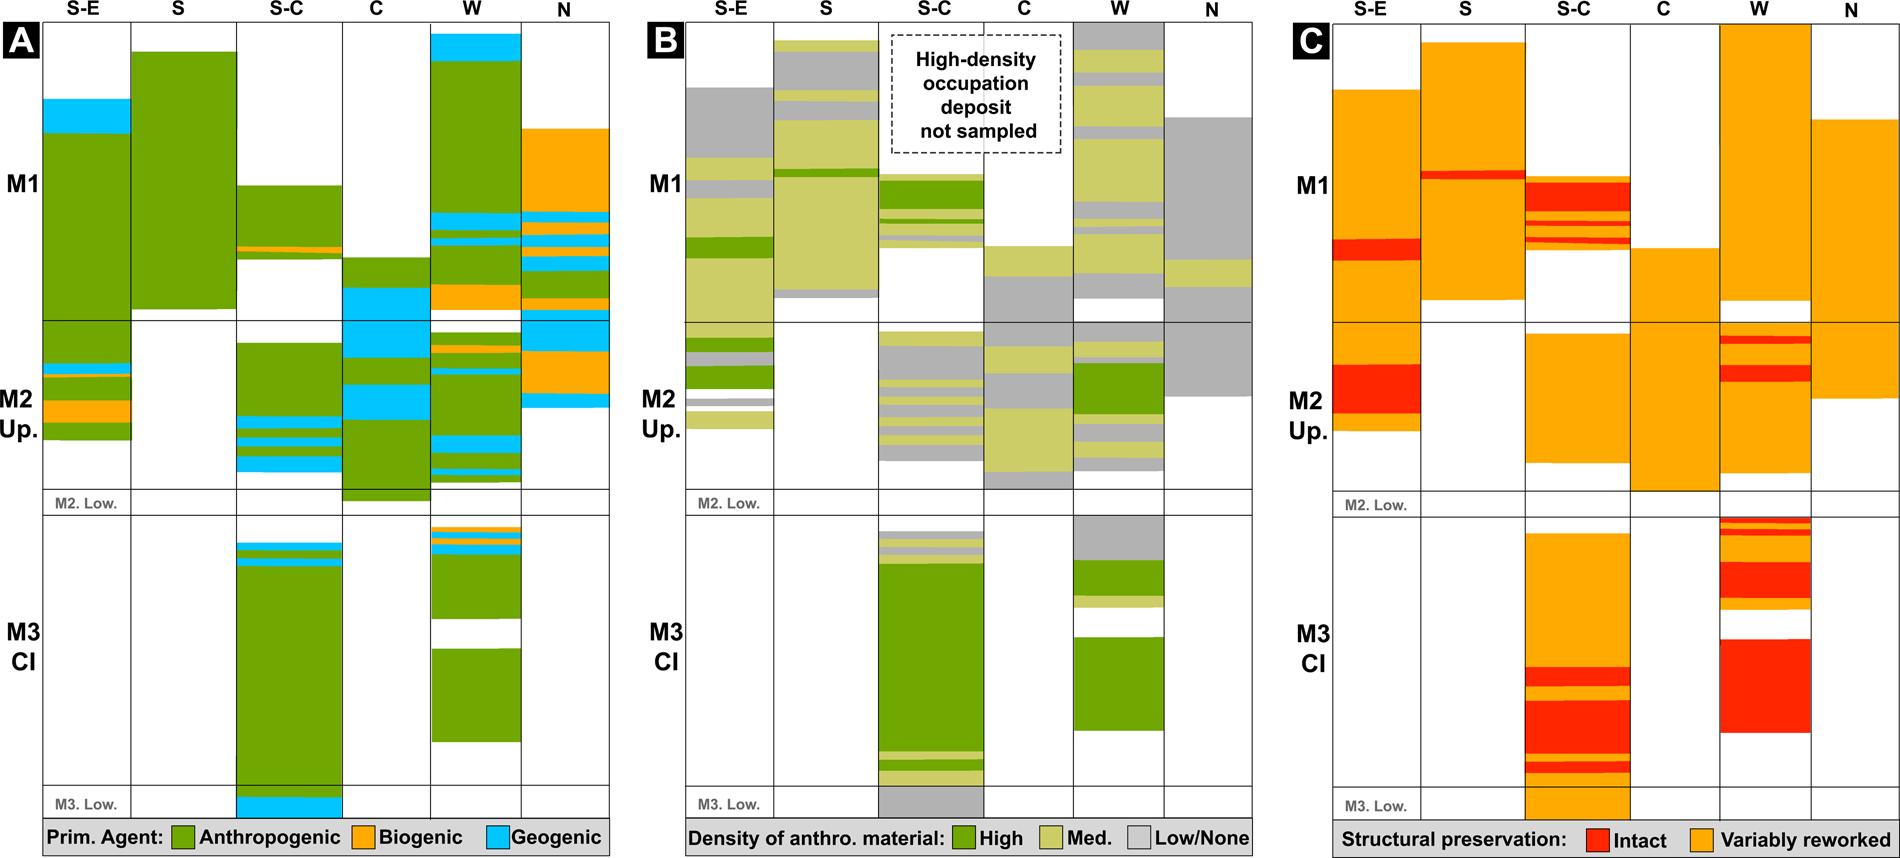
(color online) Simplified overview of sector-specific microstratigraphic sequences, and corresponding interpretation of lateral Middle Stone Age (MSA) site structure by occupational MSA phase: M3 CI (A1–A2), Upper M2 (B1–B2), and M1 (C1–C2). Note that while some details are left out (see Fig. 22 for all details), the relative position of observations and interpretations are schematically correct.
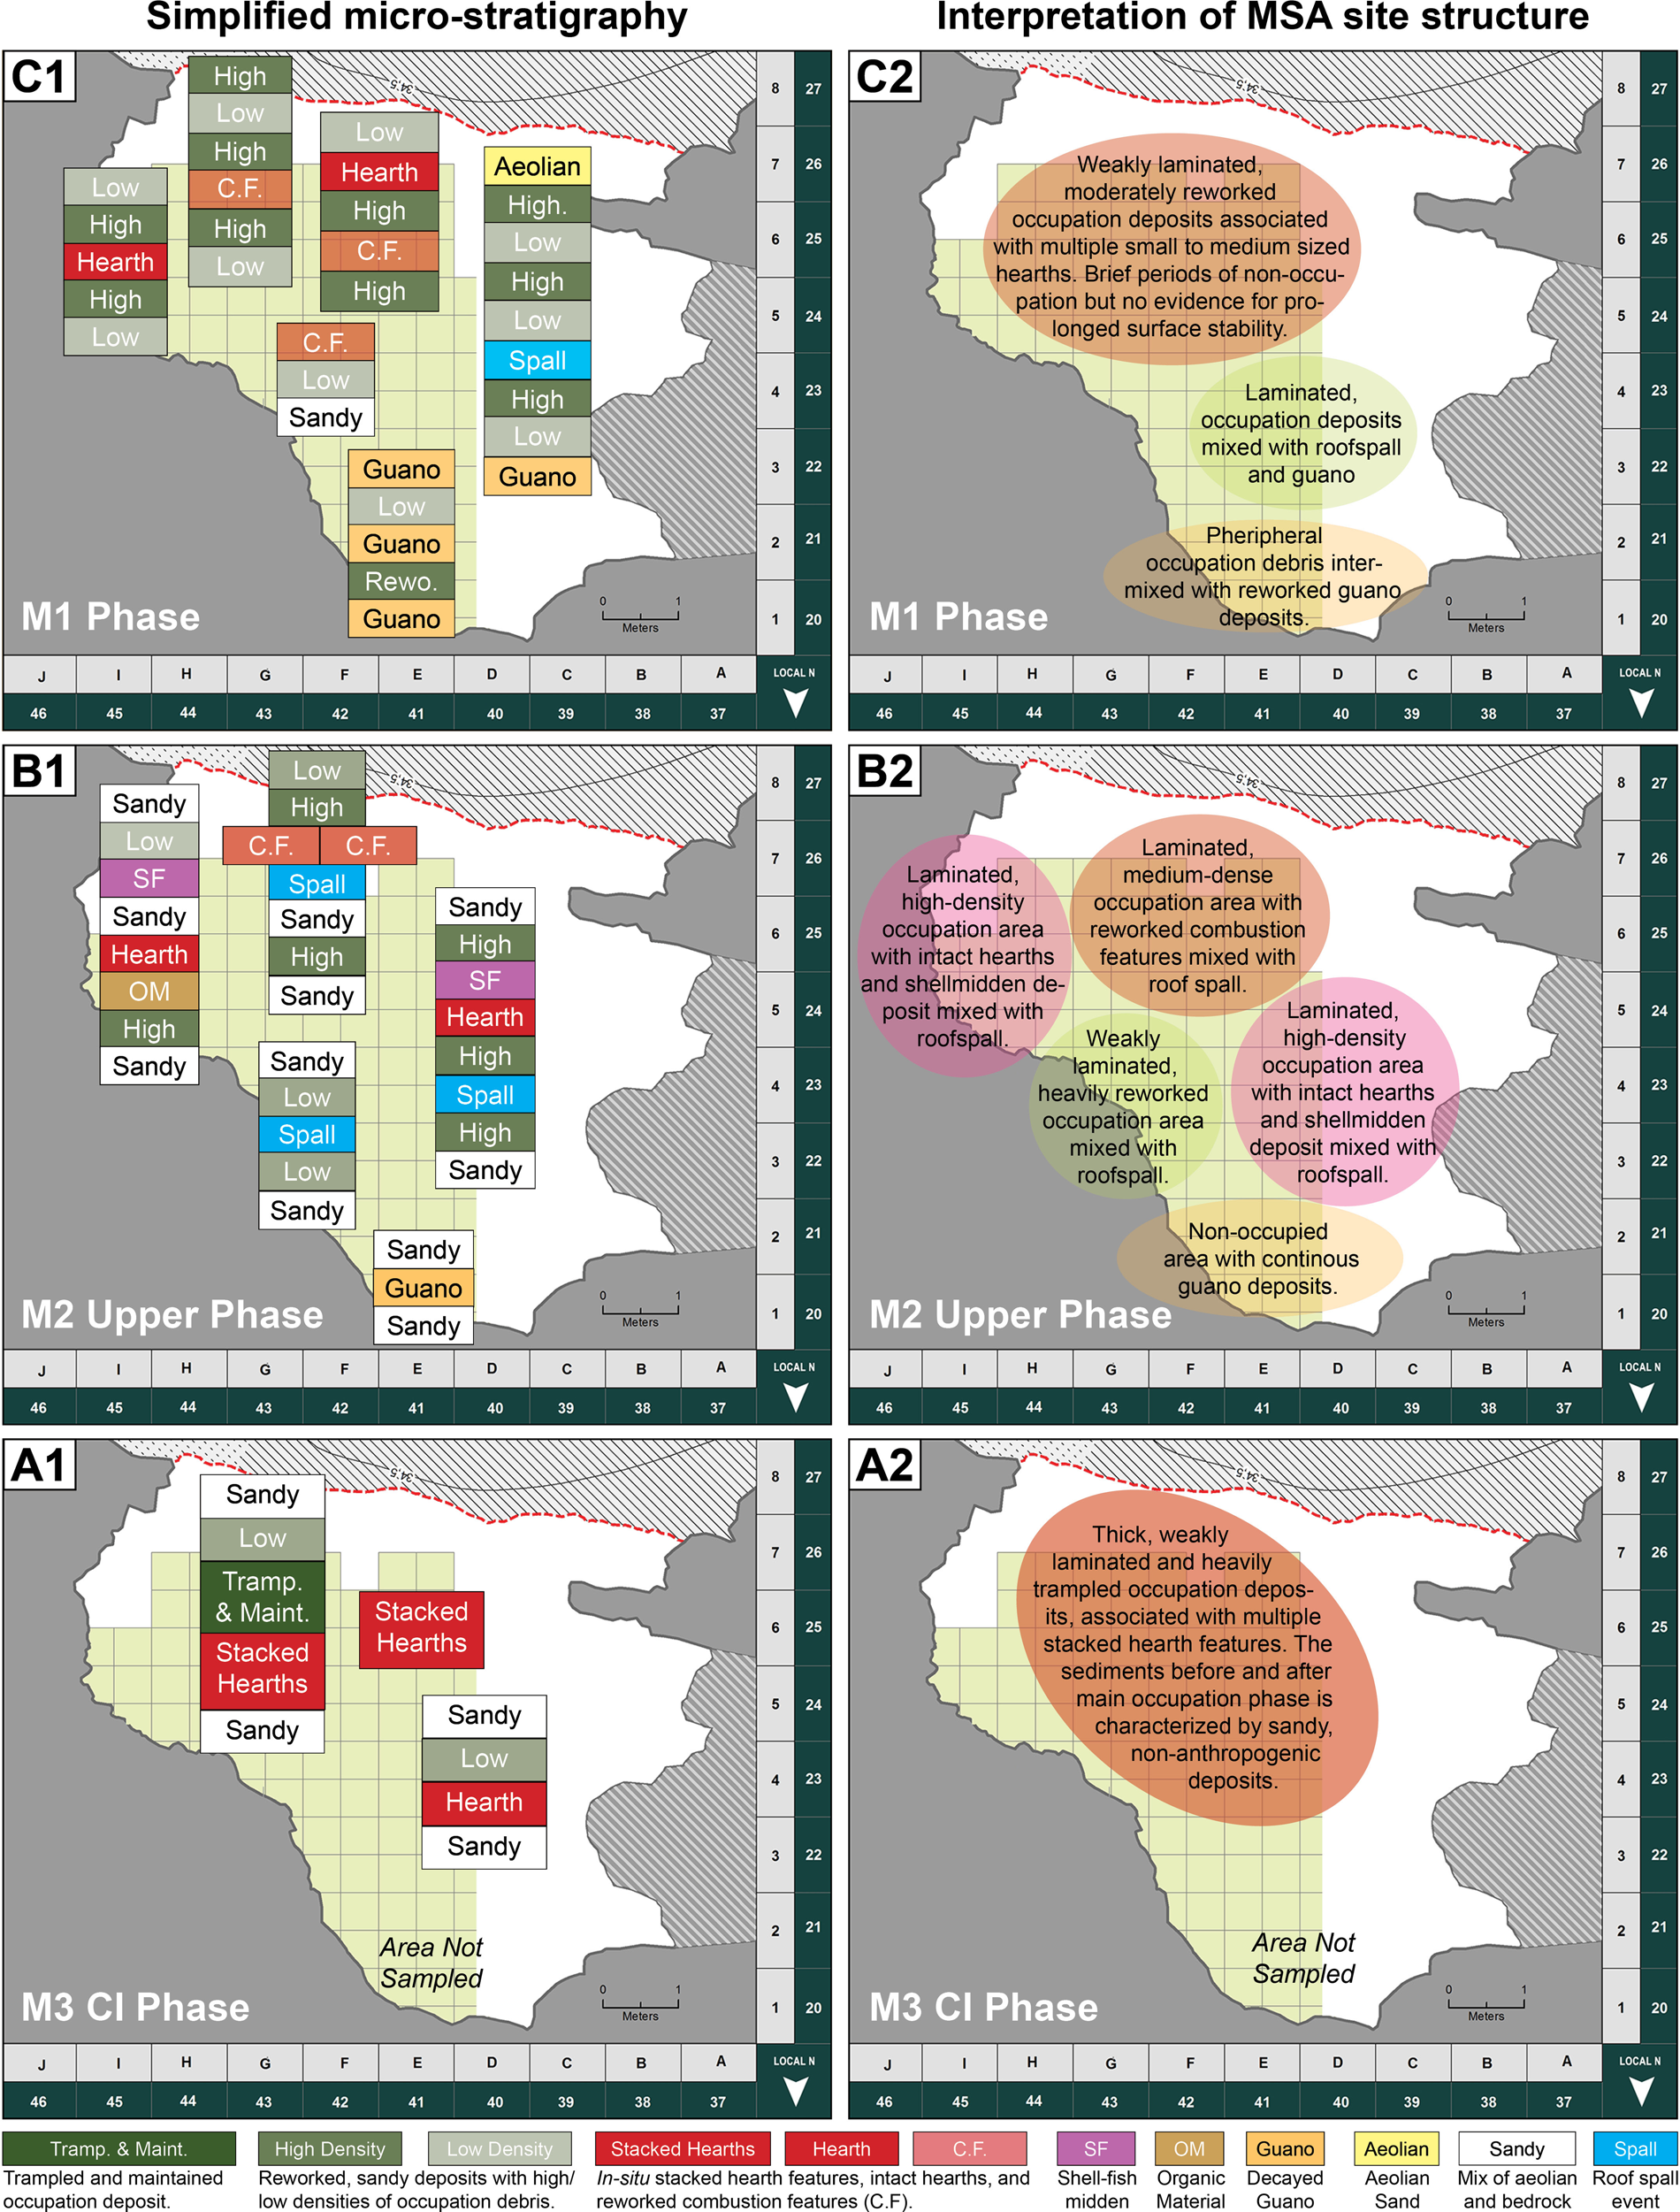
Comparing archaeostratigraphy, dating, artifact, and taphonomic analyses with microcontextual observations and interpretations of modes and intensity of Middle Stone Age (MSA) occupation.a
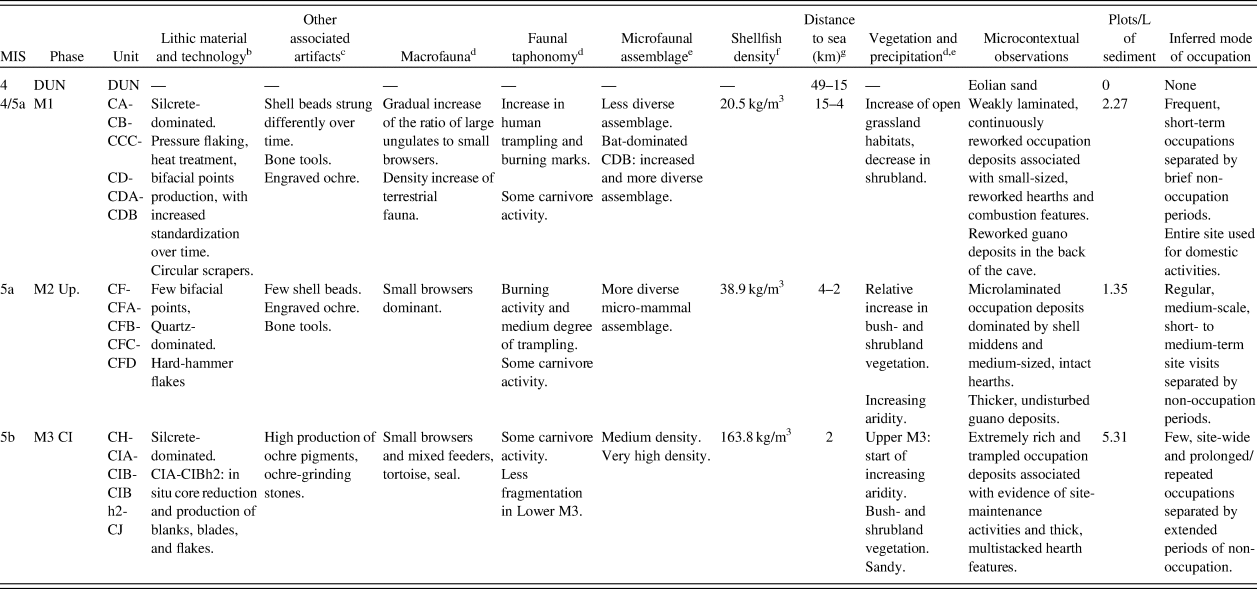
a Note that the overview does not represent the entire MSA sequence in Blombos Cave (Lower M2, Upper M3, and Lower M3 not included).
b Henshilwood et al., Reference Henshilwood, d'Errico, Marean, Milo and Yates2001a; Villa et al., Reference Villa, Soressi, Henshilwood and Mourre2009; Mourre et al., Reference Mourre, Villa and Henshilwood2010; Archer et al., Reference Archer, Pop, Gunz and McPherron2016; Douze et al., Reference Douze, Wurz and Henshilwood2015; Soriano et al., Reference Soriano, Villa, Delagnes, Degano, Pollarolo, Lucejko, Henshilwood and Wadley2015.
c Henshilwood et al., Reference Henshilwood, d'Errico, Marean, Milo and Yates2001a, Reference Henshilwood, Sealy, Yates, Cruz-Uribe, Goldberg, Grine, Klein, Poggenpoel, van Niekerk and Watts2001b, Reference Henshilwood, d'Errico, Yates, Jacobs, Tribolo, Duller, Mercier, Sealy, Valladas, Watts and Wintle2002, Reference Henshilwood, d'Errico, Vanhaeren, van Niekerk and Jacobs2004, Reference Henshilwood, d'Errico and Watts2009; d'Errico et al., Reference d'Errico, Henshilwood, Vanhaeren and van Niekerk2005; d'Errico and Henshilwood, Reference d'Errico and Henshilwood2007; Vanhaeren et al., Reference Vanhaeren, d'Errico, van Niekerk, Henshilwood and Erasmus2013.
d Henshilwood et al., Reference Henshilwood, Sealy, Yates, Cruz-Uribe, Goldberg, Grine, Klein, Poggenpoel, van Niekerk and Watts2001b; Thompson, Reference Thompson2008 Thompson and Henshilwood, Reference Thompson and Henshilwood2011; Badenhorst et al., Reference Badenhorst, Van Niekerk and Henshilwood2016; Roberts et al., Reference Roberts, Henshilwood, van Niekerk, Keene, Gledhill, Reynard, Badenhorst and Lee-Thorp2016; Reynard and Henshilwood, Reference Reynard and Henshilwood2017.
e Nel, Reference Nel2013; Nel and Henshilwood, Reference Nel and Henshilwood2016
f Henshilwood, Reference Henshilwood2008a; van Niekerk, Reference van Niekerk2011; Langejans et al., Reference Langejans, van Niekerk, Dusseldorp and Thackeray2012
g Fisher et al., Reference Fisher, Bar-Matthews, Jerardino and Marean2010.
M3 CI phase (ca. 88 ka): site use and mode of occupation
M3 CI: microcontextualized sediment data
Large portions of the M3 CI sequence (which constitutes the units CI, CIA, CIB, and CIBh2) are dominated by thick, laterally extensive and uninterrupted anthropogenic deposits, either in the form of weakly laminated and heavily trampled occupation debris or by multiple, superimposed in situ hearth features (Figs. 26, 27, and 28A). The partially burnt, fragmented occupation debris consists of a variety of materials, including ash and charred material, shellfish, bone fragments, lithic debris (quartz, silcrete, and quartzite), and ochre. The range of material attests to the intensity and diversity of domestic activities conducted inside the cave during this period, which appears to have included food preparation, knapping, pigment processing, and regular sweeping and redeposition of waste material.
We consider the general lack of nonanthropogenic MF-types, high fragmentation rate, evidence of site maintenance, and the making and reuse of larger hearth features to be indicators of an occupation mode characterized by prolonged human visits (cf. similar interpretations by Goldberg et al., Reference Goldberg, Miller, Schiegl, Ligouis, Berna, Conard and Wadley2009; Wadley et al., Reference Wadley, Sievers, Bamford, Goldberg, Berna and Miller2011; Miller et al., Reference Miller, Goldberg and Berna2013). The depositional pattern during the M3 CI phase is distinct from that observed in the previous phase, the Lower M3. The depositional processes in the Lower M3 phase appear primarily to be related to geogenic and biogenic activity (Fig. 28A), the sediments show low densities of human occupation debris (Fig. 28B), and there is an increase in the number of intact and phosphatized surface crusts (Fig. 28C). Consequently, we interpret the observations in Lower M3 indicative of periods with increased surface stabilization and general human abandonment.
The M3 CI occupation horizon can be traced over larger parts of the cave interior as a very distinct and internally homogenous decimeter-thick horizon (Figs. 6 and 7). If we consider the lateral variability of microstratigraphy within the M3 CI phase (Fig. 29A1), we note that while thick hearth features are found in all the investigated sectors (south-central and west), the thickest deposits of trampled occupation debris occur in the areas closer to the cave mouth (south-central) (Fig. 26). Considering the spatial configuration of the cave interior and the narrowing of cave walls toward the dripline (Fig. 2), the increased accumulation and fragmentation of debris behind the dripline may thus be explained by the presumably heavier traffic in this area (e.g., the passage effect; Rentzel et al., Reference Rentzel, Nicosia, Gebhardt, Brönnimann, Pümpin and Ismail-Meyer2017). Apart from these broad and general spatial patterns, however, it is difficult to recognize any clear or formal divisions of space (Fig. 29A2). The Blombos Cave M3 CI phase thus represents an averaged site-structure type that is very similar to that described by Marshall (Reference Marshall1976) and Yellen (Reference Yellen1977) and may attest to a prolonged occupation period, during which multiple, spatially overlapping human activities took place.
In sum, we suggest that during the M3 CI phase, Blombos Cave may have been subject to fewer, but more intense and continuous human occupations, preceded and followed by extended periods of very low-intensity occupation (i.e., the Lower and Upper M3 phases).
M3 CI: artifact data
M3 CI has the highest number of plotted finds (5.1–15.4 plots/L of sediment; Fig. 7A) as well as the highest density of shellfish (163.8 kg/m3) (Henshilwood et al., Reference Henshilwood, Sealy, Yates, Cruz-Uribe, Goldberg, Grine, Klein, Poggenpoel, van Niekerk and Watts2001b; Langejans et al., Reference Langejans, van Niekerk, Dusseldorp and Thackeray2012) of any phase of the MSA at Blombos Cave. Thus, the amount of archaeological remains appears to support our interpretation of M3 Cl as representing a period of intense human occupation. Douze et al. (Reference Douze, Wurz and Henshilwood2015) report that the lithic material recovered from the M3 CI layers represent an assemblage that is characterized by the production of blanks, blades, and flakes, primarily through extensive in situ core reduction. This on-site lithic tool production supports the hypothesis that people occupying Blombos Cave during the M3 phase used the interior part of the cave intensively. Finally, the large amounts of ochre and the recovery of large and heavy ochre-grinding stones (Henshilwood et al., Reference Henshilwood, d'Errico and Watts2009) indicates that a range of domestic and stationary activities took place inside the cave at this point in its occupation history.
M3 CI: fauna, taphonomy, and sea levels
According to Fisher et al. (Reference Fisher, Bar-Matthews, Jerardino and Marean2010), during the M3 CI phase at Blombos Cave (ca. 88-82 ka ago), the sea was closer to the site (83 ka: 1.45–2.33 km) than at any other time during the MSA (Fig. 30). Thus, the site's proximity to the coast likely provided easier access to marine resources and facilitated more efficient transportation of these resources back to the site. The high amount of recovered shellfish from M3 CI (Langejans et al., Reference Langejans, van Niekerk, Dusseldorp and Thackeray2012) and the reported increase in the number of marine mammals (Badenhorst et al., Reference Badenhorst, Van Niekerk and Henshilwood2016) supports this hypothesis. Several studies of the M3 faunal assemblage also show that the occupants during this time period had a diet complemented by small browsers, mixed feeders, and tortoise (Henshilwood et al., Reference Henshilwood, Sealy, Yates, Cruz-Uribe, Goldberg, Grine, Klein, Poggenpoel, van Niekerk and Watts2001b; Thompson and Henshilwood, Reference Thompson and Henshilwood2011). The presence of these species corresponds well with the analysis of the M3 microfaunal assemblage by Nel (Reference Nel2013), which indicates that the vegetation around the cave was dominated by bush- and shrubland. Taking the cultural material and environmental proxies together, therefore, it appears that hunter-gatherers occupied Blombos Cave for prolonged time periods during the M3 CI phase and had adopted a relatively broad subsistence strategy that included both marine and terrestrial resources.
(color online) Map of the Blombos Cave coastline today and modeled coastlines during Middle Stone Age occupation phases: M1, Upper M2, and M3 CI. Bathymetric data is modified after de Wet (2013). Estimated maximum and minimum relative sea-level heights (per occupation phase) are from Fisher et al. (Reference Fisher, Bar-Matthews, Jerardino and Marean2010). Base maps are from ESRI ArcGIS Online (World Imagery and Shaded Relief).
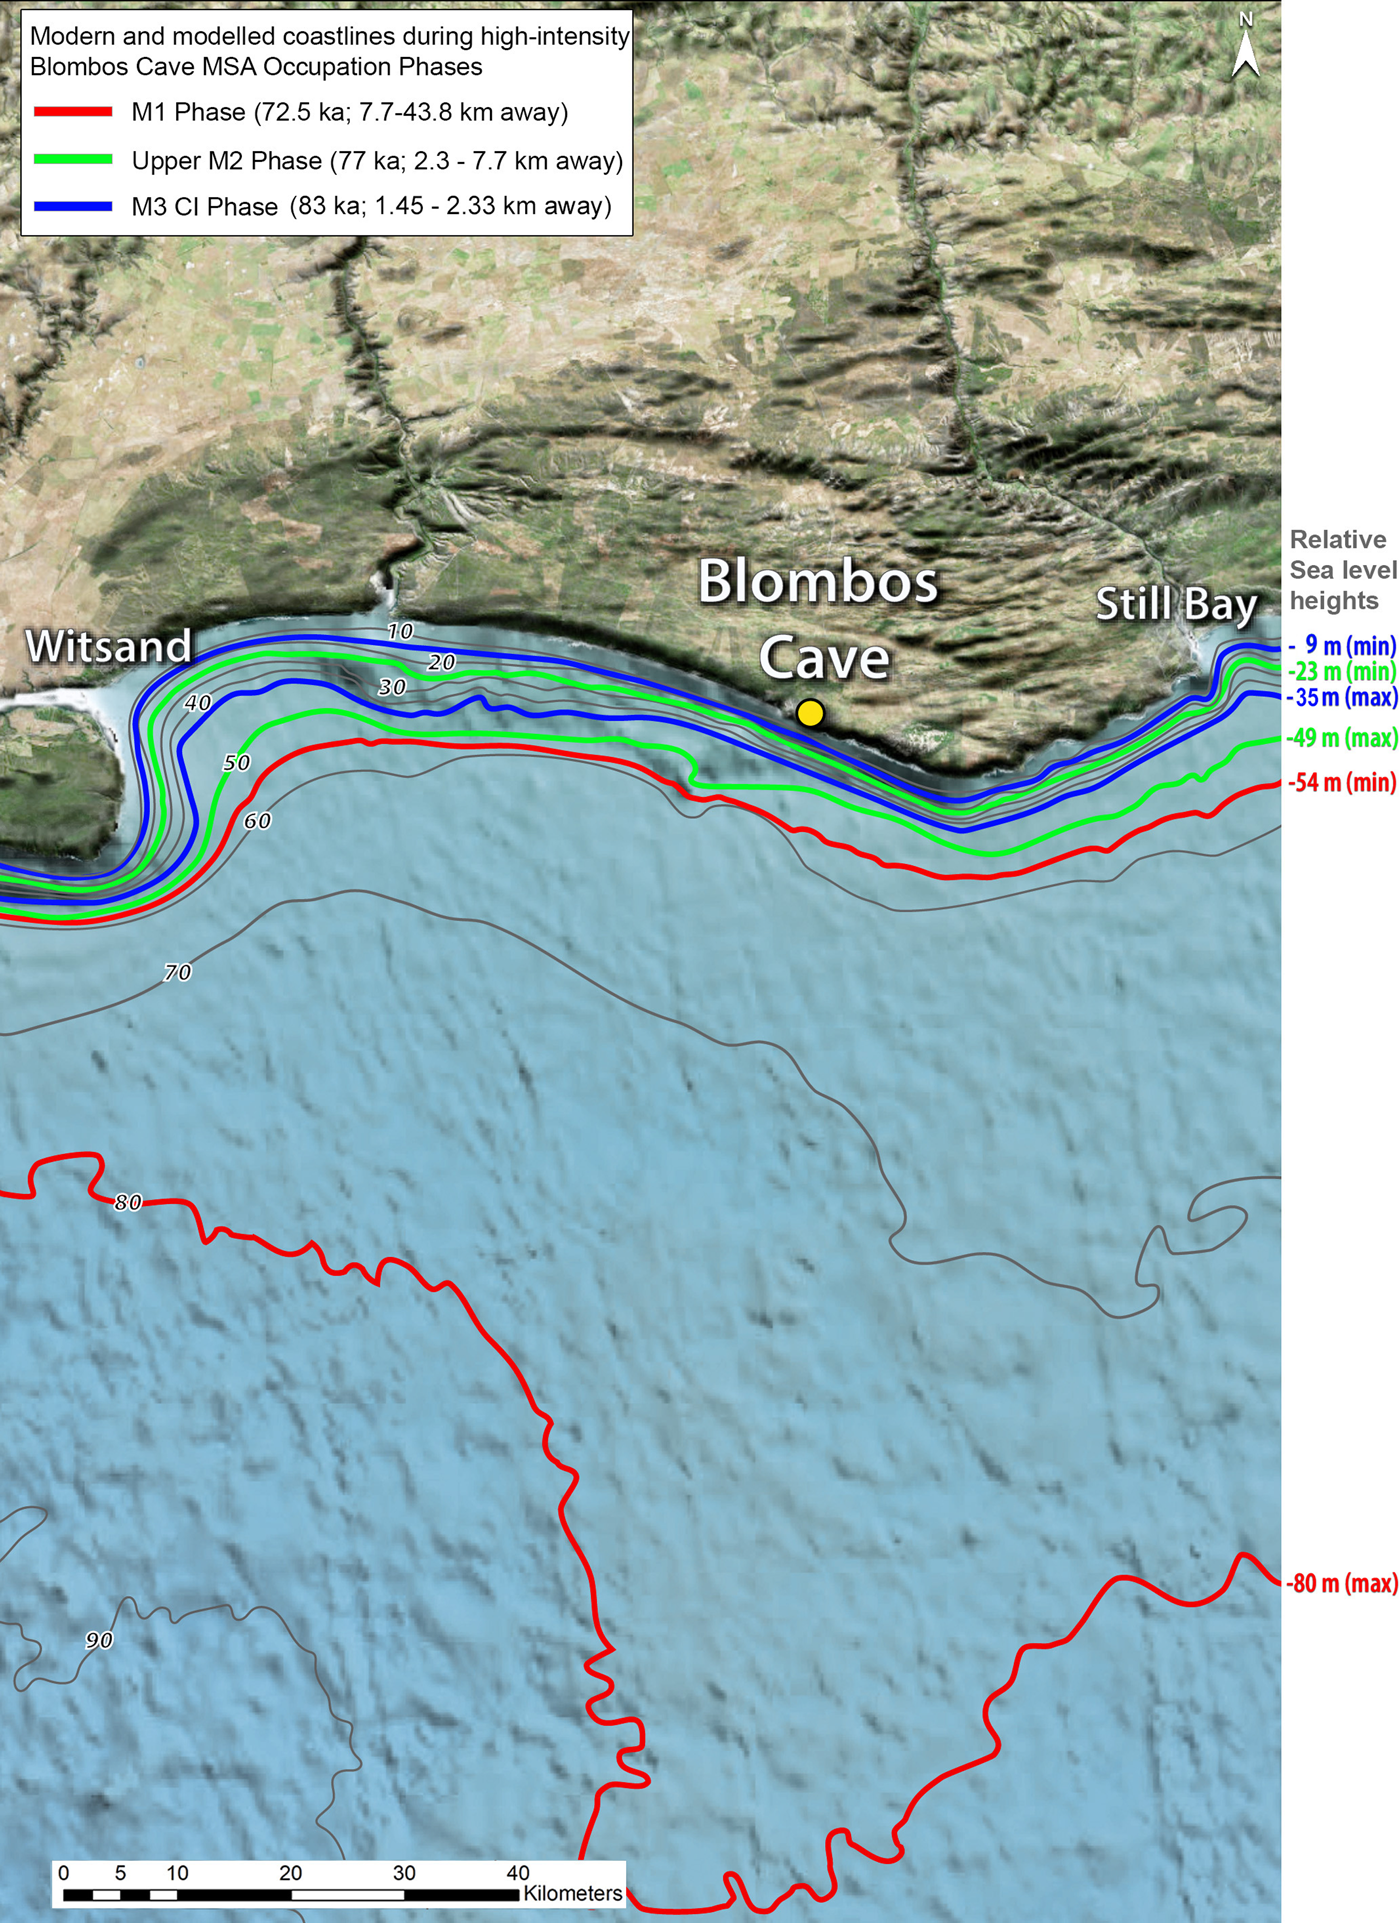
Upper M2 phase (ca. 77 ka): site use and mode of occupation
Upper M2: microcontextualized sediment data
Unlike the M3 CI phase, the Upper M2 phase does not consist of an uninterrupted sedimentary sequence of human occupation debris (Fig. 26). Instead, the Upper M2 sequence is characterized by relatively intact microlaminated deposits, some of which are associated with distinct human activities (e.g., hearth features, middening), and others of which are associated with biogenic and geogenic processes (rockfall events) (Figs. 26 and 28A). Laterally extensive roof-spall layers (Fig. 28A), sandy facies with little or no anthropogenic material (Figs. 26 and 28B), and intact phosphatized surface crusts (Fig. 28C) are present in Upper M2 as well. Taken together, the interfingering of bio-, geo-, and anthropogenic deposits indicate that the Upper M2 phase experienced multiple periods of human occupation, followed by several phases of temporary abandonment.
The lateral distribution of MF-types in the Upper M2 phase shows some clear intrasite spatial patterning (Fig. 29B1 and B2). The sediments in the southeast and western part of the cave contain deposits rich in shellfish and bone fragments (Fig. 26), as well as in situ hearth features (Fig. 27). The structural preservation of these laminated anthropogenic deposits (Fig. 28C), combined with their location in the flanking areas of the cave (Fig. 29B1), imply that overlapping activities did not occur to the same extent as in the more central areas of the cave (or as in the M3 CI phase). Instead, the placement of midden deposits toward the cave walls (Fig. 29B2), and thus away from the natural passageways of the cave, may be indicative of intentional and structured waste management strategies (similar site-maintenance procedures have been reported by Goldberg et al. [2009] and Miller et al. [2013]).
The deposits in the central sector (toward the cave wall) are less microlaminated and more reworked than in other parts of the cave. However, they contain less occupation debris (Fig. 26), and we observed no in situ hearth features in this part of the cave (Fig. 27). According to Kelly (Reference Kelly1992), one would not necessarily expect to find debris in primary context at sites where middening or other site-maintenance practices occur. Instead, main activity areas would be kept clean, while peripheral areas (to the activities) would become main areas of debris accumulation. Consequently, we suggest that during the Upper M2 phase, the central sector of Blombos Cave may have been acting as a central activity area, in which occupation debris was not allowed to accumulate, but where the floor sediments were subjected to a range of surficial occupation processes, such as repeated trampling, sitting, moving, or sleeping.
The sediments in the back of the cave (north sector) consist entirely of guano deposits intermixed with disintegrated bedrock (Fig. 28A) and contain no anthropogenic input (Fig. 28B), indicating that this part of the cave was not regularly used by humans during the Upper M2 phase. The south-central area of the cave (ca. 1 m behind the dripline) is characterized by microlaminated sandy deposits, some of which contain frequent inclusions of anthropogenic coarse fraction and burnt deposits (Figs. 26, 27, and 28A and B). While no in situ hearth features are documented, two moderately reworked combustion features can be recognized (Figs. 26 and 27). These ash-rich, sandy features are macroscopically visible in the section wall and may be traced as multiple, laterally extensive, centimeter-thick lenticular structures (Fig. 10D). Their differential preservation (i.e., intact near the cave walls and more reworked toward the center of the cave) suggest that overlapping human activities took place in the central areas of the cave during the Upper M2 phase (Fig. 29B1 and B2), and to such an extent that the previous occupation features became mechanically reworked, for example, through repeated trampling (Rentzel et al., Reference Rentzel, Nicosia, Gebhardt, Brönnimann, Pümpin and Ismail-Meyer2017).
In sum, the absence of stacked hearth features (Fig. 27), the moderate but differential degree of trampling and reworking (Fig. 28C), and the observation of spatially differentiated activity areas (Fig. 29B1 and B2) suggest that the Upper M2 occupations were relatively less intensive, or at least not as continuous and overlapping, as the occupations that took place during the M3 CI phase. The presence of several shellfish middens (Fig. 26) and the differentiated use of space are indicative of structured site maintenance and organized waste disposal. According to both Brooks and Yellen (Reference Brooks, Yellen and Kent1987) and Hitchcock (Reference Hitchcock and Kent1987, Reference Hitchcock2004), domestic waste management is often linked to—and made necessary by—an increase in residential sedentism and long-term occupations.
Upper M2: artifact data
Considering the general archaeological assemblage recovered from the Upper M2 levels, it is defined by the earliest, but infrequent, occurrences of bifacially worked stone points (Villa et al., Reference Villa, Soressi, Henshilwood and Mourre2009), polished bone points (Henshilwood et al., Reference Henshilwood, d'Errico, Marean, Milo and Yates2001a; d'Errico and Henshilwood, Reference d'Errico and Henshilwood2007), and perforated marine shell beads (Henshilwood et al., Reference Henshilwood, d'Errico, Vanhaeren, van Niekerk and Jacobs2004; d'Errico et al., Reference d'Errico, Henshilwood, Vanhaeren and van Niekerk2005; Vanhaeren et al., Reference Vanhaeren, d'Errico, van Niekerk, Henshilwood and Erasmus2013). Unlike the Still Bay levels in the M1 phase, which are dominated by fine-grained silcrete, the lithic assemblage in Upper M2 is dominated by quartz and the use of hard-hammer techniques (Henshilwood et al., Reference Henshilwood, Sealy, Yates, Cruz-Uribe, Goldberg, Grine, Klein, Poggenpoel, van Niekerk and Watts2001b). Consequently, the proposed changes in occupation mode from M3 CI to the Upper M2 can be linked to the introduction of new lithic technology and the adoption of artifact types associated with the Still Bay techno-complex.
The amount of plotted material (1.35 plots/L of sediment; Fig. 6B) in the Upper M2 phase is not nearly as high as in the M3 CI phase. Also, the densities of shellfish recovered drop significantly compared with the M3 Phase (38.9 kg/m3) (Langejans et al., Reference Langejans, van Niekerk, Dusseldorp and Thackeray2012). While several archaeologists have warned against using the density of archaeological material to assess occupation density or degree of sedentism (Kelly, Reference Kelly1992; Jerardino, Reference Jerardino1995, Reference Jerardino2016), evaluating the number of artifacts within an occupation horizon in relation to their microcontextual setting allows us to assess which processes may have affected the accumulation of artifacts and the sediments surrounding them. Considering the nature and types of sedimentary constituents within the Upper M2 horizon, there is nothing that suggests to us that major changes in depositional processes or sources took place during this time. In correlation with our microcontextual interpretation of occupation mode, therefore, we believe that the lower numbers of artifacts and marine shellfish in the Upper M2, compared with the M3 CI phase, reflect real changes in human site occupation intensity.
Upper M2: fauna, taphonomy, and sea levels
During the Upper M2 phase, sea level continued to retract, so Blombos Cave may have been situated between 2.3–7.7 km away from the coastline (Fisher et al., Reference Fisher, Bar-Matthews, Jerardino and Marean2010). These changes in sea level occurred parallel to a gradual shift in local vegetation—and an increase in bush- and shrubland vegetation—as indicated by the higher diversity in micromammal composition (Nel, Reference Nel2013; Nel and Henshilwood, Reference Nel and Henshilwood2016) and the dominating presence of small browsers within the macrofaunal assemblage (Thompson and Henshilwood, Reference Thompson and Henshilwood2011; Reynard and Henshilwood, Reference Reynard and Henshilwood2017).
Unlike the M3 CI phase, where we argue that the main intensification factor was the length of occupation (longer visits), we suggest that in Upper M2, it is the number of occupation events (higher frequency of visits) combined with occasionally lengthier stays (duration of visits) that resulted in an increased accumulation of anthropogenic material. This interpretation is consistent with the results of the taphonomic studies of faunal remains conducted by Thompson and Henshilwood (Reference Thompson and Henshilwood2011). They report an increase in burning activity and trampling during the Upper M2 phase compared with the immediately preceding periods (Lower M2 and Upper M3). Reynard and Henshilwood (Reference Reynard and Henshilwood2019) also show evidence of more trampled bone in the Upper M2 (see also Fig. 25). Yet they also note that complete long-bone cylinders and the proportion of tooth-marked bone were also high in this phase, suggesting that both people and animal scavengers were present during this phase.
M1 phase (ca. 74–72 ka): site use and mode of occupation
M1: microcontextualized sediment data
While the archaeostratigraphic layer separating the M1 and the Upper M2 phases (unit CDB) is characterized by low amounts of anthropogenic input (Figs. 25–27), most of the M1 phase (units CA-CB-CC-CD) is dominated by a 30- to 50-cm-thick and alternating succession of bedded, moderately reworked sandy deposits containing anthropogenic, geogenic, and biogenic input with a high proportion of trampled bone (Figs. 25 and 28). The densities of coarse occupation debris in the M1 phase is not as high or as homogenous as in the M3 CI phase (Fig. 28B), and its distribution appears less horizontally oriented and more randomly dispersed than during the Upper M2 phase (Fig. 26). Consequently, the microstratigraphic transitions between sediments with high and low densities of anthropogenic material are more diffuse than those observed in the well-preserved areas of the Upper M2 phase. From the heat-distribution maps, we also notice that many of the hearth features in M1 are often moderately reworked (Fig. 27).
The occurrence of a high number of moderately rich, stacked anthropogenic MF-types in the M1 phase is not consistent with long-term modes of occupation, as seen in the M3 CI. And unlike the Upper M2 phase, the M1 phase has few structurally intact MF-types associated with surface stability, for example, intact phosphatized crusts or sandy deposits without anthropogenic fraction (Fig. 28C). While the Upper M2 phase appears to have experienced multiple periods of human absence, similar abandonment phases are less pronounced in the M1 phase. An exception to this is the transitional unit CFA/CDB, situated between Upper M2 and M1 phase, which has a plot density of 0.69 plots/L of sediment. Above CDB, the rest of the M1 sequence can be characterized as one continuous sequence of reworked sandy occupation deposits (Fig. 28A–C). Thus, it may appear that the frequency of human (re)visits during the M1 phase did intensify, and to such an extent that the occupation surfaces within the cave never had time to stabilize or become buried without being reworked. A continuous series of reoccupations appear to have constantly reworked the cave floor, not allowing surface crusts or sterile deposits to form in place. That the M1 phase experienced more human visits and reoccupation events is also corroborated by a marked increase of abraded bone in the M1 phase, particularly in units CC and CD (Fig. 25).
While the intrasite spatial variation of MF-types in the M1 phase is more pronounced than the patterns observed during the M3 CI phase, it is not as well defined as the site structure in the Upper M2 phase (Fig. 29C1 and C2). For example, we observe that combustion features and concentrations of burnt sediments are found in almost all areas of the cave, except in the west section (Figs. 26 and 28C1). During the M1 phase, and unlike in the Upper M2 phase, occupation debris is infrequently intermixed with the sandy guano deposits in the back of the cave (Fig. 26, 28, and 29C1). This may indicate that humans during the M1 phase occupied larger and potentially more peripheral parts of the cave than in any of the previous phases. Given that the occurrence and accumulation of guano often have been associated with periods of human absence (Karkanas, Reference Karkanas, Nicosia and Stoops2017), the alternating microlaminations containing both anthropogenic coarse fraction and decayed guano—as seen in the M1 phase in the north sector—may be yet another proxy for a recurrent human occupation and abandonment pattern, during which guano-producing animals (most likely bats) moved back to the cave after humans temporarily left (Fig. 24 and 26A).
M1: artifact data
Archaeologically, the M1 phase is associated with a fully established, silcrete-dominated Still Bay assemblage (Villa et al., Reference Villa, Soressi, Henshilwood and Mourre2009; Mourre et al., Reference Mourre, Villa and Henshilwood2010; Archer et al., Reference Archer, Pop, Gunz and McPherron2016). Most of the recovered marine shell beads (Henshilwood et al., Reference Henshilwood, d'Errico, Vanhaeren, van Niekerk and Jacobs2004; d'Errico et al., Reference d'Errico, Henshilwood, Vanhaeren and van Niekerk2005) and several engraved ochre pieces have been reported from the M1 phase (Henshilwood et al., Reference Henshilwood, d'Errico, Yates, Jacobs, Tribolo, Duller, Mercier, Sealy, Valladas, Watts and Wintle2002). Previous studies have demonstrated that some of these artifact categories should not be viewed as static cultural entities, but rather as techno-cultural expressions that continued to develop throughout the M1 phase, as evidenced by the shifts in shell-bead stringing over time (Vanhaeren et al., Reference Vanhaeren, d'Errico, van Niekerk, Henshilwood and Erasmus2013) and the gradual standardization of bifacial points (Archer et al., Reference Archer, Pop, Gunz and McPherron2016). The plotted find densities in the M1 phase (CA-CD: 1.3–3.7 plots/L of sediments; Fig. 7A) are not as high as in the M3 CI phase but are more comparable to, or slightly higher than, those of the Upper M2. During the M1 phase, the shellfish densities drop to 20.5 kg/m3, which is the lowest of all MSA occupation phases (Langejans et al., Reference Langejans, van Niekerk, Dusseldorp and Thackeray2012).
M1: fauna, taphonomy, and sea levels
The analysis of the terrestrial fauna from Blombos Cave shows a shift from small browsers and mixed feeders in the lower levels (M3, 101–85 ka) to a gradual increase in the ratio of large ungulates to small browsers in the upper levels (M1, 77–72 ka) (Reynard and Henshilwood, Reference Reynard and Henshilwood2017).
The reduction in marine resource exploitation during the M1 phase occurs at a time when the distance to sea increased significantly; up to 7.7–43.8 km according to Fisher et al. (Reference Fisher, Bar-Matthews, Jerardino and Marean2010), and the nearby vegetation experienced a relative reduction in bush- and shrubland (Nel and Henshilwood, Reference Nel and Henshilwood2016) combined with a relative increase of open grassland habitats (Discamps and Henshilwood, Reference Discamps and Henshilwood2015).
The taphonomic analysis of M1 fauna also shows evidence for increased occupational intensity, especially in layer CC (Fig. 25). In general, the bone fragments from unit CC are smaller, transverse fractures are more common, faunal weight per volume is significantly higher than in other layers, and the proportion of identified bone is lowest in that layer (Reynard and Henshilwood, Reference Reynard and Henshilwood2018). The proportion of identifiable bone is often a good proxy for fragmentation, with highly fragmented faunal assemblages more likely to produce less identifiable faunal specimens (Klein and Cruz-Uribe, Reference Klein and Cruz-Uribe1984; Lyman, Reference Lyman2008). Increases in long-bone transverse fractures may be a result of more intense occupational phases. For example, at South African MSA sites such as Die Kelders (Marean et al., Reference Marean, Goldberg, Avery, Grine and Klein2000), Sibudu (Clark, Reference Clark2009), and Klipdrift Shelter (Reynard et al., Reference Reynard, Discamps, Badenhorst, Van Niekerk and Henshilwood2016a) high frequencies of transverse fractures are associated with more intensely occupied periods. This is probably because transverse fractures have been linked linked to sediment compaction (Villa and Mahieu, Reference Villa and Mahieu1991). While layer-specific sediment compaction may be associated with geomorphic process such as rockfalls (Brain, Reference Brain1983), the accumulative weight of people in rock shelters would likely have compacted occupational floors, increasing the chances of transverse fractures (Reynard et al., Reference Reynard, Discamps, Badenhorst, Van Niekerk and Henshilwood2016a).
Furthermore, the highest faunal density values per number of specimens are also found in unit CC (106,036 specimens/m3) compared with the lowest value (17,469 specimens/m3) in unit CFD (Upper M2 phase). Although weight per volume is not significantly correlated with the number of specimens per volume, unit CC has the second-highest faunal density value (33 kg/m3), while unit CFD has the lowest (15.8 kg/m3). Based on the number of specimens per volume, the M1 shows significantly higher numbers in this phase (76,474 specimens/m3) compared with the Upper M2 (37,221 specimens/m3) (Reynard and Henshilwood, Reference Reynard and Henshilwood2019).
We would argue that the main intensification factor during the M1 phase, in contrast to the M3 CI phase and similar to but more pronounced than in the Upper M2 phase, was the frequency of visits, rather than the length of occupation. These occupation phases appear to have been separated by phases of nonoccupation that were likely briefer than those documented in the Upper M2 phase. However, the rate of human visits during the M1 phase appears to have been to such an extent that previous occupation floors and abandonment surfaces were more frequently trampled and intermixed with each other, rather than being buried and preserved, as was the case in the Upper M2 phase. This view is supported by taphonomic analysis of faunal material, which shows a marked increase in fragmentation and burning marks associated with human modification in the upper part of the M1 phase, implying that this phase may have experienced an increase in trampling and fire-related human activities (Reynard and Henshilwood, Reference Reynard and Henshilwood2019). Indeed, the trampling data from the taphonomic analysis correspond well with the geoarchaeological and micromorphological evidence, indicating that the M1 and the Upper M2 experienced increased site use.
Reynard and Henshilwood (Reference Reynard and Henshilwood2018) have previously hypothesized that the high frequency of animal-induced bone modification, combined with lower faunal densities in the Upper M2, could point to shorter occupational events in the early Still Bay phase and that the inverse pattern during the M1 could indicate longer-term site use during the M1. Yet, considering our micromorphological observations reported in this study, we argue for the opposite view. We suspect that some of the original taphonomic observations made by Reynard and Henshilwood (Reference Reynard and Henshilwood2018) may be related to the episodic abandonment phases in the Upper M2, rather than being indicative of an increase in cave visit frequency during this time (Figs. 26 and 28B and C). While the trampling and geomorphic data correspond well through the Still Bay sequence at Blombos Cave, more work is needed to properly address some of the discrepancies between micromorphological and taphonomic data sets. Given this, we do believe that these types of high-resolution, interdisciplinary cross-checking exercises have a great potential in narrowing down equivocal interpretations.
Broader implications for regional site use and settlement dynamics in the southern Cape during the MIS 5b-4 (88–72 ka)
By linking our sediment-based interpretation of MSA occupation deposits with the local archaeological and taphonomic record, we argue that major shifts in occupational modes and intensity occurred in Blombos Cave between 88 and 72 ka ago. These shifts, which we associate with changes in the frequency and duration of human cave visits, coincide with considerable sea-level fluctuations (Fig. 30). These fluctuating coastlines during the MSA at Blombos would have affected the lives of these coastal cave inhabitants significantly and in multiple ways. First, their access to the sea and marine resources would change substantially (Langejans et al., Reference Langejans, van Niekerk, Dusseldorp and Thackeray2012). Second, the marine regression could have led to the emergence of a large mammal ecosystem on the Palaeo-Agulhas Plain (Marean et al., Reference Marean, Bar-Matthews, Fisher, Goldberg, Herries, Karkanas, Nilssen and Thompson2010, Reference Marean, Cawthra, Cowling, Esler, Fisher, Milewski, Potts, Singels and De Vynck2014, Reference Marean, Cowling and Franklin2020; Copeland et al., Reference Copeland, Cawthra, Fisher, Lee-Thorp, Cowling, Le Roux, Hodgkins and Marean2016; Venter et al., Reference Venter, Brooke, Marean, Fritz and Helm2019).
From the shellfish and fauna recovered from Blombos Cave, we know that marine resources formed an essential part of the inhabitants’ diet. Yet these resources were not exploited in equal amounts throughout the MSA and were more intensely exploited when the coast was closer to the cave. Consequently, we suggest that the observed shifts in occupational intensity in Blombos Cave, which coincides with the cave's relative distance to the sea, most likely reflect a change in local site function, that is, the degree to which the MSA inhabitants used the cave as a logistical base for efficient marine resource exploitation. This mode of coastal occupation, which most likely relied on abundant and predictable access to shellfish resources (Marean et al., Reference Marean, Bar-Matthews, Fisher, Goldberg, Herries, Karkanas, Nilssen and Thompson2010; Marean, Reference Marean2014), is a well-known logistical subsistence pattern often is associated with semisedentary coastal hunter-gatherer communities (Yesner et al., Reference Yesner, Ayres, Carlson, Davis, Dewar, González Morales and Hassan1980). Because of the reliability and abundance of marine resources, members of such coastal communities are often able to stay at a settlement for longer periods, and only occasionally shift from one to another settlement at different seasons (Binford, Reference Binford1980; see also De Vynck et al., Reference De Vynck, Difford, Anderson, Marean, Cowling and Hill2019).
At the end of the M1 period, however, due to lower sea levels, the relative location of Blombos Cave to the nearest coastline shifts significantly, and the site becomes more of an inland site compared with the previous MSA phases (Fig. 30). People visiting Blombos Cave during this period transported considerably less shellfish to the site than in any previous MSA phase; and the density of terrestrial fauna within the archaeological assemblage increases (Thompson and Henshilwood, Reference Thompson and Henshilwood2011; Reynard and Henshilwood, Reference Reynard and Henshilwood2017). We suggest, therefore, that the higher residential mobility seen in the M1 phase most likely reflects the fact that the site, which at that stage was more than 15 km away from the coast, was no longer attractive as a long-term logistical base for extensive marine resource exploitation.
If the changes in occupational intensity at Blombos Cave were indirectly brought on by continental-scale sea-level change, and more directly by shifts in relative geographic location to the sea, it is likely that the local occupational pattern we have described was more widespread and therefore also representative of more regional settlement dynamics. During the MSA, the southern Cape was subject to substantial regional paleo-ecological changes, many of which were directly related to the expansion and contraction of the Palaeo-Agulhas Plain (Marean et al., Reference Marean, Cawthra, Cowling, Esler, Fisher, Milewski, Potts, Singels and De Vynck2014, Reference Marean, Cowling and Franklin2020; Wilkins et al., Reference Wilkins, Brown, Oestmo, Pereira, Ranhorn, Schoville and Marean2017; Cawthra et al., Reference Cawthra, Jacobs, Compton, Fisher, Karkanas and Marean2018). Bearing this in mind, we synthesize the two interrelated trends we have observed in the Blombos Cave data in more general terms and then consider whether these could also be indicative of regional processes that may have occurred during the Late Pleistocene in the southern Cape:
1. Some MSA sites that were close to the coastline during MIS 5b became inland sites during MIS 5a. Despite this change of relative location (site type), hunter-gatherers continued to occupy these former coastal sites. Still, their reasons for doing so (site function) changed and appear to be associated with an increased focus on terrestrial resource exploitation.
2. The hunter-gatherers living in the MIS 5a inland sites occupied them in a different way (mode of occupation) than those residing there during MIS 5b. The MIS 5a groups visited the inland sites more frequently (increased number of visits) but stayed in them for only brief periods each time (increased mobility).
While the first occupational pattern appears to track changes in ecological niche exploitation and changes in foraging strategies, one may hypothesize that the second trend could provide an important contextual backdrop for the cultural innovation and diversity that took place during the MSA in this area (Mackay et al., Reference Mackay, Stewart and Chase2014; Vaesen et al., Reference Vaesen, Collard, Cosgrove and Roebroeks2016). If we consider the sediment-based evidence reported in this paper, we note that the MSA phase, which experienced the most significant cultural and technological development (i.e., the Still Bay, M1), is also characterized by periods of more frequent, short-term human occupation. In contrast, it seems that the MSA phase in Blombos that contains less varied and more uniform material culture (i.e., the M3 CI) is associated with more long-term modes of occupation, closely related to intensive marine resource exploitation. Thus, it appears that the increased cultural complexity that arose during the Still Bay phase may be linked to higher residential inland mobility.
An increase in human mobility at the end of MIS 5 could have led to an increase in population interaction, which in turn could impact cultural transmission rates, skill level, and material complexity (Grove, Reference Grove2016). In the context of the MSA in coastal southern Africa, it is possible that an increase in hunter-gatherer mobility could have stimulated the production of material culture that would have increased intergroup cohesion and intragroup communication. The production of personal ornaments, abstract engravings, and the gradual standardization of bifacial points that we observe during the M1 phase in Blombos Cave may thus be indicative of increased cultural complexity due to increased population contact or to greater task specialization in the context of increased social complexity (Vaesen et al., Reference Vaesen, Collard, Cosgrove and Roebroeks2016). The reality of past settlement systems can, however, be much more complex than this (cf. Frahm et al., Reference Frahm, Kandel and Gasparyan2019). It is also likely that the coastal settlement dynamics observed in the M3 phase of Blombos Cave continued to function, even during the Still Bay phase, but at locations closer to the new shorelines that gradually became available as the sea level dropped. Most of these sites would have been located on the Palaeo-Agulhas Plain; an area that today is underwater (Cawthra et al., Reference Cawthra, Jacobs, Compton, Fisher, Karkanas and Marean2018).
A final point to stress is that while the observed changes in site use and settlement dynamics at Blombos Cave may have occurred without significant fluctuations in demography (Vaesen et al., Reference Vaesen, Collard, Cosgrove and Roebroeks2016), climate (Jacobs et al., Reference Jacobs, Roberts, Galbraith, Deacon, Grün, Mackay, Mitchell, Vogelsang and Wadley2008; Roberts et al., Reference Roberts, Henshilwood, van Niekerk, Keene, Gledhill, Reynard, Badenhorst and Lee-Thorp2016), or paleogeography (Marean et al., Reference Marean, Cowling and Franklin2020), we would reason that it is more likely that all these factors played important roles in determining local resource availability during the MSA, and thus hunter-gatherer settlement strategies, residential mobility, and ecological niche exploitation (McCall and Thomas, Reference McCall and Thomas2012; d'Errico et al., Reference d'Errico, Banks, Warren, Sgubin, van Niekerk, Henshilwood, Daniau and Sánchez Goñi2017). To robustly address these complex prehistoric human–nature relationships, we would argue, based on the results presented in this paper, that future research at Blombos Cave and other archaeological sites, should adopt interdisciplinary and microcontextual research designs that can capture short-lived human campsite behavior at a higher analytical resolution than has hitherto been the convention.
CONCLUSION
In this paper, we have combined archaeological data, micromorphology, microspectroscopy, and faunal taphonomy with 3D, high-resolution field documentation to track patterns of site use and occupational intensity in three discrete and laterally continuous occupation phases of Blombos Cave: the M3 CI phase (ca. 88 Ka), the Upper M2 phase (ca. 77 ka), and the M1 phase (ca. 72 ka). By adopting and developing an archaeological microfacies approach, we have systematically classified the deposits in terms of their depositional agent, source, and behavioral significance. Through a digital spatial framework, we have also examined the lateral distribution of these depositional processes and activities across the site and diachronically through the MSA sequence. This allowed us to characterize lateral and diachronic variation in the domestic use of the cave, the formation and spatial configuration of hunter-gatherer site structure, the occurrence and practice of site maintenance, and the presence and absence of human occupation.
Considering our results, we suggest that people during the earliest MSA phases investigated here (M3 CI) occupied Blombos Cave for longer periods, but less frequently. This occupation pattern is markedly different from what we see in the later MSA phases (e.g., Upper M2 and M1), during which hunter-gatherer groups appear to have visited and revisited the cave more regularly, both for longer and shorter periods, respectively. We suggest that the variation of MSA occupation intensity at Blombos Cave, which coincides with shifts in local climate, vegetation, and sea levels, can best be explained by changes in local site function and hunter-gatherer mobility and subsistence strategies. We also propose that the MSA site-use patterns observed locally in Blombos Cave may be indicative of larger shifts in the regional settlement patterns in the southern Cape during MIS 5b-4 (ca. 88–72 ka).
To more accurately address large-scale regional settlement patterns, however, and to more robustly assess whether the three investigated occupation phases at Blombos Cave truly are representative of more regional changes in late Pleistocene settlement dynamics on the southern Cape coast, the settlement models discussed in this study need to be tested and investigated further, for example, by extending the methods and the interpretative framework, we have put forward in this paper to other coastal MSA sites in South Africa.
ACKNOWLEDGEMENTS
We thank Paul Goldberg and Arnaud Lenoble for providing access to their micromorphological samples and thin sections, as well as Panagiotis Kritikakis (Senckenberg Centre for Human Evolution and Palaeoenvironment (HEP), Tübingen, Germany), for producing the new thin sections for this study. Financial support for the analysis and processing of block samples was provided to MMH by the Meltzer Research Fund, the Travel Fund for Doctoral Fellows at the Department of Archaeology, History, Cultural Studies and Religion. The micromorphological block sample was collected during fieldwork at Blombos Cave 2013 under the direction of CSH, who was funded by a South African National Research Foundation Research Chair (SARChI) at the University of the Witwatersrand, South Africa, and a European Research Council Advanced Grant (TRACSYMBOLS number 249587). MMH, OFU, KLvN, and CSH are now funded by the Research Council of Norway through its Centres of Excellence funding scheme, Centre for Early Sapiens Behaviour (SapienCE), project no. 262618. The micro-FTIR applied in this study was funded by a grant from the Deutsche Forschungsgemeinschaft (MI 1748/1-1) to CEM, professor at the Institut für Naturwissenschaftliche Archäologie, University of Tübingen, Germany. JPR is funded by a South African National Research Foundation (NRF) Thuthuka Grant (grant number 107082) and an Enabling Grant from the University of the Witwatersrand. Britt Starkovich, Emmanuel Discamps, and Michael Storozum gave valuable advice and feedback on earlier versions of this article.
SUPPLEMENTARY MATERIAL
The supplementary material for this article can be found at https://doi.org/10.1017/qua.2020.75


 Open access