


The study of the relationship between diet and health outcomes is a central issue in nutritional epidemiology research. Traditionally, these studies have focused on specific foods and nutrients and, although they have brought important contributions, these studies present the limitation of not considering diet complexity(Reference Hu1). In real life, people eat meals with a variety of foods and nutrients that may be interactive or synergistic(Reference Mozaffarian, Rosenberg and Uauy2,Reference Schulz, Oluwagbemigun and Nothlings3) . In this context, dietary patterns (DP) analysis has emerged as a complementary method(Reference Mozaffarian, Rosenberg and Uauy2), where food consumption is characterised in a holistic way and may better inform the comprehensive effect of diet on health outcomes(Reference Hu1,Reference Newby and Tucker4) .
DP studies have been conducted using three different approaches: a priori methods, such as indexes and scores, which use prior scientific knowledge on diet–disease associations, a posteriori methods that are entirely based on dietary data within a certain study population and hybrid methods, which combine both data on food intake in a population and pre-existing knowledge on diet–disease relationships(Reference Jannasch, Riordan and Andersen5,Reference Krebs-Smith, Subar and Reedy6) . The last two approaches are considered data-driven methods, because they entirely depend on the data at hand and identify population-specific DP.
Regarding data-driven methods, a range of statistical analyses can be applied to identify DP in a population. Factor analysis (FA) is the most widely applied technique(Reference Newby and Tucker4), which evaluates the correlation matrix of food consumption data and identifies the latent factors that most explain the original data variance(Reference Reedy, Wirfalt and Flood7). FA requires some subjective decisions throughout the analytical process, and interpretation of the final factors can be complicated because they are a linear combination of all original dietary data(Reference Schoenaker, Dobson and Soedamah-Muthu8). To address this limitation, a new statistical method, called treelet transform (TT), was proposed by Gorst-Rasmussen(Reference Gorst-Rasmussen, Dahm and Dethlefsen9).
TT has been recently applied in nutritional epidemiology to identify DP as a method that combines the strengths of factor and hierarchical cluster analyses(Reference Gorst-Rasmussen, Dahm and Dethlefsen9,Reference Gorst-Rasmussen10) . Similar to FA, TT is also based on the correlation matrix of food items; however, the constructs identified are composed of a small number of food items, adding sparsity, and substantive meaning and interpretation to the DP(Reference Gorst-Rasmussen, Dahm and Dethlefsen9,Reference Gorst-Rasmussen10) . To date, very few studies have applied this method to study DP(Reference Schulz, Oluwagbemigun and Nothlings3,Reference Schoenaker, Dobson and Soedamah-Muthu8,Reference Gorst-Rasmussen, Dahm and Dethlefsen9,Reference Frederiksen, Themsen and Overvad11,Reference Oluwagbemigun, Foerster and Watkins12) .
The main hybrid approach applied in nutritional epidemiology is reduced rank regression (RRR). This analysis aims to directly relate the data-driven steps of pattern identification to an outcome of interest by identifying linear functions of food groups that can explain as much variation as possible of a set of outcome related variables (intermediate variables). These intermediate variables must be related to an outcome of interest, and it may be nutrients or biomarkers, both commonly applied in these studies(Reference Weikert and Schulze13,Reference Hoffmann, Schulze and Schienkiewitz14) .
As is well known, data-driven approaches differ substantially depending on the country, culture or ethnicity of different study populations(Reference Lin, Bermudez and Tucker15–Reference Carioca, Gorgulho and Teixeira17). However, little is known about how these different methods behave when applied to the same population. Considering that the data-driven approach is applied to capture diet complexity, can different methods describe the population’s diet complexity similarly? Thus, the aim of this study was to compare these three different statistical methods to identify DP in the Longitudinal Study of Adult Health (ELSA-Brasil) population and evaluate their similarities and differences in describing population-specific DP.
Methods
Study participants
ELSA-Brasil is an ongoing cohort study that recruited 15 105 active and retired civil servants, aged 35–74 years, from five universities and one research institute located in three Brazilian macro-regions (southeast, northeast and south). Baseline examinations were performed in 2008–2010. Detailed information regarding the study sample and design has been described previously(Reference Aquino, Barreto and Bensenor18). This study was conducted according to the guidelines laid down in the Declaration of Helsinki, and all procedures involving human subjects were approved by the all institutional review boards involved (Fundação Oswaldo Cruz, Universidade Federal da Bahia, Universidade Federal do Espírito Santo, Universidade Federal de Minas Gerais, Universidade Federal do Rio Grande do Sul and Universidade de São Paulo). Written informed consent was obtained from all subjects.
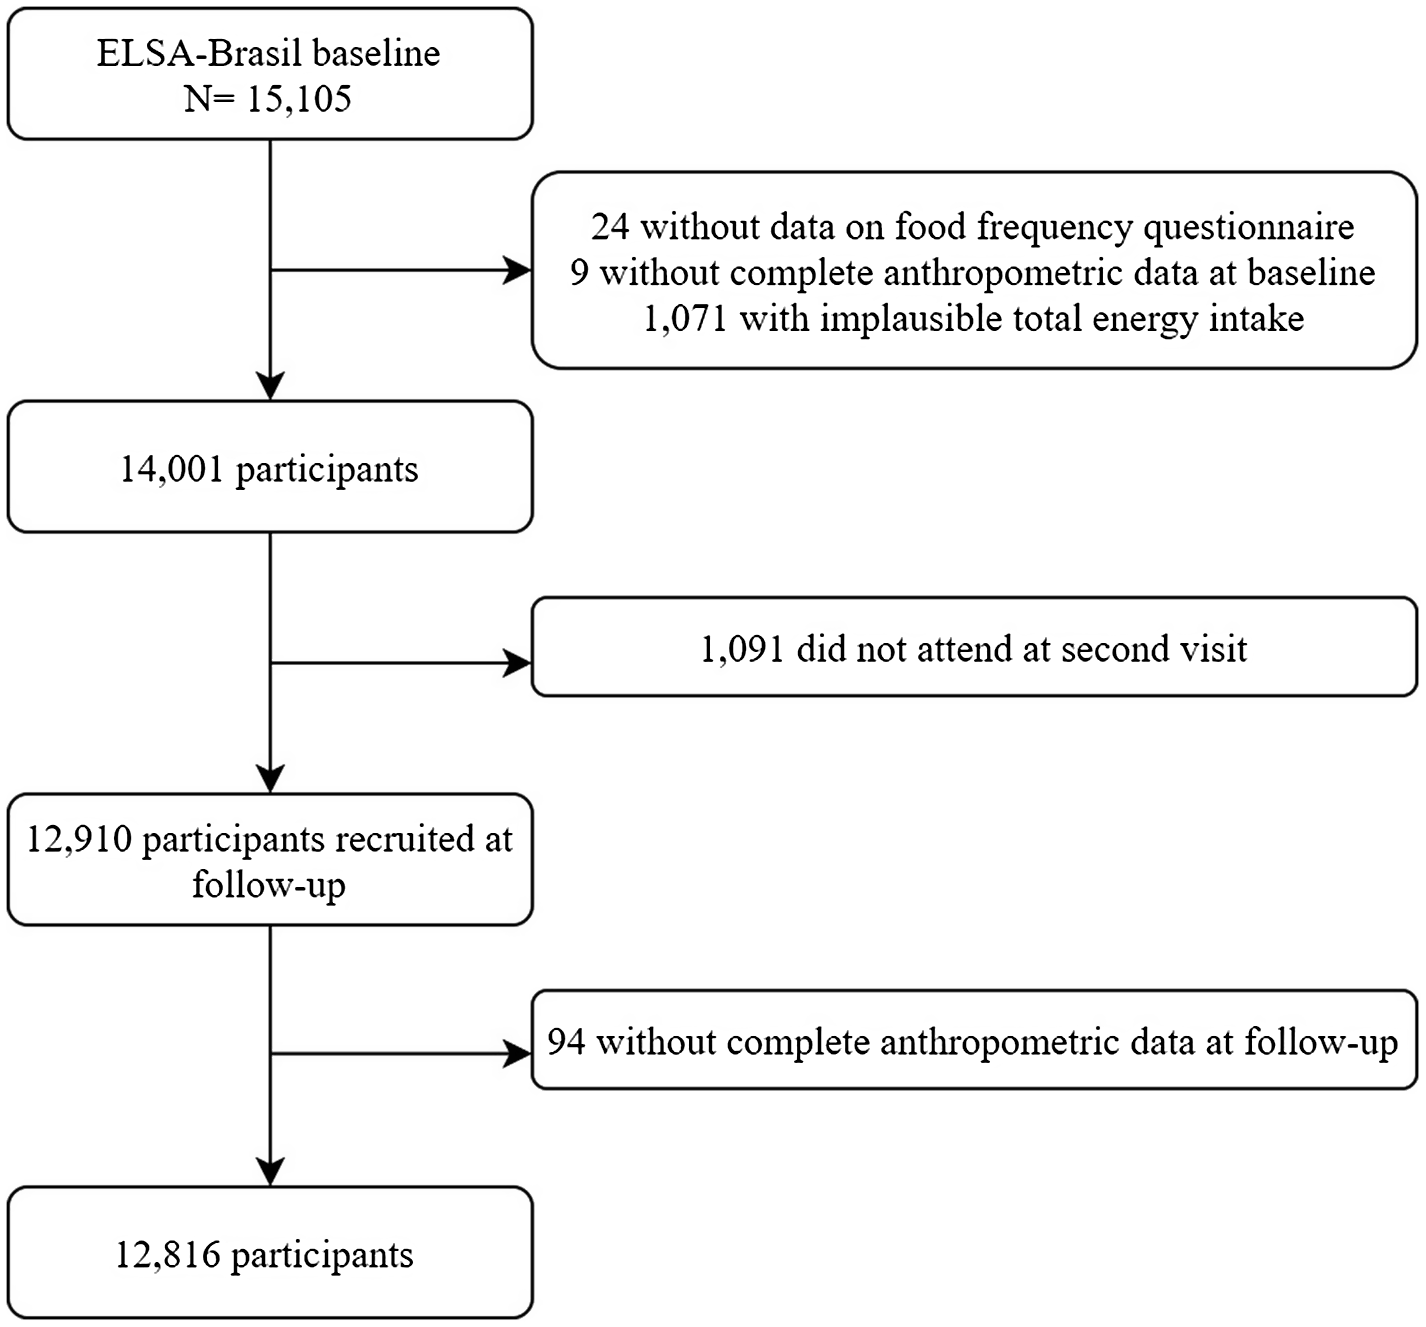
For this study, only participants who had complete dietary data and complete anthropometric measurements at baseline and follow-up were considered. Individuals with misreported energy intake were excluded. Misreporting of energy intake was defined following the procedures proposed by McCroy et al.(Reference McCrory, McCrory and Hajduk19), where the agreement between the reported energy intake and predicted total energy expenditure was evaluated for each individual considering age, weight, height and sex. To calculate predicted total energy expenditure, the equation proposed by Vinken et al.(Reference Vinken, Bathalon and Sawaya20) was applied. This validated equation was developed based on data from free-living individuals aged 18–81 years evaluated by the double-labelled water method. The cut-off point was defined as the ±2 sd of the agreement between the reported energy intake and predicted total energy expenditure based on the proposal of Black et al.(Reference Black21). This cut-off point takes into account the within-person coefficient of variation (CV) of energy intake (23 %), the CV of the technical measurement error of the double-labelled water plus the biological variation in total energy expenditure (8·2 %) and the CV of the prediction error of the total energy expenditure by Vinken’s equation (17·7 %). In this sample, the ±2 sd was ±60 %; therefore, individuals were classified as under-reporters if they presented an energy intake agreement of less than 40% (n 137; 52·6% BMI < 30 kg/m2; 50·4 % male) and over-reporters if they presented an energy intake agreement greater than 160 % (n 934; 88·65 % BMI < 30 kg/m2; 43·0 % male). The final sample comprised 12 816 participants (Fig. 1).
Flow chart of final sample size in analysis. ELSA-Brasil, 2021.
Dietary data
Dietary data were assessed at baseline using a validated food frequency questionnaire (FFQ) composed of 114 food items. The FFQ was validated in relation to the nutrient intake of three food records. The intraclass correlation coefficient ranged from 0·22 to 0·72 for Se and Ca, respectively(Reference Benseñor, Velasquez-Melendez and Drehmer22). The FFQ was applied by trained interviewers to evaluate the participant’s diet in the last 12 months regarding three sections: (1) food products/food preparations; (2) measures of consumed products and (3) consumption frequencies with eight response options including ‘more than 3 times a day’, ‘2 to 3 times a day’, ‘once a day’, ‘5 to 6 times a week’, ‘2 to 4 times a week’, ‘once a week’, ‘1 to 3 times a month’ and ‘never/rarely’(Reference Benseñor, Velasquez-Melendez and Drehmer22,Reference Molina, Bensenor and Cardoso23) .
The food items in the FFQ were classified into twenty-five food groups: rice, cereals, bread, fruits, vegetables, beans, milk, nuts, sweets and desserts, tubers, pasta, snacks, eggs, cheese, butter/margarine, red meat, poultry, processed meat, fish, soft drinks, juice, coffee, beer, wine and distilled beverages (online Supplementary Table S1). The food group classification was based on the similarity of nutrient profiles and eating occasion.
Dietary patterns
DP at baseline were identified using three statistical methods: FA, TT and RRR. All of these three dimension-reduction methods are comparable in identifying a population’s DP because they work by aggregating food groups based on a correlation matrix; however, they present different aims, assumptions and decisions to take into account. The consumption in grams of the twenty-five food groups was the input variables for all three methods.
Factor analysis
FA is a widely applied method in nutritional epidemiology studies for identifying DP. This dimension-reduction method aims to explain as much variance as possible of the original data through latent variables (factors) that reveal the intrinsic structure of the data(Reference Hu1). Principal component FA was applied in this study. Kaiser–Meyer–Olkin and Bartlett’s tests were performed to verify whether our data were suitable for FA. The identified factors were orthogonally rotated using the varimax procedure to achieve a simpler structure with greater interpretability. The criteria used to retain the factors were eigenvalues > 1, identification of a breakpoint in the scree plot and interpretability. Food groups with factor loadings ≥ 0·30 or ≤ –0·30 were considered relevant and characteristic of the DP, and factors were labelled according to these food groups.
Treelet transform
A TT analysis was conducted as proposed by Gorst-Rasmussen(Reference Gorst-Rasmussen, Dahm and Dethlefsen9,Reference Gorst-Rasmussen10) . TT combines the statistical principles of cluster and principal component analysis, leading to sparsity in factor loadings by creating components with food groups that present factor loadings exactly zero. This procedure results in fewer food items included in each factor when compared with FA, thereby facilitating the researcher’s interpretation of each DP. The treelets are constructed as follows: between all of the original variables, the algorithm identifies the two variables with the largest correlation and then performs a principal component analysis on them. These two variables are replaced by a sum factor, and this procedure is repeated until all original variables have joined the hierarchical cluster tree. To select the treelets that provide greater variance, 10-fold cross-validation was applied to find the optimal cut level of the cluster tree, as proposed by Lee et al.(Reference Lee, Nadler and Wasserman24). To assess the sensitivity of the selected cut level, TT analysis was repeated at ± 3 levels of the optimal level. To verify the stability of the identified treelets, the ttstab procedure was performed through 100 bootstrap replications in sub-samples of 80 % of the original data(Reference Gorst-Rasmussen10).
Reduced rank regression
RRR analysis combines a data-driven approach with prior knowledge related to an outcome. In this model, the food groups are entered as predictor variables. A crucial step of this method is the selection of intermediate variables that are known to be related to the outcome of interest(Reference Weikert and Schulze13,Reference Hoffmann, Schulze and Schienkiewitz14) . Unlike FA, RRR aims to explain as much variance as possible of these chosen intermediate variables. In this study, we built a priori knowledge based on obesity as an outcome of interest, selecting as intermediate variables the following nutrients or derived from nutrients variables: energy density (kcal/100 g), fibre density (g/1000 kcal) and total fat (g/d) adjusted for total energy intake using the residual method(Reference Willett, Howe and Kushi25). These intermediate variables were chosen based on the WHO report, which brings the evidence that energy density, fibre density and fat intake are linked with obesity risk(26) and previous published studies that have used these intermediate variables when assessing DP related to obesity(Reference Livingstone, Sexton-Dhamu and Pendergast27–Reference Livingstone and McNaughton29). In RRR analyses, food groups with factor loadings ≥ 0·20 or ≤ –0·20 were considered relevant and characteristic of the DP. In RRR analysis, the number of intermediate variables is a condition for the number of derived DP, and the interpretability was the criterion applied to retain the DP.
A DP score was calculated for all DP identified for each method. This variable indicates the individual-level weights associated with each DP and theoretically represents the adherence to a DP.
Statistical analyses
To enable the comparison between individuals’ characteristics according to the level of adherence to each DP of the three methods, the individual’s DP scores were classified into tertiles. Socio-demographic characteristics and nutritional profile of the individuals classified in the third tertile were described as means or proportions. To evaluate the agreement of individuals’ classification on tertiles in similar DP of different methods, we performed a cross-classification analysis, and Pearson’s correlation coefficients between DP scores were also obtained.
Statistical analyses were performed using Stata® (Statistical Software for Professionals) version 14.2(30), and only the RRR analyses were performed using SAS® Studio version 3.8 (SAS Institute Inc.).
Results
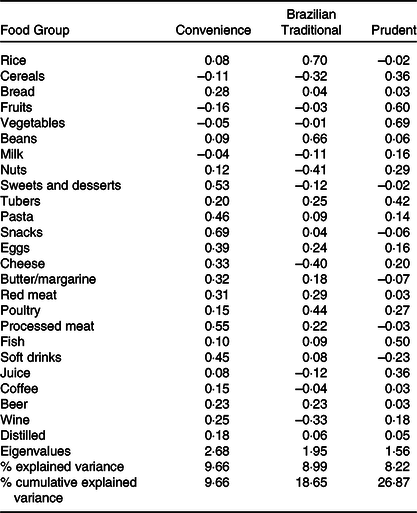
Three DP were identified in the FA (Table 1). The first DP, labelled as convenience, was highly positively loaded with the food groups sweets and desserts, pasta, snacks, eggs, cheese, butter/margarine, red meat, processed meat and soft drinks. The second DP, labelled as Brazilian traditional, was highly positively loaded with rice, beans and poultry and was highly negatively loaded with cereals, nuts, cheese and wine. The third DP, labelled as prudent, was highly positively loaded with cereals, fruits, vegetables, tubers, fish and juice. All three FA-derived DP explained 26·9 % of the variance in the original dietary data. The results for the Kaiser–Meyer–Olkin and Bartlett’s tests were 0·73 and P < 0·001, respectively, indicating that the sample was suitable for FA.
Food groups’ factor loadings, eigenvalues and explained variance among dietary patterns
(retaining three factors)
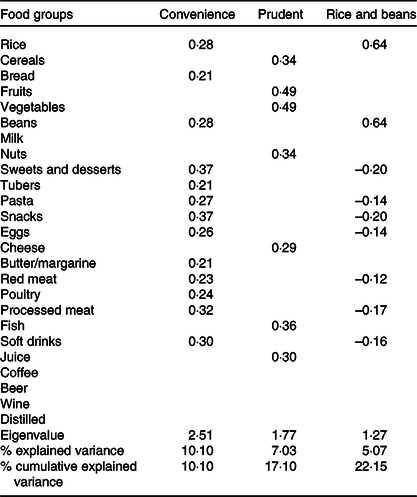
The 10-fold cross-validation performed in the TT analysis indicated that 19 was the optimal cut level of cluster three. Repeated analysis at ± 3 levels resulted in DP with similar characteristics. The same was observed using the ttstab procedure, in which the DP obtained for sub-samples were similar to the total sample, indicating good stability in the TT analysis. The first TT-derived DP, labelled as convenience, was positively loaded with rice, bread, beans, sweets and desserts, tubers, pasta, snacks, eggs, butter/margarine, red meat, poultry, processed meat and soft drinks. The second DP, labelled as prudent, was positively loaded with cereals, fruits, vegetables, nuts, cheese, fish and juice. The third DP, labelled as rice and beans, was positively loaded with rice and beans and negatively loaded with sweets and desserts, pasta, snacks, eggs, red meat, processed meat and soft drinks. These three TT-derived DP explained 22·2 % of the variance in the original dietary data (Table 2).
Food groups’ loadings, eigenvalues and explained variance among dietary patterns derived by Treelet transform
RRR analysis derived three DP (online Supplementary Table S2) and according to interpretability, only the first DP was retained. The RRR-derived DP, labelled as convenience, was positively loaded with sweets and desserts, snacks, butter/margarine, red meat, processed meat and soft drinks and was negatively loaded with fruits, vegetables and beans. This DP explained 5·8 % of the variance in the original dietary data and 48·7 % of the variance in the intermediate variables (Table 3).
Food groups’ factor loadings, eigenvalues and explained variance among dietary patterns through reduced rank regression
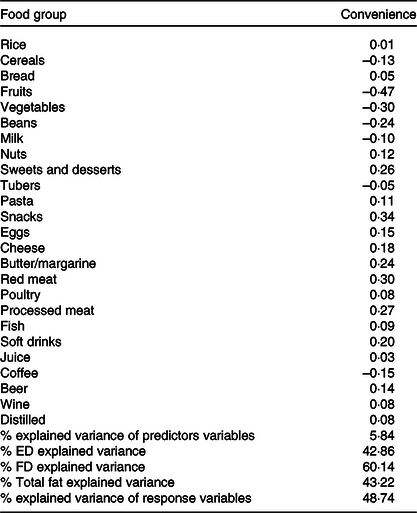
ED, energy density; FD, fibre density.
The characteristics of the total population and individuals classified in the third tertile of each DP are presented in Table 4. Most of the individuals with high adherence to the convenience DP of the three methods were younger, mostly men and smokers when compared with the total population. These individuals presented the highest mean for energy density and percentage of kilocalories from total fat and saturated fat, while presenting the lower mean of fibre density. Individuals classified in the third tertile of the prudent DP of the FA and TT methods were slightly older, most of them were females and non-smokers and presented a lower mean for energy density. Most of the individuals classified in the third tertile of the traditional Brazilian and rice and beans DP were men and non-white individuals when compared with the total population. These individuals had the lowest consumption of kilocalories from animal protein and saturated fat. High adherence to the traditional Brazilian DP was characterised by the largest percentage of smokers, and individuals with the highest adherence to rice and beans DP had the largest mean for fibre density and percentage of kilocalories from carbohydrates. The food groups’ mean consumption of the individuals classified on the third tertile of each DP is presented in online Supplementary Table S3.
Baseline characteristic and nutritional profile of total population and of individuals classified on the third tertile of each dietary pattern
(mean values and standard deviations; numbers and percentages)
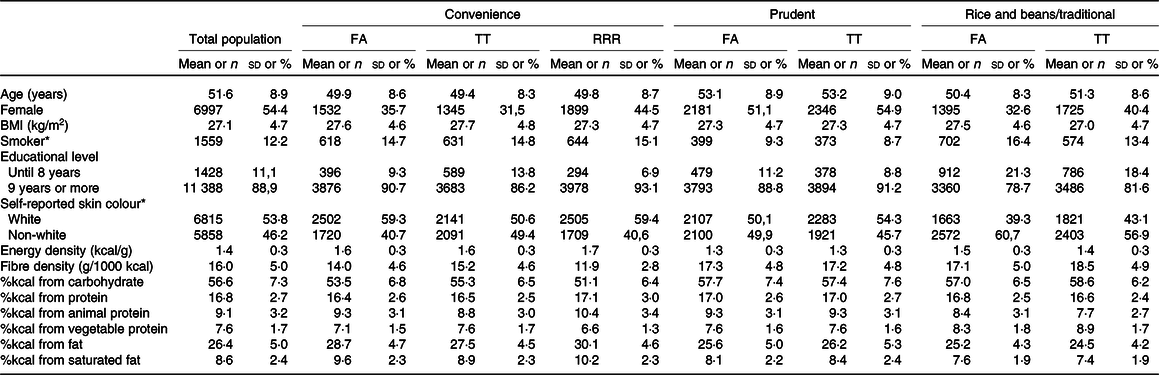
FA, factor analysis; TT, treelet transform; RRR, reduced rank regression.
* Variable with missing data.
The agreement of individuals’ classification in a similar DP of the three different methods is presented in Table 5. The prudent DP from FA and TT presented the highest level of agreement and the opposite was observed between the convenience DP from TT and RRR, with the lowest level of agreement. Pearson’s correlation coefficients for convenience DP scores from FA and TT, FA and RRR, and TT and RRR were r 0·83; P < 0·001, r 0·63; P < 0·001 and r 0·39; P < 0·001, respectively. The correlation between the prudent DP scores from FA and TT was r 0·90; P < 0·001, and the traditional Brazilian and rice beans DP scores had a correlation coefficient of r 0·66, P < 0·001.
Cross-classification of individuals’ adherence to dietary patterns, according to each statistical method
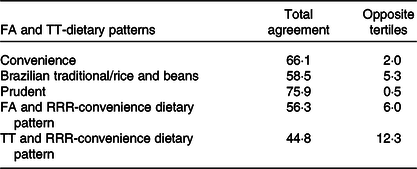
FA, factor analysis; TT, treelet transform; RRR, reduced rank regression.
Discussion
None of the three different statistical methods identified an identical DP; however, a similar convenience DP was observed in the three methods as the first one, for example, the one that most explained the variance in the original data. The convenience DP shared the food groups sweets and desserts, snacks, butter and margarine, red meat, processed meat and soft drinks. The FA and TT identified a prudent DP with cereals, fruits, vegetables, fish and fruit juice as common food groups, and a traditional Brazilian (FA) and rice and beans (TT) DP highly loaded for the food groups’ rice and beans. Even though there were differences in food groups and factor loadings within the identified DP, reflecting the particularities of each method, we could see that, independent of the method applied, these analyses were able to capture the population’s diet in a similar way.
There are some peculiarities worthy of highlighting. The RRR-convenience DP was not only related to the higher consumption of unhealthy food groups but was also related to the lower consumption of the food groups fruits, vegetables and beans – representing the opposite of prudent and traditional Brazilian/rice and beans DP identified by the other two methods. Similarly, the TT-convenience DP presented low but positive loadings for the food groups rice and beans, indicating the influence of traditional Brazilian foods on this DP. These particularities may explain the slight differences in the fibre density and the percentage of kilocalories from carbohydrate, protein, total fat and saturated fat observed in the individuals classified in the third tertile of the convenience DP from TT and RRR analyses.
Other studies have applied DP analysis to the ELSA-Brasil dataset or subsets with diverse aims. Bezerra et al.(Reference Bezerra, Bahamonde and Marchioni31) applied latent class analysis and identified DP labelled as prudent and processed, which shared similar characteristics with the prudent and convenience DP identified in our study, respectively. Gorgulho et al.(Reference Gorgulho, Alves and Teixeira32) applied FA in a subset of ELSA-Brasil (only participants from São Paulo) and also found a convenience DP, as the one that most explained the original data variance, which shared the same food groups in the convenience DP of our study. They also found DP labelled plant-based and dairy products that were highly loaded for similar food groups (fruits, vegetables and cereals) of our prudent DP identified by factor and TT analyses. The main difference was that we observed that the food group fish was highly loaded in our prudent DP, which could reflect some regional characteristics of the total Brazilian population.
A Brazilian traditional DP sharing the characteristics with the Brazilian traditional (FA) and rice and beans (TT) DP was also observed in four studies conducted with the ELSA-Brasil population(Reference Gorgulho, Alves and Teixeira32–Reference Drehmer, Odegaard and Schmidt35) that included a range of four different statistical analyses (principal component analysis, FA, cluster analysis and multiple correspondence analysis). A DP highly loaded with the food groups rice and beans is commonly identified in studies regarding all ages and sex of the Brazilian population(Reference Cunha, de Almeida and Sichieri36–Reference Cezimbra, Assis and de Oliveira38).
As expected, the RRR analysis explained a smaller proportion of original dietary data variance (5·8 %) than FA and TT, since RRR focuses on identifying DP that most explain the variation of the intermediate variables. Despite this methodological difference, RRR analysis was able to identify not only a DP related to energy density, fibre density and total fat but also a DP that is in fact present in the population, as a similar convenience DP was identified through FA and TT. This result was also observed by Batis et al. and Cunha et al. when comparing RRR with principal component analysis and FA, respectively(Reference Batis, Mendez and Gordon-Larsen39,Reference Cunha, Almeida and Pereira40) . The food group differences observed between the RRR-convenience DP and convenience DP of other methods may be relevant and bring new insights to understand the associations between this DP and health outcomes in further studies.
FA explained a higher proportion of original dietary data variance when compared with TT (26·9 and 22·2 %, respectively). TT only loads the most expressive food groups for a DP, and those that are not relevant receive a loading equal to zero, leading to a lower number of food groups contributing to a DP. This sparsity created by TT is considered as an advantage over FA, which produces a complex factor loading matrix making the interpretation of DP more susceptible to researcher assumptions. Also, because of the sparsity of TT analysis, a trade-off between the explained variance of the DP and the interpretability is inevitable(Reference Schulz, Oluwagbemigun and Nothlings3). Schoenaker et al.(Reference Schoenaker, Dobson and Soedamah-Muthu8) introduced a relevant issue for TT analysis: whether it is able to capture the overall diet, as only specific food items are taken into account to predict the DP score at the individual level, some of the synergic aspects of food may be lost in this process and need to be considered when applying this approach. It is important to mention that in both methods, the overall proportion of the variance explained the DP is not large, which means that only a limited portion of the diet variance is considered when investigating DP(Reference Martinez, Marshall and Sechrest41).
Several studies have compared DP identified by RRR with other statistical methods and how they are associated with different health outcomes(Reference Batis, Mendez and Gordon-Larsen42–Reference Shakya, Melaku and Page47). The findings presented in these studies did not allow us to affirm whether some of these methods are superior in estimating the association with a specific outcome. While some studies suggested that RRR analysis provided better results when investigating the association between DP and the metabolic syndrome in adults(Reference Kurniawan, Hsu and Lee43), obesity in preschool children(Reference Manios, Kourlaba and Grammatikaki45) and bone mass in an elderly population(Reference Melaku, Gill and Taylor46), other studies found similar and consistent results independent of the method applied(Reference Batis, Mendez and Gordon-Larsen39,Reference Barbaresko, Siegert and Koch44,Reference Shakya, Melaku and Page47) . Considering the particularities of the RRR analysis, this may be a promising method when the study goal is exploring the combination of foods that are mediated by specific variables (intermediate variables), also adding the possibility of using metabolome and/or microbiome information(Reference Schulz, Oluwagbemigun and Nothlings3).
The same controversial results were found when comparing DP from FA and TT analysis and their association with health outcomes. Schoenaker et al. compared DP derived both from TT and FA and, even though they have found similar DP, only those identified by FA were associated with incident diabetes in a middle-aged women’s population(Reference Schoenaker, Dobson and Soedamah-Muthu8). Whereas Gorst-Rasmussen et al. obtained similar results in estimating the relative risk of myocardial infraction with DP identified by TT or FA in a Danish cohort study(Reference Gorst-Rasmussen, Dahm and Dethlefsen9). Since there is not robust evidence of a superior DP method to predict the relationship between diet and health outcomes, the researchers need to keep in mind the research question of their study and then select which method is more appropriate. Also, comparisons between different methods in the same study can bring new insights and complementary results to better understand each statistical method(Reference Zhao, Li and Gao48).
Our study had some limitations. First, all three statistical techniques applied to identify the DP require arbitrary decisions and subjective interpretations. In these data-driven approaches, the researcher defines food grouping and the label of each DP. Specifically in FA and RRR, the researcher defines the number of factors to retain and the cut-off points that define which food groups are relevant to the DP. Second, the dietary consumption data were assessed using a FFQ, a self-reported method that has some inherent bias, such as memory or social desirability. Also, in the FFQ the food items are pre-grouped, which made it not possible to have more distinctive food groups (e.g. unhealthy v. healthy foods groups) and it may have an impact on DP meaningfulness. The strengths of this study are the use of a validated FFQ, the large sample size and the application of the TT analysis, a novel method in nutritional epidemiology to identify populations’ DP.
In conclusion, our results showed that three different statistical methods were able to capture the populations’ DP in a similar way while highlighting the importance of the particularities of each method. The different aims and procedures of each method may play a relevant role in identifying associations between DP and health outcomes, and comparing these results can bring new perspectives to understand this relationship.
Acknowledgements
The ELSA-Brasil study was supported by the Brazilian Ministry of Health, the Brazilian Ministry of Science and Technology and the Brazilian National Council for Scientific and Technological Development-CNPq. The research centre of São Paulo was also supported by the São Paulo Research Foundation (FAPESP) (grant number 2011/12256-4). The Graduate Program of Public Health Nutrition is supported by the Coordination of Superior Level Staff Improvement (CAPES). M. A. A. received a scholarship from the São Paulo Research Foundation (FAPESP) (grant number 2019/13486-5). The funding agencies that supported the study had no role in the design, analysis or writing of this article.
M. A. A. and D. M. L. M. were responsible for the study concept. D. M. L. M. was also responsible for the supervision of all stages of this study. M. A. A. conducted the data analysis, interpreted the results, wrote the manuscript and had primary responsibility for final content. M. C. B. M., M. J. M. F., P. A. L. and I. M. B. contributed to critical review of the manuscript. All authors have read and approved the final manuscript.
The authors declare no conflict of interest.
Supplementary material
For supplementary materials referred to in this article, please visit https://doi.org/10.1017/S0007114522000253


