


INTRODUCTION
Partisan polarization increasingly shapes not only who wins elections, but also the rules under which elections are conducted. In a federal system that grants states wide discretion over election procedures, this shift raises a central question for democratic legitimacy: how does growing polarization in election rules affect voters’ confidence in election outcomes? Political scientists have devoted considerable attention to polarization and sorting (Fiorina and Abrams Reference Fiorina and Abrams2008; Hill and Tausanovitch Reference Hill and Tausanovitch2015; Levendusky Reference Levendusky2009; Poole and Rosenthal Reference Poole and Rosenthal1997; Rodden et al. Reference Rodden, McCarty, Shor, Tausanovitch and Warshaw2015; Shor and McCarty Reference Shor and McCarty2011), yet the downstream consequences of these dynamics for electoral confidence remain an open question.
While a romanticized view of federalism emphasizes policy learning and diffusion across states (Nicholson-Crotty Reference Nicholson-Crotty2009; Pacheco Reference Pacheco2012; Volden Reference Volden2006), the nationalization of politics increasingly incentivizes states to prioritize partisan alignment over performance (Bentele and O’Brien Reference Bentele and O’Brien2013; Caron Reference Caron2022; Grumbach Reference Grumbach2018; Hopkins, Schickler, and Azizi Reference Hopkins, Schickler and Azizi2022). Nowhere is this tension more consequential than in the design of election laws.
State election procedures shape incentives and behavior throughout the political system (Ashworth and Bueno de Mesquita Reference Ashworth and de Mesquita2014; Keyssar Reference Keyssar2009). Following the contested 2000 election, debates over voting rules have become increasingly politicized, reflecting partisan disagreements over how to balance access and security (Hasen Reference Hasen2012). Consistent with this shift, prior work documents growing divergence in how Democrat-led and Republican-led states administer elections (Pomante, Schraufnagel, and Li Reference Pomante, Schraufnagel and Li2023). This politicization has generated extensive debate over how election procedures affect voters and candidates (Berinsky, Burns, and Traugott Reference Berinsky, Burns and Traugott2001; Burden et al. Reference Burden, Canon, Mayer and Moynihan2014; Campos, Harden, and Bussing Reference Campos, Harden and Bussing2024; Cantoni and Pons Reference Cantoni and Pons2021; Citrin, Green, and Levy Reference Citrin, Green and Levy2014; Fraga and Miller Reference Fraga and Miller2022; Gerber, Huber, and Hill Reference Gerber, Huber and Hill2013; Grimmer and Hersh Reference Grimmer and Hersh2024; Gronke, Galanes-Rosenbaum, and Miller Reference Gronke, Galanes-Rosenbaum and Miller2007; Hanmer Reference Hanmer2009; Kousser and Mullin Reference Kousser and Mullin2007). Yet it remains unclear how voters’ confidence in the accuracy of election outcomes—and, by extension, the legitimacy of electoral winners—depends on the procedures under which elections are conducted.
Existing research shows that voter confidence depends on personal voting experiences (Atkeson and Saunders Reference Atkeson and Saunders2007) and, most powerfully, on whether one’s preferred candidate wins (Alvarez, Hall, and Llewellyn Reference Alvarez, Hall and Llewellyn2008; Anderson and LoTempio Reference Anderson and LoTempio2002; Craig et al. Reference Craig, Martinez, Gainous and Kane2006; Levy Reference Levy2021; Sances Reference Sances2023; Sances and Stewart Reference Sances and Stewart2015; Sinclair, Smith, and Tucker Reference Sinclair, Smith and Tucker2018; Stewart Reference Stewart2022). Beyond the Electoral College (Carey et al. Reference Carey, Helmke, Nyhan, Sanders, Stokes and Yamaya2022), however, we know little about how other election procedures shape confidence. Understanding how voters’ agreement with election rules influences electoral confidence is essential for assessing democratic stability—not only because confidence facilitates the peaceful transfer of power (Anderson and Guillory Reference Anderson and Guillory1997; Anderson et al. Reference Anderson, Blais, Bowler, Donovan and Listhaug2005; Carey et al. Reference Carey, Helmke, Nyhan, Sanders and Stokes2019; Layman, Lee, and Wolbrecht Reference Layman, Lee and Wolbrecht2024; Norris Reference Norris2014), but also because confidence grounded in procedural support may be more resilient than confidence rooted in zero-sum electoral outcomes (but see Graham and Svolik Reference Graham and Svolik2020).
Using new and existing data, I show that changes in state election procedures have contributed to growing partisan divergence in procedural agreement, and that this divergence is in turn associated with voters’ confidence in the accuracy of their state’s vote count. Between 1996 and 2024, the correlation between election procedures and state partisanship rises from near zero to nearly 0.7, leaving partisans increasingly likely to agree with procedures adopted in co-partisan-controlled states and to oppose those used by the opposition. For example, the gap in Republicans’ average agreement with election procedures in Democratic- versus Republican-leaning states grows from 2 to 31 percentage points between 2008 and 2024.
To estimate the relationship between procedural polarization and voter confidence, I employ two empirical strategies. First, I leverage within-state changes in election rules to estimate the correlation between procedural agreement and voter confidence. While winning remains a powerful predictor of confidence, agreement with the rules governing elections is also associated with higher confidence, especially among Republicans and unaffiliated voters. Notably, disagreement with these rules is associated with a larger reduction in confidence than the increase associated with agreement.
Second, I conduct a survey experiment with 15,000 respondents shortly before the 2024 election that varies partisan and procedural contexts. The experimental results mirror the observational findings: procedural agreement is associated with higher voter confidence across partisan contexts, with the strongest associations appearing among Republicans and unaffiliated voters. Although the study does not aim to identify a confidence-maximizing set of procedures, the use of photo identification is associated with particularly large effects across all groups.
These findings matter because they suggest that, in contrast to a world in which voters’ confidence depends only on who wins, the use of commonly accepted election procedures may provide a partial foundation for electoral confidence even in the face of partisan losses. At the same time, the results highlight an important tension. By implementing procedures favored by co-partisans, states may increase representational responsiveness (Butler and Dynes Reference Butler and Dynes2016; Lax and Phillips Reference Lax and Phillips2012), but often at the cost of polarizing electoral confidence among those who oppose such rules. The resulting procedural polarization can pose challenges for the perceived legitimacy of national outcomes decided by narrow margins in states using different rules—especially when political elites succeed in politicizing those rules.
PROCEDURAL POLARIZATION AND CONGRUENCE
Especially following the 2000 election, partisan elites have increasingly promoted divergent narratives about procedural changes needed to improve the integrity and/or accessibility of election (Hasen Reference Hasen2012). Democrats typically champion reforms that expand access, for example all-mail voting, while Republicans tend to emphasize concerns about fraud and advocate for stricter rules like voter ID laws (Bentele and O’Brien Reference Bentele and O’Brien2013). A large literature tracks procedural changes over time (e.g., Bentele and O’Brien Reference Bentele and O’Brien2013; Schraufnagel, Pomante, and Li Reference Schraufnagel, Pomante and Li2022) with the aim of assessing how procedural changes affect the cost of voting (Pomante Reference Pomante2024) or level of “democratization” (Grumbach Reference Grumbach2023). Others show how voters’ perceptions of electoral fairness depend on opinions about election procedures (Bowler et al. Reference Bowler, Brunell, Donovan and Gronke2015). I build on these works and ask: regardless of why they are enacted (Burden et al. Reference Burden, Canon, Mayer and Moynihan2011; Caron Reference Caron2022; Grumbach and Hill Reference Grumbach and Hill2023; Smith, Hill, and Ancheva Reference Smith, Hill and Ancheva2023), how does the portfolio of election procedures being used in a state affect voters’ confidence in the accuracy of the state’s vote count?
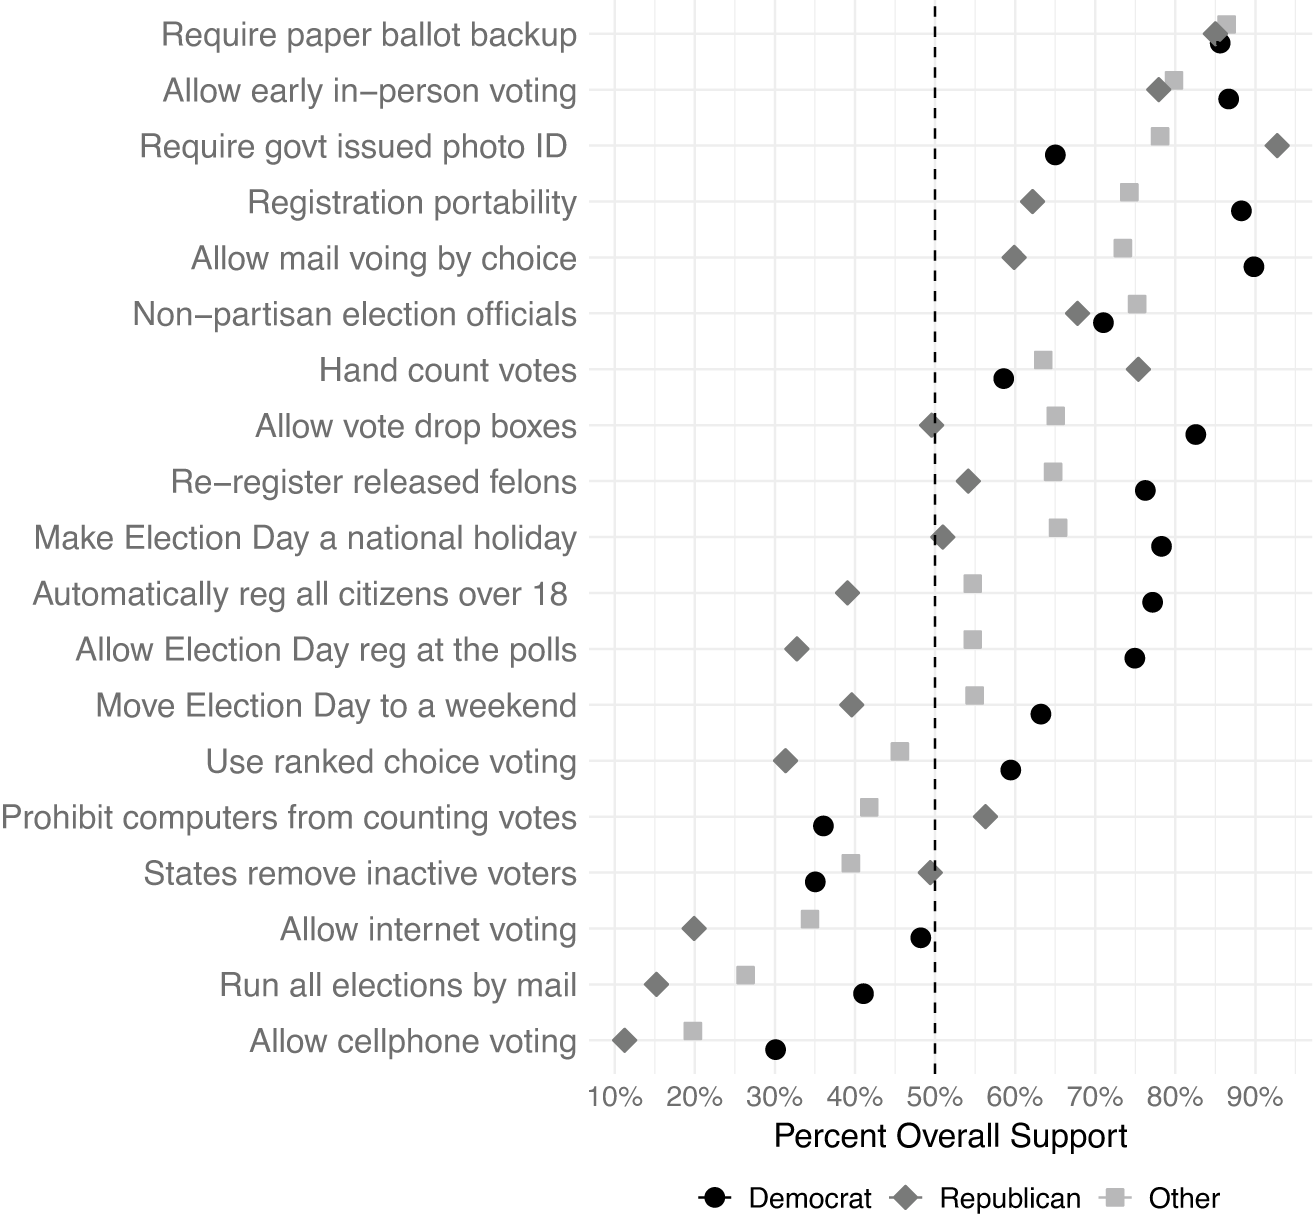
To assess public support for election procedures, I combine data from the Survey on the Performance of American Elections (SPAE) (Stewart Reference Stewart2023)—a postelection survey of nearly 200 voters in each state in every election cycle since 2008—with data from a postelection survey I conducted in 2024 that asked comparable questions about actual and hypothetical election procedures (see Appendix A of the Supplementary Material for question wording and sample sizes). Figure 1 presents the average support for each policy pooled over time by self-reported partisanship (with 110,000 respondents, the 95% confidence intervals are smaller than the plotted points).Footnote 1
Pooled Average Partisan Support for Election Procedures, 2008–24
Note: To minimize the effects of changing demographics, each year is weighted to match the demographics of the 2020 electorate using the Voter Supplement of the Current Population Survey. With 110,000 respondents, the 95% confidence intervals are smaller than the plotted points.

In general, Republicans express greater support for election security-related policies, whereas Democrats express greater support for policies aimed at expanding access (Gronke et al. Reference Gronke, Hicks, McKee, Stewart and Dunham2019; Pew Research Center 2024). Some policies receive broad bipartisan support: both parties favor requiring a paper ballot backup, allowing in-person early voting, and requiring photo identification to vote. Others face bipartisan opposition, including cell-phone or internet voting, conducting all-mail elections, and removing inactive voters from registration rolls. Support for other policies divides along partisan lines: most Democrats support automatic and same-day voter registration, while a majority of Republicans oppose both. (See Appendix B of the Supplementary Material for trends in public opinion over time; with the exception of a temporary increase in Democratic support for all-mail voting during the 2020 election, opinion shifts are small and show no clear relationship to party positioning or policy adoption.)
To track changes in state election procedures, I focus on policies that both exhibit temporal variation and have corresponding measures of public support. I construct an additive index where states receive one point each for using default all-mail voting, online registration, in-person early voting, no-excuse absentee voting, same-day registration, and post-sentence felon re-enfranchisement and lose one point for imposing any voter ID requirement and an additional point if the requirement is classified as strict.Footnote 2
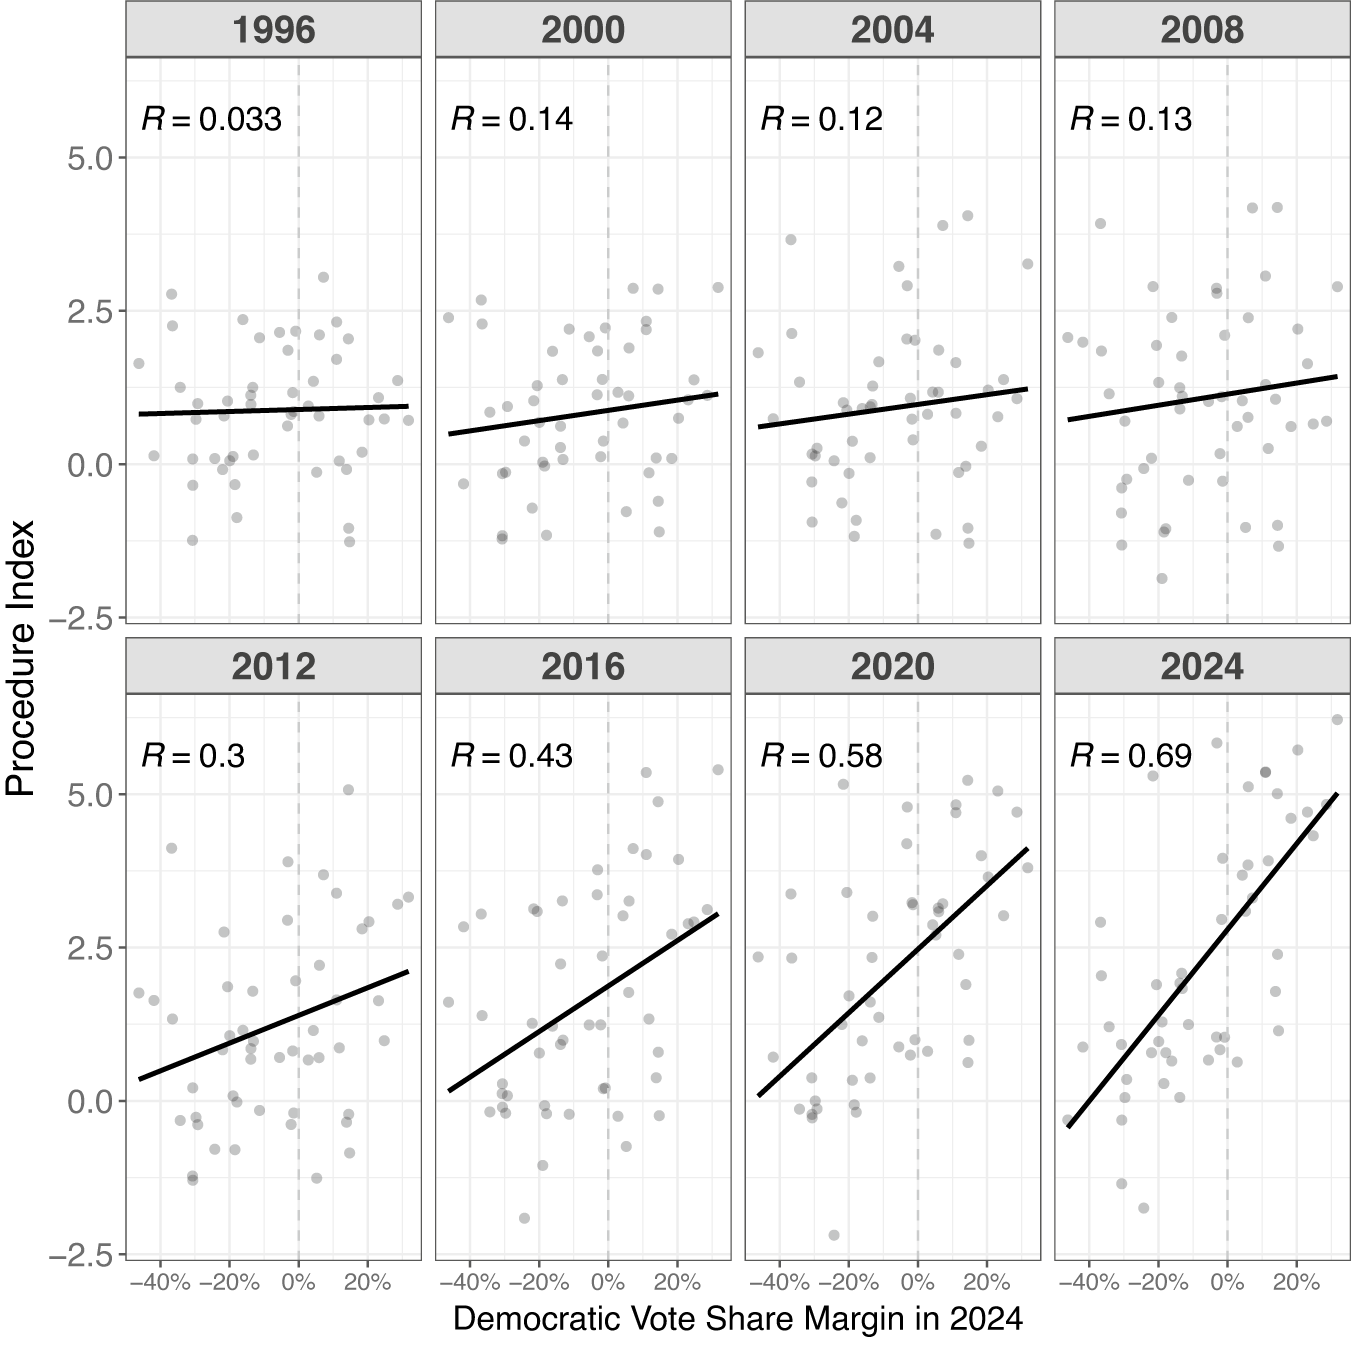
To characterize growing procedural polarization, I plot state-election procedure scores against 2024 presidential vote shares, illustrating how election procedures have changed over time relative to a fixed partisan baseline.Footnote 3
Figure 2 highlights three relevant trends. First, procedural changes accelerate in the late 2000s. Reflected in the growing dispersion of the index, the standard deviation of scores increases from 0.98 in 1996 to 2.03 by 2024. Second, the fact that more movement over time occurs in states with margins greater than zero means that many more changes in these policies occurred in states that supported Vice President Harris over President Trump in the 2024 election. Third, election procedures have become increasingly aligned with state partisanship, shifting from almost no association in 1996 to a correlation of 0.69 by 2024.
Election Procedures and State Partisanship, 1996–2024
Note: Political environment is measured by the 2024 Democratic–Republican presidential vote share. See Appendix C of the Supplementary Material for additional characterizations, for example, Figure A10 in the Supplementary Material uses contemporaneous presidential margin to measure partisan leanings and Figure A11 in the Supplementary Material using the annual cost-of-voting index scores to measure election procedures (Pomante Reference Pomante2024).

PROCEDURAL CONGRUENCE AND VOTER CONFIDENCE
Given partisan divisions in both public opinion and the election procedures states employ, a foundational question emerges: does voter confidence in election outcomes depend on whether voters agree with the procedures being used (Bowler and Donovan Reference Bowler and Donovan2016)? On the one hand, theories of legitimacy suggest that individuals are more likely to view outcomes as legitimate when they result from rules they support and trust (Easton Reference Easton1975; Hibbing and Theiss-Morse Reference Hibbing and Theiss-Morse2002; Tyler Reference Tyler2006). On the other hand, election procedures are often obscure, raising questions about whether voters hold sufficiently developed views for procedural agreement to meaningfully shape confidence, and about the salience of those views relative to considerations, such as whether one’s preferred candidate won, the state’s broader partisan context, or individuals’ ideological commitments.
What it means for voters to “agree” with the election procedures being used is not self-evident. Debates over election administration routinely focus not only on which rules are adopted, but also on which rules are absent—for example, disputes over the presence or absence of voter identification requirements (Adeosun Reference Adeosun2025) or same-day registration (Williamson and Rhodes Reference Williamson and Rhodes2021). To address this ambiguity, I consider two complementary conceptions of procedural congruence.
First, I conceptualize congruence as the extent to which a state’s overall portfolio of adopted and unadopted election policies aligns with a respondent’s preferences. This approach allows the absence of a policy (such as the lack of voter identification requirements) to matter for voter confidence in the same way as its presence.
Second, I examine congruence in terms of respondents’ support for—or opposition to—the specific election procedures currently in use in their state. Defining congruence in this way makes it possible to compare whether opposing a policy being used has a larger negative association with confidence than the positive association of supporting that policy.
To assess whether and how procedural congruence relates to voter confidence, I employ two empirical strategies. First, I leverage within-state changes in election procedures over time to examine how voters’ confidence in the accuracy of their state’s vote count varies with the procedures in use and voters’ support for those procedures. While causal interpretations are limited by the nature of the data, analyses across multiple measures and specifications reveal a consistent association between procedural agreement and voter confidence which also replicate the well-established relationship between voter confidence and electoral outcomes at the state and national levels.
Second, to address key limitations of observational data—including concerns about voter awareness, endogenous opinion change, and unobserved confounding—I field a survey experiment prior to the 2024 election that varies procedural conditions and political context. Randomizing the election procedures and partisan context used in hypothetical electoral scenarios corroborates the association between procedural agreement and voter confidence observed in the observational analyses.
OBSERVATIONAL ANALYSES
The need to measure public support for election procedures whose use varies over time limits the observational analysis to four policies: automatic registration, same-day registration, photo ID, and default all-mail voting. Although these policies represent a subset of the procedures used by states, they capture substantively meaningful variation in election administration. Not only do partisans differ in their support for these policies, but the policies themselves vary in their partisan associations: some are more closely aligned with Democratic elites (e.g., all-mail voting), others with Republican elites (e.g., photo identification), while elite positioning on still others (e.g., same-day registration) is less clearly defined (Burden and Gaines Reference Burden and Gaines2015).
I measure individual-level support for each procedure using postelection survey items summarized in Figure 1, coding respondents as supportive (1) if they report “strong” or “somewhat” agreement and as not supportive (0) otherwise.
Building on the conceptual discussion above, I then operationalize procedural congruence in two ways by combining these respondent-level policy preferences with indicators for whether each procedure was used in the respondent’s state in the most recent election, as coded in the Cost of Voting Index (COVI) dataset (Pomante Reference Pomante2024).Footnote 4
Under the first measure, a respondent is considered congruent with a given policy if they either support a procedure that is used in their state or oppose a procedure that is not used. Thus, a respondent who favors photo identification in a state that requires it is treated as equally congruent as a respondent who opposes photo identification in a state that does not. Incongruence arises when a respondent supports a policy not in use or opposes a policy their state implements.
I also construct an alternative measure of congruence based solely on respondents’ agreement with the procedures currently used in their state. This measure counts only support for policies in use and does not treat opposition to absent policies as congruent.
The outcome of interest is whether respondents are “very” or “somewhat” confident when asked: “Now, think about vote counting throughout [STATE]. How confident are you that votes in [STATE] were counted as voters intended in the 20XX general election?”Footnote 5
Figure 3 plots average voter confidence against average procedural agreement over time by partisanship. Procedural congruence is positively, but modestly, associated with confidence in the accuracy of a state’s vote count, especially among Republicans. Consistent with established effects of winning on voter confidence, large intercept shifts in partisans’ average confidence in 2016, 2020, and 2024 track national presidential outcomes.
Trust in State Election Results by Procedural Congruence
Note: Average confidence in the accuracy of state vote counts is plotted against average agreement with the election procedures in use, by partisanship and election cycle. To reduce the effects of compositional changes in the sample over time, each year is weighted to match the 2020 electorate. Figure A16 in the Supplementary Material reports unweighted results.

To better assess the relationship between procedural congruence and voter confidence, I leverage within-state changes in election procedures to estimate how policy-induced changes in procedural congruence are associated with the probability that a voter expresses confidence in the accuracy of their state’s vote count. Because partisanship is known to shape how individuals interpret political environments, I estimate the relationship separately for Democrats, Republicans, and unaffiliated voters. This approach allows the estimated associations to vary flexibly across partisan groups, reflecting possible differences in baseline trust, responsiveness to electoral outcomes, and the salience of election procedures.Footnote 6
More specifically, I estimate:Footnote 7
 $$ {\displaystyle \begin{array}{l}Pr({Y}_i=1)={\theta}_0{\mathrm{PctCongruent}}_i+{\alpha}_1{\mathrm{StateWon}}_i\\ {}+{\beta}_0{\mathrm{Personal}\ \mathrm{Ideology}}_i+{\beta}_1{\mathrm{AllMail}}_i\\ {}\hskip5.13em +{\beta}_2{\mathrm{AutoReg}}_i+{\beta}_3{\mathrm{PhotoID}}_i\\ {}\hskip5.2em +{\beta}_4{\mathrm{SameDayReg}}_i\\ {}\hskip5.25em +{\beta}_5{\mathrm{Dem}\hbox{-}\mathrm{Rep}\ \mathrm{Margin}}_j+{\mathbf{X}}_i\Gamma \\ {}\hskip5.2em +{\delta}_{time}+{\delta}_{state,}\end{array}} $$
where Y
i
is a binary variable indicating whether respondent i believes that elections are accurately counted in their state j. The primary independent variable, PctCongruent, measures the proportion of the four state-level voting policies that align with a respondent’s expressed support, scaled from 0 to 1. The associated coefficient, $ {\theta}_0\hskip-0.15em $
, reflects the average difference in voter confidence between a respondent who is perfectly congruent (1) and one who is fully incongruent (0) all else equal. Given the importance of winning for voter confidence, the coefficient on StateWon captures the effect of living in a state won by presidential candidate of the respondent’s party (coded only for Democrats and Republicans), and
$ {\theta}_0\hskip-0.15em $
, reflects the average difference in voter confidence between a respondent who is perfectly congruent (1) and one who is fully incongruent (0) all else equal. Given the importance of winning for voter confidence, the coefficient on StateWon captures the effect of living in a state won by presidential candidate of the respondent’s party (coded only for Democrats and Republicans), and $ {\delta}_{time} $
are election fixed effects that account for the impact of winning at the national level along with other time-varying effects.Footnote 8 As confidence itself may be related to the overall ideological orientation of a voter,
$ {\delta}_{time} $
are election fixed effects that account for the impact of winning at the national level along with other time-varying effects.Footnote 8 As confidence itself may be related to the overall ideological orientation of a voter, $ {\beta}_0 $
measures whether confidence covaries with self-reported liberalism (1) and conservatism (5). Because voter confidence may also be related to voters’ opinions about specific policies—that is, those who support all-mail voting by default may be more trusting of election outcomes than those who support photo identification—the coefficients β
1 through β
4 allow voter confidence to vary by a voter’s support for each procedure. Individual demographics (
$ {\beta}_0 $
measures whether confidence covaries with self-reported liberalism (1) and conservatism (5). Because voter confidence may also be related to voters’ opinions about specific policies—that is, those who support all-mail voting by default may be more trusting of election outcomes than those who support photo identification—the coefficients β
1 through β
4 allow voter confidence to vary by a voter’s support for each procedure. Individual demographics ( $ {\mathbf{X}}_i $
) allow for additional variation in voter confidence related to variation in race/ethnicity, gender, education level, and age. State fixed effects
$ {\mathbf{X}}_i $
) allow for additional variation in voter confidence related to variation in race/ethnicity, gender, education level, and age. State fixed effects $ {\delta}_{state} $
account for between-state differences—meaning that the identified effects of procedural congruence are a result of within-state differences across co-partisans. Standard errors are clustered by state to account for shared contextual factors.
$ {\delta}_{state} $
account for between-state differences—meaning that the identified effects of procedural congruence are a result of within-state differences across co-partisans. Standard errors are clustered by state to account for shared contextual factors.
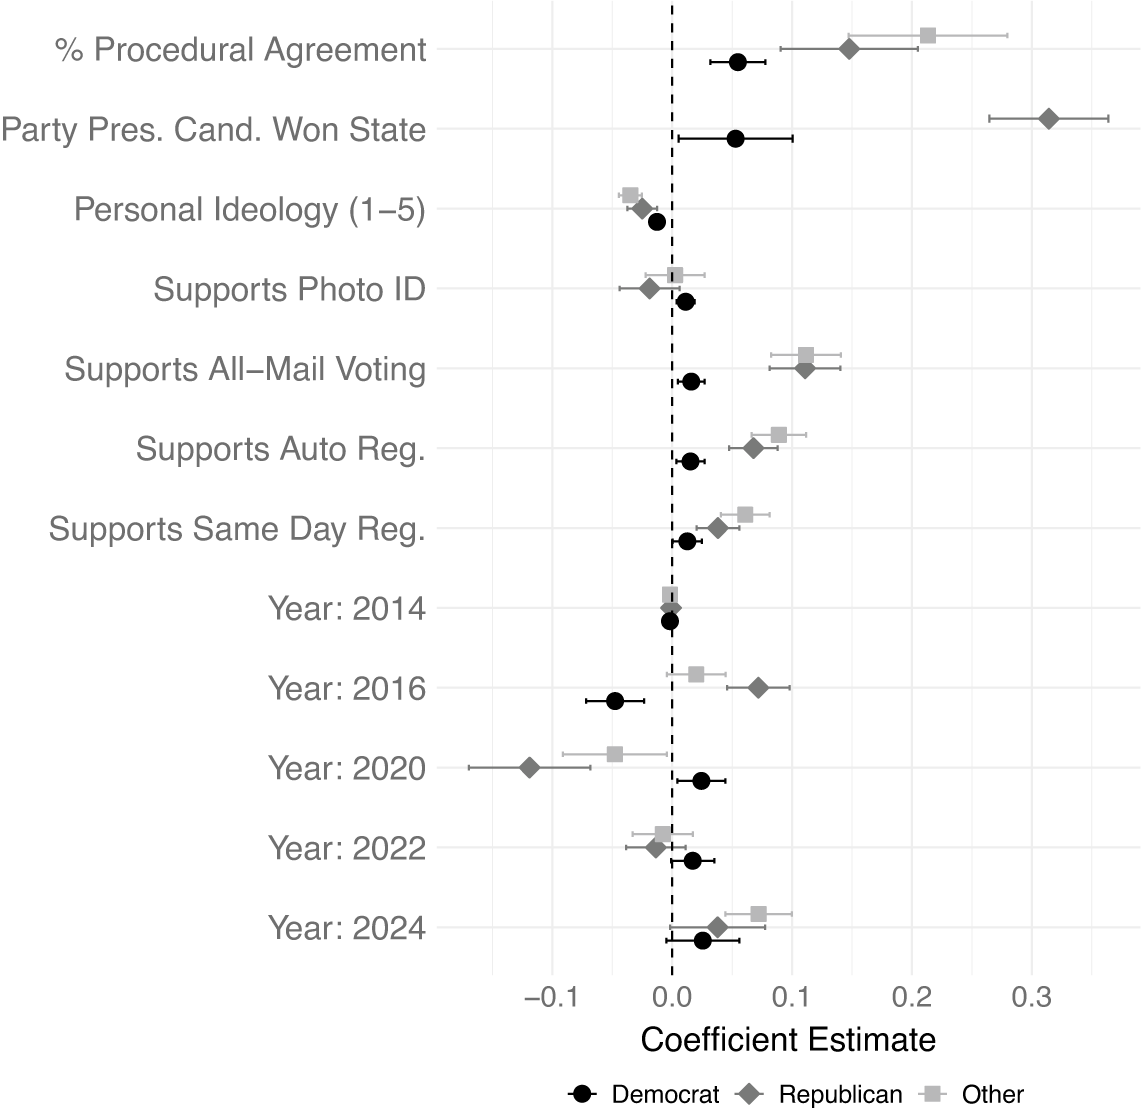
Figure 4 summarizes the estimated coefficients from models estimated separately for Democrats, Republicans, and unaffiliated voters.
Correlates of Confidence in Own-State Election Results
Note: Estimated coefficients for Equation 1. 95% confidence intervals are based on standard errors clustered by state. Complete results are reported in Table A2 in the Supplementary Material. See Appendix E of the Supplementary Material for alternative specifications.

Consistent with prior work, winning has a large association with voter confidence at both the state and national levels, with particularly pronounced effects among Republicans. Republicans living in states carried by the Republican presidential candidate are 0.32 more likely to express confidence in the accuracy of the state vote count than Republicans living in Democratic-carried states, whereas the corresponding difference among Democrats is considerably smaller (0.06). Confidence also tracks national presidential outcomes: Republican respondents report higher confidence following the Republican victories in 2016 and 2024 and lower confidence following the Democratic victory in 2020, while Democratic respondents exhibit lower confidence in 2016 and higher confidence in 2020.
The coefficients on personal ideology and policy support reveal respondent-level differences in voter confidence that are independent of the procedures used in a respondent’s state. Voters who self-report as more conservative express lower confidence in the accuracy of their state’s vote count on average, as do respondents who support photo identification laws. In contrast, respondents who favor ballot access expanding procedures—such as same-day registration, automatic voter registration, and all-mail voting—report higher average levels of confidence.
Of primary interest, however, is the relationship between procedural congruence and voter confidence. Figure 4 shows a positive association between procedural congruence and voter confidence that varies across partisan groups. The effect of procedural congruence is largest among unaffiliated voters, for whom moving from complete disagreement to full agreement increases the average predicted probability of expressing confidence in their state’s results by 0.21.
Among partisans, moving from complete disagreement to full agreement over the use of these four procedures is predicted to change the probability of expressing confidence by 0.15 among Republicans and 0.05 among Democrats. Compared to the effect of winning, the total effect of procedural congruence is roughly half as large among Republicans and comparable in magnitude among Democrats.
The asymmetric partisan associations are intriguing, but the underlying mechanisms are difficult to identify given the nature of the data. Three of the four policies—all-mail voting, automatic voter registration, and same-day registration—are more commonly supported by Democrats. As Figure 3 shows, Democrats report higher baseline confidence than Republicans, which may attenuate the marginal effect of procedural congruence due to ceiling effects. Finally, Republicans and unaffilated respondents may be more responsive to procedural (mis)alignment because of heightened elite rhetoric surrounding election administration; Republican leaders have been significantly more vocal than Democratic leaders in criticizing election procedures and raising doubts about their legitimacy, for example, Republican messaging in 2024 regarding “Stop the Steal” and “Too Big to Rig” (Cortellessa Reference Cortellessa2024). Regardless of the mechanism(s), the results suggest that voters’ confidence is not merely a function of who wins, but it also matters whether voters agree with the procedures being used.Footnote 9
Voter confidence may depend less on broad alignment with a state’s overall policy portfolio than on reactions to the specific election procedures actually in use. To evaluate this possibility and to distinguish the effects of supporting a procedure from opposing one, I construct an alternative measure of procedural congruence based solely on respondents’ agreement with the procedures used in their state. I then estimate the probability that respondent i expresses confidence in the accuracy of their state’s vote count by leveraging within-state procedural variation and estimating:
 $$ {\displaystyle \begin{array}{l}Pr\left({Y}_i=1\right)={\alpha}_0+{\beta}_1{\mathrm{SupportPhotoID}}_i+\hskip2px {\beta}_2{\mathrm{SupportAllMail}}_i\\ {}+{\beta}_3{\mathrm{SupportMailChoice}}_i\\ {}+\hskip2px {\beta}_4{\mathrm{SupportInPersonEarly}}_i+{\gamma}_1{\mathrm{PhotoID}}_i\\ {}+\hskip2px {\gamma}_2{\mathrm{AllMail}}_i+{\gamma}_3{\mathrm{EarlyMail}}_i\\ {}+\hskip2px {\gamma}_4{\mathrm{InPersonEarly}}_i\\ {}+{\delta}_1\left({\mathrm{PhotoID}}_i\times {\mathrm{SupportPhotoID}}_i\right)\\ {}+\hskip2px {\delta}_2\left({\mathrm{AllMail}}_i\times {\mathrm{SupportAllMail}}_i\right)\\ {}+\hskip2px {\delta}_3\left({\mathrm{EarlyMail}}_i\times {\mathrm{SupportMailChoice}}_i\right)\\ {}+\hskip2px {\delta}_4\left({\mathrm{InPersonEarly}}_i\times {\mathrm{SupportInPersonEarly}}_i\right)\\ {}+\hskip2px {\delta}_{time}+\delta state.\end{array}} $$
Because $ \boldsymbol{\gamma} $
captures the conditional association between a procedure and voter confidence among respondents who oppose that procedure, and
$ \boldsymbol{\gamma} $
captures the conditional association between a procedure and voter confidence among respondents who oppose that procedure, and $ \boldsymbol{\gamma} +\boldsymbol{\delta} $
captures the corresponding association among those who support it, I expect
$ \boldsymbol{\gamma} +\boldsymbol{\delta} $
captures the corresponding association among those who support it, I expect $ \boldsymbol{\gamma} <0 $
and
$ \boldsymbol{\gamma} <0 $
and $ \boldsymbol{\gamma} +\boldsymbol{\delta} >0 $
. However, there is little theoretical guidance regarding the relative magnitudes of these effects; it is unclear whether opposition or support for a procedure in use has a larger association with voter confidence and whether this varies by policy.
$ \boldsymbol{\gamma} +\boldsymbol{\delta} >0 $
. However, there is little theoretical guidance regarding the relative magnitudes of these effects; it is unclear whether opposition or support for a procedure in use has a larger association with voter confidence and whether this varies by policy.
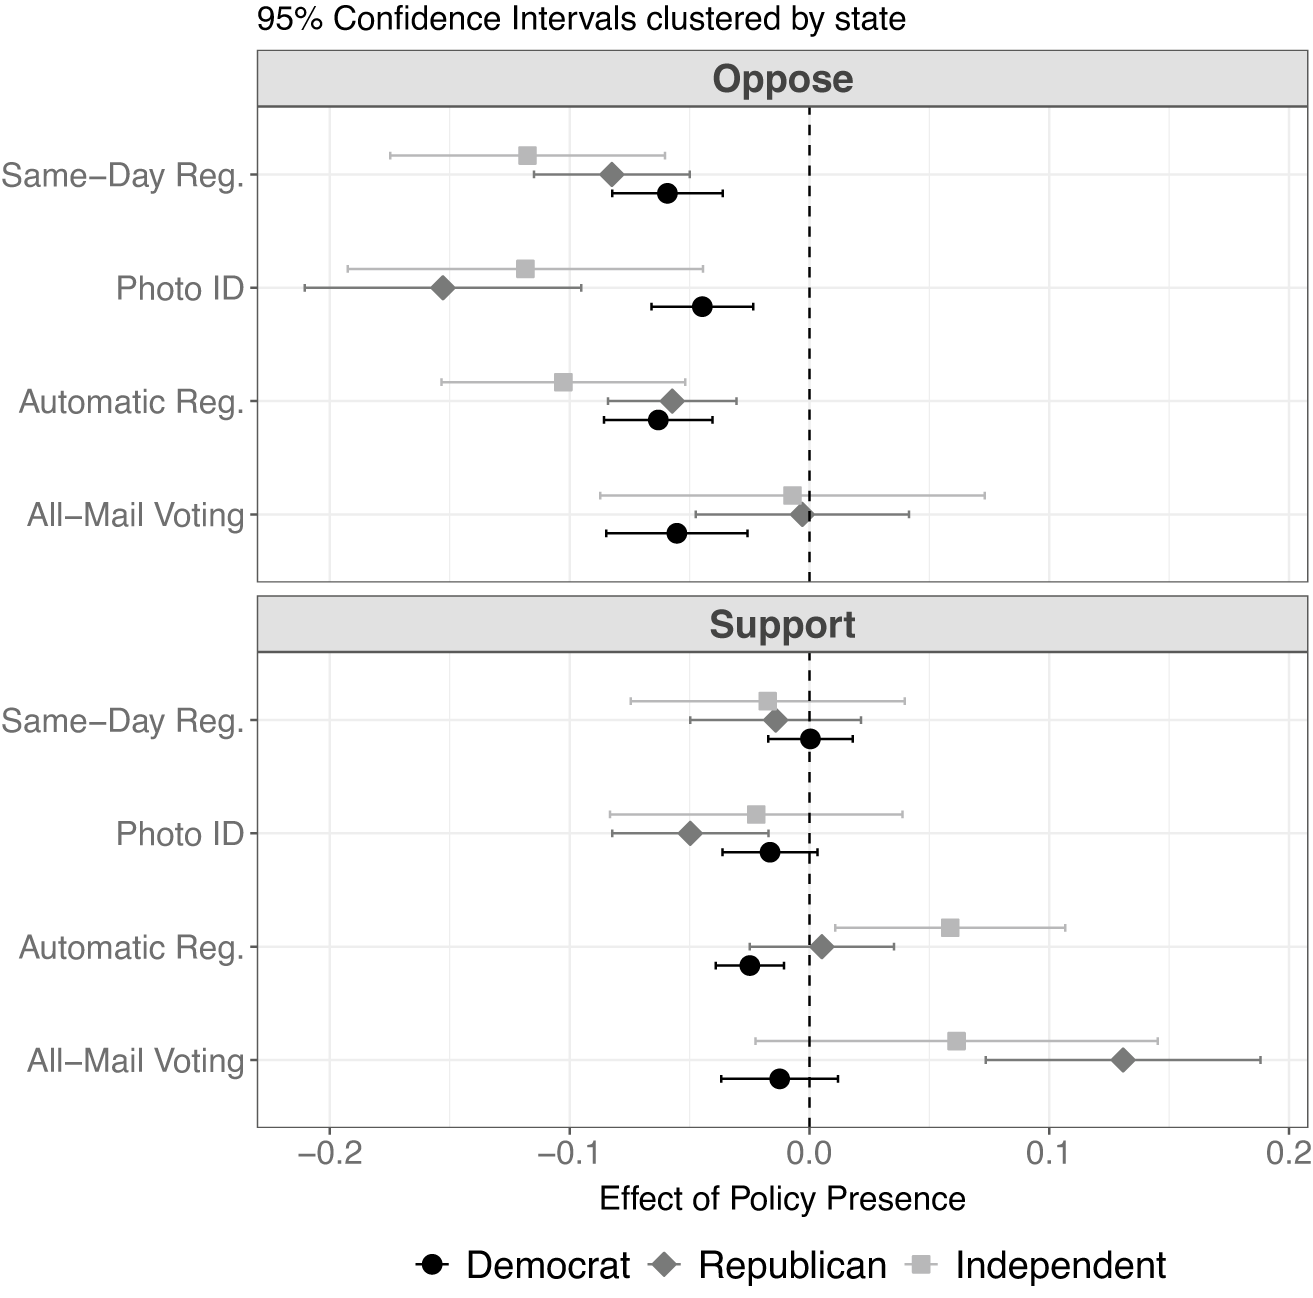
Figure 5 summarizes these relationships and shows that, in general, opposing policies in use is associated with larger reductions in voter confidence than the increases associated with supporting those policies. Regardless of partisanship, voters who oppose same-day registration, automatic registration, or photo identification report lower confidence in the accuracy of state election results when those policies are used compared to similar voters in states where the policies are not in effect. In contrast, supporters of each policy express similar levels of confidence regardless of whether the policy is in use. The largest positive association occurs among Republican supporters of all-mail voting, but only 14% of Republicans express such a preference and those preferences are contrary to most Republican elite messaging (Clinton et al. Reference Clinton, Lapinski, Lentz and Pettigrew2022).Footnote 10
Effects of Supporting and Opposing Election Procedures on Voter Confidence
Note: The figure plots the conditional marginal association between policy use and voter confidence for respondents who oppose a procedure ( $ \boldsymbol{\gamma} $
) and for those who support it (
$ \boldsymbol{\gamma} $
) and for those who support it ( $ \boldsymbol{\gamma} +\boldsymbol{\delta} $
), as estimated in Equation 2. Standard errors are clustered by state.
$ \boldsymbol{\gamma} +\boldsymbol{\delta} $
), as estimated in Equation 2. Standard errors are clustered by state.

The asymmetric relationship between policy support and opposition is notable, but the mechanisms generating this asymmetry are difficult to isolate given the observational nature of the data. As noted earlier, a limitation in generalizing the estimated effects of policy support and opposition is that three of the four policies I am able to examine expand voting access. Combined with Democrats’ higher baseline confidence (92% compared to 81% among Republicans), this creates potential ceiling effects for policy supporters while leaving considerable room for confidence declines among opponents. The asymmetry may also reflect differential measurement error: respondents who oppose a policy may be more aware of whether it is being used than those who support it, which could attenuate estimated effects among supporters. Despite these complications, the central finding is clear: congruence between individual views and election procedures is associated with voter confidence, particularly among unaffiliated voters and Republicans who oppose the procedures in use.
EXPERIMENTAL ANALYSES
Two limitations of the observational analyses motivate the experimental design. First, some respondents in postelection surveys may lack accurate information about the procedures used in their state. Second, policy support may be endogenous to institutional change if voters adjust their attitudes in response to procedural adoption or related elite messaging. Although partisan procedural attitudes appear relatively stable over time and across states (Appendix B of the Supplementary Material), any opinion shifts induced by procedural change would bias estimates of the relationship between procedural agreement and voter confidence.
To address these limitations and expand the analysis to other procedures (e.g., no-excuse mail voting and early in-person voting), I conducted a survey experiment using 15,000 respondents in the month prior to the 2024 election. Respondents were first asked their opinion toward various election procedures and then asked to evaluate five hypothetical election scenarios, one at a time, by indicating their confidence in the accuracy of the vote count of each (see Appendix I of the Supplementary Material for details). Because procedural opinions were elicited prior to the evaluation of the election scenarios, the experiment avoids concerns about endogenous procedural preferences. To maximize awareness of the randomized procedures, scenario descriptions were intentionally sparse and centered on the procedures themselves.
The procedures in each scenario were randomized subject to two constraints. First, scenarios excluded logically inconsistent combinations (e.g., all-mail voting paired with strict photo identification). Second, each respondent evaluated five of six randomly selected procedural portfolios under a fixed, randomly assigned partisan environment: a nonpartisan condition (33%), a Democrat-led state (33%), or a Republican-led state (33%). Holding the partisan environment constant within respondent ensures that within-person variation in confidence reflects differences in election procedures rather than changes in partisan context. This design limits satisficing based on partisan cues, though the effect of partisan control is therefore identified through between-subject comparisons.Footnote 11 Because procedural portfolios were assigned independently of partisan context, an average of 1,394 respondents evaluated each of the 6 × 3 = 18 experimental conditions.
The estimated effects capture how procedural congruence shapes respondents’ beliefs about electoral legitimacy in a setting that abstracts from additional contextual information such as elite messaging. Given the experiment’s emphasis on procedural salience and isolation from competing cues, these estimates are perhaps best interpreted as an upper bound on real-world effects (Brutger et al. Reference Brutger, Kertzer, Renshon, Tingley and Weiss2023).
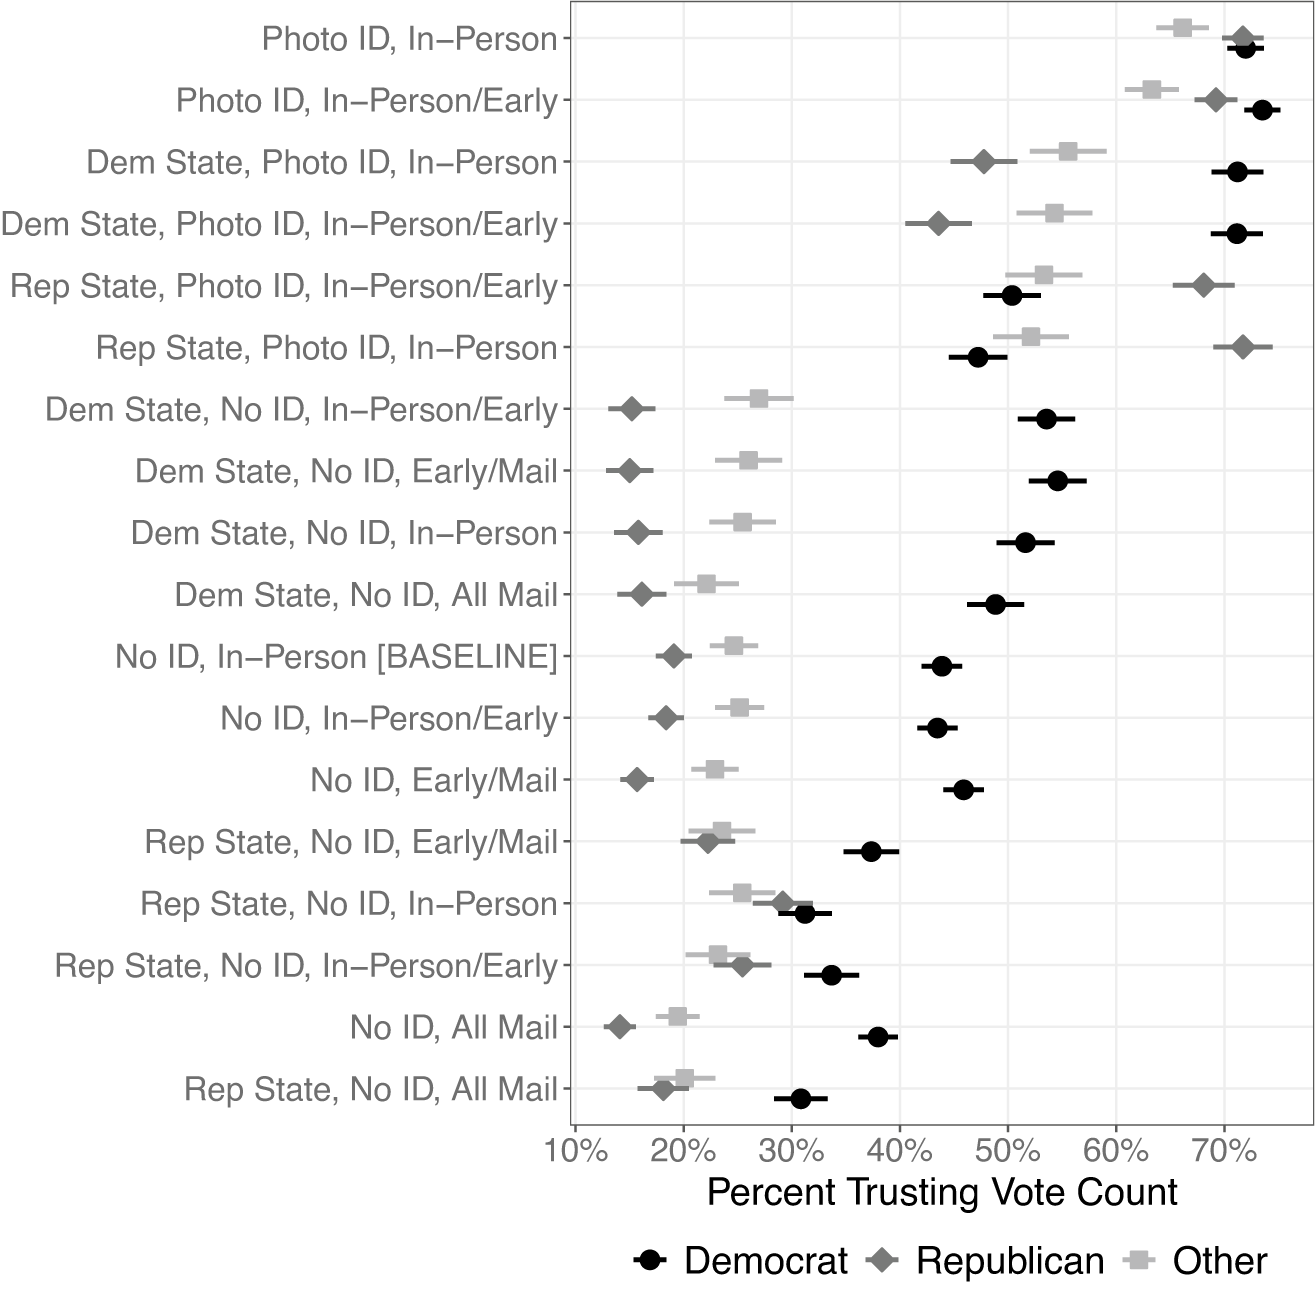
Figure 6 reports the average confidence expressed by Democrats, Republicans, and unaffiliated voters across the experimental conditions. Consistent with the partisan differences documented in Figure 1, Democrats express higher confidence than Republicans in every scenario. Confidence also varies by procedure, with respondents expressing higher confidence in conditions that include photo identification and lower confidence in those featuring all-mail voting.
Average Confidence by Condition by Partisanship
Note: Averages and 95% confidence intervals are reported for the randomized scenarios. See Appendix I of the Supplementary Material for question wording and details.

To assess the contribution of each randomized scenario feature to voter confidence, I construct indicators for the presence of each feature and estimate their effects on the probability that a respondent expresses confidence in the accuracy of the vote count. Effects are estimated relative to a baseline scenario in which the state does not require photo identification and voting only occurs in-person on Election Day. Specifically, I estimate the following specification, clustering standard errors by respondent:Footnote 12
 $$ {Y}_i={\displaystyle \begin{array}{l}\alpha +{\beta}_1\mathrm{Dem}\ \mathrm{led}+{\beta}_2\mathrm{Rep}\ \mathrm{led}+{\gamma}_1{\mathrm{PhotoID}}_i\\ {}+\hskip2px {\gamma}_2{\mathrm{InPersonEarly}}_i+{\gamma}_3{\mathrm{EarlyMail}}_i+{\gamma}_4{\mathrm{AllMail}}_i.\end{array}} $$
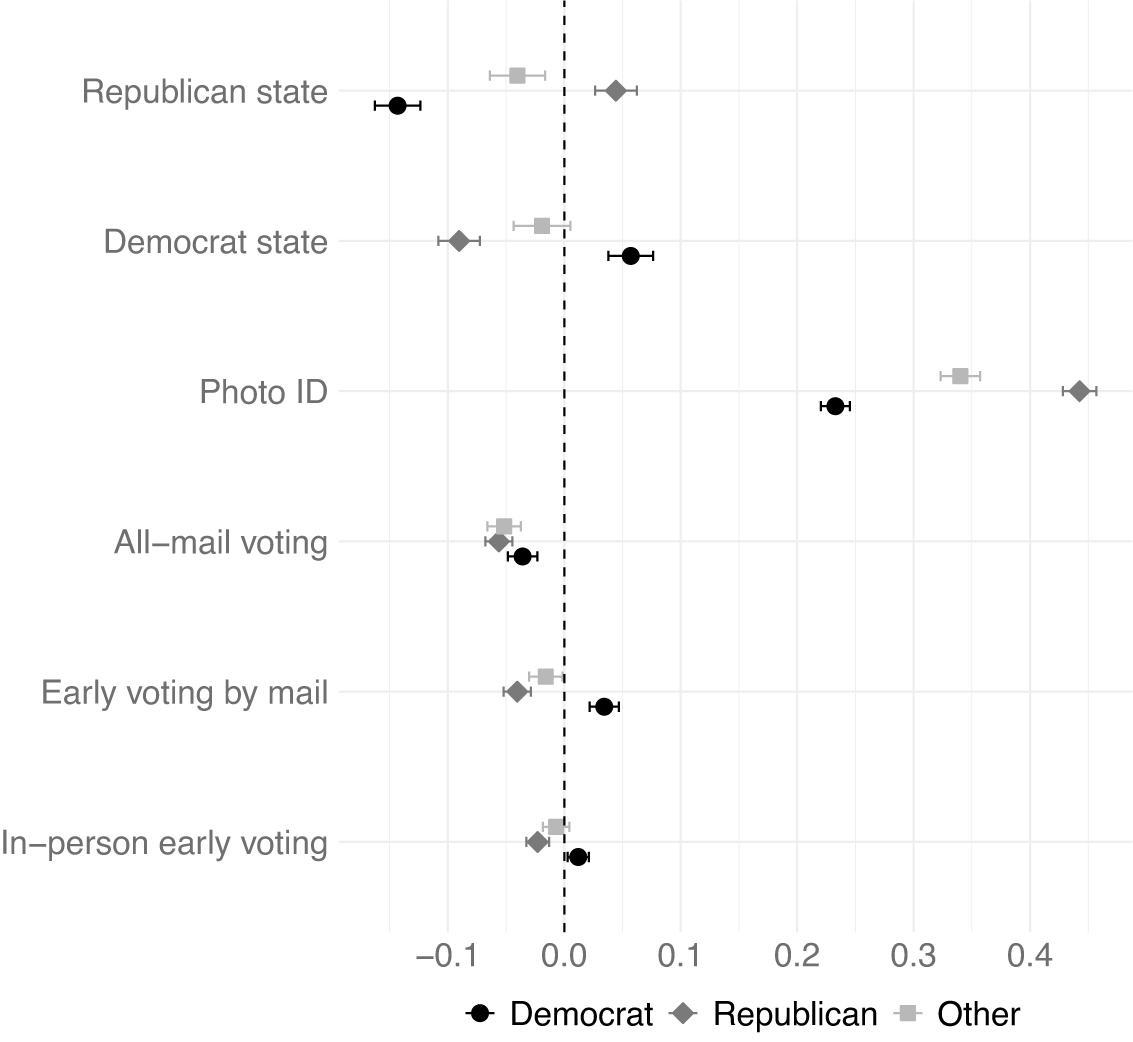
Figure 7 presents the estimated coefficients for each partisan specification. Republicans express higher confidence when scenarios are described as occurring in a Republican-led state and lower confidence when they are described as occurring in a Democrat-led state, relative to scenarios in which state partisanship is not specified. Democrats respond in the opposite direction. The similarity in the magnitude of in-party and out-party effects across Democrats and Republicans indicates broadly symmetric partisan responses to the political context.
Procedural and Partisan Determinants of Voter Confidence
Note: Standard errors are clustered by respondent. Coefficients are reported in Table A11 in the Supplementary Material. See Appendix I of the Supplementary Material for similar results using respondent fixed effects. Effects are relative to the baseline of in-person Election Day voting in a state without photo ID.

Across policies, photo identification has the largest effect on voter confidence for every partisan group. Its magnitude exceeds both the combined positive effects of all other procedures and the effect associated with residing in a state governed by co-partisans by roughly a factor of 10 among Republicans and a factor of 3 among Democrats. By contrast, default all-mail voting uniformly reduces confidence, while other procedures exert smaller and more polarized effects: in-person early voting and optional vote-by-mail modestly increase confidence among Democrats but reduce confidence among Republicans.
To decompose the effect of procedural congruence by policy agreement, I allow the effect of each procedure to vary by respondents’ policy support, using an interactive specification analogous to that used in the observational analyses (Equation 2). For each policy, I allow the respondent’s evaluation to vary based on their support for the policy, whether the policy is present in the experimental vignette, and an interaction between support and presence (e.g., $ {\beta}_1{\mathrm{SupportPhotoID}}_i+{\gamma}_1{\mathrm{PhotoID}}_i+{\delta}_1({\mathrm{PhotoID}}_i\times {\mathrm{SupportPhotoID}}_i)\hskip-0.55em $
. If congruence matters, we should expect to find negative effects for
$ {\beta}_1{\mathrm{SupportPhotoID}}_i+{\gamma}_1{\mathrm{PhotoID}}_i+{\delta}_1({\mathrm{PhotoID}}_i\times {\mathrm{SupportPhotoID}}_i)\hskip-0.55em $
. If congruence matters, we should expect to find negative effects for $ {\gamma}_1 $
—the effect of the policy on voter confidence among those who are opposed to the policy—and positive effects for
$ {\gamma}_1 $
—the effect of the policy on voter confidence among those who are opposed to the policy—and positive effects for $ {\gamma}_1+{\delta}_1 $
—the effect of a policy among those who approve of that policy.Footnote 13
$ {\gamma}_1+{\delta}_1 $
—the effect of a policy among those who approve of that policy.Footnote 13
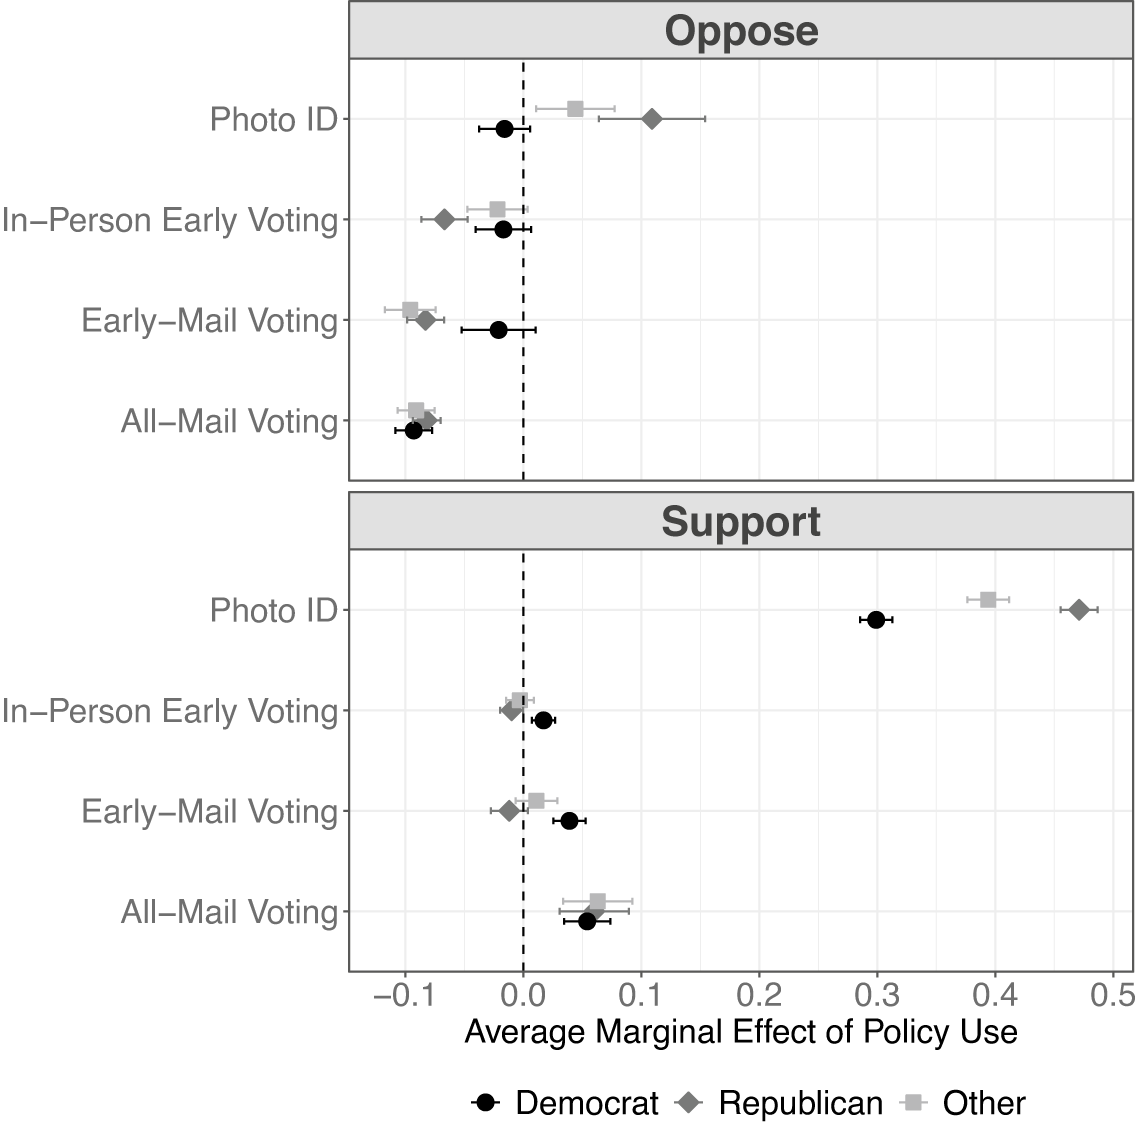
Figure 8 graphs the estimated change in a voter’s probability of expressing confidence in the accuracy of the vote count relative to the baseline condition among supporters and opponents for each policy by partisanship.
Average Marginal Effects by Respondent Support
Note: Standard errors are clustered by respondents.

Mirroring earlier observational results, respondents express less confidence in scenarios that use procedures they disagree with. Partisan asymmetries exist, however. Among Democrats, only the use of all-mail voting reduces voter confidence among those opposed to the policies, but Republican confidence declines for every policy apart from photo ID.Footnote 14
In contrast to the observational analyses, the experimental results indicate that procedural agreement can increase voter confidence when the supported procedure is present. This pattern is driven primarily by photo identification: among supporters in every partisan group, the confidence gain associated with photo identification exceeds all other policy effects and is substantially larger than the effect of partisan control of the state (by nearly a factor of three). That this confidence increase appears among both Republicans, whose elites typically champion the policy, and Democrats, whose elites largely oppose it, is consistent with an interpretation emphasizing shared beliefs about electoral integrity rather than partisan elite messaging. Support for all-mail voting is also associated with higher confidence when the procedure is present across partisan groups, though the magnitude of this effect is considerably smaller than that of photo identification. More generally, Democrats exhibit positive confidence effects across all procedures when they align with their policy preferences.
Overall, the experimental findings reinforce the observational evidence that procedural agreement affects voter confidence. As in the observational analyses, partisan context matters: respondents express different levels of confidence depending on whether elections are conducted in partisan-dominated states. At the same time, the experimental results reveal substantively meaningful effects of procedural agreement that operate above and beyond partisan context. The consistency in the direction and relative magnitude of these effects across observational and experimental analyses is reassuring, even if the estimates are not directly comparable in scale. Although photo identification appears more consequential in the experimental setting than in the observational data, both approaches show that procedural agreement can rival—and in some cases exceed—the effects associated with partisan control and electoral outcomes.Footnote 15
CONCLUSION AND IMPLICATIONS
We care about voters’ confidence in elections not only because acceptance of electoral outcomes by losing candidates and their supporters is critical to the peaceful transfer of power (Anderson et al. Reference Anderson, Blais, Bowler, Donovan and Listhaug2005; Norris Reference Norris2014), but also because confidence in election outcomes is closely tied to support for broader democratic processes and institutions (Carey et al. Reference Carey, Helmke, Nyhan, Sanders and Stokes2019; Layman, Lee, and Wolbrecht Reference Layman, Lee and Wolbrecht2024). Confidence grounded primarily in electoral victory is not a sustainable foundation for electoral legitimacy, as it offers little basis for acceptance among those who lose. Assessing whether voter confidence is shaped by agreement with electoral procedures is therefore central to understanding the potential for creating and sustaining a shared foundation of electoral legitimacy (Tyler Reference Tyler2006).
The observational and experimental analyses show that election procedures are not merely background institutions, but central objects of political evaluation. Winning is an important determinant of voter confidence, but so too is agreeing with the rules used to conduct those elections. This association appears consistently across research designs and empirical specifications, suggesting that procedural agreement constitutes a substantively important source of electoral confidence.
The association between procedural agreement and voter confidence, however, is not symmetric. Disagreement with election procedures is associated with substantially larger losses in confidence than the gains associated with agreement, indicating that procedural conflict is particularly damaging to electoral confidence. These losses are most pronounced among Republicans and unaffiliated voters. Among the procedures examined, photo identification stands out as especially consequential for voter confidence, with an association that in some cases rivals that of winning and which also exceeds the combined associations of the other policies examined.
Together, the findings clarify the importance of distinguishing between outcome-based and procedure-based legitimacy. Confidence grounded primarily in electoral victory is inherently zero-sum: it confers legitimacy on winners while offering little basis for acceptance among those who lose. Confidence rooted in procedural agreement, by contrast, offers a more generalizable foundation because it is not tied to a particular electoral outcome. Viewed in this light, the findings offer a limited basis for optimism: if voter confidence depends in part on agreement with the electoral procedures being used, then using commonly accepted election rules can help sustain confidence among those who lose.
The conditional nature of procedure-based legitimacy also highlights a paradox at the heart of democratic representation and electoral legitimacy. Election rules that are responsive to partisan preferences may enhance representational alignment, yet that same responsiveness can undermine shared confidence in electoral outcomes when procedural agreement hardens along partisan lines or becomes politicized. Under such circumstances, there may no longer be a shared procedural basis for confidence in electoral outcomes among those who lose.
In a federal system of election administration, this paradox takes on particular significance. Decentralized election administration allows states to adopt procedures that are responsive to partisan preferences, but that same responsiveness can make it harder to sustain shared confidence among those who oppose the resulting rules. Within states, partisan majorities that enact procedures favored primarily by their base risk eroding confidence among political minorities. Across states, the problem can intensify when closely contested national outcomes hinge on results produced under divergent and increasingly polarized procedures, inviting skepticism about the results of elections conducted under different rules. In this sense, procedural responsiveness, while normatively attractive from a representational standpoint, can undermine electoral legitimacy if it produces divergent portfolios of election rules and procedural agreement hardens along partisan lines.
Taken together, the findings show that agreement with electoral procedures is a meaningful source of electoral confidence. At the same time, they highlight how difficult it may be to sustain such confidence when opinions about election rules are, or can be, polarized (Biggers Reference Biggers2019; Biggers and Bowler Reference Biggers and Bowler2022; Graham and Svolik Reference Graham and Svolik2020; Kingzette et al. Reference Kingzette, Druckman, Klar, Krupnikov, Levendusky and Ryan2021; Layman et al. Reference Layman, Carsey, Green, Herrera and Cooperman2010; Lenz Reference Lenz2012). Precisely because procedural agreement is both consequential and fragile, understanding how election rules shape voter confidence remains central to debates over democratic legitimacy.
SUPPLEMENTARY MATERIAL
To view supplementary material for this article, please visit https://doi.org/10.1017/S000305542610166X.
DATA AVAILABILITY STATEMENT
Research documentation and data that support the findings of this study are openly available at the American Political Science Review Dataverse: https://doi.org/10.7910/DVN/FADR69.
ACKNOWLEDGEMENTS
Thanks to Thad Kousser, Steve Rogers, and John Sides for helpful comments on an earlier draft and to colleagues at YouGov and Morning Consult for assistance with the survey instruments and data collection.
FUNDING STATEMENT
This research was funded by the Carnegie Foundation through the Andrew Carnegie Fellows Program (Grant No. G-F-24-61687) and Vanderbilt University.
CONFLICT OF INTEREST
The author declares no ethical issues or conflicts of interest in this research.
ETHICAL STANDARDS
The author declares that the human subjects research in this article was reviewed and approved by Vanderbilt University (IRB No. 241407). The author affirms that this article adheres to the principles concerning research with human participants laid out in APSA’s Principles and Guidance on Human Subject Research (2020).


 Open access
Comments
No Comments have been published for this article.