


1 Introduction
Within the past two decades, an extensive amount of work has been conducted on the topic of laser-driven proton acceleration, motivated by the unprecedented properties offered by such a particle source. Indeed the emittance and time duration of a laser-driven proton beam are many orders of magnitude lower than those for conventional accelerators[Reference Cowan, Fuchs, Ruhl, Kemp, Audebert, Roth, Stephens, Barton, Blazevic, Brambrink, Cobble, Fernández, Gauthier, Geissel, Hegelich, Kaae, Karsch, Le Sage, Letzring, Manclossi, Meyroneinc, Newkirk, Pépin and Renard-LeGalloudec1]. Therefore, such a source holds promise for a broad range of new applications from biology[Reference Bulanov, Brantov, Bychenkov, Chvykov, Kalinchenko, Matsuoka, Rousseau, Reed, Yanovsky, Krushelnick, Litzenberg and Maksimchuk2] to novel energy concepts[Reference Roth, Cowan, Key, Hatchett, Brown, Fountain, Johnson, Pennington, Snavely, Wilks, Yasuike, Ruhl, Pegoraro, Bulanov, Campbell, Perry and Powell3]. Many studies have focused on advanced acceleration mechanisms in the regime of relativistic intensities[Reference Roth, Jung, Falk, Guler, Deppert, Devlin, Favalli, Fernandez, Gautier, Geissel, Haight, Hamilton, Hegelich, Johnson, Merrill, Schaumann, Schoenberg, Schollmeier, Shimada, Taddeucci, Tybo, Wagner, Wender, Wilde and Wurden4] or in the radiation pressure-dominated[Reference Robinson, Zepf, Kar, Evans and Bellei5] regimes. However, the experimental results reported so far show that the most reliable acceleration mechanism is target normal sheath acceleration (TNSA), delivering good laser-to-proton conversion efficiencies[Reference Brenner, Robinson, Markey, Scott, Gray, Rosinski, Deppert, Badziak, Batani, Davies, Hassan, Lancaster, Li, Musgrave, Norreys, Pasley, Roth, Schlenvoigt, Spindloe, Tatarakis, Winstone, Wolowski, Wyatt, McKenna and Neely6]. Such a source is needed for many applications such as proton radiography, hadron therapy and the generation of neutron beams[Reference Borghesi, Fuchs, Bulanov, MacKinnon, Patel and Roth7–Reference Macchi, Borghesi and Passoni9].
Even though there exists a large amount of research on TNSA, there is still a significant discrepancy in the experimental data reported by the laboratories working in this field[Reference Fuchs, Antici, d’Humières, Lefebvre, Borghesi, Brambrink, Cecchetti, Kaluza, Malka, Manclossi, Meyroneinc, Mora, Schreiber, Toncian, Pépin and Audebert10]. An explanation for this is the variation in parameters for different lasers and uncertainties in the assessment of important experimental properties such as the on-target intensity distribution and the exact temporal profile of the driving laser pulse at a high dynamic range. These parameters may have constructive or destructive effects on proton generation: for instance, it is well known that thinner targets deliver better performance for a given set of laser parameters. However, increasing the temporal contrast of the laser to enable shooting thin sub-micrometre targets reduces the laser absorption and has a potentially negative impact on the efficiency of TNSA[Reference Gray, Carroll, Yuan, Brenner, Burza, Coury, Lancaster, Lin, Li, Neely, Quinn, Tresca, Wahlström and McKenna11].
These parameters can be systematically controlled at the PHELIX laser (Petawatt High-Energy Laser for Heavy-Ion eXperiments)[Reference Bagnoud, Aurand, Blazevic, Borneis, Bruske, Ecker, Eisenbarth, Fils, Frank, Gaul, Goette, Haefner, Hahn, Harres, Heuck, Hochhaus, Hoffmann, Javorková, Kluge, Kühl, Kunzer, Kreutz, Merz-Mantwill, Neumayer, Onkels, Reemts, Rosmej, Roth, Stoehlker, Tauschwitz, Zielbauer, Zimmer and Witte12] at the GSI Helmholtzzentrum für Schwerionenforschung in Darmstadt, Germany, which has been in operation for more than a decade. One of the recurring topics for many experiments conducted at PHELIX is the investigation of laser-driven acceleration of light ions. This can be explained by the parameters of the laser, namely the sub-picosecond pulse duration, the high on-target energy exceeding 100 J and the ultra-high temporal contrast[Reference Bagnoud and Wagner13], which are attractive for accelerating light ions reliably.
On the way to generate reproducible proton beams, which can be used for further applications, we present a study at PHELIX comparing the influence on the ion acceleration when using a last focusing optic made of high-quality  $\unicode[STIX]{x1D706}/10$ glass or low-cost diamond-turned copper substrates. We additionally study the ion acceleration at higher incidence angles, close to $45^{\circ }$, which is beneficial for debris mitigation and therefore reduces the long-term operation cost. To enhance the proton source in this scheme, the laser polarization and temporal contrast was used as a parameter to improve the coupling efficiency from laser to ions. With these studies, we want to establish conditions for a stable and more efficient proton source in terms of particle number and maximum proton energy, while reducing the risk for the large optics due to the high amount of debris. The results of our parameter-space study will be beneficial for many high-power-laser facilities.
2 Setup
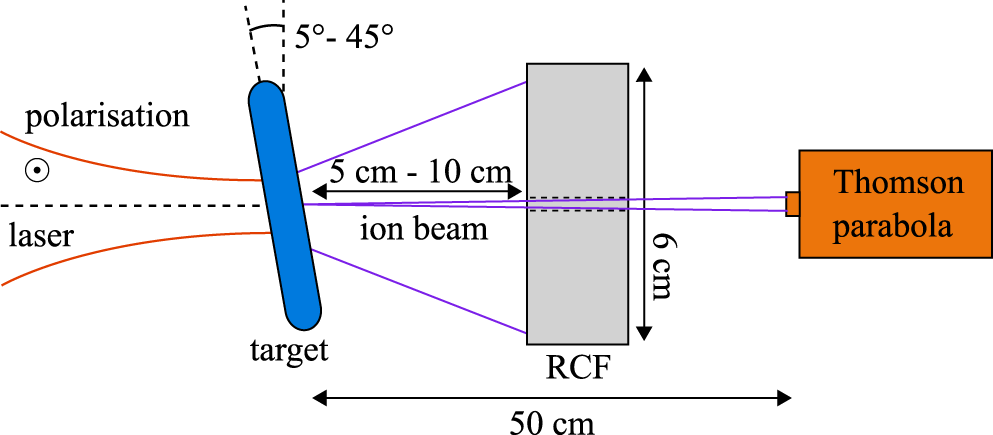
The experiments were conducted during two different campaigns, using a similar setup as shown in Figure 1. Under standard operating conditions, the laser system provides an s-polarized 28-cm beam with a maximum on-target energy of 180 J. It is focused using an F/1.7 off-axis diamond-turned copper parabola onto the target. The intensity distribution at the focus is such that 50% of the energy is included in a  $7\text{-}\unicode[STIX]{x03BC}\text{m}$-radius disk and the intensity distribution exhibits a central spot of $3{-}4~\unicode[STIX]{x03BC}\text{m}$ diameter (see Figure 2). For laser pulses with a duration equal to 500 fs, this corresponds to a maximum achievable intensity of $5\times 10^{20}~\text{W}/\text{cm}^{2}$, as discussed in detail in Section 3. The laser is focused onto a thin micrometre or sub-micrometre thick foil with varying incidence angle. The targets are mounted vertically for s-polarized interaction and tilted around the horizontal axis perpendicular to the laser beam, for the p-polarized case.
Top view of the basic setup used for laser-ion acceleration at which the laser is focused onto a thin target with varying incidence angle. The accelerated ions are captured by an RCF stack placed in the laser direction, together with a Thomson parabola, for the first setup and are rotated together with the target for the second setup.
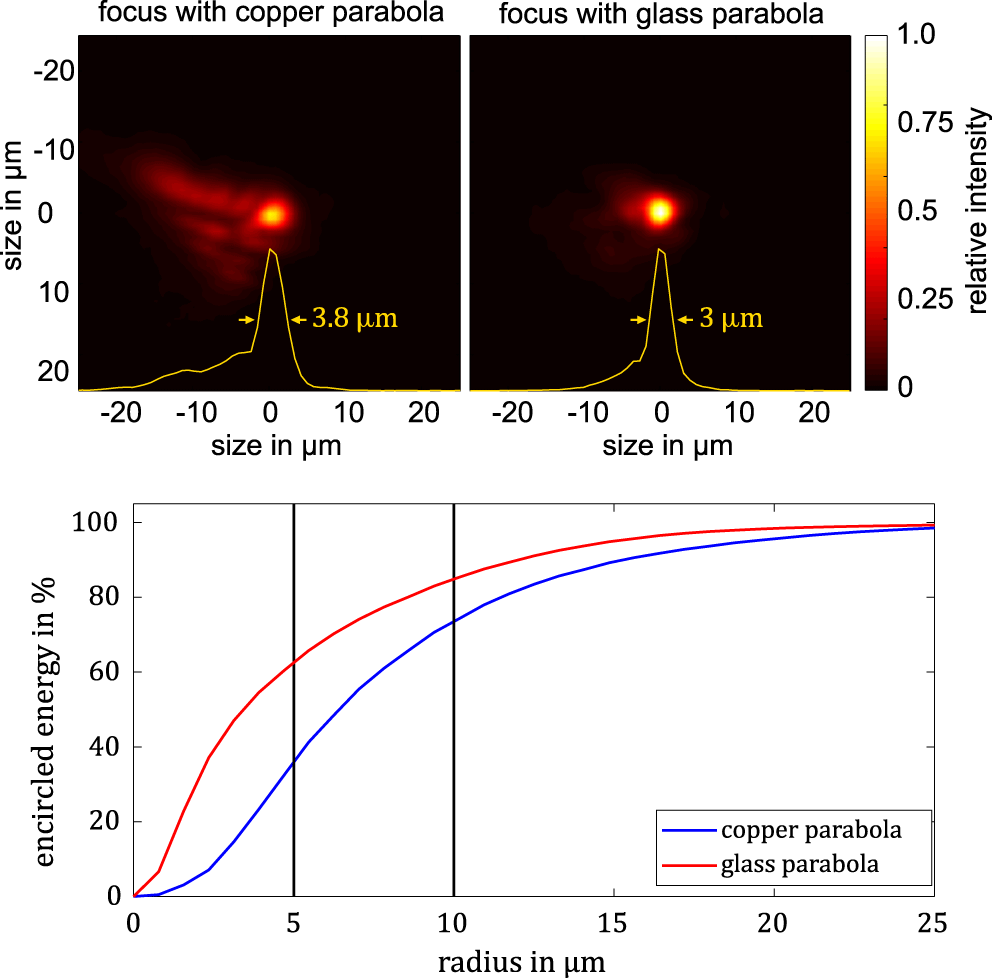
Comparison of the focal spot of the copper and glass parabolas, taken during alignment mode inside the target chamber, showing the improvement introduced by the new optic (upper half). The yellow curve corresponds to a lineout over the horizontal direction through the centre, which additionally shows the FWHM of the foci. The lower part of the figure shows the comparison of the encircled energy for both parabolas.
The accelerated ions are caught by a stack of radiochromic films (RCFs) layered in between Mylar foils. For the first campaign using an interaction angle close to normal incidence, the stack was placed in the laser direction at a distance of 10 cm. For the second campaign, the interaction angle was increased to  $45^{\circ }$, which reduces the ablation risk from laser burn-through; therefore this distance was reduced to 5 cm. This change improves the detection threshold of particles at the cut-off by a factor 4. We use HD-V2 and EBT3 (Gafchromic) films that were calibrated at the cyclotron of the Helmholtzzentrum Berlin using 68 MeV protons. For the first campaign, a 5 mm hole was drilled in the RCF stack and a Thomson parabola[Reference Schroeter14], equipped with a 0.2 mm pinhole, was placed 50 cm behind the target in the laser direction ( $0^{\circ }$). The Thomson parabola, which was designed in collaboration with the TU-Darmstadt, uses an image plate of the type BAS-IP TR. It is able to utilize a magnetic field of 0.85 T and a voltage of up to 10 kV, which enables the detection of protons with energies up to 90 MeV and an energy uncertainty of 5%. To filter the signal introduced by heavier ions and to introduce an energy calibration, the image plate was shielded by copper plates with a thickness ranging from 0.5 mm at lower energies up to 5 mm at higher proton energies.
The targets, which were manufactured at the Technische Universität Darmstadt, consist of flat foils attached to small  $500~\unicode[STIX]{x03BC}\text{m}$ thin supporting polycarbonate plates with a 5 mm opening, allowing for the laser to hit the foil with angles of incidence ranging from $0^{\circ }$ to $45^{\circ }$. They are mounted on the standard motorized 4-axis target positioning system available at the facility. The target thickness and material during the campaigns are chosen depending on the setup, ranging from 300 nm polystyrene, for normal incidence, working in the domain of relativistic transparency[Reference Kaw and Dawson15], to $10~\unicode[STIX]{x03BC}\text{m}$ gold, for pure TNSA experiments. In the case of relativistic transparency, where the laser can penetrate through the whole bulk material of the target, while still being above the nonrelativistic critical electron density of $10^{21}~\text{cm}^{-3}$, an additional energy transfer from the laser to the protons is expected[Reference Yin, Albright, Hegelich and Fernández16].
To ensure similar conditions during all shots, the beam properties are monitored at different positions in the laser chain of PHELIX. The on-shot diagnostics, measuring near- and far-field, are placed behind the main amplifier and the compressor. Additionally, the wavefront is measured after the main amplifier, using a home-made Shack–Hartmann sensor and control software[Reference Ohland, Eisenbarth, Brabetz, Bagnoud and Roth17]. This device is part of the closed-loop wavefront control system at PHELIX that corrects the static wavefront distortions.
3 Overall laser performance
The laser parameters have a decisive influence on particle acceleration. Since the on-target laser intensity cannot be measured directly, it is always inferred from the measurement of the pulse energy, the pulse duration and the focal-spot fluence distribution. The latter is not measured on-shot but during alignment with the un-amplified beam.
The on-shot energy is measured at the output of the main amplifier using a pyroelectric detector located behind a leaky mirror. This detector is cross-calibrated with a full-beam-size calorimeter capable of measuring the energy of the full beam in a range from 20 J to 5 kJ, located before the leaky mirror. This calorimeter can be self-calibrated using resistive ohmic heating to deliver absolute energy measurements. Additional passive losses introduced by the compressor and transportation to the target chamber can also be measured by a second pyrometric detector located inside the target chamber. These measurements add up to a total uncertainty of the energy of  ${\approx}5\%$.
The focal spot is measured with a Plan Apochromat microscope objective, which is aligned in the laser direction, with the image relaying the focus to the centre of a 16-bit camera chip (Hamamatsu ORCA-flash4.0 LT) located outside of the target chamber. The imaging is in total carried out by two telescopes with a total magnification of 8. After the initial alignment, the camera centre and the focal position define the target chamber centre (TCC), onto which the targets are aligned later on. The exact magnification factor is determined by moving a sharp edge in the imaging plane by a known magnitude, typically  $100~\unicode[STIX]{x03BC}\text{m}$, with a relative accuracy of $10^{-3}$. The displacement on the camera chip can therefore be correlated to the distance moved, which can be compared to the size of the pixel. The resolution of the imaging system is measured by a USAF-1951 target, which indicates a resolution below $2~\unicode[STIX]{x03BC}\text{m}$. Prior to the shot, the spatial distribution fluence is recorded by the camera, and using the experimental magnification factor, the fluence of the beam at TCC is deduced.
This measurement of the focus is additionally multiplied by an on-shot factor, which is obtained by dividing the maximum value in the far-field at the compressor diagnostic on-shot, by the value obtained prior to the shot in low energy mode, after normalizing them to the integral of the signal. This shows an increased area on-shot in which the energy is distributed, leading to an estimated on-shot intensity of only ( $75\pm 7$)% compared to the intensity estimated during alignment. This mainly originates from on-shot aberrations and a change of the beam profile from Gaussian to flat top due to the amplification process, while the contribution from nonlinear effects is likely to be negligible, as the B-integral accumulation remains below unity in the whole system, including the diagnostic path.
A larger impact on the intensity is given by the pulse duration, which was measured inside the target chamber, using a device based on FROG[Reference Kane and Trebino18]. The measurement was carried out with low energy, only using the preamplifier, and a full energy shot as a comparison. Every measured FROG trace was reconstructed several times, while utilizing the bootstrap method. The resulting mean value of the pulse duration from measurement to measurement fluctuated by 8%, peak to valley, at a pulse duration of 500 fs. However, the reconstructions dominated the dispersion with  ${\approx}15\%$ (peak to valley), which is therefore used for the pulse duration uncertainty.
In addition, the knowledge of the temporal profile of the pulse on a high dynamic range is essential, and its characteristics such as the amplified spontaneous emission (ASE) background, the specific shape of the rising slope on a picosecond time scale and the possible presence of pre-pulses may alter the target condition at the time of the interaction and prevent the use of ultra-thin targets. For this reason, the temporal contrast has to be measured with a very high dynamic range, covering 12 orders of magnitude, and a wide temporal window of 2.5 ns prior to the peak intensity[Reference Schanz, Brabetz, Posor, Reemts, Roth and Bagnoud19]. It is measured during the alignment mode prior to each experimental campaign to deliver the best knowledge of the experimental conditions. These measurements show that we reach a pre-pulse contrast of  $10^{-8}$, a few hundred ps prior to the main pulse, and an ASE-contrast of $10^{-12}$ on the ns–100 ps time scale, which can also be detuned to $10^{-6}$. The intensity ratio starts to increase at 100 ps, with a factor of 3.55 every 10 ps.
All of these parameters have an influence on the maximum proton energy that is attainable, but only some of these can be improved with a reasonably small effort.
4 Influence of the focus quality on the proton beam
A well-known approach for enhancing the maximum proton energy and particle numbers is to increase the on-target laser intensity[Reference Fuchs, Antici, d’Humières, Lefebvre, Borghesi, Brambrink, Cecchetti, Kaluza, Malka, Manclossi, Meyroneinc, Mora, Schreiber, Toncian, Pépin and Audebert10, Reference Zeil, Kraft, Bock, Bussmann, Cowan, Kluge, Metzkes, Richter, Sauerbrey and Schramm20]. Since a reduction in pulse duration is not easily obtainable, this can be done by either increasing the energy of the pulse or, due to an upper limit of 200 J for PHELIX, improving the focal spot. The sources of focal-spot degradation can be divided into two categories: static and dynamic. Beam degradation due to static aberration originates from alignment issues and the inherent quality of the optics. In general, flat optical surfaces at PHELIX are specified to have a  $\unicode[STIX]{x1D706}/10$ surface quality at 632 nm for reflective optics, in a peak-to-valley sense, which is similar to the wavefront specifications of the transmissive optics used here, leading to an accumulated wavefront distortion of ${\approx}\unicode[STIX]{x1D706}{-}2\unicode[STIX]{x1D706}$ at the end of the main amplifier section. Such static distortions are reduced by using a deformable mirror, which is installed before the main amplifier. Since it is placed close to the beginning of the laser chain, it can reliably regulate the wavefront up to the compressor input.
The situation is more complicated in and after the compressor, where the wavefront errors of the gratings ( $\unicode[STIX]{x1D706}/3$– $\unicode[STIX]{x1D706}/2$) and the last focusing parabola ( $\unicode[STIX]{x1D706}/2$) dominate the degradation of the beam. The grating quality is the highest that is available, while the choice of the diamond-turned parabola results from a trade-off between surface quality and operation cost since the debris and fluence load present in the target chamber require a refurbishment of the parabola every 12 months.
To confirm the impact of the diamond-turned parabola compared to the performance with a high-end focusing element, we exchanged the copper parabola with a dielectrically coated high-quality parabolic mirror having the same geometrical properties. This parabola exhibits a better reflected wavefront error of  $\unicode[STIX]{x1D706}/36$ (rms). A comparison of the focal spots obtained before and after the exchange can be found in Figure 2, where both distributions have been normalized to the maximum intensity (top).
Quantitatively, one can see a strong reduction of the coma-like aberration, which distributes more energy in the outer region of the focal spot. This improvement can also be quantified by looking at the encircled energy for both parabolas (bottom). The energy within a radius of  $5~\unicode[STIX]{x03BC}\text{m}$ improves by almost a factor of 2 from 35% to 62% and at $10~\unicode[STIX]{x03BC}\text{m}$ from 74% up to 85%. In terms of maximum intensity, the glass parabola provides an increase of a factor 2.8.
To evaluate the effect of this improvement on the accelerated ion characteristics, a dedicated experiment was conducted, checking the scaling of maximum proton energy and laser intensity. This is done by focusing the laser onto a 300-nm-thin polystyrene target with an incidence angle of  $5^{\circ }$, while increasing the on-target intensity by changing the laser pulse energy.
By doing so, we quickly realized that the 300-nm-thin targets showed some signs of boring for the higher laser energies when the copper parabola was used. An indicator of this is an increase in the blurred electron background seen in the RCFs[Reference Nuter, Gremillet, Combis, Drouin, Lefebvre, Flacco and Malka21]. For this reason, the later shots were carried out with  $1.5~\unicode[STIX]{x03BC}\text{m}$ thick targets of the same material. The maximum proton energy cut-off was recorded for every shot and plotted against the estimated laser intensity in Figure 3.
Scaling of the maximum proton energy in dependence on the laser intensity for different focusing optics and target thicknesses. The black dots correspond to the copper parabola with 300 nm target thickness, whereas the blue and red dots belong to the glass parabola with target thicknesses of 300 nm and  $1.5~\unicode[STIX]{x03BC}\text{m}$, respectively. The black and blue lines correspond to a fit that is proportional to $I^{1/2}$ for the copper and glass parabolas, respectively.
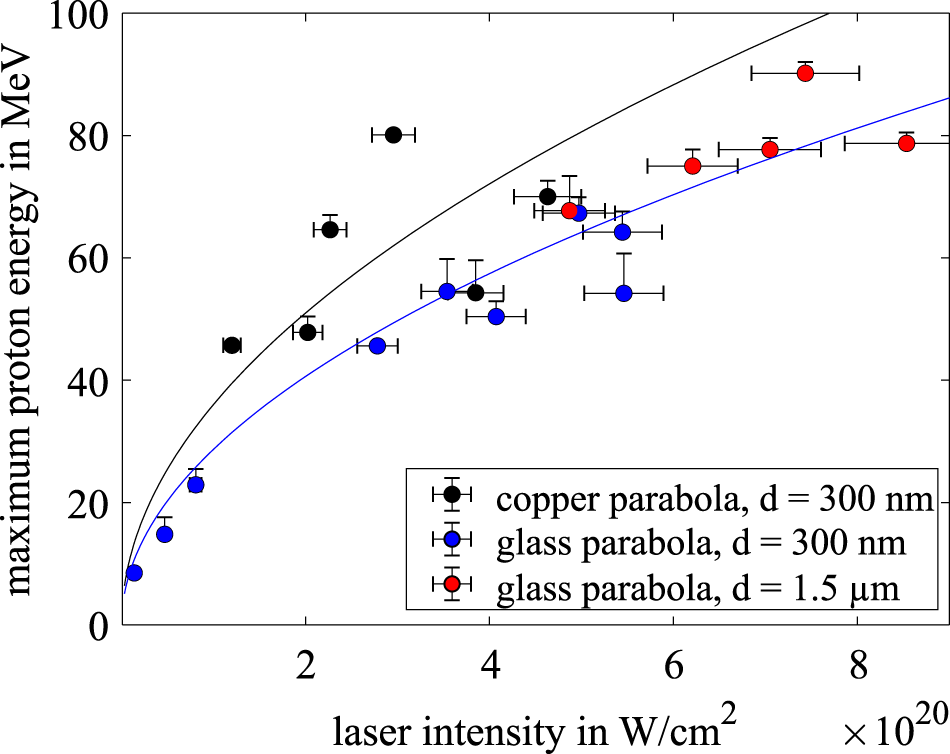
In addition, one can see that the shots carried out with the glass parabola delivered the highest proton maximum energies. For an estimated intensity of  $7\times 10^{20}~\text{W}/\text{cm}^{2}$, the maximum proton energy observed reaches up to
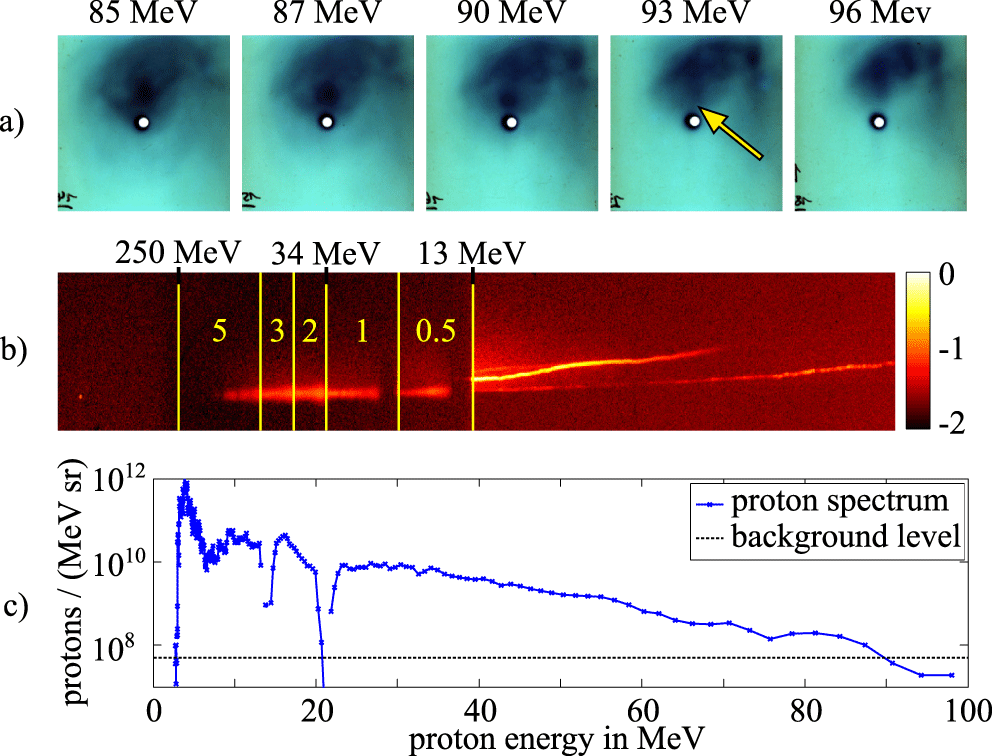
  $90\pm _{0}^{3}~\text{MeV}$, which is comparable to the currently maximum achievable proton energies obtained at other facilities[Reference Higginson, Gray, Dance, Williamson, Butler, Wilson, Capdessus, Armstrong, Green, Hawkes, Martin, Wei, Mirfayzi, Yuan, Borghesi, Clarke, Neely and McKenna22, Reference Kim, Pae, Choi, Lee, Kim, Singhal, Sung, Lee, Lee, Nickles, Jeong, Kim and Nam23], despite the use of much thicker targets. This is indicated by the yellow arrow in Figure 4(a), which shows the signal created by protons and electrons on the last five EBT3 layers. Due to a stack thickness of 5 cm, a significant straggling occurs such that the proton beam is blurred and cannot easily be distinguished from the electron beam. The darkening seen on the RCFs increases the detection threshold to $4\times 10^{9}~\text{protons}/\text{sr}$, which is unfortunately a high value. Therefore, the only possibility of telling apart the electron and the ion signal is employing the gradient of the signal between the RCF layers instead of the usually used sharp features. To confirm the obtained proton energy distribution, a second measurement was carried out with a Thomson parabola capturing protons going through the centre hole of the films (seen as a black dot in Figure 4(a)). Since the beam is not centred at the hole but rather about 10 mm above it, the Thomson parabola only recorded a signal until 85–90 MeV, which is consistent with the RCF data. The Thomson parabola reliably matched the energy obtained from the RCF stacks around the region of the hole, which provides good confidence that the signal seen on the RCFs is due to protons. Even when reducing the energy to 3 J on the target, leading to an intensity of $1.3\times 10^{19}~\text{W}/\text{cm}^{2}$, we were still able to accelerate protons up to 8.5 MeV.
Data of the PHELIX record shot showing proton energies of at least 90 MeV with a possible extension up to 93 MeV. Image (a) shows the signal at the last five EBT-layers, whereas the contrast has been enhanced to increase the visibility of the proton signal. The yellow arrow indicates the position of the highest energetic protons, close to the hole, which is used to obtain the Thomson parabola trace, shown in image (b). The lines and numbers correspond to the position and thickness in mm of the copper filters introduced in Section 2. The spectrum that is extracted from this trace is shown in figure (c), showing a transition to the background level at 85–90 MeV.
Although this represents a new record for protons accelerated at PHELIX, the values obtained show only a slight improvement compared to previous data published by our group[Reference Wagner, Deppert, Brabetz, Fiala, Kleinschmidt, Poth, Schanz, Tebartz, Zielbauer, Roth, Stöhlker and Bagnoud24]. To analyse the difference, a square-root fit to the experimental data has been carried out, using a least-squares error merit function, which is shown in Figure 3, in solid black and blue for the copper and glass parabola results, respectively. This shows a strong scattering of the data points in particular for the copper parabola. The obtained curves differ by more than 20%, which contradicts the traditional models of ion acceleration[Reference Mora25, Reference Schreiber, Bell, Grüner, Schramm, Geissler, Schürer, Ter-Avetisyan, Hegelich, Cobble, Brambrik, Fuchs, Audebert and Habs26], which was later extensively confirmed by particle-in-cell simulations[Reference Esirkepov, Yamagiwa and Tajima27], in which the particle energy depends on the intensity following an  $I^{1/2}$ rule.
The first explanation for the deviation from the  $I^{1/2}$ dependence could be a systematic error in the estimation of the on-target laser intensity, which differs for both parabolas. Since the sources for beam distortions are manifold, this would indicate that the on-shot aberrations of the system mask the improvement introduced by the glass parabola. As an example, one reason could be a defocus, occurring on-shot, subsequently moving the focal plane away from the target, while not limiting the focal size by the introduced or reduced aberration. Due to the short Rayleigh range of ${\approx}10~\unicode[STIX]{x03BC}\text{m}$, such a defocus is easily introduced by a slight mismatch between the focal plane and the target position. However, the need to switch from ultra-thin to micrometric targets when changing the parabola is a qualitative validation of an intensity increase, when the glass parabola was used.
The second reason for that could be related to the energy distribution, since the central spot of the focus gains energy, and therefore intensity when using the glass parabola, but its surrounding loses energy. This would lead to an increased contribution to the acceleration at the centre, and a reduction in the impact from the outer regions, only leading to a minor total increase.
Scaling of the maximum proton energy in dependence on the laser power for different focusing optics for the same parameters as shown in Figure 3. The lines correspond to the laser power scaling mentioned by Zeil et al. [Reference Zeil, Kraft, Bock, Bussmann, Cowan, Kluge, Metzkes, Richter, Sauerbrey and Schramm20].

Since the scaling of the maximum proton energy with the laser intensity does not seem conclusive to draw a rule of thumb, a better picture can be obtained from a scaling law based on the laser peak power, as shown in Figure 5. The black line corresponds to the power scaling of the maximum proton energy following Zeil et al. [Reference Zeil, Kraft, Bock, Bussmann, Cowan, Kluge, Metzkes, Richter, Sauerbrey and Schramm20] with a conversion efficiency of laser energy to electrons of 14%. One can see a good agreement for every shot condition, i.e., the data seem to follow a square-root law of the laser power, regardless of the type of parabola used and the target thickness. Nevertheless, the relative dispersion of the data around the fit reaches up to 34%, which is quite high, indicating that other parameters can be at play behind this fluctuation. Alternatively, it is possible that for higher laser powers, the acceleration process is no longer purely dominated by TNSA, but other mechanisms come into play. However there is no direct evidence for this from our current measurements.
The conclusion to this first study is that the use of a better optical focusing element brings a measurable although slight improvement to laser-driven ion acceleration, with a new record of  $90\pm _{0}^{3}~\text{MeV}$ for protons accelerated with PHELIX. Our study also shows that the maximum ion energy does not scale with the laser intensity, but a dependence was found with respect to the laser power. We conclude from this that in the TNSA regime, the acceleration mechanism does not strongly depend on the quality of the focal spot.
5 Enhancement of the proton source for day-to-day operation
As mentioned, it is of interest to reduce the amount of debris deposited on the focusing element and therefore the operation cost. Many of the usual methods relying on the use of a debris shield are hard to implement at PHELIX because of the combined difficulties arising from the short pulse duration, the large beam size and the incidence angle of  $45^{\circ }$ of the parabolic mirror. However, satisfactory debris mitigation is obtained by rotation of the target to a larger incidence angle so that the plasma plume does not hit the parabola. The goal is now to improve the ion acceleration in the mentioned scheme, by decreasing the target reflectivity, thus increasing the energy coupling from the laser to the target.
There are two strategies that can easily be implemented at PHELIX to increase laser absorption. One possibility is of increasing the preplasma formation[Reference Ping, Shepherd, Lasinski, Tabak, Chen, Chung, Fournier, Hansen, Kemp, Liedahl, Widmann, Wilks, Rozmusand and Sherlock28] by decreasing the nanosecond temporal contrast of the laser, which was demonstrated by an earlier work of our group[Reference Wagner, João, Fils, Gottschall, Hein, Körner, Limpert, Roth, Stöhlker and Bagnoud29]. By doing so, a density of  ${\approx}10^{20}~\text{cm}^{-3}$ is reached at $30{-}40~\unicode[STIX]{x03BC}\text{m}$ in front of the initial target surface, instead of $5~\unicode[STIX]{x03BC}\text{m}$, when using the high-contrast option. A second solution relies on changing the polarization from s to p to trigger additional absorption mechanisms[Reference Chen, Zhang, Dong, Teng, Liang, Zhao and Wei30].
Both approaches have been tested and compared to the regular setup with s-polarization, a high temporal contrast of  $10^{-12}$ and a target thickness of $1~\unicode[STIX]{x03BC}\text{m}$, while utilizing the previously mentioned copper parabola as the last focusing optic.
The first configuration is carried out with a nanosecond temporal contrast of  $10^{-6}$, while using a $10~\unicode[STIX]{x03BC}\text{m}$ thick gold target to prevent the laser from burning through the foil due to the higher pre-heating. For the second configuration, the laser polarization is switched from s- to p-polarization, by rotation of the target around the laser propagation axis, conserving the incidence angle of $45^{\circ }$ and the target thickness of $1~\unicode[STIX]{x03BC}\text{m}$. This was the simplest way to implement the polarization rotation since due to the large size of the beam of 28 cm, the manufacturing and implementation of a waveplate are not straightforward. The ion diagnostic used was limited to RCFs in this setup since the implementation of the Thomson parabola was not feasible with the rotated target geometry.
Maximum proton energy depending on the laser peak power for different laser and setup parameters at  $45^{\circ }$ incidence angle. The lines show the corresponding laser-power fit by Zeil et al. [Reference Zeil, Kraft, Bock, Bussmann, Cowan, Kluge, Metzkes, Richter, Sauerbrey and Schramm20].
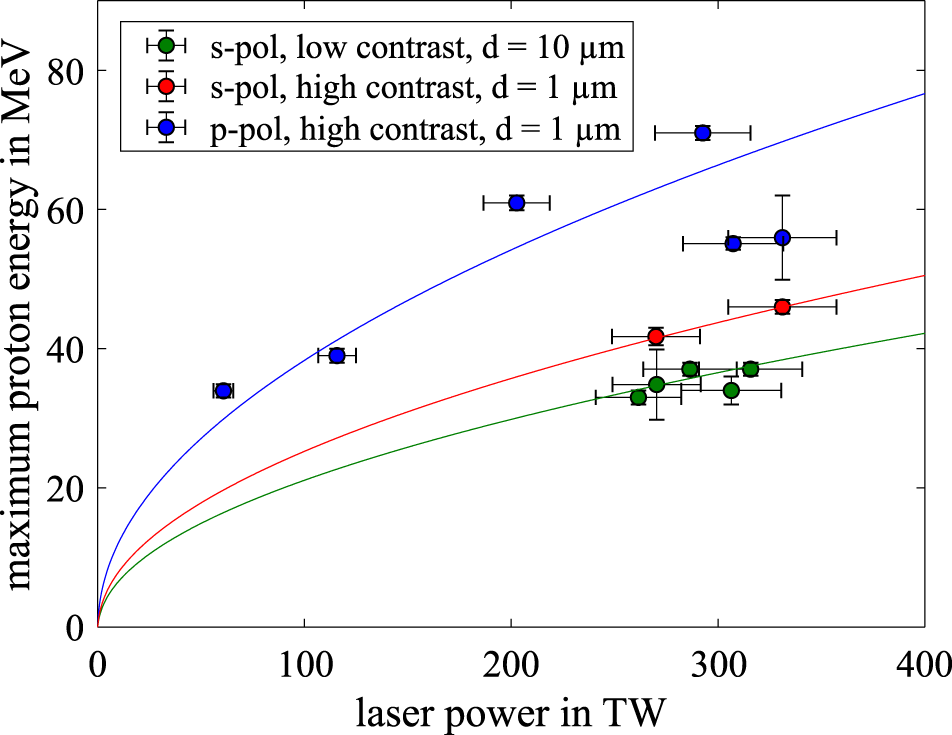
The dependence of the maximum proton energy on the peak power for the three different setups can be seen in Figure 6. The low-contrast option combined with the thick target (green) yields proton energies of up to 38 MeV, which systematically underperforms the standard option by about 15% (red). This means that a compensation of the high reflectivity of the s-polarized light through a larger preplasma does not overcome the drawback of the thicker target. In contrast, a rotation of the target to reach p-polarization conditions increases the maximum proton energy by  ${\approx}60\%$ up to 71 MeV (blue). There are several mechanisms that can explain this effect, and given the small plasma scale length during the interaction, the most likely one is vacuum heating[Reference Bauer and Mulser31], but this still remains to be confirmed. Nevertheless, the second configuration shows a significant improvement, and it should be considered whenever the nonhorizontal emission direction of the proton beam can be accommodated. The second configuration was also repeated with a $1~\unicode[STIX]{x03BC}\text{m}$ thick polystyrene target, showing no major differences from the gold target.
Proton spectrum for each configuration with comparable laser power on target. The exponential function is obtained by an iterative fit to the deposited energy in the RCF layers, whereas the circles are obtained by sequential deconvolution of the signal from the last layer from the previous ones.
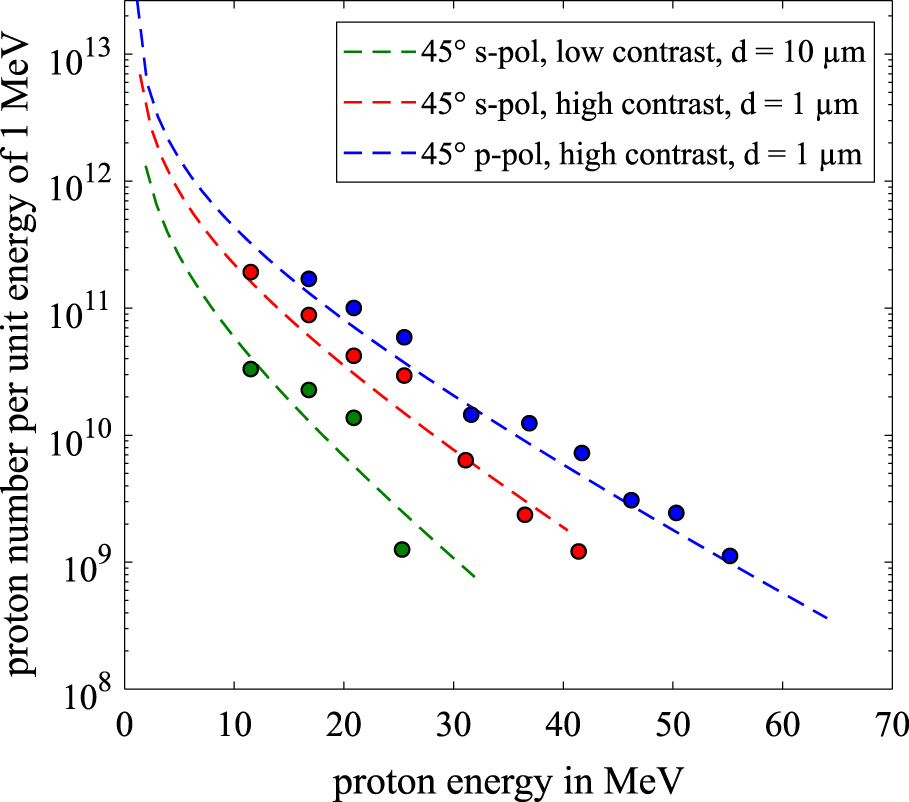
We reconstructed the proton energy spectra based on the RCF stack available and plotted the results for the various configurations, which were obtained with similar laser powers, in Figure 7. Examining the RCF stacks of the red and blue curves reveals that the conversion efficiency of laser energy to protons above 10 MeV is increased from 3.9% up to 5.2%, which is also supported by an increase in the total number of accelerated particles in this region by  ${\approx}57\%$ up to $3.2\times 10^{12}$ particles.
Comparison of the maximum proton energy scaling dependent on the laser peak power for the first beamtime (blue) and the p-polarization setup (red), both conducted with a high contrast. Despite the large angle difference of  $40^{\circ }$, the scaling is similar in both cases.

Figure 8 compares the results obtained with similar laser powers for both beamtimes close to normal incidence and s-polarization in addition to the  $45^{\circ }$ p-polarization setup, whereas both cases operate with the high contrast. Here, one can note that, within the scattering of the experimental data points, both configurations deliver similar results. In particular, the fit functions derived from the scaling law by Zeil et al. [Reference Zeil, Kraft, Bock, Bussmann, Cowan, Kluge, Metzkes, Richter, Sauerbrey and Schramm20] are similar, despite a reduced laser intensity by the use of the standard copper parabola and the $45^{\circ }$ interaction angle. This means that the improvement introduced by the increased absorption using p-polarization cancels out the reduction in intensity introduced by the large interaction angle, while maintaining the debris mitigation.
6 Summary
We have performed two experimental campaigns, focusing on the enhancement of laser-ion acceleration with the high-power laser PHELIX. The goal of these was to optimize the maximum achievable proton energy and particle numbers, while working under experimental conditions that minimize operation cost. This was done by improving the quality of the focal spot, which increased the expected intensity by a factor of 2.8 up to  $8\times 10^{20}~\text{W}/\text{cm}^{2}$. Despite the increase in intensity, the scaling of the maximum proton energy deviated from the expected behaviour, resulting in a minimal increase in proton energies for both conditions, indicating that the acceleration is more sensitive to a change in laser power than in focal quality. Despite this behaviour, a new record maximum proton energy for PHELIX of at least $90\pm _{0}^{3}~\text{MeV}$ was achieved. We additionally studied different methods to increase the laser absorption when using a large incidence angle of $45^{\circ }$. This was done first by increasing the preplasma formation when using a low nanosecond contrast of $10^{-6}$ and a target thickness of $10~\unicode[STIX]{x03BC}\text{m}$ and second by changing the incidence polarization of the laser relative to the target from s- to p-polarization with a target thickness of $1~\unicode[STIX]{x03BC}\text{m}$. Enhancing the preplasma showed no major increase in the particle number and energy, whereas switching from s- to p-polarization increased the maximum proton energy by ${\approx}60\%$ up to 71 MeV and the number of particles by ${\approx}57\%$ up to $3.2\times 10^{12}$ protons above 10 MeV. This knowledge can improve many applications that rely on high energy and particle numbers, while reducing the amount of debris on the last focusing optic.
Acknowledgements
This work has been carried out within the framework of the EUROfusion Consortium and has received funding from the Euratom research and training programme 2014–2018 and 2019–2020 under grant agreement No. 633053. The views and opinions expressed herein do not necessarily reflect those of the European Commission.


 Open access