


1. Introduction
A large proportion of the energy required in transportation and pipe systems is used to overcome fluid-dynamic drag. In particular, skin friction constitutes approximately  $50\,\%$ of the total drag on aircraft and ships, up to
  $90\,\%$ for very large crude carriers (Monty et al. Reference Monty, Dogan, Hanson, Scardino, Ganapathisubramani and Hutchins2016) and almost all the drag in pipelines. Hence, reduction in skin friction can bring a substantial energy saving. Riblets are streamwise-aligned micro-grooves that can reduce skin-friction drag by up to
  $10\,\%$ in laboratory conditions (Bechert et al. Reference Bechert, Bruse, Hage, van der Hoeven and Hoppe1997) and approximately
  $5\,\%$ at full-scale conditions (Spalart & McLean Reference Spalart and McLean2011), and are therefore considered one of the most promising techniques of passive drag reduction. Indeed, the International Civil Aviation Organization in its 2019 environmental report (ICAO 2019) explicitly mentions riblets as a promising passive technique for reducing drag over aircraft. Pioneering studies on riblets can be traced back to the experiments of Kennedy, Hsu & Lin (Reference Kennedy, Hsu and Lin1973), who suggested that the mean wall-shear stress over a finned surface may be reduced, due to the reduction of wall-shear stress towards the riblet trough. After this seminal work a considerable amount of experimental (Walsh Reference Walsh1980, Reference Walsh1982; Bechert & Bartenwerfer Reference Bechert and Bartenwerfer1989; Bechert et al. Reference Bechert, Bruse, Hage, van der Hoeven and Hoppe1997) and numerical (Choi, Moin & Kim Reference Choi, Moin and Kim1993; Chu & Karniadakis Reference Chu and Karniadakis1993; Goldstein, Handler & Sirovich Reference Goldstein, Handler and Sirovich1995; García-Mayoral & Jiménez Reference García-Mayoral and Jiménez2011; Bannier, Garnier & Sagaut Reference Bannier, Garnier and Sagaut2015) studies appeared in the literature, but despite this effort, riblets are not widely used in engineering applications, for different reasons. Flight tests carried out on an aircraft with
  $70\,\%$ of its surface covered with riblets have shown a drag reduction of approximately
  $2\,\%$ (Szodruch Reference Szodruch1991), consistent with the aforementioned
  $5\,\%$ of
  $50\,\%$, but this reduction in drag becomes only marginally convenient when the additional costs of manufacturing and maintenance are considered (Robert Reference Robert1992). Therefore, in order to have riblets that are more cost-efficient, groove geometries capable of larger drag reduction are desirable. At present, the maximum drag reduction achievable by classical riblets is limited by our understanding of their flow physics.
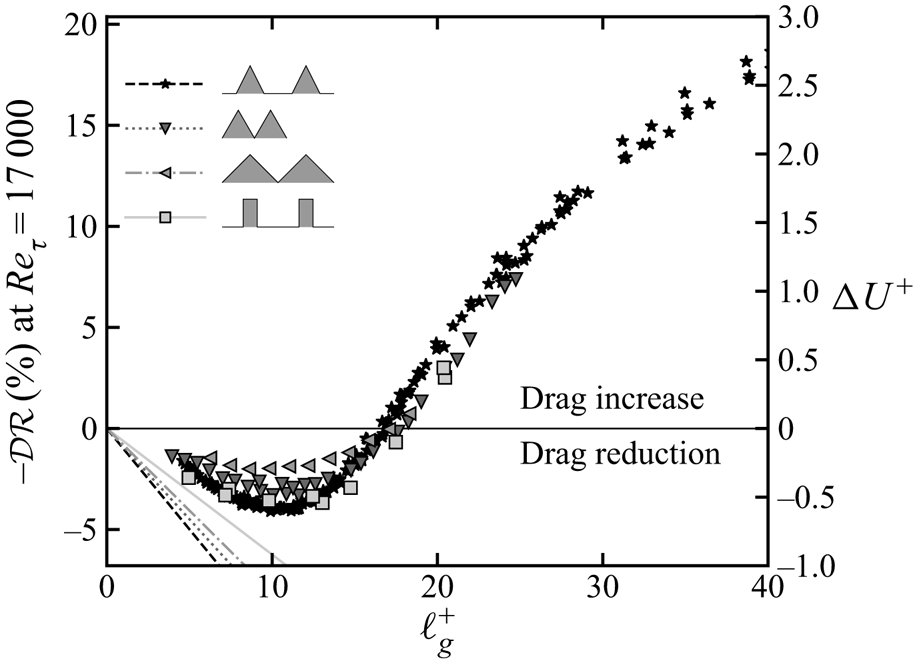
Figure 1 shows the velocity shift with respect to the smooth wall  $\Delta U^+$ and the drag reduction
  $\mathcal {DR}\approx -\Delta U^+\sqrt {2C_{fs}}$ (Spalart & McLean Reference Spalart and McLean2011) as a function of the viscous-scaled square root of the groove area
  $\ell _g^+\equiv \ell _g/\delta _v$,
  $\ell _g\equiv \sqrt {A_g}$ (where
  $A_g$ is the groove area,
  $\delta _v\equiv \nu /u_\tau$ is the viscous length scale,
  $\nu$ is the kinematic viscosity of the fluid,
  $u_\tau \equiv \sqrt {\tau _w/\rho }$ is the friction velocity,
  $\tau _w$ is the mean wall-shear stress, i.e. drag per unit wall-plane area, and
  $\rho$ is the fluid density). The regime in which riblets reduce drag is referred to as the viscous or linear regime as drag decreases linearly with the riblet size up to an optimum (
 $\ell _g^+\approx 11$). However, further increasing
  $\ell _g^+$ leads to degradation of the linear regime and riblets eventually increase drag. The drag reduction in the linear regime has been extensively studied, and different authors seem to agree on the flow physics of small riblets. Bechert, Hoppe & Reif (Reference Bechert, Hoppe and Reif1985); Bechert et al. (Reference Bechert, Bartenwerfer, Hoppe and Reif1986) attributed the drag reduction to the capability of riblets to inhibit the spanwise motion of streamwise vortices in the viscous sublayer,
  $z^+\equiv z/\delta _v\lesssim 5\text {--}6$, where
  $z$ is the distance from the wall. A different interpretation of basically the same drag-reducing mechanism has been given by Choi et al. (Reference Choi, Moin and Kim1993), Suzuki & Kasagi (Reference Suzuki and Kasagi1994) and Goldstein et al. (Reference Goldstein, Handler and Sirovich1995), who showed that riblets lift these vortices farther from the wall, with subsequent relief of the turbulent stress. These vortices have a diameter of approximately
  $30\delta _v$ (Lee & Lee Reference Lee and Lee2001), in agreement with the observation that riblets with a smaller spacing reduce drag by preventing the lodgement of these vortices into the grooves. This interpretation progressed towards a more quantitative idea that riblets reduce drag by shifting the location at which the streamwise turbulent flow perceives the equivalent smooth wall, or virtual origin (Bechert & Bartenwerfer Reference Bechert and Bartenwerfer1989). Different definitions of virtual origin are available in the literature which involve, for instance, best fitting of the law-of-the-wall (Hooshmand, Youngs & Wallace Reference Hooshmand, Youngs and Wallace1983) or matching the location of the maximum in the streamwise velocity fluctuations (Choi et al. Reference Choi, Moin and Kim1993). Luchini et al. (Reference Luchini, Manzo and Pozzi1991) showed that the appropriate quantity that relates to the drag reduction, is the difference between the location of the virtual wall seen by the streamwise flow and that seen by the spanwise flow,
  $\Delta h\equiv h_\parallel -h_\perp$. For small sizes (
 $s^+\lesssim 5$), these virtual locations
  $h_\parallel$ and
  $h_\perp$, called protrusion heights, can be readily calculated using the Stokes approximation and their difference is proportional to the drag reduction
  $\mathcal {DR}\sim \Delta h^+$ (figure 1 and García-Mayoral, Gómez-de-Segura & Fairhall Reference García-Mayoral, Gómez-de-Segura and Fairhall2019). The difference in protrusion heights can be used to design and optimize riblets in the viscous regime, in which drag reduction increases indefinitely with riblet size, but fails to describe the drag increase relative to the optimum.
Drag reduction curve at friction Reynolds number  $Re_\tau=17\ 000$ typical of aircraft wing (left axis) and velocity shift with respect to the smooth wall
  $\Delta U^+$ (right axis) as a function of the viscous-scaled square root of groove area
  $\ell _g^+=\ell _g/\delta _v$. Here,
  $\Delta U^+$ values are reported for the riblets data of Gatti et al. (Reference Gatti, von Deyn, Forooghi and Frohnapfel2020, stars), Bechert et al. (Reference Bechert, Bruse, Hage, van der Hoeven and Hoppe1997, triangles) and García-Mayoral & Jiménez (Reference García-Mayoral and Jiménez2012, (squares)). Straight lines indicate slopes for infinitely small riblets of the four shapes calculated in the Stokes-flow limit (Luchini, Manzo & Pozzi Reference Luchini, Manzo and Pozzi1991).
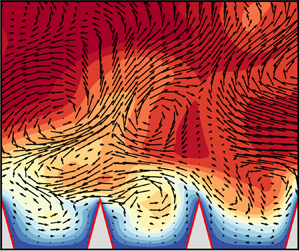
Several mechanisms have been proposed to explain the disruption of the viscous-flow regime, which in one way or another can all be traced back to turbulence, i.e. a non-negligible inertial flow near riblets. Choi et al. (Reference Choi, Moin and Kim1993) inspected instantaneous flow visualizations of the cross-stream plane and attributed the drag increase to the lodgement of the streamwise vortices inside the riblets grooves when these become larger than the vortices’ diameter ( $s^+\gtrsim 20$). They also observed the appearance of non-zero mean (time-averaged) cross-stream velocities in the riblet grooves, similar to the secondary motions found in non-circular ducts (Prandtl Reference Prandtl1926), with the main difference that the former only appear in the riblets vicinity, whereas the latter retain a large-scale contribution, occupying the whole cross-stream section (Pirozzoli et al. Reference Pirozzoli, Modesti, Orlandi and Grasso2018). Other authors addressed the correlation between secondary velocities, or dispersive velocities, and the drag increase over riblets. Suzuki & Kasagi (Reference Suzuki and Kasagi1994) carried out experiments using three-dimensional particle tracking velocimetry and observed the formation of mean cross-stream velocities over riblets operating beyond the drag optimum. They attributed the drag increase to the additional momentum transport caused by these secondary velocities, although they did not quantify their contribution to the drag variation. Goldstein & Tuan (Reference Goldstein and Tuan1998) used direct numerical simulation (DNS) to study the dispersive velocities, forming over large-spaced riblets and attributed them to the drag increase, arguing that the loss of performance occurring for large riblets could be tackled by disrupting these secondary velocities which also contribute to the total stress. The additional stress carried by the secondary, or dispersive, velocities is referred to as dispersive stress and is absent in smooth-wall turbulent flows. Both the dispersive and turbulent stress can be traced back to inertial momentum transfer, but the dispersive stresses represent spatial variations in the time-averaged mean about the riblets, and turbulent stresses represent fluctuations about this spatially varying mean.
Another mechanism has been proposed by García-Mayoral & Jiménez (Reference García-Mayoral and Jiménez2011), who observed that large riblets also trigger the onset of spanwise-coherent vortical structures, which are visible in the two-dimensional pre-multiplied velocity spectrum right above the riblet crest, and are similar to Kelvin–Helmholtz rollers, which represent an additional contribution to the Reynolds stress. Their stability analysis over a modelled impedance boundary condition shows that the growth rate of these rollers is proportional to the square root of the groove area, which suggested the use of  $\ell _g^+$ as a scaling parameter to compare drag reduction in riblets with different geometries (García-Mayoral & Jiménez Reference García-Mayoral and Jiménez2011).
This literature survey shows that there is still little consensus on the physical mechanisms responsible for the degradation of the riblets drag-reducing performance. Given the more recent date of the study on Kelvin–Helmholtz-like rollers, this mechanism has been considered the only cause of the linear-regime breakdown in recent years. However, Endrikat et al. (Reference Endrikat, Modesti, MacDonald, García-Mayoral, Hutchins and Chung2020, Reference Endrikat, Modesti, García-Mayoral, Hutchins and Chung2021) recently used the present DNS dataset to study how the groove shape affects the Kelvin–Helmholtz-like rollers and found that they are only active for certain riblet geometries, namely sharp triangles and blades. Nevertheless, all riblet shapes exhibit the linear-regime breakdown eventually leading to a drag increase, thus pointing to a possible route to performance degradation that is unrelated to Kelvin–Helmholtz rollers.
Although most studies of riblets are mainly focused on two-dimensional straight symmetric geometries, flow cases over three-dimensional riblets have been performed. Bechert et al. (Reference Bechert, Bartenwerfer, Hoppe and Reif1986) argued that a staggered arrangement of short riblets may be able to increase the maximum attainable drag reduction, due to a larger streamwise protrusion height caused by a larger effective spanwise spacing. However, in a more recent experiment (Bechert, Bruse & Hage Reference Bechert, Bruse and Hage2000), they instead found lower drag reduction with respect to the two-dimensional riblets. Sasamori et al. (Reference Sasamori, Mamori, Iwamoto and Murata2014, Reference Sasamori, Iihama, Mamori, Iwamoto and Murata2017) carried out experiments and DNS of three-dimensional sinusoidal riblets and, despite the additional pressure drag contribution, found higher drag reduction with respect to two-dimensional riblets. Kevin et al. (Reference Kevin, Monty, Bai, Pathikonda, Nugroho, Barros, Christensen and Hutchins2017) performed stereoscopic particle image velocimetry of developed boundary layers over herringbone (large patches of converging–diverging yawed) riblets and observed large-scale mean secondary flows in the cross-stream plane. Drag reduction for this configuration has been quantified by Benschop & Breugem (Reference Benschop and Breugem2017), who carried out DNS of channel flow over herringbone riblets and found that they can both decrease or increase drag, depending on the wavelength of the spanwise texture, but the effect of the large-scale secondary flow is always detrimental for drag reduction. Boomsma & Sotiropoulos (Reference Boomsma and Sotiropoulos2016) performed DNS of three-dimensional riblets that closely resemble the denticles found on shark skin and found that three-dimensionality limits the drag reduction due to the large increase in pressure drag.
Despite the extensive work carried out on riblets, the following fundamental aspects of the flow physics are not yet fully understood: (i) the precise effect of the groove shape, (ii) whether the mechanism of drag increase is universal and (iii) the effect of spanwise asymmetry. On point (i), most parametric studies involving the effect of the geometry have been carried out through experiments (Walsh Reference Walsh1982; Bechert et al. Reference Bechert, Bruse, Hage, van der Hoeven and Hoppe1997), which do not provide access to the three-dimensional flow field, whereas DNS studies of two-dimensional riblets are limited to triangular and blade geometries (Choi et al. Reference Choi, Moin and Kim1993; García-Mayoral & Jiménez Reference García-Mayoral and Jiménez2011). On point (ii), different mechanisms have been proposed for the breakdown in drag reduction, but often these are based on observations from particular distinct riblet geometries. For example the analysis of Goldstein & Tuan (Reference Goldstein and Tuan1998) of secondary flows was based on DNS of triangular riblets, while the observations of García-Mayoral & Jiménez (Reference García-Mayoral and Jiménez2011) of the Kelvin–Helmholtz instability were based on DNS of blade riblets. In a recent study (Endrikat et al. Reference Endrikat, Modesti, García-Mayoral, Hutchins and Chung2021) we showed that not all riblet shapes trigger the onset of Kelvin–Helmholtz rollers, revealing that the effect of the groove geometry might be more important than previously thought. What is needed is a systematic study across a broad parameter space to assess the validity and generality of the various proposed mechanisms. To this end, we carry out DNS of minimal-channel flow over many symmetric riblet geometries, namely triangular, trapezoidal and blade riblets, to understand if a common mechanism leading to the drag increase exists. On point (iii), we study the flow over two-dimensional triangular riblets, asymmetric in the spanwise direction (Walsh Reference Walsh1982). These riblets could induce a non-zero mean cross-flow that will effectively behave similarly to yawed straight riblets, without pressure drag penalty.
2. Methodology
We solve the incompressible Navier–Stokes equations,
 \begin{equation} \frac{\partial u_j}{\partial x_j} = 0,\quad \frac{\partial u_i}{\partial t} +\frac{\partial u_iu_j}{\partial x_j} ={-} \frac{1}{\rho}\frac{\partial p}{\partial x_i} + \nu\frac{\partial ^2 u_i}{\partial x_j^2} + \varPi\delta_{i1}, \end{equation}
where  $\varPi >0$ is the uniform and constant kinematic pressure gradient, driving the flow in the streamwise direction. The streamwise, spanwise and wall-normal directions are denoted as
  $x$,
$x$,  $y$,
$y$,  $z$, respectively and the velocity components in the corresponding directions are
  $u$,
$u$,  $v$,
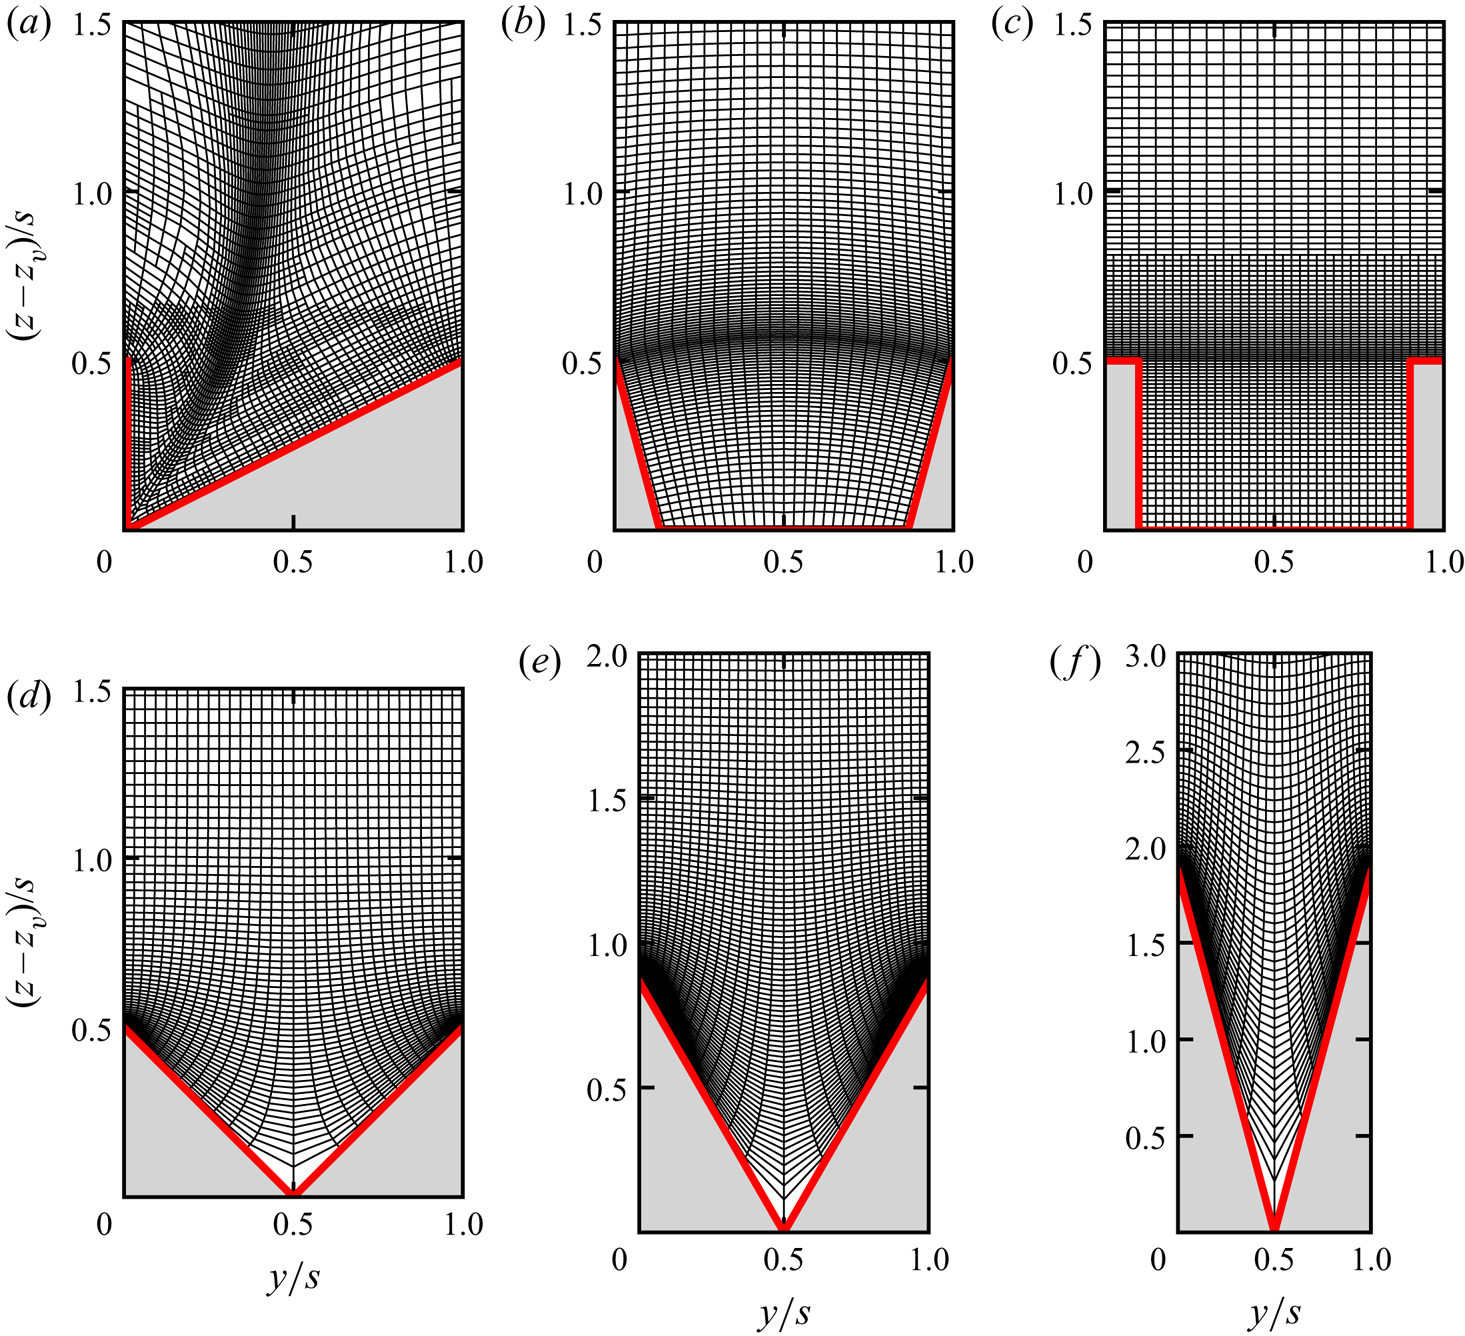
$v$,  $w$. Figure 2 shows the computational body-fitted mesh used for different riblet geometries. All meshes are constituted by tetrahedral elements, in which adjacent cells do not necessarily share the same number of nodes at the interface (hanging nodes) (figure 2a,c).
Computational mesh for different riblets: (a) asymmetric triangular AT50, (b) trapezoidal TA50, (c) blade BL50, (d) triangular TI950, (e) triangular TI635, ( f) triangular TI321. Here,  $z_v$ indicates the riblet valley.
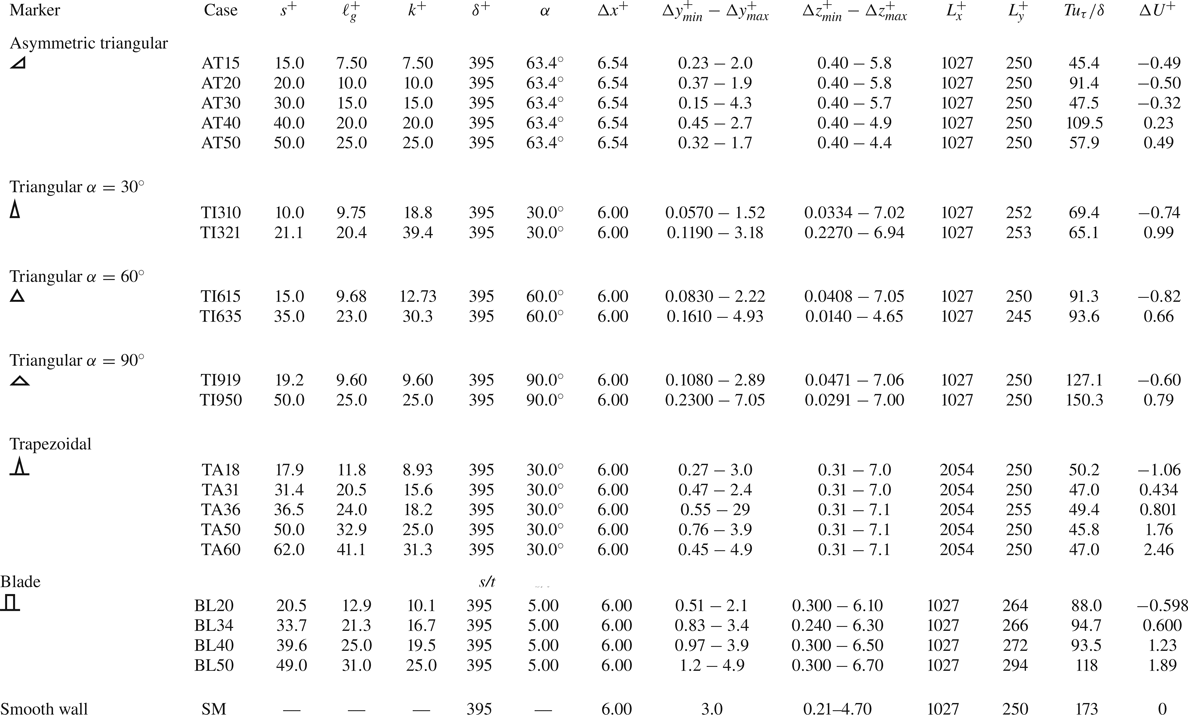
Flow cases are reported in table 1 and a representative case name is assigned to each riblet groove. For asymmetric triangular riblets we use the acronym AT, for symmetric triangular riblets TI, for trapezoidal riblets TA and for blades BL. Symmetric riblet cases contain the tip angle  $\alpha$ and the spacing in viscous units
  $s^+$, whereas all other cases only contain
  $s^+$. For instance, triangular riblets with tip angle
  $30^\circ$ and spacing
  $s^+=10$ are denoted as TI310, whereas blades riblet with spacing
  $s^+=20$ are denoted as BL20. As for the choice of the riblet geometry, for asymmetric triangles, triangles with tip angle
  $\alpha =90^\circ$, blades and trapezoids we fixed the ratio
  $k/s=0.5$, and we also consider triangular riblets with tip angle
  $\alpha =30^\circ$ and
  $\alpha =60^\circ$. We consider five asymmetric triangular riblet sizes, and two triangular riblet sizes for each tip angle, as the former geometry has not been previously studied, whereas extensive literature is available for the latter (Choi et al. Reference Choi, Moin and Kim1993; Goldstein & Tuan Reference Goldstein and Tuan1998; Li & Liu Reference Li and Liu2018). Moreover, the dataset is skewed in favour of riblets with larger sizes than those typically considered optimal in terms of drag reduction
  $\ell _g^+\approx 11$ (García-Mayoral & Jiménez Reference García-Mayoral and Jiménez2011). This choice is motivated by our intention to study the flow mechanisms responsible for the drag increase, which is less understood than the viscous regime (which can be studied in terms of linear mechanism of Luchini et al. Reference Luchini, Manzo and Pozzi1991).
DNS cases of minimal open-channel flow;  $s^+=s/\delta _v$ and
  $\ell _g^+=\ell _g/\delta _v$, respectively, the viscous-scaled riblet spacing and square root of the groove area,
  $\ell _g\equiv \sqrt {A_g}$;
  $\Delta x^+$ is the viscous-scaled mesh spacing in the streamwise direction and
  $\Delta y_{min}^+-\Delta y_{max}^+$,
 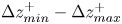 $\Delta z_{min}^+-\Delta z_{max}^+$ the minimum and maximum mesh spacing in the spanwise and wall-normal directions;
  $L_x^+$ and
  $L_y^+$ are the viscous-scaled dimensions of the computational domain in the streamwise and spanwise directions, respectively;
  $T$ is the time-averaging interval. Symbols in the first column indicate figure markers for different geometries.
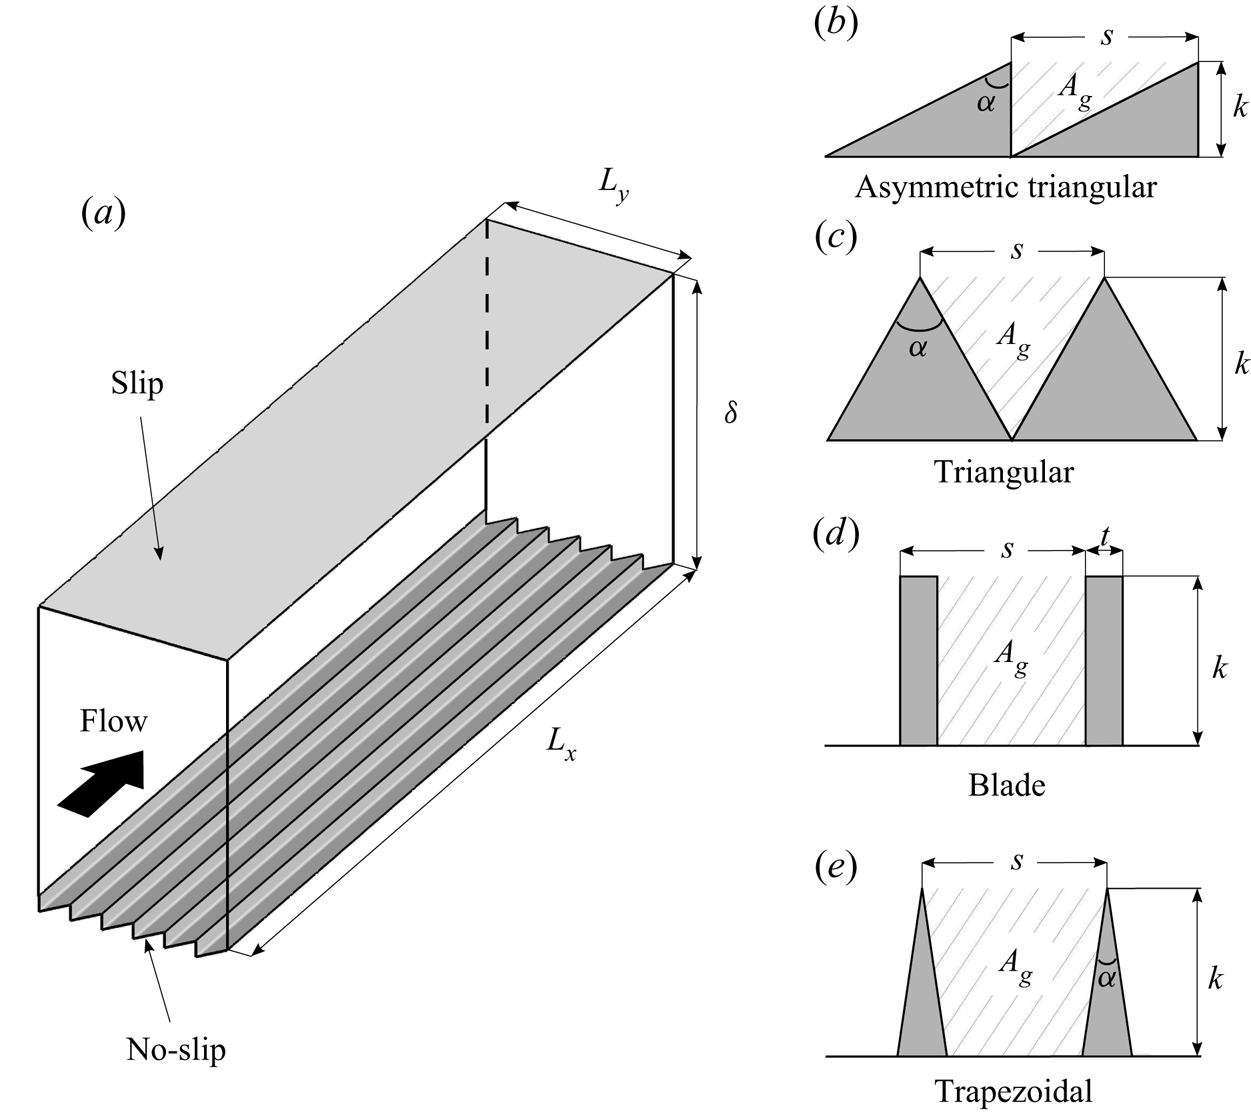
The equations are discretized using the unstructured second-order finite-volume solver CTI Cliff (Ham, Mattsson & Iaccarino Reference Ham, Mattsson and Iaccarino2006; Ham et al. Reference Ham, Mattsson, Iaccarino and Moin2007). The use of hanging nodes allows a coarser mesh in the spanwise direction towards the channel centre, reducing the computational cost (spacings given in table 1). The mesh spacing in the streamwise and wall-normal directions are the ones typical of DNS, whereas in the spanwise direction we use at least 32 points for each riblet period, below the riblet crest. The equations are solved in a minimal-channel domain (Jiménez & Moin Reference Jiménez and Moin1991; Flores & Jiménez Reference Flores and Jiménez2010) with dimensions  $L_x\times L_y\times \delta$ (figure 3). Flow cases share the same computational box, apart from trapezoidal riblets for which
  $L_x$ is two times larger. This does not influence minimal-channel results, as shown by the extensive analysis of MacDonald et al. (Reference MacDonald, Chung, Hutchins, Chan, Ooi and García-Mayoral2017) on the box size. Small computational domains are known to produce unphysical results in the outer part of the flow, but the wall-normal extent of the unphysical region can be controlled by changing the spanwise length of the box. In particular, Flores & Jiménez (Reference Flores and Jiménez2010) showed that the turbulent flow statistics remain representative of the full channel flow up to a critical wall-normal location
  $z_c^+\approx 0.3L_y^+$, on a smooth wall. Chung et al. (Reference Chung, Chan, MacDonald, Hutchins and Ooi2015) first used this methodology to study rough walls and MacDonald et al. (Reference MacDonald, Chung, Hutchins, Chan, Ooi and García-Mayoral2017) extended the methodology, e.g. to open-channel flow, and showed that the minimal-channel results match the ones of the smooth channel up to
  $z_c^+\approx 0.4L_y^+$. The use of the minimal-channel domain is here justified by the fact that the effect of roughness elements only extends to the region in the immediate vicinity of the riblets, often referred to as roughness sublayer. In this region the flow physics can be accurately represented using a minimal box, as long as the spanwise size of the computational domain is chosen in such a way that the riblet sublayer is below
  $z_c$ (Chung et al. Reference Chung, Chan, MacDonald, Hutchins and Ooi2015; MacDonald et al. Reference MacDonald, Chan, Chung, Hutchins and Ooi2016, Reference MacDonald, Chung, Hutchins, Chan, Ooi and García-Mayoral2017). The open-channel height
  $\delta$ is fixed, defined as the distance from the top smooth wall to the riblet mean height, thus the volume of the computational domain
  $L_xA_c$ (where
  $A_c$ is the fluid cross-sectional area) is fixed and so is the mean wall-shear stress,
 \begin{equation} L_y\frac{\tau_w}{\rho} = \varPi A_c\Rightarrow \frac{\tau_w}{\rho}=\varPi\delta,\quad \text{where}\ \delta\equiv\frac{A_c}{L_y}. \end{equation}
As a consequence, the friction Reynolds number  $Re_\tau =\delta /\delta _v$, for the same
  $\varPi$,
  $\delta$ and
  $\nu$. Here,
  $Re_\tau =395$ for all cases. We consider four different riblet geometries, namely, triangles with opening angle
  $\alpha =30^\circ$,
  $\alpha =60^\circ$,
  $\alpha =90^\circ$, asymmetric triangles
  $\alpha =63.4^\circ$, trapezoid
  $\alpha =30^\circ$ and blades with spacing-to-thickness ratio
  $s/t=5$ (table 1 and figure 3). No-slip boundary conditions are imposed at the bottom riblet wall, whereas a free-slip boundary condition is used at the top boundary and periodicity is imposed in the streamwise and spanwise directions. The flow over riblets is initialized by interpolating previous converged simulations of smooth channel flow, and simulations are continued to statistically stationary conditions. Three-dimensional flow fields are then stored each
  $0.25\delta /u_\tau$ for dimensionless time intervals
  $Tu_\tau /\delta$ that are reported in table 1, and independence from the initial conditions is a posteriori checked by shifting the averaging time interval of
  $T/4$ and verifying that the variation of the mean wall-shear stress is below
  $1\,\%$. Ensemble averages (averages in time, streamwise direction and riblet period) are indicated by the overline symbol,
  $\bar {f}(y,z)$ with
  $y\times z$
 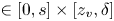 $\in [0,s]\times [z_v,\delta ]$ (
 $z_v$ indicates the location of the riblet valley), whereas plane averages (averages in streamwise and spanwise directions and in time) are indicated as
  $\langle \,f \rangle (z)$. Turbulent fluctuation is defined with respect to ensemble averages,
  $f'=f-\bar {f}$. Variables normalized with respect to wall units (
 $\delta _v$,
  $u_\tau$) are denoted with a
  $+$ superscript. The ensemble-averaged cross-stream velocity components
  $\bar {v}$ and
  $\bar {w}$ are hereafter referred to as dispersive or secondary velocities and
  $\bar {v}\,\bar {u}$,
  $\bar {w}\,\bar {u}$ are the associated dispersive stresses.
Sketch of the computational domain. Minimal open-channel configuration with box dimension  $L_x\times L_y\times \delta$. Different groove geometries are considered, from (b) to (e): asymmetric triangular with opening angle
  $\alpha =63.4^\circ$, triangular with opening angle
  $\alpha =30^\circ$,
  $\alpha =60^\circ$,
  $\alpha =90^\circ$, blade with spacing-to-thickness-ratio
  $s/t=5$ and trapezoidal with opening angle
  $\alpha =30^\circ$.
3. Drag reduction and virtual origin
Drag reduction can be quantified as the difference of the friction coefficients between smooth and riblet walls,
 \begin{equation} \mathcal{DR} = 1-\frac{C_{f}}{C_{fsm}}, \end{equation}
where  $C_{fsm}$ and
  $C_{f}$ are the friction coefficients over the smooth and riblet walls, respectively,
 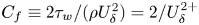 $C_f\equiv 2\tau _w/(\rho U_\delta ^2)=2/U_\delta ^{2+}$ and
  $U_\delta ^+\equiv \langle u\rangle ^+(\delta )$, the mean velocity at the slip boundary. The use of the friction coefficients based on
  $U_\delta ^+$ allows us to directly relate the drag reduction (3.1) to the shift in the velocity profile with respect to the smooth wall. Further manipulation of (3.1) casts it as
 \begin{equation} \mathcal{DR} =1 - \frac{1}{\left(1-\dfrac{\Delta U^+}{U_{\delta sm}^+}\right)^2}, \end{equation}
where  $\Delta U^+=\langle u\rangle _{sm}^+(\delta ) - \langle u\rangle ^+(\delta )$ is the velocity shift with respect to the smooth wall, or the Hama roughness function, at
  $z=\delta$. A positive
  $\Delta U^+$ therefore corresponds to a drag increase, whereas negative values indicate drag reduction. Note that (3.2) and evaluation of
  $\Delta U^+$ at
  $z=\delta$ is only valid for matched
  $Re_\tau$, whereas a different relation can be written for matched Reynolds numbers based on the bulk velocity (Bechert et al. Reference Bechert, Bruse, Hage, van der Hoeven and Hoppe1997; García-Mayoral & Jiménez Reference García-Mayoral and Jiménez2011). Use of
  $\Delta U^+$ has the advantage that unlike
  $\mathcal {DR}$, it does not depend on the outer Reynolds number. This is a direct consequence of the outer layer similarity hypothesis (Townsend Reference Townsend1976), which has been verified extensively for rough-wall boundary layers (Flack, Schultz & Connelly Reference Flack, Schultz and Connelly2007; Schultz & Flack Reference Schultz and Flack2007). Use of
  $\Delta U^+$ allows easier comparison with other studies at different Reynolds number and drag reduction can always be recovered using (3.2). For instance, if we consider a wide-body long-range commercial aircraft with a mean aerodynamic wing chord of 7 m and a fuselage length of 60 m, flying at a cruise speed of
  $250\ \textrm {m}\,\textrm {s}^{-1}$ with
  $\nu =3.5\times 10^{-5}\ \textrm {m}^2\,\textrm {s}^{-1}$, we can estimate a Reynolds number of
  $Re_x\approx 5\times 10^7$ for the wing and
  $Re_x\approx 4\times 10^8$ for the fuselage corresponding to a friction Reynolds number of
  $Re_\tau \approx 17\,000$ and
  $Re_\tau \approx 80\,000$ (Schlichting (Reference Schlichting1979), (21.16) footnote), respectively. Equation (3.2) shows that drag reduction depends on the Reynolds number through
  $C_{fsm}=2/U_{\delta sm}^+$ (Spalart & McLean Reference Spalart and McLean2011), thus
  $10\,\%$ of drag reduction at
  $Re_\tau \approx 400$, typical of DNS, is only
  $6\,\%$ at
  $Re_\tau \approx 17\,000$ (wing) and
  $5\,\%$ at
  $Re _\tau \approx 80\,000$ (fuselage). In the present work, the use of the minimal channel does not allow the use of
  $U_\delta ^+$ to estimate the velocity shift. Nevertheless, the Hama roughness function is constant above the roughness sublayer at matched
  $Re_\tau$ and Chung et al. (Reference Chung, Chan, MacDonald, Hutchins and Ooi2015) showed that minimal-channel mean profiles match those of full channel up to the critical height
  $z_c^+=0.4L_y^+$ in the log region. Therefore, we measure the velocity shift at
  $z_c^+$,
 \begin{equation} \Delta U^+= \langle u\rangle_{sm}^+(\delta) - \langle u\rangle^+(\delta) \approx \langle u\rangle_{sm}^+(z_c) - \langle u\rangle^+(z_c). \end{equation}
The second identity in (3.3) is accurate only if the smooth and rough velocity profiles are approximately parallel above the roughness sublayer and below  $z_c$, such that the Hama roughness function is constant in this region, indicating that it would be constant even further up if a wider channel domain were used. In minimal-channel flow
  $L_y<\delta$ and the critical height
  $z_c=0.4L_y$, therefore one typically has
  $z_c\ll \delta$. This does not impact the accuracy of the second identity in (3.3), which only depends on the flatness of the Hama roughness function between
  $z_c$ and
  $\delta$. At low Reynolds numbers, such as the ones typically achieved in DNS, these conditions depend on knowing the location of the virtual origin of the flow (Raupach, Antonia & Rajagopalan Reference Raupach, Antonia and Rajagopalan1991).
Simulations were conducted with matched fluid volumes (i.e. the nominal origin from which  $\delta$ is measured is the riblet mean height, located
  $\ell _g^2/s$ below the crest). The riblet mean height is the location at which a smooth channel with the same cross-sectional area
  $A_c$ would be located. This choice corresponds to the location where the extrapolated total stress equals
  $\tau _w$, but in general the location of the equivalent wall perceived by the turbulent flow might be at a different height. Moreover, the velocity shift obtained with riblets is typically small, in the range
  $\Delta U^+\approx -1$ to
  $1$, making the measurement of
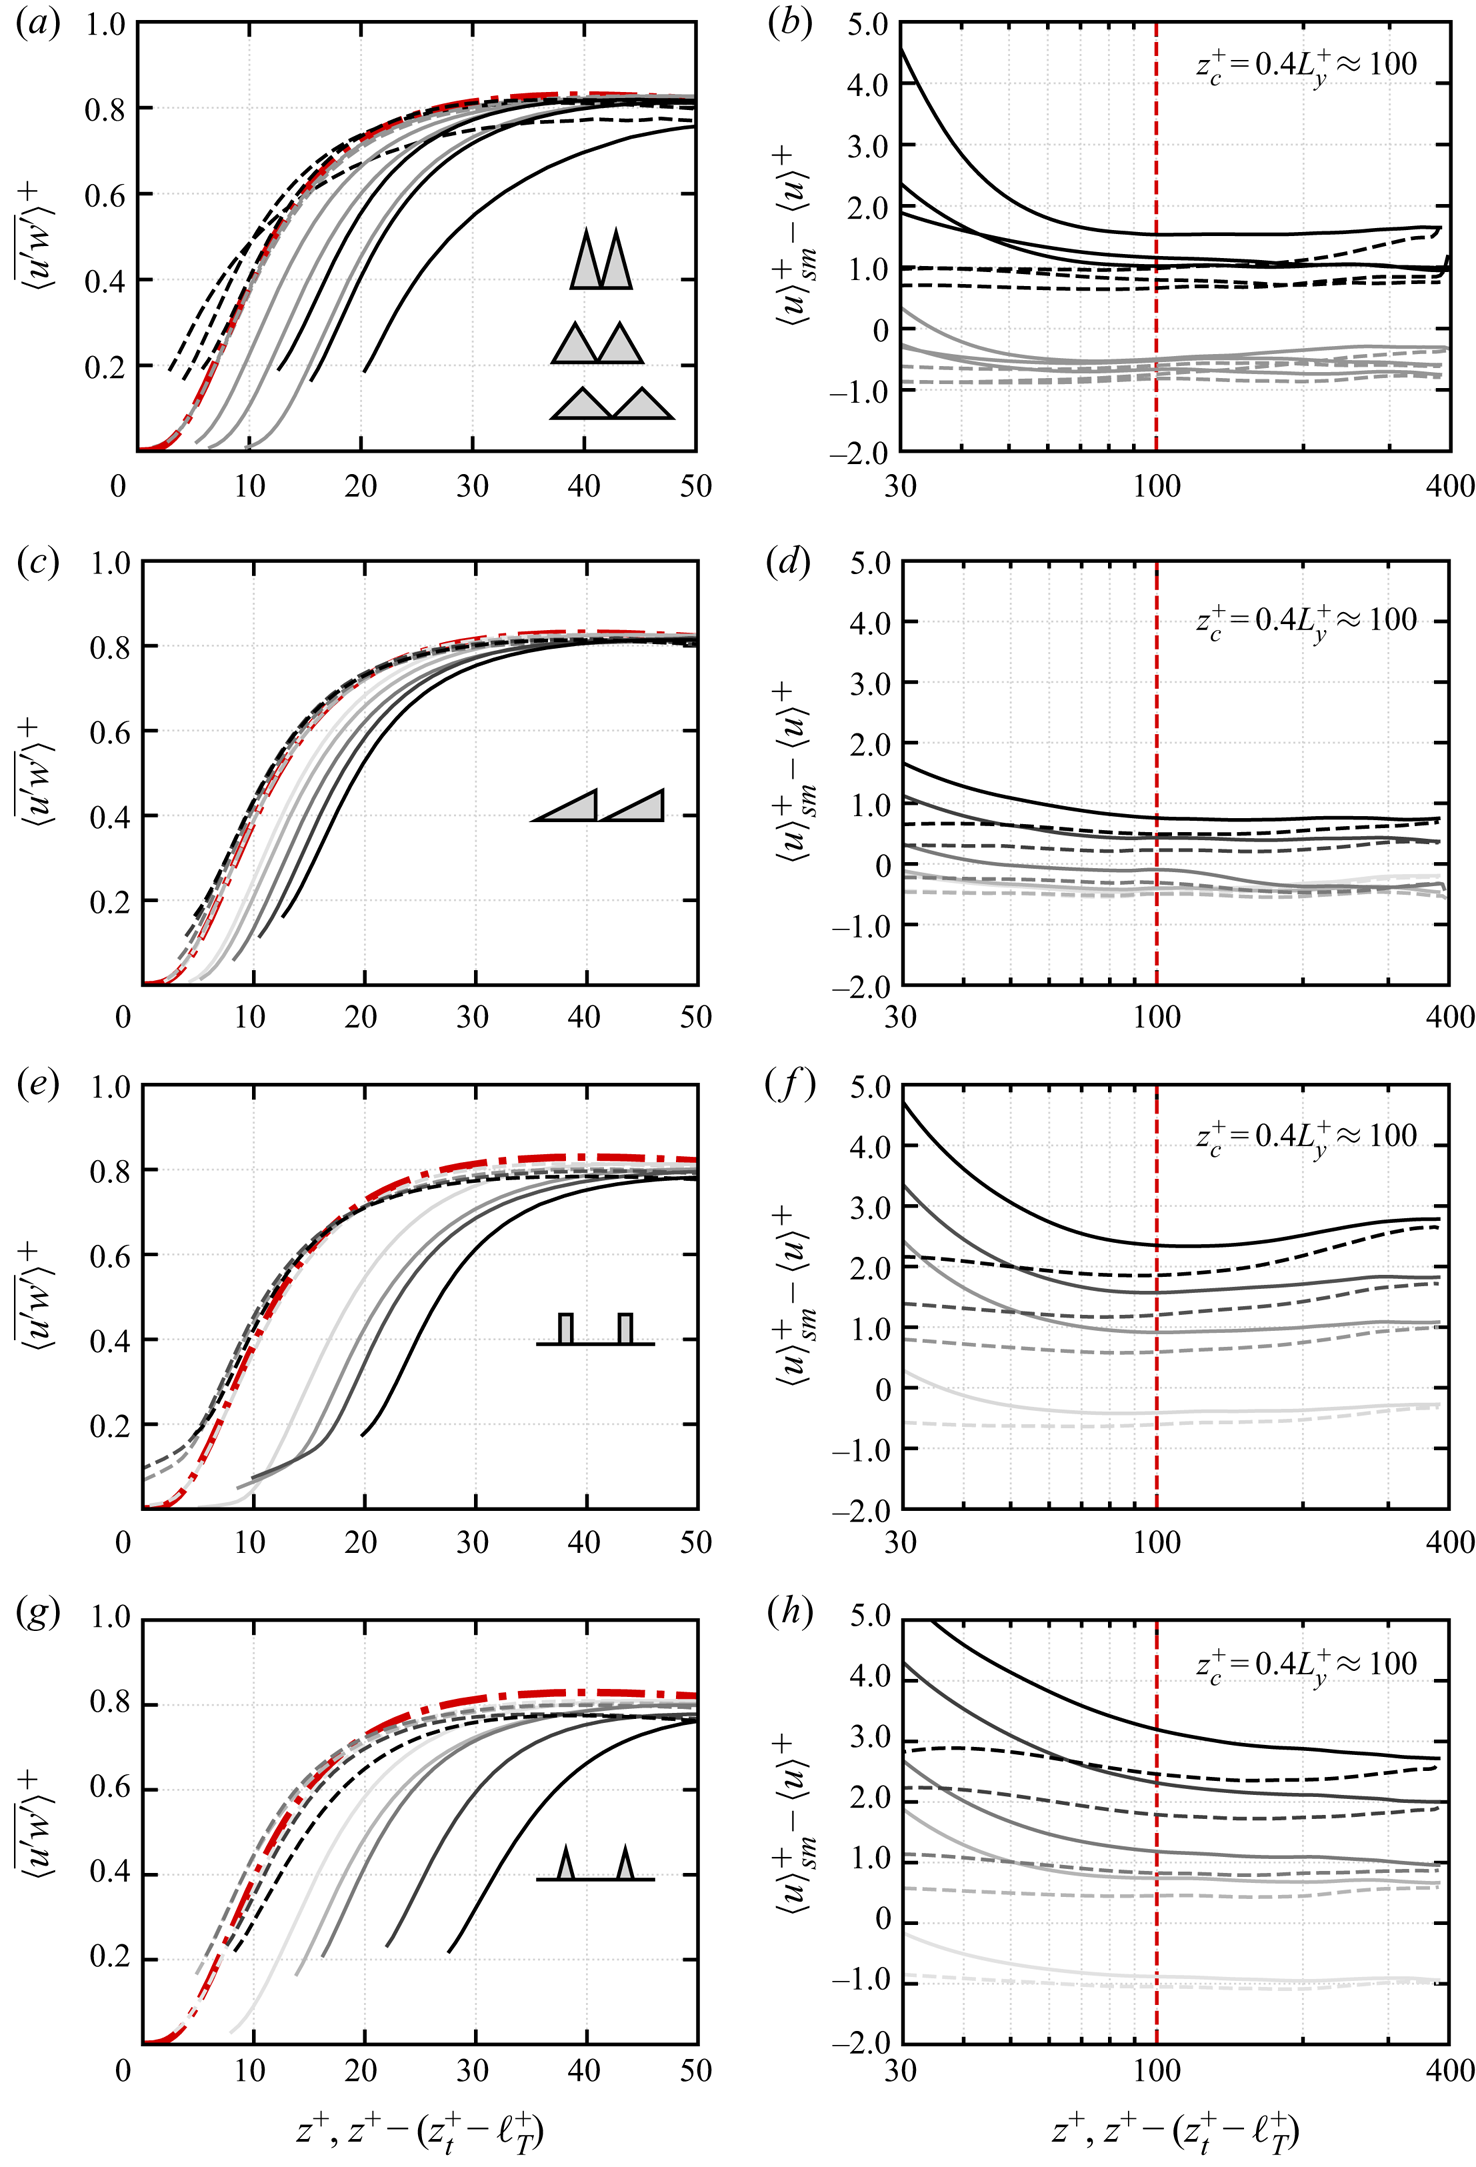
  $\Delta U^+$ rather sensitive to the wall-normal location. For these reasons, a correct estimation of the location of the virtual origin of the riblet wall is necessary. Several methods have been proposed to estimate the virtual origin of the flow: the centroid of the total stress (Thom Reference Thom1971; Jackson Reference Jackson1981), the virtual origin of the Stokes spanwise flow (Luchini et al. Reference Luchini, Manzo and Pozzi1991), using the Fukagata–Iwamoto–Kasagi (FIK) identity (Bannier et al. Reference Bannier, Garnier and Sagaut2015), or where the turbulent stress vanishes (Nepf et al. Reference Nepf, Ghisalberti, White and Murphy2007; MacDonald et al. Reference MacDonald, Ooi, García-Mayoral, Hutchins and Chung2018). In this work we follow the latter, the physical idea being that the main effect of riblets is to lift up the turbulent eddies in the viscous sublayer, thus reducing the turbulent stress. This concept is only strictly valid for small riblets, for which the effect of the texture reduces to an origin shift (García-Mayoral et al. Reference García-Mayoral, Gómez-de-Segura and Fairhall2019). Consistently with this interpretation we identify the location of the equivalent smooth wall by shifting the turbulent stress profile,
  $\langle \overline {u'w'}\rangle =\langle \overline {uw}\rangle -\langle \bar {u}\,\bar {w}\rangle$ of the smallest riblet geometries (TI310, TI615, TI919, AT15, BL20, TA18) to match the smooth wall. We interpret this length, measured downward from the riblet crest, as the virtual origin of turbulence and we denote it with
  $\ell _T$. The virtual origin of the larger cases is then obtained by fixing the ratio between the origin of turbulence and the riblet height
  $\ell _T/k$ for geometries of the same family (triangular with fixed tip angle, asymmetric triangular, blade and trapezoidal). Figure 4(a,c,e,g) shows the original turbulent stress profiles (solid lines) and the shifted ones (dashed lines) for all flow cases. The shifted Reynolds stress profiles match the smooth wall with good agreement, whereas minor differences are observed for increasing riblet size. The effect of the virtual origin shift on the Hama roughness function is reported in figure 4(b,d,f,h), which shows that
  $\langle u\rangle _{sm}^+-\langle u\rangle ^+$ becomes substantially flatter with respect to the original profile, when the virtual origin correction is taken into account, allowing us to measure
  $\Delta U^+$ as in (3.3) with more confidence, reducing the aforementioned low-Reynolds-number effects. The virtual origin shift relative to the mean height is typically small, in the range
  $z_t^+-\ell _T^+\approx 2$–
 $20$ depending on the riblet size and geometry, but at this relatively low Reynolds number the effect on the mean velocity profile is relevant.
Turbulent stress  $\langle \overline {u'w'}\rangle ^+$ (a,c,e,g) and Hama roughness function
  $\langle u^+\rangle _{sm}-\langle u^+\rangle$ (b,d,f,h), for triangular (a,b), asymmetric triangular (c,d), blade (e, f) and (g,h) trapezoidal riblets. Profiles are reported with respect to the constant volume origin at
  $z=0$ (black solid line) and with respect to the origin of the turbulent stress at
  $z=z_t-\ell _T$ (black dashed line). Colour from light to dark indicates increasing riblets spacing
  $s^+$ (table 1). The smooth wall minimal-channel turbulent stress (red dashed dot line thick) is also reported in (a,c,e,g). Profiles are shown from above the crest.
  $z_c^+=0.4L_y^+\approx 100$ (table 1), represented by the red dashed line, is the critical height at which
  $\Delta U^+$ is measured. Here,
  $z_t$ indicates the location of the crest and
  $\ell _T$ the location of the virtual origin, measured downward from the crest.
Figures 5(a) and 5(b) show the velocity shift  $\Delta U^+$ as a function of
  $s^+$ and
  $\ell _g^+$, respectively, for different riblet geometries, compared to experimental data for triangles
  $\alpha =60^\circ$ from (Bechert et al. Reference Bechert, Bruse, Hage, van der Hoeven and Hoppe1997) (grey filled triangle) and DNS data for blades
  $s/t=4$ from (García-Mayoral & Jiménez Reference García-Mayoral and Jiménez2011) (grey filled square). DNS data for drag-reducing blades (BL20) and triangles with
  $\alpha =60^\circ$ (TI615) predict slightly larger drag reduction with respect to previous DNS of blade riblets (grey filled square) and experiments (grey filled triangle). For the blades this can be traced back to the different blade thicknesses,
  $s/t=5$ in our case, and
  $s/t=4$ in García-Mayoral & Jiménez (Reference García-Mayoral and Jiménez2011), consistent with the idea that thinner blades yield larger drag reduction. As for the triangles, the experimental values of
  $\Delta U^+$ have been extracted from the drag reduction curves of Bechert et al. (Reference Bechert, Bruse, Hage, van der Hoeven and Hoppe1997), assuming that the riblet and smooth wall have the same Reynolds number based on bulk velocity (García-Mayoral & Jiménez (Reference García-Mayoral and Jiménez2011), (3.2) in that paper), which could explain this minor discrepancy. Even though the drag curves are traditionally reported as a function of
  $s^+$ (Walsh Reference Walsh1982; Luchini et al. Reference Luchini, Manzo and Pozzi1991; Bechert et al. Reference Bechert, Bruse, Hage, van der Hoeven and Hoppe1997), García-Mayoral & Jiménez (Reference García-Mayoral and Jiménez2011) showed that a better collapse between different geometries can be obtained using the viscous-scaled square root of the groove area,
  $\ell _g^+$. In particular, García-Mayoral & Jiménez (Reference García-Mayoral and Jiménez2011) analysed experimental data for several riblets geometries and showed that
  $\ell _g^+$ collapses the drag curves of different geometries close to the drag optimum
  $\ell _g^+\approx 10$–
 $11$ and related this scaling to the onset of a Kelvin–Helmholtz-like instability above the riblet crest for blade riblets. Figure 5 shows that the present DNS data also confirm the improved collapse of
  $\Delta U^+$ when this is reported as a function
  $\ell _g^+$ rather than
  $s^+$. In addition to the previously observed improved collapse near the drag optimum we also note a better agreement between different groove geometries in the drag-increasing regime (i.e. case TI321 triangles at
  $30^{\circ }$, case TI950 triangles at
  $90^{\circ }$ and cases AT40 and AT50 red asymmetric triangles at
  $63.4^{\circ }$).
(a) Value of  ${\Delta U}^+$ as a function of the viscous-scaled riblet spacing
  $s^+$ and (b) as a function of the square root of groove area
  $\ell _g^+=\ell _g/\delta _v$, where
  $\ell _g=\sqrt {A_g}$. Symbols represent different flow cases:
  , triangles
  $\alpha =30^\circ$;
  , triangles
  $\alpha =60^\circ$;
  , triangles
  $\alpha =90^\circ$;
  (red), trapezoids
  $\alpha =30^\circ$;
  (blue), blades
  $s/t=5$;
  (orange), asymmetric triangles
  $\alpha =63.4^\circ$;
  (grey), experimental data for triangles
  $\alpha =60^\circ$ (Bechert et al. Reference Bechert, Bruse, Hage, van der Hoeven and Hoppe1997);
  , DNS data for blades
  $s/t=4$ (García-Mayoral & Jiménez Reference García-Mayoral and Jiménez2011).
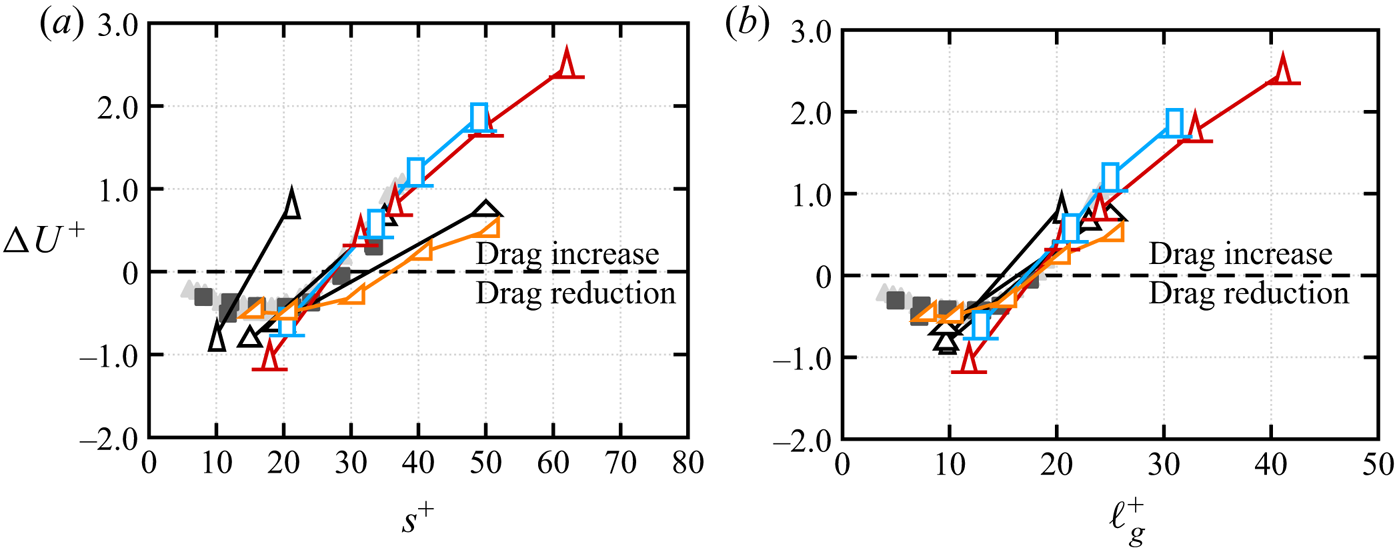
Although reporting the drag curves as a function of  $\ell _g^+$ improves the collapse between different grooves, differences between riblet shapes are still visible. The optimum drag occurs at
  $\ell _g^+\approx 11$ for all riblet shapes, but
  $\Delta U^+$ depends on the groove geometry and can be partially predicted from the difference in protrusion heights (Luchini et al. Reference Luchini, Manzo and Pozzi1991). The maximum drag reduction is achieved by the trapezoidal riblets with
  $\Delta U^+=-1.06$, whereas the asymmetric triangular riblets have the least drag reduction with
  $\Delta U^+=-0.49$. In the same region, symmetric triangular riblets with
  $\alpha =30^\circ$,
  $60\,^\circ$ and
  $90^\circ$ achieve
  $\Delta U^+=-0.74$,
  $-0.82$ and
  $-0.60$, respectively, and blades
  $\Delta U^+=-0.60$. The drag curves of large riblets show a different trend and for
  $\ell _g^+\approx 20$: asymmetric triangular riblets exhibit the smallest drag increase (
 $\Delta U^+\approx 0.2$), compared to trapezoidal (
 $\Delta U^+\approx 0.4$), blades (
 $\Delta U^+\approx 0.6$) and triangular with
  $\alpha =30^\circ$ (
 $\Delta U^+\approx 1$),
  $\alpha =60^\circ$ (
 $\Delta U^+\approx 0.7$) and
  $\alpha =90^\circ$ (
 $\Delta U^+\approx 0.8$). The drag curves highlight the general idea that sharp riblets provide larger drag reduction, which stems from the Stokes-flow theory (Luchini et al. Reference Luchini, Manzo and Pozzi1991), but this does not hold in the nonlinear regime. For instance at
  $\ell _g^+\approx 20$, the sharp triangular riblets with
  $\alpha =30^\circ$ are the ones providing the largest drag increase, whereas the blunt asymmetric riblets with angle
  $\alpha =63.4^\circ$ are the ones with the smallest drag increase. Hence, the analysis confirms that the linear theory cannot explain the drag curves of large riblets in which inertial flow penetrates the riblet grooves.
4. Roughness sublayer and secondary velocities
A relevant length scale in rough-wall turbulence is the roughness or riblet sublayer  $\delta _r$, representing the region of direct influence of the riblets in the wall-normal direction, namely the wall-normal distance between the virtual origin and the location at which the flow becomes statistically homogeneous in the wall-parallel directions, (figure 6). Although the notion of roughness sublayer is rather intuitive, many definitions are available in the literature. Raupach et al. (Reference Raupach, Antonia and Rajagopalan1991) identify the roughness sublayer as the region in the range
  $2k$–
$2k$– $5k$, where
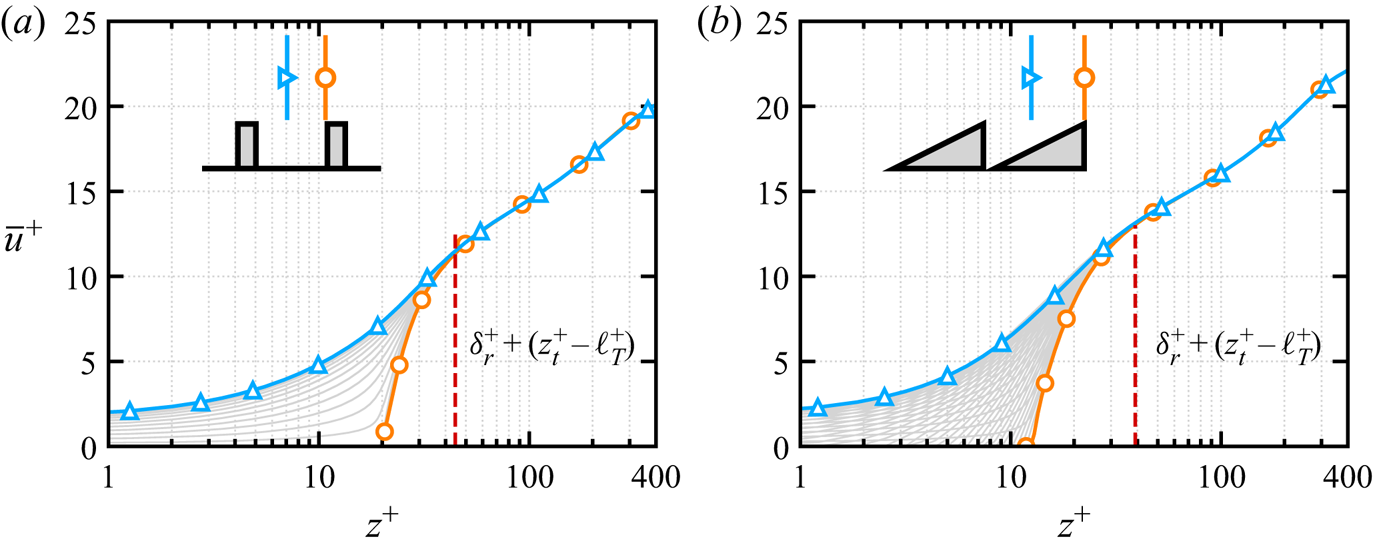
  $k$ is the roughness height. Nikora et al. (Reference Nikora, Goring, McEwan and Griffiths2001) and Pokrajac et al. (Reference Pokrajac, Campbell, Nikora, Manes and McEwan2007) relate the roughness sublayer to the dispersive velocities, whereas Cheng & Castro (Reference Cheng and Castro2002) define the roughness sublayer as the wall-normal distance at which the ensemble-averaged velocity profile becomes homogeneous in the wall-parallel directions. In the present work we follow the approach of Cheng & Castro (Reference Cheng and Castro2002) and we define the riblet sublayer as the wall-normal location at which the ensemble-averaged streamwise velocity above the crest becomes homogeneous in the spanwise direction,
 \begin{equation} \max_{0\leq y\leq s}\left|\frac{\partial \bar{u}}{\partial y}(y,z-(z_t-\ell_T)=\delta_r)\right|=\frac{0.5u_\tau}{s}. \end{equation}
We use the threshold  $0.5u_\tau /s$ because the spanwise velocity variation
 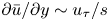 $\partial \bar {u}/\partial y\sim u_\tau /s$, and the value
  $0.5$ has been chosen from visual inspection of the spanwise variation in velocity across the span of the riblet. Figure 7 shows the ensemble-averaged streamwise velocity profiles across the riblet span for flow cases BL50 and AT50, highlighting that (4.1) accurately captures the distinct separation between the region of direct influence of the riblet and the overlying spanwise-homogeneous flow. Although the upper limit of the roughness sublayer can be clearly identified in figure 7, the definition of the lower limit is more blurred and multiple choices are possible. In (4.1) we measure the roughness sublayer starting from the virtual origin of turbulence, but in the following we also consider the roughness sublayer measured from the riblet mean height,
  $\delta _r^+-\ell _T^++z_t^+$ (figure 6), as this is easier to calculate in experiments, where
  $\ell _T$ might be difficult to estimate. A visual impression of
  $\delta _r^+-\ell _T^++z_t^+$ can be gained from the sketch in figure 6, which shows the position of the mean riblet height and the virtual origin with respect to the smooth wall. The virtual origin can be interpreted as the wall-normal location at which the outer flow perceives the equivalent smooth wall.
Sketch of the roughness sublayer  $\delta _r$, measured from the virtual origin of turbulence. The virtual origin of turbulence is located
  $\ell _T$ downward from the crest. The equivalent smooth wall is also shown for reference.
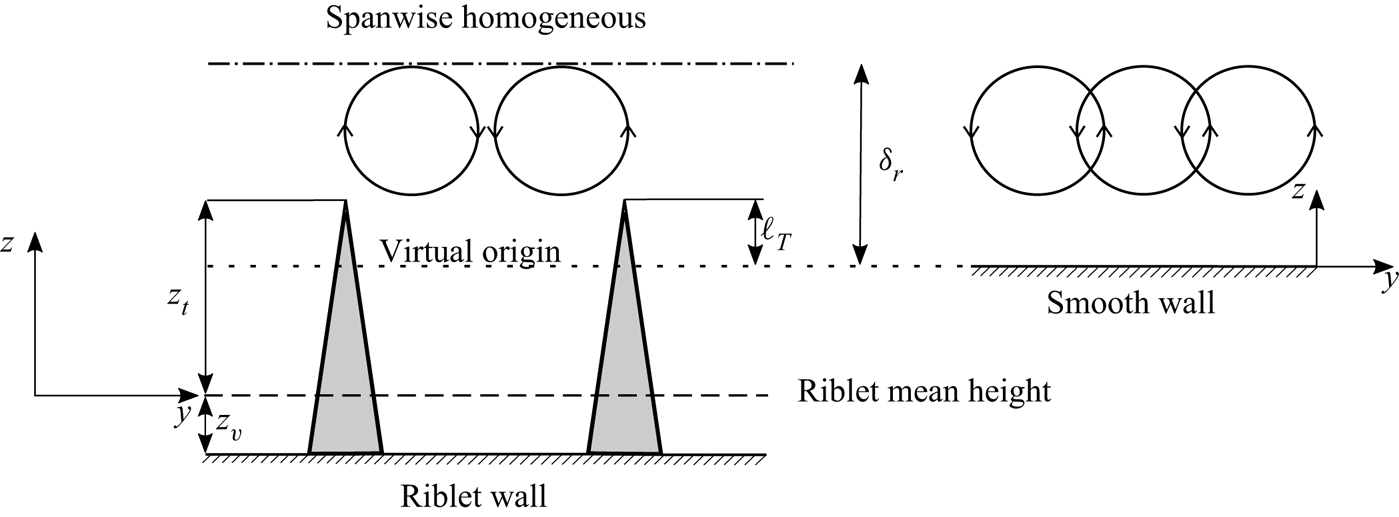
Mean velocity profiles over the riblet at all spanwise locations (grey solid lines), from the lower (orange solid line with circles), to the upper (blue solid line with triangles) curve envelope, for flow case (a) BL50 and (b) AT50. The location of the roughness sublayer  $\delta _r^+$ (red dashed line) as defined in (4.1) is also reported. The vertical lines in the riblet sketch refer to the spanwise location of the lower and upper curve envelopes.
In order to understand the relation between the groove shape and the roughness sublayer, in figure 8 we report  $\delta _r^+$ as a function of
  $s^+$ and
  $\ell _g^+$. Figure 8(a) shows that DNS data for different groove geometries support a linear relationship between the roughness sublayer and the riblet spacing,
 \begin{equation} \delta_r^+=a s^+, \end{equation}
where  $a=0.62$ is the least-squares fitting constant obtained from present DNS data. A slightly larger scatter instead is observed when
  $\delta _r^+$ is reported as a function of
  $\ell _g^+$ (figure 8b). In the context of roughness, a similar result has been reported by Chan et al. (Reference Chan, MacDonald, Chung, Hutchins and Ooi2018), who observed that
  $\delta _r$ is half the spanwise roughness wavelength of egg-carton roughness in fully developed pipe flow. The roughness sublayer can be interpreted as the wall-normal distance above which the flow does not perceive the groove geometry, but rather the mean wall-shear stress induced by the riblets. In this respect (4.2) allows us to relate a flow parameter,
  $\delta _r^+$, to a geometrical parameter,
  $s^+$, and it shows that the wall-normal location at which the mean flow becomes spanwise homogeneous depends only on the riblet spacing and not on the detailed groove geometry. However, the relation between
  $\Delta U^+$ and
  $\delta _r^+$ is more complex. As also noted by previous authors, there is no fixed relationship between
  $\Delta U^+$ and
  $s^+$ (and therefore also not between
  $\Delta U^+$ and
  $\delta _r^+$). Instead,
  $\Delta U^+$ of different grooves geometries scales better with
  $\ell _g^+$ than with
  $s^+$ and (4.3) shows that
  $\ell _g^+$ and
  $\delta _r^+$ are related through the mean riblet height. The linear relationship (4.3) can be traced back to the fact that the concept of virtual origin is strictly valid for infinitely small riblets, whereas in the turbulent case inertial flow might penetrate below the virtual origin and measuring the roughness sublayer from the riblet mean height partially accounts for this effect. In this sense
  $\ell _g^+$ has the role of a fitting parameter and, being an average of the groove geometry, it accounts for this correction. We also observe that the roughness sublayer measured from the riblet mean height follows a different trend and DNS data show a linear relationship with the square root of the groove area,
 \begin{equation} \delta_r^+\ {-}\ \ell_T^+\ {+}\ z_t^+=b \ell_g^+, \end{equation}
where  $b=1.47$ is the least-squares fitting constant obtained from present DNS data (figure 8d). On the contrary, a slightly larger scatter of the data can be observed when
  $\delta _r^+-\ell _T^++z_t^+$ is plotted against the riblets spacing (figure 8c). Figure 8(d) shows that the roughness sublayer measured from the riblet mean height is linearly proportional to
  $\ell _g^+$, and therefore related to velocity shift
  $\Delta U^+$. To further investigate the relationship between the riblet sublayer and the secondary flows, we focus on the ensemble-average flow field, with particular focus on the non-zero dispersive velocities
  $\bar {v}$ and
  $\bar {w}$. Figures 9 and 10 show
  $\bar {v}^+$ and
  $\bar {w}^+$ in the cross-stream plane for all riblet cases, where the red dashed line denotes the height of the roughness sublayer. The mean wall-normal velocity component
  $\bar {w}^+$ (figure 9) is spatially organized into two lobes, one positive close to the riblet crests and one negative at the centre of the groove. On the other hand, the mean spanwise velocity component
  $\bar {v}^+$ (figure 10) is constituted by four lobes with alternating sign, which together with
  $\bar {w}^+$ form two ensemble-averaged counter-rotating vortices laying in the riblet groove, as shown from the streamfunction
  $\psi$ (figure 11). For small riblets the flow is dominated by viscosity (Stokes flow) and the leftward and rightward spanwise flows cancel out due to symmetry, whereas for Stokes flow the mean cross-stream velocities are exactly zero. The Stokes-flow limit is only valid for infinitely small riblets, therefore, for a turbulent flow, we find
  $\bar {v}\neq 0$ and
  $\bar {w}\neq 0$, even for the smallest riblet cases under scrutiny. Nevertheless, for small riblets the intensity of
  $\bar {v}$ and
  $\bar {w}$ is approximately an order of magnitude smaller than the colour scale in figures 9 and 10 and therefore not visible. For large riblets inertia prevails and the instantaneous leftward and rightward spanwise flows are different (flow separation can occur), leading to non-zero mean secondary velocities. The presence of these vortices clearly shows that large grooves are dominated by inertial flow, whereas viscous flow dominates over small riblets. Ensemble-averaged secondary velocities over large riblets have also been reported in DNS of triangular riblets (Choi et al. (Reference Choi, Moin and Kim1993), figure 9 that paper), in DNS of cusped shape riblets (Goldstein et al. Reference Goldstein, Handler and Sirovich1995, figure 3g in that paper) and experiments of trapezoidal riblets (Suzuki & Kasagi Reference Suzuki and Kasagi1994, figure 6 in that paper), supporting the idea that this mechanism might characterize the flow physics of riblets in the nonlinear drag-increasing regime. A similar mechanism has been observed in liquid infused surfaces, in which the interface between the two fluids prevent the penetration of the secondary flows inside the grooves (Arenas et al. (Reference Arenas, García, Fu, Orlandi, Hultmark and Leonardi2019), see figure 9 in that paper), promoting reduction of the skin friction. The connection between drag increase and dispersive velocities seems also to be supported by the recent numerical experiments of Di Giorgio et al. (Reference Di Giorgio, Leonardi, Pirozzoli and Orlandi2020), which show that supressing the normal velocity at the crest (and therefore the penetration of inertial flow inside the groove) extends the linear drag-reducing regime beyond the optimum.
Roughness sublayer  $\delta _r^+$ as a function of the viscous-scaled riblet spacing
  $s^+$ (a) of the viscous-scaled square root of the groove area
  $\ell _g^+$ (b). Value of
 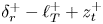 $\delta _r^+-\ell _T^++z_t^+$ (roughness sublayer measured from the riblet mean height) as a function of
  $s^+$ (c) and
  $\ell _g^+$ (d). In panels (a,d) the linear fittings
  $\delta _r^+=0.62s^+$ and
 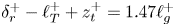 $\delta _r^+-\ell _T^++z_t^+=1.47\ell _g^+$ (grey solid line) are also reported. Symbols indicate different geometries:
  , triangles
  $\alpha =30^\circ$;
  , triangles
  $\alpha =60^\circ$;
  , triangles
  $\alpha =90^\circ$;
  (red), trapezoids
  $\alpha =30^\circ$;
  (blue), blades
  $s/t=5$;
  (orange), asymmetric triangles
  $\alpha =63.4^\circ$.
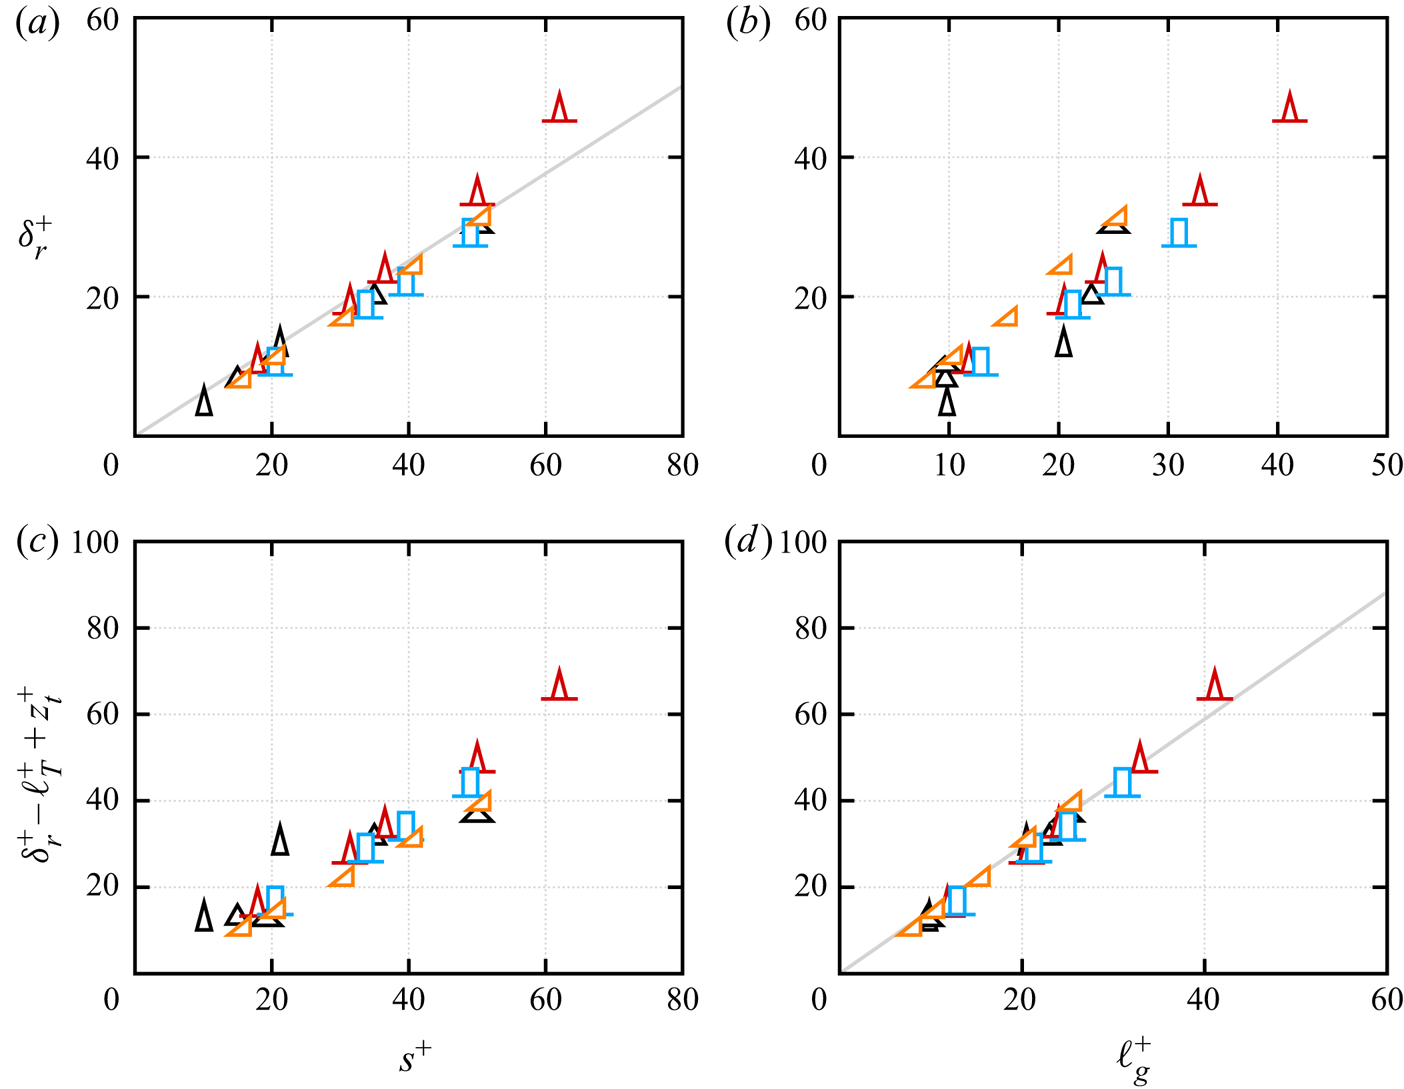
Mean wall-normal velocity component  $\bar {w}^+$ in the cross-stream plane. Dashed contour lines indicate negative values. The red dashed line indicates the location of the roughness sublayer as defined in (4.1). Here,
  $z-z_v$ is the wall-normal distance from the riblet valley. The green tick (
 $\checkmark$) indicates drag-decreasing cases, the red cross (
 $\times$) drag-increasing cases.
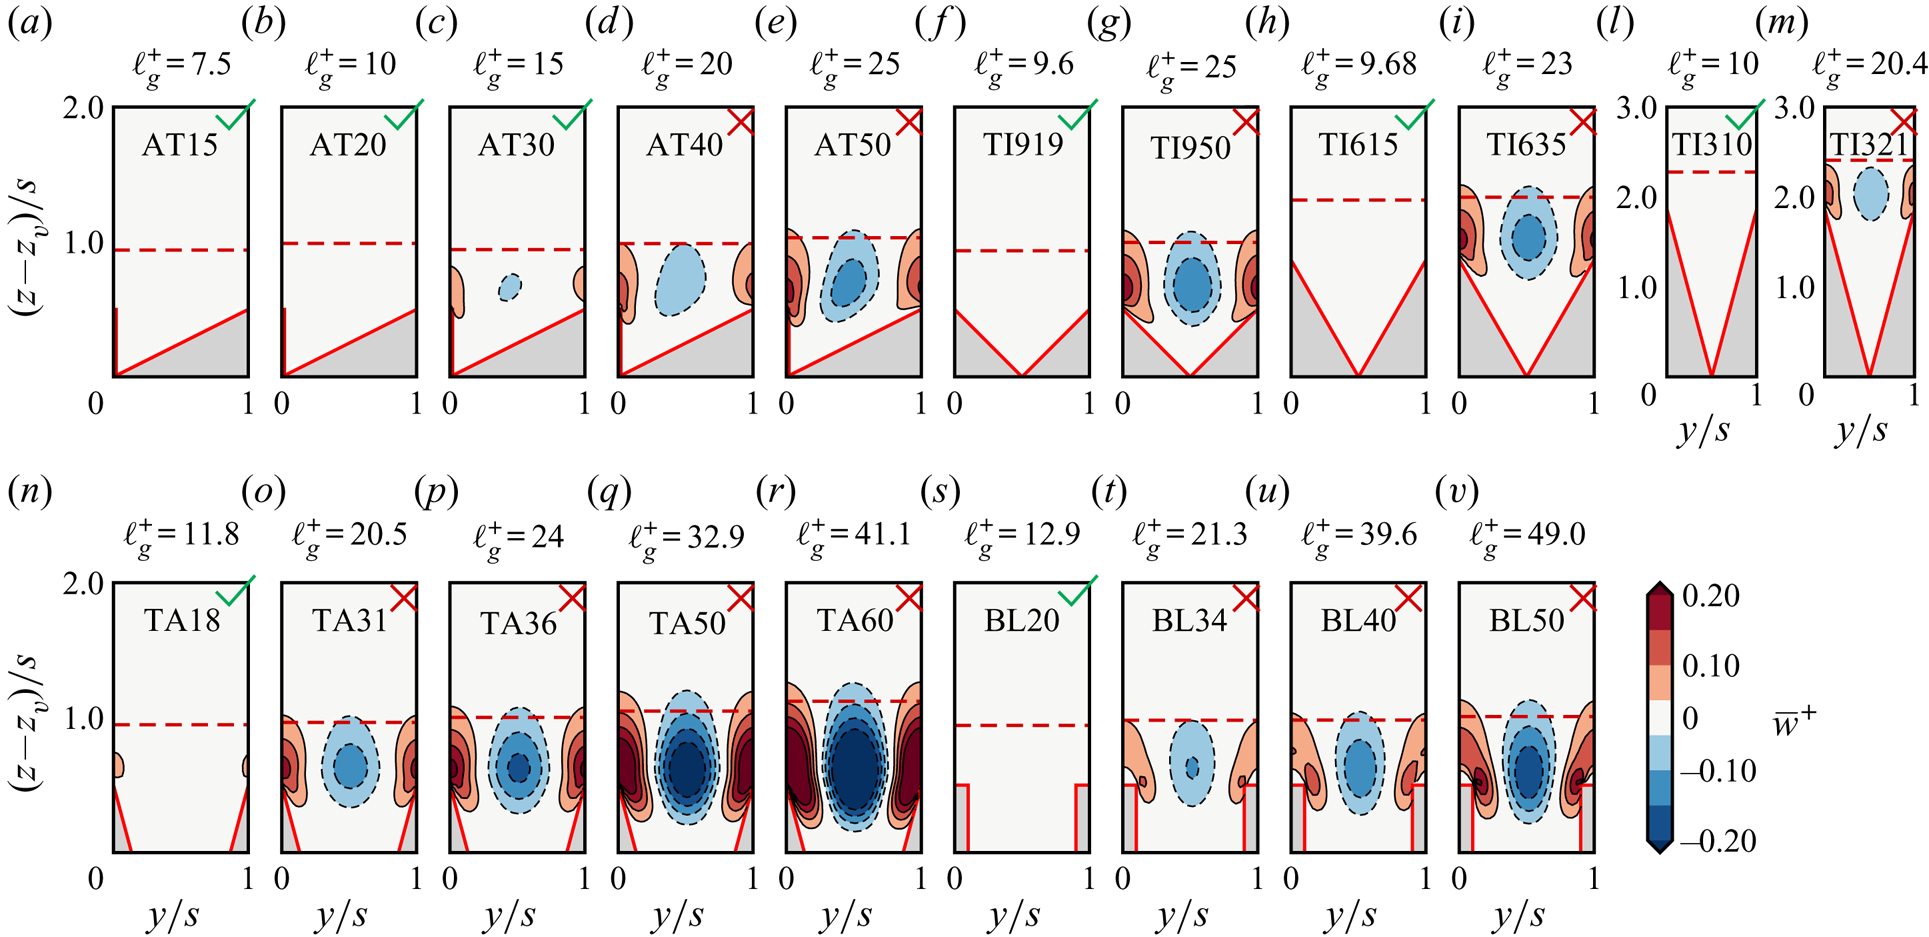
Mean spanwise velocity component  $\bar {v}^+$ in the cross-stream plane. Dashed contour lines indicate negative values. The red dashed line indicates the location of the roughness sublayer as defined in (4.1). Here,
  $z-z_v$ is the wall-normal distance from the riblet valley. The green tick (
 $\checkmark$) indicates drag-decreasing cases, the red cross (
 $\times$) drag-increasing cases.
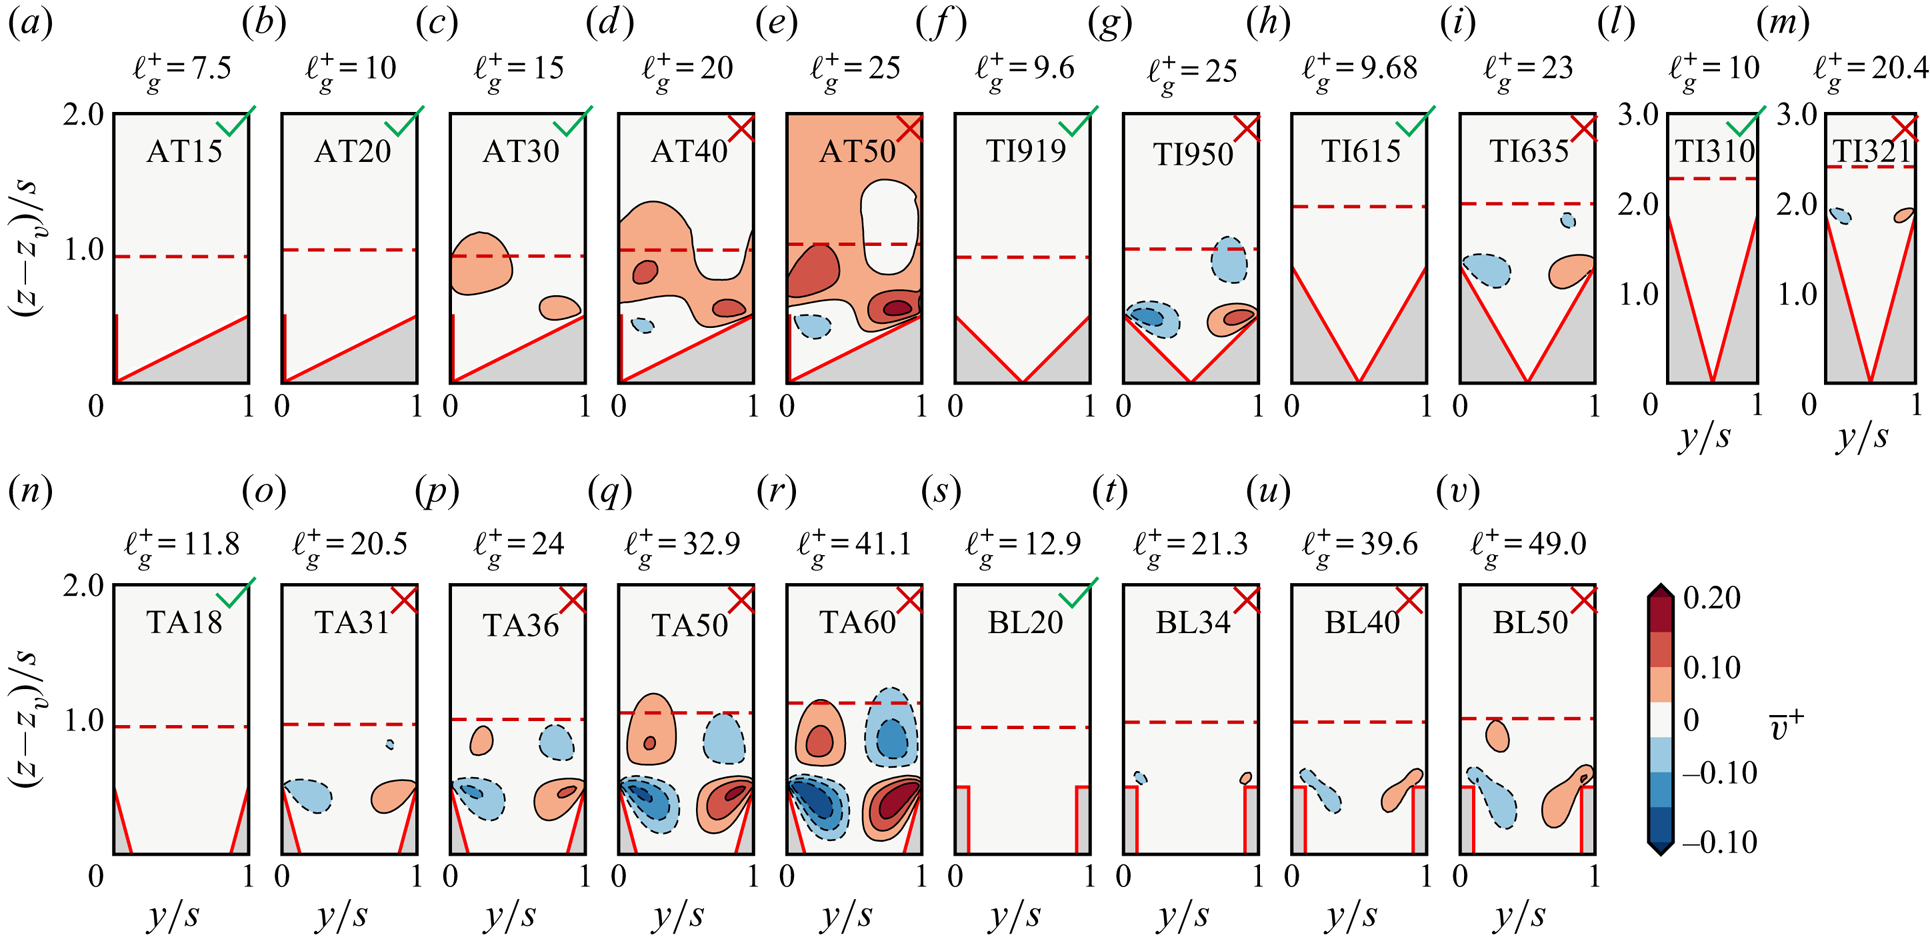
Cross-flow streamfunction  $\psi ^+=\psi /\nu$,
  $\bar {v}=\partial \psi /\partial z$,
 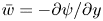 $\bar {w}=-\partial \psi /\partial y$. Dashed contour lines indicate negative values. The red dashed line indicates the location of the roughness sublayer as defined in (4.1). Here,
  $z-z_v$ is the wall-normal distance from the riblet valley. The green tick (
 $\checkmark$) indicates drag-decreasing cases, the red cross (
 $\times$) drag-increasing cases.
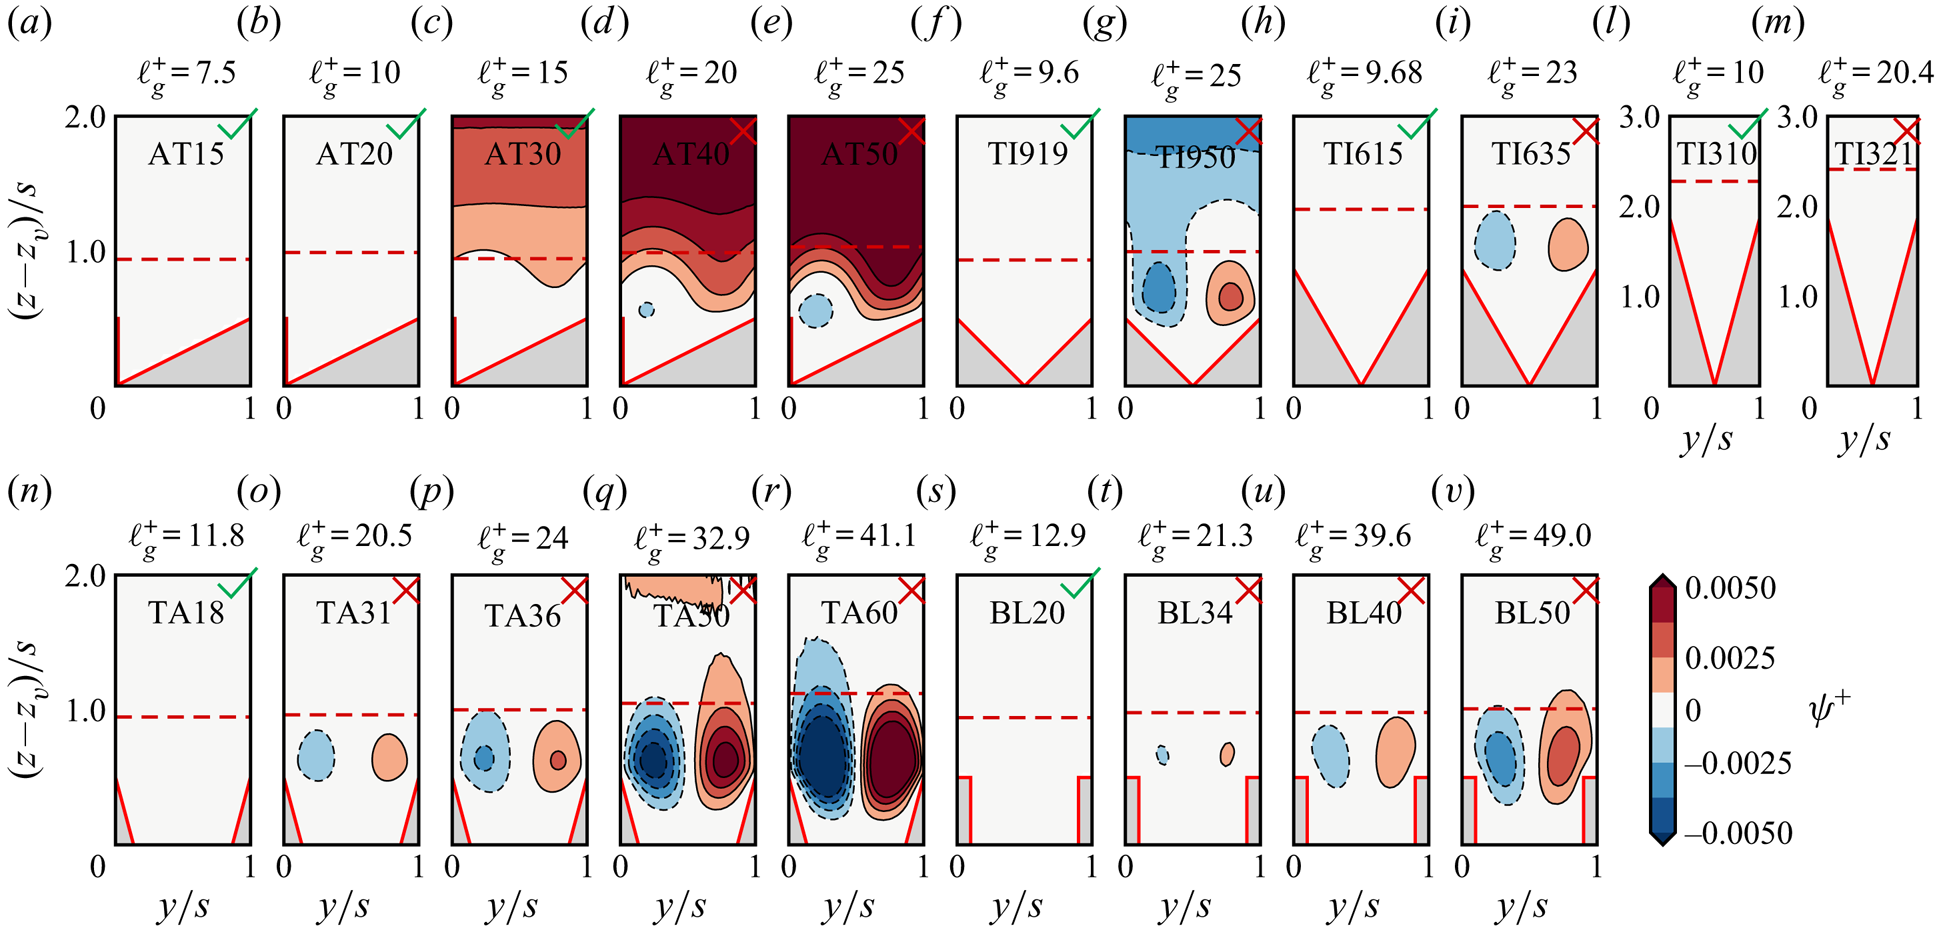
Goldstein et al. (Reference Goldstein, Handler and Sirovich1995) and Goldstein & Tuan (Reference Goldstein and Tuan1998) attributed the drag increase to these mean secondary velocities, whereas other authors (Choi et al. Reference Choi, Moin and Kim1993; Lee & Lee Reference Lee and Lee2001) focused on the instantaneous flow field. Lee & Lee (Reference Lee and Lee2001) tracked the centre of turbulent vortices, noticing that they are more frequently located below the riblet crest for drag-increasing riblets. Similarly, Choi et al. (Reference Choi, Moin and Kim1993) attributed the breakdown of drag reduction to turbulent vortices descending inside the riblet groove, providing instantaneous flow visualization as supporting evidence of this mechanism. The two proposed mechanisms seem similar, but the first (Goldstein et al. Reference Goldstein, Handler and Sirovich1995; Goldstein & Tuan Reference Goldstein and Tuan1998) is focused on the time-averaged flow and the second on instantaneous turbulent structures (Choi et al. Reference Choi, Moin and Kim1993; Lee & Lee Reference Lee and Lee2001). In order to shed light on the connection between the time-averaged and instantaneous flow, we study the dynamics of the secondary vortices in figure 11 to understand if their mean flow topology exists in the instantaneous flow or if it is an artefact of the time averaging.
To this end, we average the flow field conditioned on the direction of the spanwise flow at the crest, as shown by García-Mayoral & Jiménez (Reference García-Mayoral and Jiménez2011) for blade riblets,
 \begin{align} \bar{v} &= a_l\bar{v}_l + a_r\bar{v}_r, \end{align}
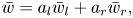 \begin{align}\bar{w} &= a_l\bar{w}_l + a_r\bar{w}_r, \end{align}
where  $a_l$ and
  $a_r$ indicate the fraction of leftward and rightward flow contributing to the total. For symmetric riblets
  $a_l=a_r=0.5$ on average, whereas for asymmetric riblets the values are reported in table 2.
Fraction of the leftward  $a_l$ and rightward
  $a_r$ flow for conditional averages of asymmetric triangular riblets, conditioned on the instantaneous spanwise flow.
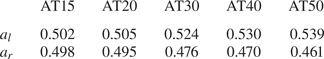
Figure 12 shows the streamfunction based on the conditional average. With the exception of the asymmetric riblets, all averages are shown only for the spanwise flow from left to right. For the asymmetric riblets (where  $a_r\ne a_l$), figure 12(f–j) shows the averages with flow from right to left. To ease comparison, these plots are mirrored. We note that, in agreement with figure 6 in García-Mayoral & Jiménez (Reference García-Mayoral and Jiménez2011), the conditional-averaged flow over small riblets is very similar to the Stokes flow and no recirculation regions (negative streamfunction values) are present. Large riblets show the presence of large recirculation regions, indicating that turbulence penetrates inside the groove. We also note that the penetration depth of the recirculating flow depends on the riblet geometry. As a reference, the red dotted line in figure 12 indicates the location of the riblet mean height. All drag-increasing cases (red cross in figure 12) show a recirculation bubble extending below the riblet mean height, almost reaching the groove ground, except for the sharp triangular riblets of flow cases TI321 and TI635 (figure 12u,w).
Streamfunction of the mean conditional cross-flow, conditioned to the direction of mean spanwise flow at the riblet crest. The mean flow just above the groove is from left to right for all cases, apart from asymmetric riblets (f–j) which show the flow from right to left. To ease comparison these plots are mirrored. The lines are for constant values of the conditional streamfunction in the cross-section  $\psi _r^+=(0.2,5.2,10.2,15.2,20.2)\times 10^{-3}$ (solid lines) for counter-clockwise rotation and
 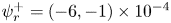 $\psi _r^+=(-6,-1)\times 10^{-4}$ (dashed lines) for clockwise rotation. The red dotted line indicates the riblet mean height. The green tick (
 $\checkmark$) indicates drag-decreasing cases, the red cross (
 $\times$) drag-increasing cases.
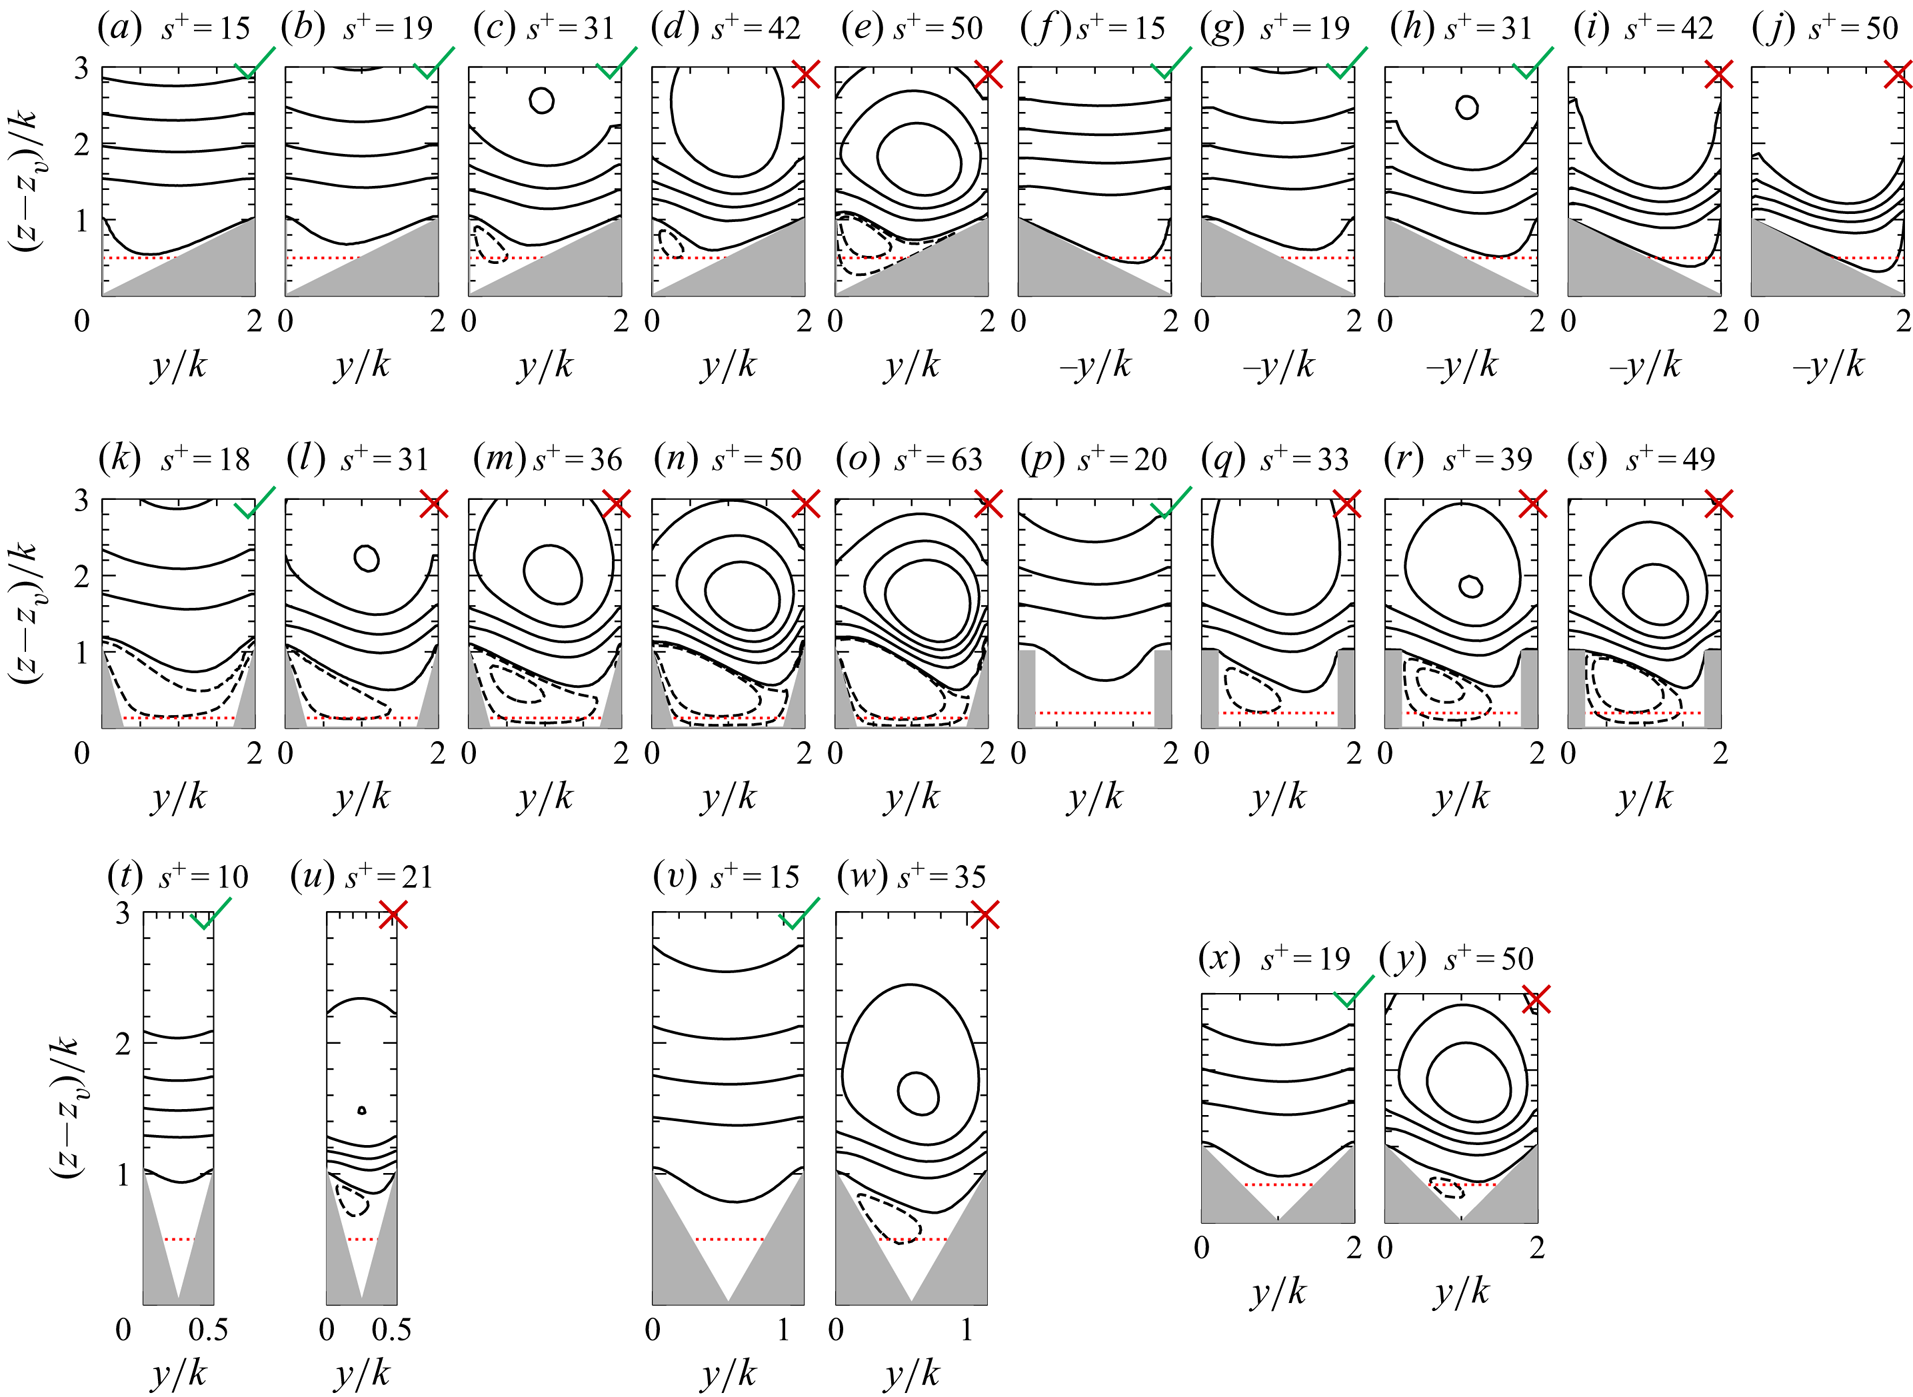
We further note that the streamfunction of the conditional-averaged flow is very different from the mean flow one in figure 11 (although the weighted average of the rightward and leftward flows returns the mean flow, as from (4.4)), suggesting that the mean flow inside the groove is mainly an artefact of the time averaging and the symmetric counter-rotating vortices previously observed are not present in the instantaneous flow. Therefore, the dispersive velocities as they appear in the time average, are the result of a dynamic process in which turbulent spanwise motions at the riblet crest give rise to preferentially located and asymmetric eddies within the riblet groove. Furthermore, the conditional averages show that the recirculation bubble penetrates down to the groove bottom for certain geometries (trapezoids, blades, asymmetric triangles, triangles with tip angle  $90^\circ$), but not for others (triangles with tip angle
  $\alpha =30^\circ$,
  $60^\circ$), which is not evident from figure 11, in which non-zero values of the mean streamfunction are mainly limited to the crest.
Moreover, the flow over asymmetric riblets shows similarities with both the flow over symmetric triangles and blades. The large asymmetric triangular riblet AT50, figure 12(e) exhibits a large negative patch, similar to the flow over BL50, figure 12(s), suggesting that the flow over the vertical side of asymmetric riblets is similar to the flow on the vertical side of the blades. On the contrary positive isolines in figure 12(j) are very similar to the ones over the triangular riblet TI950 in figure 12(y). Hence, the cross-flow over asymmetric triangular riblets can be thought as the weighted average of the flow over symmetric triangular grooves and blades. Table 2 shows that the flow is preferentially skewed towards the left and the flow asymmetry increases with the riblet size. We also note, however, that the drag curve of asymmetric riblets (figure 5) does not seem to reflect this similarity, as both near the optimum and in the drag-increasing regime,  $\Delta U^+$ of the asymmetric riblets follows a different trend from blades and asymmetric triangles.
5. Contributions to the change in drag
In order to quantify the contribution of the dispersive velocities to the degradation of the drag-reducing performance we consider the streamwise mean-momentum equation,
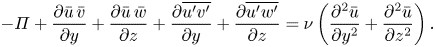 \begin{equation} -\varPi + \frac{\partial \bar{u}\, \bar{v}}{\partial y} + \frac{\partial \bar{u}\, \bar{w}}{\partial z} + \frac{\partial \overline{u'v'}}{\partial y} + \frac{\partial \overline{u'w'}}{\partial z} = \nu \left( \frac{\partial^2 \bar{u}}{\partial y^2} + \frac{\partial^2 \bar{u}}{\partial z^2} \right). \end{equation}
Equation (5.1) can be written in vector form as
 \begin{equation} -\varPi + \boldsymbol{\nabla}_{yz}\boldsymbol{\cdot}\boldsymbol{\tau}_\mathcal{D} + \boldsymbol{\nabla}_{yz}\boldsymbol{\cdot}\boldsymbol{\tau}_\mathcal{T} =\nu\nabla_{yz}^2\bar{u}, \end{equation}
where  $\boldsymbol {\nabla }_{yz}=(\partial /\partial y, \partial /\partial z)$,
  $\nabla _{yz}^2=\partial ^2/\partial y^2 + \partial ^2/\partial z^2$, are the two-dimensional divergence and Laplacian operators, respectively,
  $\boldsymbol {\tau }_\mathcal {D}=(\bar {u}\,\bar {v},\bar {u}\,\bar {w})$ and
  $\boldsymbol {\tau }_\mathcal {T}=(\overline {u'v'},\overline {u'w'})$ are the dispersive and turbulent contributions to the mean-momentum balance. In order to quantify the relative contribution of the terms in (5.2) to
  $\Delta U^+$ we use the approach of Modesti et al. (Reference Modesti, Pirozzoli, Orlandi and Grasso2018), who generalized the FIK identity to arbitrary complex geometries. Indeed, the mean-momentum balance (5.2) can be interpreted as a Poisson equation for
  $\bar {u}$, in which the terms on the left-hand side are the source terms from DNS, representing the laminar, dispersive and turbulent contributions to the mean velocity. Therefore, the associated velocity fields
  $\bar {u}_\mathcal {D}$,
  $\bar {u}_\mathcal {T}$ and
  $\bar {u}_\mathcal {L}$, induced by dispersion, turbulence and pressure gradient, respectively, can be obtained as solutions of three separate Poisson problems,
 \begin{equation} -\varPi=\nu\nabla_{yz}^2\bar{u}_\mathcal{L},\quad {\boldsymbol{\nabla}_{yz}\boldsymbol{\cdot}\boldsymbol{\tau}_\mathcal{D}}=\nu\nabla_{yz}^2\bar{u}_\mathcal{D},\quad {\boldsymbol{\nabla}_{yz}\boldsymbol{\cdot}\boldsymbol{\tau}_\mathcal{T}}=\nu\nabla_{yz}^2\bar{u}_\mathcal{T},\quad \end{equation}
where homogeneous Dirichlet and zero gradient boundary conditions are used at the wall and at the top boundary, respectively, and periodicity is used in the spanwise direction. Note that the first two of (5.3a–c) are constrained by Green's identity and thus  $\bar {u}_\mathcal {D}$ and
  $\bar {u}_\mathcal {T}$ do not contribute to the mean wall-shear stress. This approach coincides with the classical FIK identity in the case of smooth channel flow, as shown in appendix A. The total mean velocity field can be recovered by summing the three contributions,
 \begin{equation} \bar{u}=\bar{u}_\mathcal{L}+\bar{u}_\mathcal{T}+\bar{u}_\mathcal{D}, \end{equation}
owing to the linearity of the Laplacian operator. We first focus on the intensity and spatial distribution of the dispersive velocity  $\bar {u}_\mathcal {D}$, induced by the divergence of the dispersive stresses
  $\boldsymbol {\nabla }_{yz}\boldsymbol {\cdot }\boldsymbol {\tau }_\mathcal {D}$. Figure 13 shows that
  $\boldsymbol {\nabla }_{yz}\boldsymbol {\cdot }\boldsymbol {\tau }_\mathcal {D}$ is organized in two lobes, a positive lobe at the crest and a negative one in the groove, with a magnitude that increases with the riblet size. The source term and the solution of a Poisson equation tend to be locally anti-correlated, therefore positive values of
  $\boldsymbol {\nabla }_{yz}\boldsymbol {\cdot }\boldsymbol {\tau }_\mathcal {D}$ tend to induce negative values of
  $\bar {u}_\mathcal {D}$. Figure 14 shows that
  $\bar {u}_\mathcal {D}$ acts to increase the streamwise velocity in the valley and decrease the streamwise velocity at the crest. Moreover, we note that, even though non-zero values of
  $\boldsymbol {\nabla }_{yz}\boldsymbol {\cdot }\boldsymbol {\tau }_\mathcal {D}$ are only confined below the roughness sublayer, they contribute to the streamwise velocity in the entire field. Indeed, large riblets show a uniform negative (drag-increasing) dispersive velocity above the roughness sublayer, attaining values in the range
  $-2\lesssim \bar {u}_\mathcal {D}^+\lesssim -0.5$, depending on their size and shape. These values are comparable to the total
  $\Delta U^+$ of large riblets in figure 5, suggesting that the dispersive stresses are an important mechanism contributing to the degradation of drag reduction. We further note that, although
  $\boldsymbol {\nabla }_{yz}\boldsymbol {\cdot }\boldsymbol {\tau }_\mathcal {D}$ and
  $\boldsymbol {\nabla }_{yz}\boldsymbol {\cdot }\boldsymbol {\tau }_\mathcal {T}$ represent the contributions of turbulent secondary flows and turbulent fluctuations, they have the same effect on the mean flow, namely they transport momentum. The equalizing effect of turbulence emerges in
  $u_\mathcal {D}$ and
  $u_\mathcal {T}$, which are both negative above the roughness sublayer and therefore represent velocity deficits compared to
  $u_\mathcal {L}$. Hence,
  $\boldsymbol {\nabla }_{yz}\boldsymbol {\cdot }\boldsymbol {\tau }_\mathcal {T}$ and
  $\boldsymbol {\nabla }_{yz}\boldsymbol {\cdot }\boldsymbol {\tau }_\mathcal {D}$ are two aspects of inertial momentum transport, which we interpret respectively as turbulent fluctuations or as riblet-scaled recirculating regions caused by spanwise velocity fluctuations. In the roughness community dispersive stresses are interpreted as due to the spatial variations of the time-averaged flow. This definition is a direct consequence of the triple velocity decomposition, but it leads to two possible physical interpretations of the dispersive velocities. In the first, dispersive velocities have no dynamics and are a steady-state pattern in the background of the turbulent flow. In the second, dispersive velocities are the product of a dynamic process in which spanwise velocity fluctuations are preferentially located in the groove and on average they give rise to the two counter-rotating vortices we observed in figure 11. The conditional averages show that secondary flows are characterized by a rich dynamics, which eventually determines their time-averaged intensity and spatial distribution. The time-averaged contribution of this dynamic process is represented by
  $\boldsymbol {\nabla }_{yz}\boldsymbol {\cdot }\boldsymbol {\tau }_\mathcal {D}$ in the streamwise mean-momentum balance. Instead, the fluctuations around this time-averaged contribution are absorbed into the turbulent stress
  $\boldsymbol {\nabla }_{yz}\boldsymbol {\cdot }\boldsymbol {\tau }_\mathcal {T}$. An equivalent velocity decomposition can be obtained for the smooth wall using (5.3a–c),
 \begin{equation} \bar{u}_{sm} = \bar{u}_{sm\mathcal{L}} + \bar{u}_{sm\mathcal{T}}, \end{equation}
where the dispersive contribution is zero. The two-dimensional velocity Hama roughness function can be obtained by shifting the riblet velocity contributions (5.4) in the wall-normal direction, to match the origin of turbulence  $\ell _T$, and subtracting (5.4) from (5.5),
 \begin{equation} \Delta U^+= \Delta U_\mathcal{L}^+\ {+}\ \Delta U_\mathcal{T}^+\ {+}\ \Delta U_\mathcal{D}^+, \end{equation}
where
 \begin{gather} \Delta U_\mathcal{L}^+= \bar{u}_{sm\mathcal{L}}^+(y,z) - \bar{u}_\mathcal{L}^+(y,z-(z_t-\ell_T)), \end{gather}
 \begin{gather}\Delta U_\mathcal{T}^+= \bar{u}_{sm\mathcal{T}}^+(y,z) - \bar{u}_\mathcal{T}^+(y,z-(z_t-\ell_T)), \end{gather}
 \begin{gather}\Delta U_\mathcal{D}^+= - \bar{u}_\mathcal{D}^+(y,z-(z_t-\ell_T)), \end{gather}
and the coordinate system for smooth and riblet walls is sketched in figure 6. Figure 15 shows the total velocity of the smooth-wall case (figure 15a) and riblet case TI950 (figure 15e), decomposed into the laminar (figure 15b, f), turbulent (figure 15c,g) and dispersive (figure 15d,h) contributions from (5.3a–c). Figure 15(e–h) shows the riblet velocity fields, shifted upwards by  $z_t-\ell _T$ with respect to the mean height, and provide a visual interpretation of the concept of the virtual origin of turbulence. Indeed, we note that the shifted riblet contours for the turbulent contribution approximately match the smooth-wall contours away from the wall, supporting the idea that the outer turbulence perceives the riblets as a shift of the equivalent wall location. The contributions to the Hama roughness function (5.7) are obtained by subtracting the riblet velocity fields from the smooth-wall ones, figure 15(i–l). The figures show that the Hama roughness function is uniform above the roughness sublayer, consistent with the analysis of the one-dimensional profiles in figure 4, allowing us to measure the velocity shift and its FIK contributions at a wall-normal location
  $\delta _r \leq z \leq z_c$. Nevertheless, the contributions in (5.6) are different from the ones obtained using the standard one-dimensional FIK identity in velocity difference form (MacDonald et al. Reference MacDonald, Chan, Chung, Hutchins and Ooi2016; Gómez-de-Segura & García-Mayoral Reference Gómez-de-Segura and García-Mayoral2019). In fact, integrating the spanwise-averaged momentum equation from the crest above, a total slip contribution naturally emerges
  $\Delta U_S^+=\langle u_{sm}\rangle ^+ (\ell _T^+) - \langle u\rangle ^+(z_t^+)$, which is the difference between the velocity on the smooth wall at the virtual origin
  $\ell _T$ and the velocity at the riblet crest
  $z_t$ (figure 6). The slip contribution
  $\Delta U_S^+$ has an important physical meaning because the drag-reducing mechanism of riblets can be traced back to their ability to increase the velocity at the crest as compared to a smooth wall (
 $\Delta U_S^+<0$, indicates drag reduction). For this reason, it is convenient to rewrite (5.6) to explicitly have a
  $\Delta U_S^+$ contribution. We first note that the laminar contribution in (5.6) corresponds to the slip contribution of Luchini et al. (Reference Luchini, Manzo and Pozzi1991) in the limit of small riblets
  $\Delta U_\mathcal {L}^+(y,z_c) = \bar {u}_{sm\mathcal {L}}^+(y,z_c) - \bar {u}_\mathcal {L}^+(y,z_c-(z_t-\ell _T)) \approx \langle u_{sm\mathcal {L}}\rangle ^+(\ell _T^+) - \langle u_\mathcal {L}\rangle ^+(z_t^+)$
 $\approx \ell _T^+ - \ell _u^+\approx h_\perp ^+-h_\parallel ^+$. Therefore
 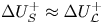 $\Delta U_S^+\approx \Delta U_\mathcal {L}^+$. However, this identity breaks down for increasing riblet size, as the turbulence and dispersive stresses also contribute to the slip at the crest. In order to obtain a split which explicitly accounts for
  $\Delta U_S^+$ at all riblet sizes, we define slip contributions for each velocity component (laminar, turbulent and dispersive),
 \begin{gather} \Delta U_{S\mathcal{L}}^+= \langle u_{sm\mathcal{L}}\rangle^+ (\ell_T^+) - \langle u_\mathcal{L}\rangle^+(z_t^+), \end{gather}
 \begin{gather}\Delta U_{S\mathcal{T}}^+= \langle u_{sm\mathcal{T}}\rangle^+ (\ell_T^+) - \langle u_\mathcal{T}\rangle^+(z_t^+), \end{gather}
 \begin{gather}\Delta U_{S\mathcal{D}}^+= - \langle u_\mathcal{D}\rangle^+(z_t^+), \end{gather}
and the total slip is the sum of these three terms,
 \begin{equation} \Delta U_S^+= \langle u_{sm}\rangle^+ (\ell_T^+) - \langle u\rangle^+(z_t^+) = \Delta U_{S\mathcal{L}}^+\ {+}\ \Delta U_{S\mathcal{T}}^+\ {+}\ \Delta U_{S\mathcal{D}}^+ . \end{equation}
Divergence of the dispersive stresses 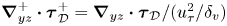 $\boldsymbol {\nabla }_{yz}^+\boldsymbol {\cdot }\boldsymbol {\tau }_\mathcal {D}^+=\boldsymbol {\nabla }_{yz}\boldsymbol {\cdot }\boldsymbol {\tau }_\mathcal {D}/(u_\tau ^2/\delta _v)$ (5.3a–c). Dashed contour lines indicate negative values. The red dashed line indicates the location of the roughness sublayer as defined in (4.1). Here,
  $(z-z_v)$ is the wall-normal distance from the riblet valley. The green tick (
 $\checkmark$) indicates drag-decreasing cases, the red cross (
 $\times$) drag-increasing cases.
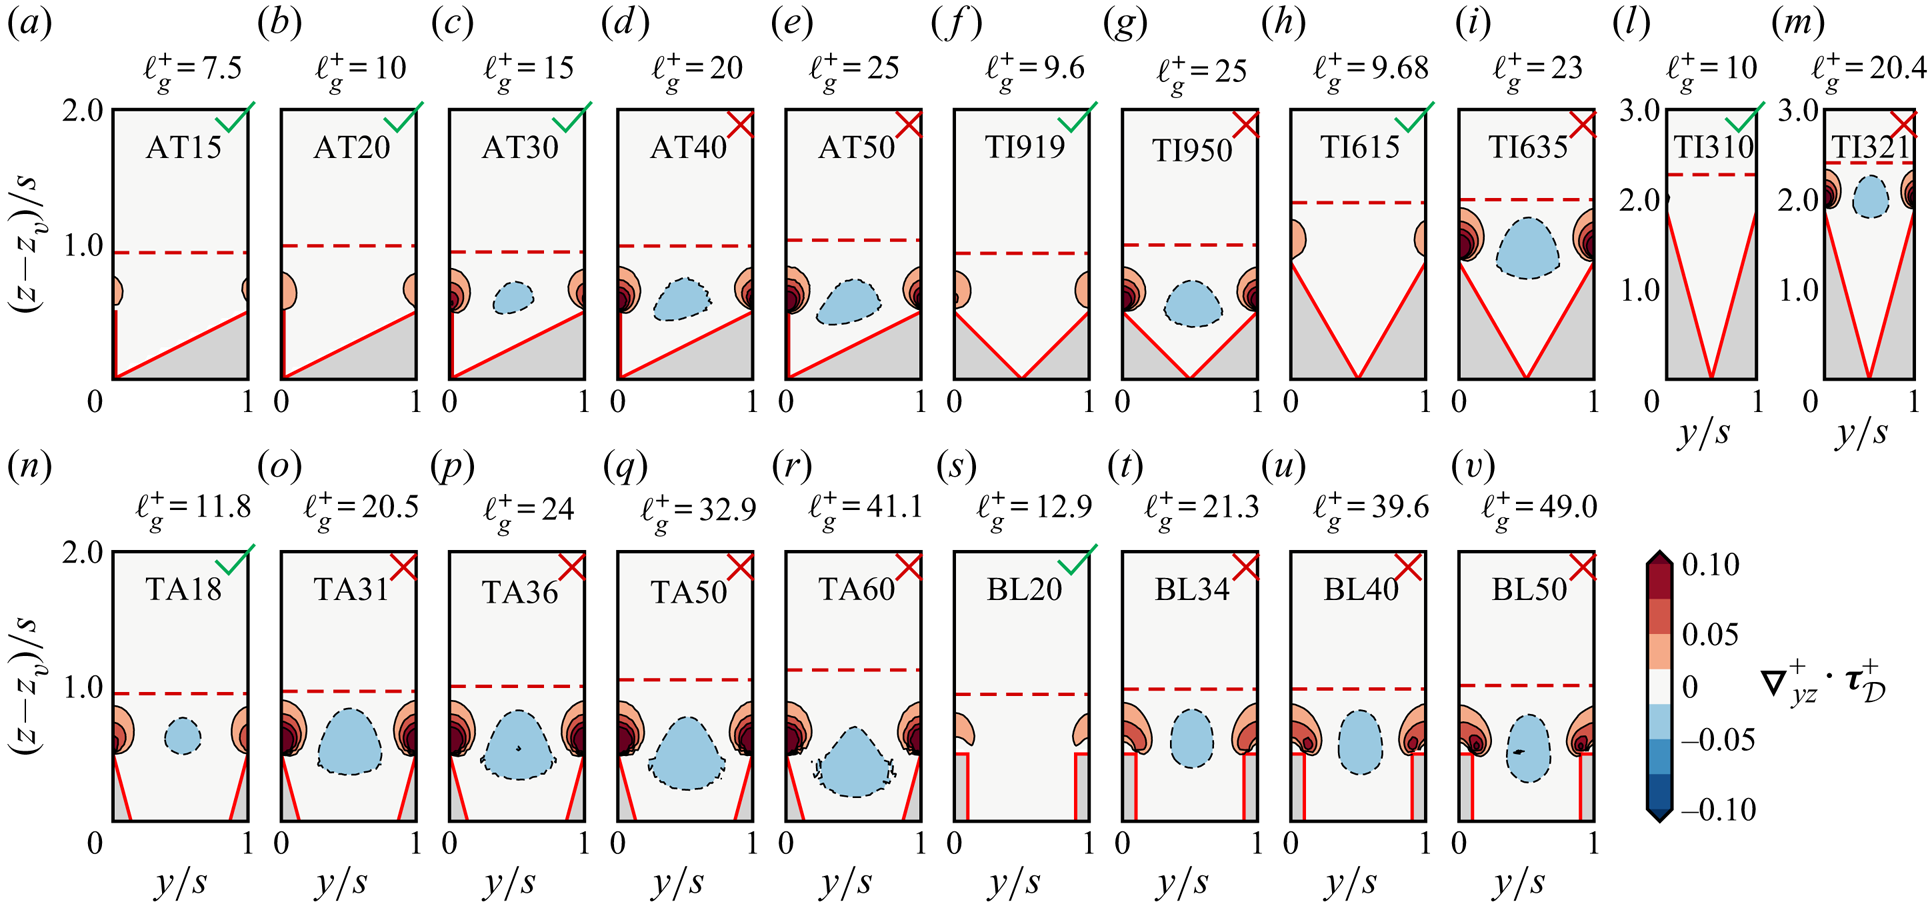
Dispersive velocity  $\bar {u}_\mathcal {D}$, from (5.3a–c). Dashed contour lines indicate negative values. The red dashed line indicates the location of the roughness sublayer as defined in (4.1). Here,
  $(z-z_v)$ is the wall-normal distance from the riblet valley. The green tick (
 $\checkmark$) indicates drag-decreasing cases, the red cross (
 $\times$) drag-increasing cases.
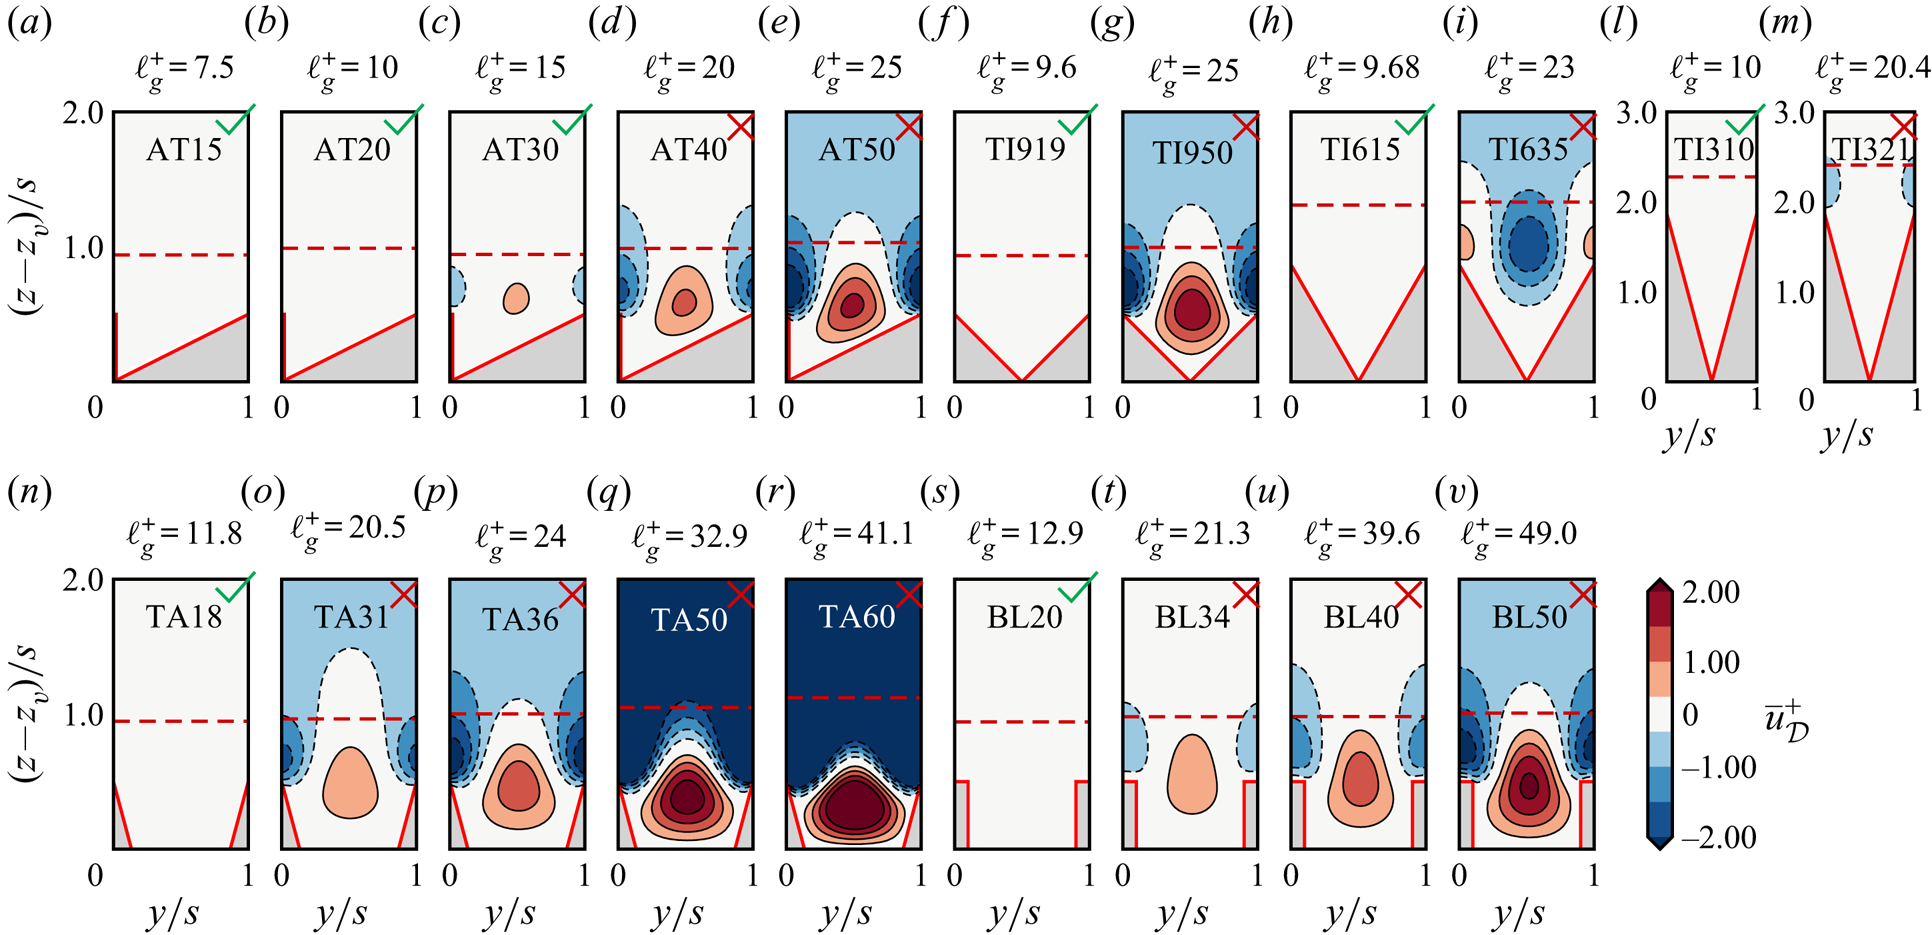
(a) Mean streamwise velocity over the smooth wall 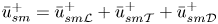 $\bar {u}_{sm}^+=\bar {u}_{sm\mathcal {L}}^+ +\bar {u}_{sm\mathcal {T}}^+ + \bar {u}_{sm\mathcal {D}}^+$ and its FIK contributions: (b) laminar
  $\bar {u}_{sm\mathcal {L}}^+$, (c) turbulent
  $\bar {u}_{sm\mathcal {T}}^+$, (d) dispersive
  $\bar {u}_{sm\mathcal {D}}^+$. (e) Mean streamwise velocity over the riblet case TI950
  $\bar {u}^+=\bar {u}_\mathcal {L}^++\bar {u}_\mathcal {T}^++\bar {u}_\mathcal {D}^+$ and its FIK contributions: ( f) laminar
  $\bar {u}_\mathcal {L}^+$, (g) turbulent
  $\bar {u}_\mathcal {T}^+$, (h) dispersive
  $\bar {u}_\mathcal {D}^+$. (i) Hama roughness function and its FIK contributions: ( j) laminar
 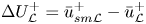 $\Delta U_\mathcal {L}^+ =\bar {u}_{sm\mathcal {L}}^+ - \bar {u}_\mathcal {L}^+$, (k) turbulent
  $\Delta U_\mathcal {T}^+ = \bar {u}_{sm\mathcal {T}}^+ - \bar {u}_\mathcal {T}^+$, (l) dispersive
 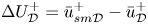 $\Delta U_\mathcal {D}^+ = \bar {u}_{sm\mathcal {D}}^+ - \bar {u}_\mathcal {D}^+$.
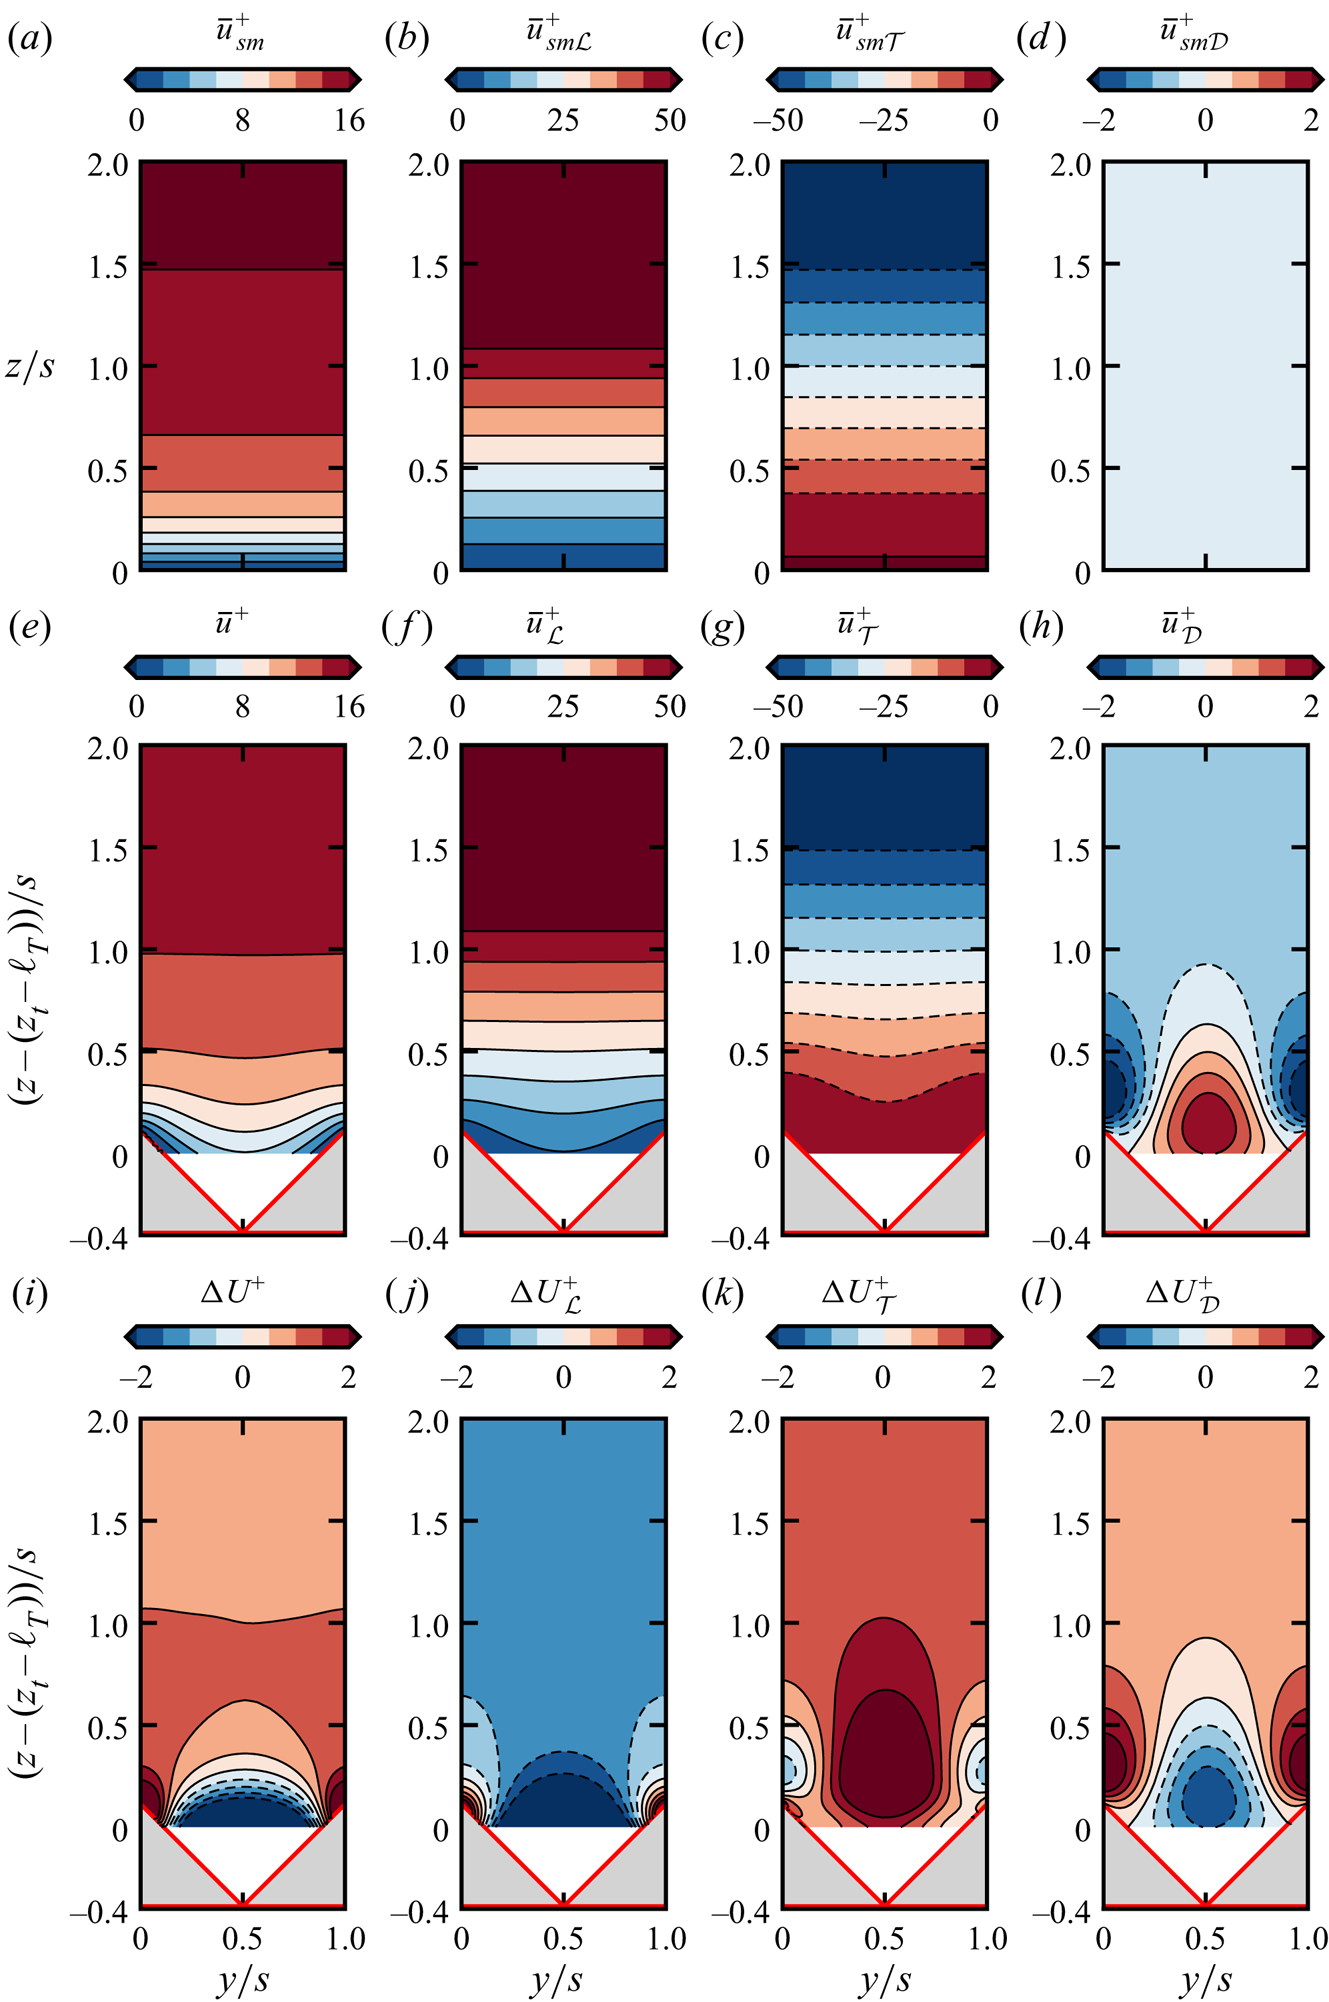
Adding and subtracting the second identity in (5.9) from (5.6) we can recast the FIK identity as
 \begin{equation} \Delta U^+= \Delta U_S^+\ {+}\ \Delta U_T^+\ {+}\ \Delta U_D^+, \end{equation}
where
 \begin{gather} \Delta U_T^+= \Delta U_{\mathcal{T}}^+\ {-}\ \Delta U_{S\mathcal{T}}^+ , \end{gather}
 \begin{gather}\Delta U_D^+= \Delta U_{\mathcal{D}}^+\ {-}\ \Delta U_{S\mathcal{D}}^+. \end{gather}
Equation (5.10) explicitly accounts for the slip velocity which allows easier comparison to standard one-dimensional FIK identity (MacDonald et al. Reference MacDonald, Chan, Chung, Hutchins and Ooi2016; Abderrahaman-Elena, Fairhall & García-Mayoral Reference Abderrahaman-Elena, Fairhall and García-Mayoral2019) and to the linear theory of Luchini et al. (Reference Luchini, Manzo and Pozzi1991) for which one should have 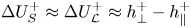 $\Delta U_S^+\approx \Delta U_\mathcal {L}^+\approx h_\perp ^+-h_\parallel ^+$ and
 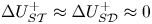 $\Delta U_{S\mathcal {T}}^+\approx \Delta U_{S\mathcal {D}}^+\approx 0$. The main difference between this approach and the one-dimensional FIK is that, by solving the Poisson equations (5.3a–c), we retain the flow contributions below the crest and we also quantify the deviations of
  $\Delta U_S^+$ from the linear theory.
Figure 16 shows that, for small riblets, the slip contribution ( $\lozenge$, green) amounts almost to the total (
 $\circ$, black),
 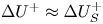 $\Delta U^+\approx \Delta U_S^+$, consistent with the idea that riblets operating in the linear regime reduce drag by increasing the mean velocity at the crest, relative to the turbulence, with respect to the flat wall (Luchini et al. Reference Luchini, Manzo and Pozzi1991) and hence the bulk flow velocity. For riblets of moderate size (
 $10\lesssim \ell _g^+\lesssim 30$) the slip contribution increases with the riblet size, but so do the turbulent (
 $\vartriangle$, red) and dispersive (
 $\triangledown$, blue) contributions, leading to the degradation and eventually the breakdown of drag reduction (
 $\ell _g^+\gtrsim 11$). The turbulent contribution
  $\Delta U_T^+$ shows a non-monotonic trend for increasing riblet size (figure 16d–f) and we find
  $\Delta U_T^+<0$ (drag reducing) for the large trapezoidal case TA60. The term
  $\Delta U_T^+$ becomes negative because it only accounts for the turbulence above the crest, whereas turbulence below the crest also contributes to the degradation of the slip term
  $\Delta U_S^+$, which becomes nearly positive (drag increasing) for the large trapezoidal riblets TA60.
Contributions to total  $\Delta U^+$ (
 $\circ$, black) from (5.10): turbulence
  $\Delta U_T^+$ (
 $\vartriangle$, red), dispersion
  $\Delta U_D^+$ (
 $\triangledown$, blue), slip
  $\Delta U_S^+$ (
 $\lozenge$, green), for (a) triangles
  $\alpha =30^\circ$, (b) triangles
  $\alpha =60^\circ$, (c) triangles
  $\alpha =90^\circ$, (d) asymmetric triangles
  $\alpha =63.4^\circ$, (e) trapezoids
  $\alpha =30^\circ$ and ( f) blades
  $s/t=5$.
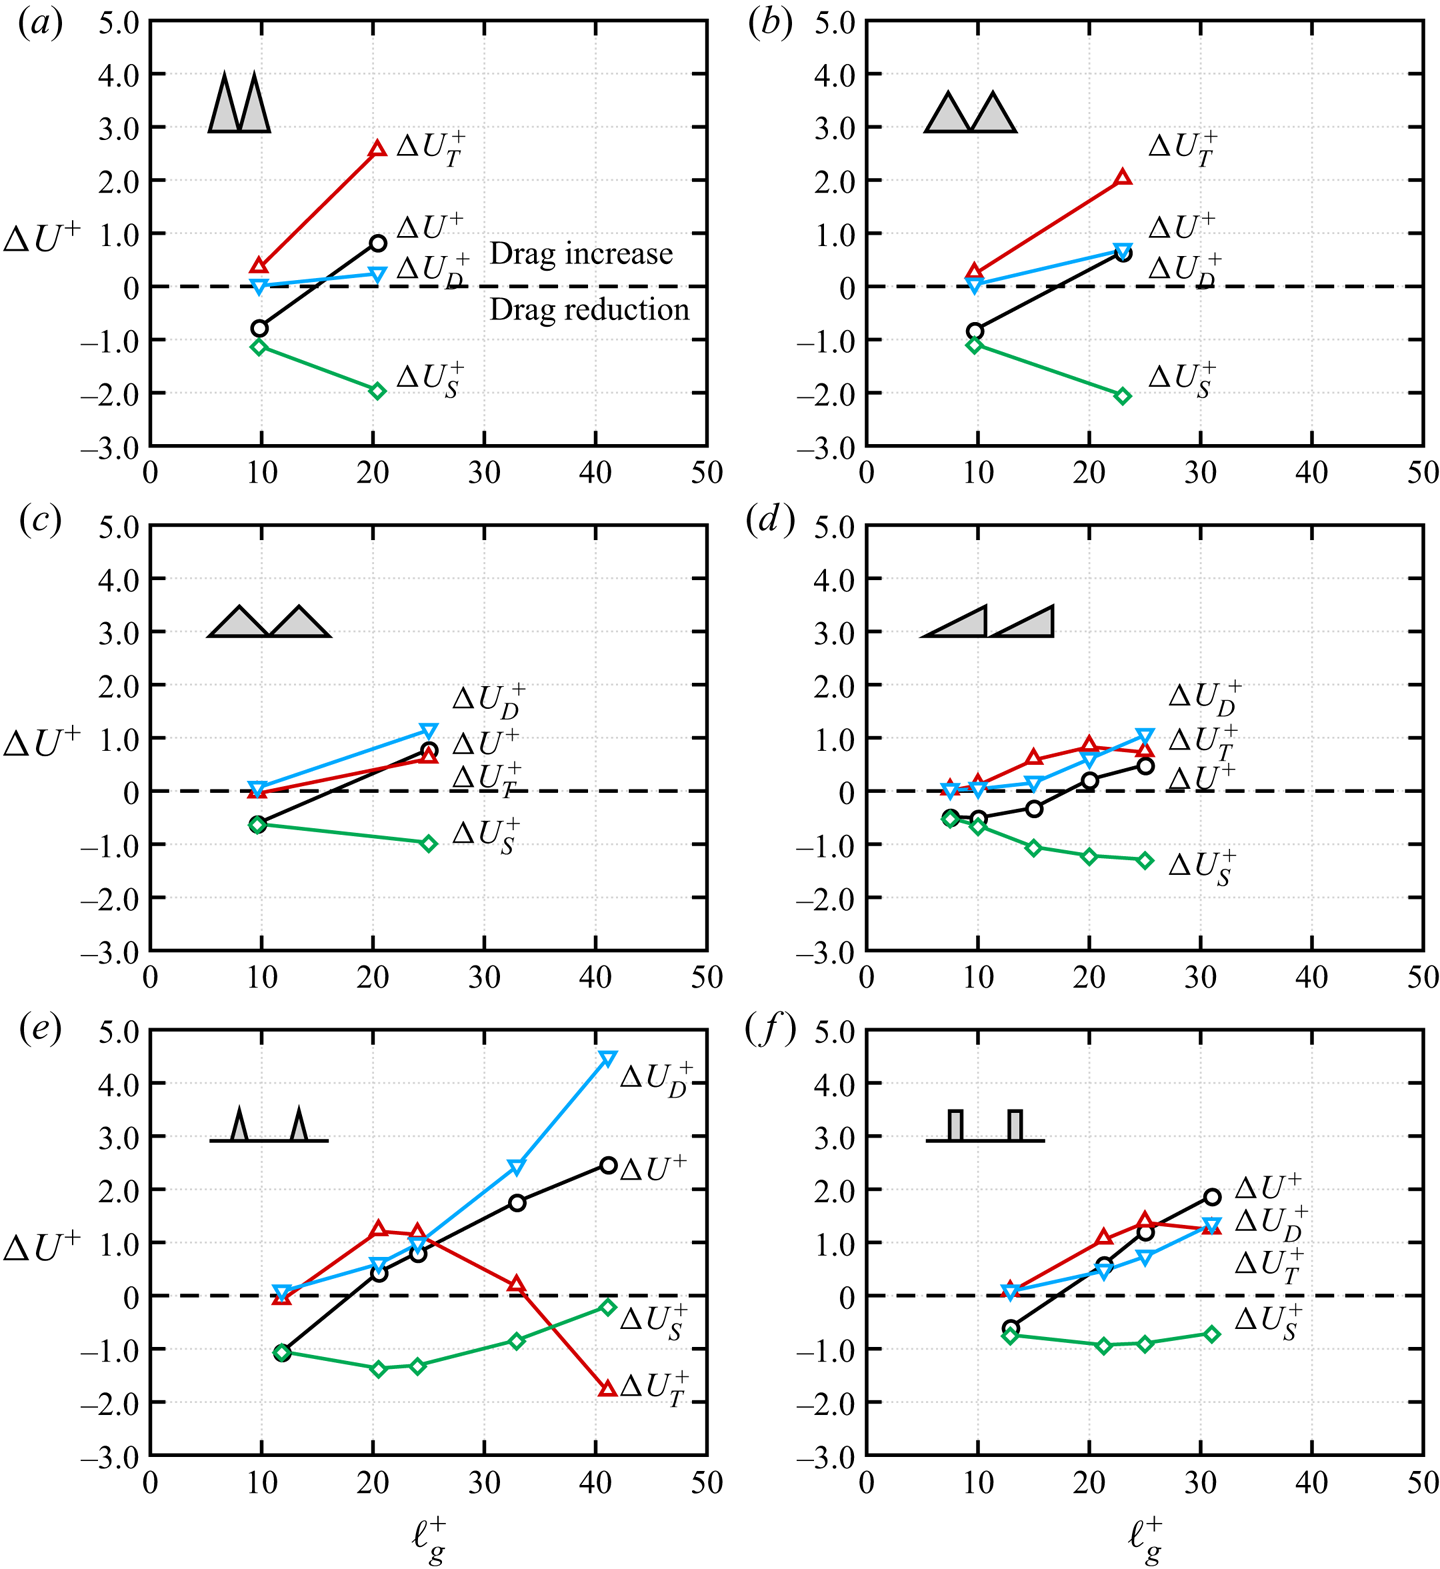
Figure 16 shows that the relative contribution of turbulence and dispersion depends on the riblet geometry. The triangular riblets with opening angle  $\alpha =30^\circ$ and
  $\alpha =60^\circ$ and, to a lesser extent, the blades (figure 16a,b, f), show a larger turbulent contribution
 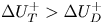 $\Delta U_T^+>\Delta U_D^+$. On the contrary, triangles with opening angle
  $\alpha =90^\circ$, asymmetric triangles and trapezoids (figure 16c–e) show a larger dispersive contribution
  $\Delta U_D^+>\Delta U_T^+$.
These observations suggest that the riblet geometry influences the preferential contribution of turbulence or dispersion to the drag increase. Data suggest that ‘shallow’ riblets with a large fluid spacing promote the penetration of turbulent flow below the crest resulting in a preferential location of turbulence inside the groove, allowing the formation of mean secondary velocities. On the other hand, ‘deep’ riblets are characterized by nearly stagnant fluid inside the groove, suppressing the formation of secondary flows. The idea that turbulence is suppressed in proximity of narrow corners has been verified for turbulent flow in fully developed triangular ducts (Eckert & Irvine Reference Eckert and Irvine1956; Daschiel, Frohnapfel & Jovanović Reference Daschiel, Frohnapfel and Jovanović2013) and in the case of riblets it can be traced back to the fact that the value of the Reynolds number based on the local groove width is much lower than  $s^+$. The viscous-scaled local groove width seems a good indicator for determining if the flow inside the groove is dominated by viscous or inertial effects and in particular we take as reference the viscous-scaled groove width at the riblet mean height,
  $\mathcal {W}^+$ (red dotted line in figure 12). For instance, for flow case TI321
  $\mathcal {W}^+=10.6$, whereas for TI635
  $\mathcal {W}^+=17.5$ and for TI950
  $\mathcal {W}^+=25$, which correlates very well with the trend of
  $\Delta U_D^+$ observed in figure 15(a–c). This observation suggests that to have inertial flow inside the riblet groove (and therefore formation of secondary flows) one should have a groove width at the riblet mean height
  $\mathcal {W}^+\gtrsim 20$. Figure 17 shows
  $\Delta U_T^+$ and
  $\Delta U_D^+$ of drag-increasing riblets (
 $\Delta U^+>0$) as a function of the groove width at the riblet mean height
  $\mathcal {W}^+$, where the vertical dashed line indicates
  $\mathcal {W}^+=20$. Data show a clear separation between riblets with a predominant
  $\Delta U_T^+$ or
  $\Delta U_D^+$, occurring for a local width at the mean height
  $\mathcal {W}^+\approx 20$. The values of
  $\Delta U_T^+$ and
  $\Delta U_D^+$ are also compared to data of García-Mayoral & Jiménez (Reference García-Mayoral and Jiménez2011) (filled blade symbols), for which only one drag-increasing case is available and it shows close agreement with the present blade data.
Contributions to total  $\Delta U^+$ from (5.10): turbulence
  $\Delta U_T^+$ (a), dispersion
  $\Delta U_D^+$ (b), as a function of
  $\mathcal {W}^+$, the viscous-scaled groove width at the riblet mean height. Only drag-increasing cases (
 $\Delta U^+>0$) are reported. Filled symbols refer to the
  $s/t=4$ blade riblets data of García-Mayoral & Jiménez (Reference García-Mayoral and Jiménez2011).
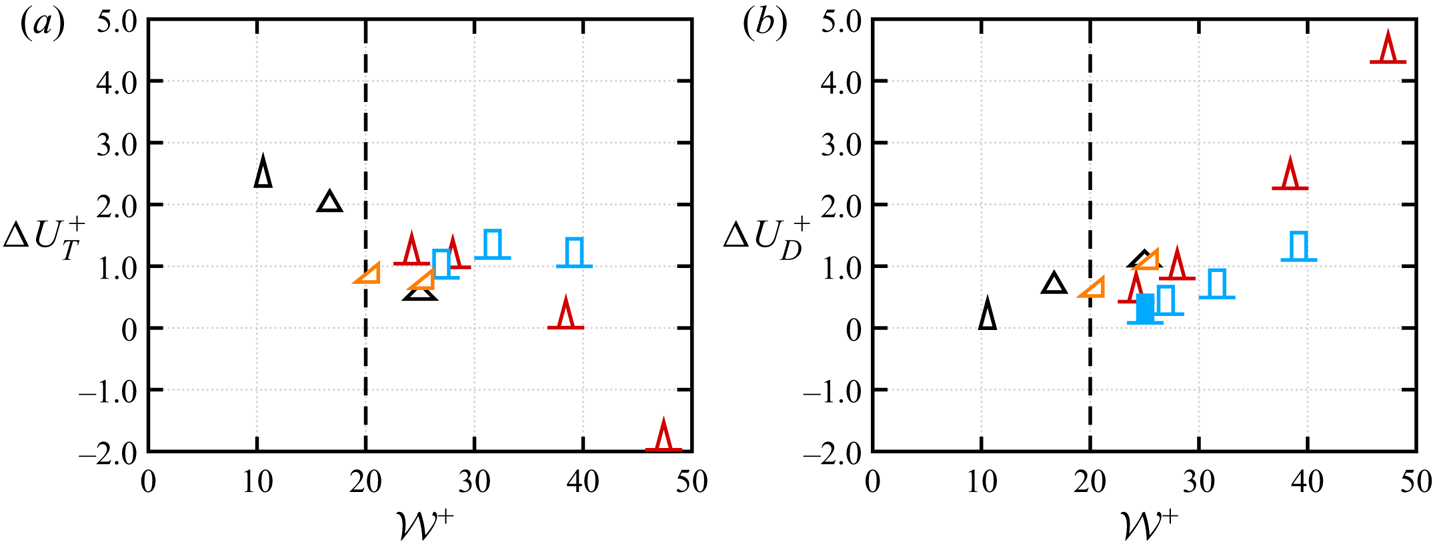
We also note that the value of  $\Delta U_T^+$ is inversely proportional to
  $\Delta U_D^+$, suggesting that inertial flow over riblets can occur in two fashions. If the groove width at the mean height
  $\mathcal {W}^+\lesssim 20$ inertial flow does not penetrate deeply into the groove, but is limited to the crest region. If
  $\mathcal {W}^+\gtrsim 20$ inertial flow descends to the groove bottom, turbulent eddies preferentially station inside the riblet groove and on average they give rise to the mean cross-stream velocities in figures 9 and 10. Notably, the groove classification based on
  $\mathcal {W}^+$ is complementary to the recent analysis of Endrikat et al. (Reference Endrikat, Modesti, García-Mayoral, Hutchins and Chung2021) on Kelvin–Helmholtz rollers. Sharp triangles and blades, which have the smallest
  $\Delta U_D^+$, are the only shapes for which Endrikat et al. (Reference Endrikat, Modesti, García-Mayoral, Hutchins and Chung2021) observe the formation of Kelvin–Helmholtz rollers at the riblet crest, thus demonstrating that the degradation of drag reduction can be attributed to different inertial flow mechanisms depending on groove type. The conditional averages in figure 12 strongly support this mechanism. For drag reducing riblet cases the negative streamfunction isolines, indicating flow recirculation inside the groove and therefore inertial effects, never penetrate below the riblet mean height. As for drag-increasing riblets the penetration depth of the recirculation region depends on the groove geometry. For flow cases TI321 and TI635 (figure 17), which have
  $\mathcal {W}^+\lesssim 20$, the negative isolines do not penetrate below the riblet mean height, whereas all other drag-increasing cases, which have
  $\mathcal {W}^+\gtrsim 20$, show large flow recirculation inside the groove, penetrating down to the riblet bottom. We point out that both drag-reducing and drag-increasing cases can have
  $\mathcal {W}^+\lesssim 20$, therefore
  $\mathcal {W}^+$ is not suitable for indicating the breakdown of drag reduction, which is instead well captured by the viscous-scaled square root of the groove area
  $\ell _g^+$. The groove width
  $\mathcal {W}^+$ applies to riblets beyond the drag optimum and it can be used to determinate if the drag degradation is caused by turbulent flow at the crest or turbulent flow descending inside the groove.
We also note that at sufficiently high  $s^+$ we expect that any riblet shape will eventually develop secondary flows inside the groove, but for certain geometries (e.g. triangular riblets with
  $\alpha =30^\circ$) the value of
  $s^+$ for which this happens is well beyond the drag optimum and therefore for these cases inertial flow at the crest is responsible for the degradation of drag reduction (García-Mayoral & Jiménez Reference García-Mayoral and Jiménez2011; Endrikat et al. Reference Endrikat, Modesti, García-Mayoral, Hutchins and Chung2021).
The riblet classification based on the local groove width is summarized by figure 18(b), in which we report  $\mathcal {W}^+$ as a function of
  $\ell _g^+$. For convenience, in figure 18(a) we also report the mean velocity shift
  $\Delta U^+$ as a function of
  $\ell _g^+$. The viscous-scaled square root of the groove area is the relevant parameter to classify the breakdown of drag reduction and flow cases with
  $\ell _g^+\lesssim 18$ are drag reducing, whereas flow cases
  $\ell _g^+\gtrsim 18$ are drag increasing. For drag-reducing cases both
  $\Delta U_T^+\approx 0$ and
  $\Delta U_D^+\approx 0$, whereas for drag-increasing cases the relative importance of
  $\Delta U_T^+$ and
  $\Delta U_D^+$ depends on the local groove width. If
  $\mathcal {W}^+\lesssim 20$ the drag increase is caused primarily by turbulence and if
  $\mathcal {W}^+\gtrsim 20$ by dispersion. We also note that, for these geometries,
  $\mathcal {W}^+$ is linear with
  $\ell _g^+$ for a given shape, therefore all geometries will eventually enter the shaded region for increasing riblet size. The present data suggest the idea that the breakdown of drag reduction is a continuous physical process starting at the optimum
  $\ell _g^+\approx 11$ and eventually leading to drag increase at
  $\ell _g^+\approx 18$. For instance figures 9, 10 and 11(c) clearly show the presence of secondary flows for a drag-reducing case at
  $\ell _g^+=15$. Similarly, we observe that the streamfunction of the conditional-averaged flow of the drag-reducing case TA18 in figure 12(k) (
 $\ell _g^+=11.8$) is not exactly symmetric, indicating incipient flow separation inside the groove. The linear-regime degradation is not characterized by a prompt onset of the dispersive velocities, but by a gradual growth of the secondary flows’ intensity with increasing riblet size. Likewise, the value
  $\mathcal {W}^+=20$ does not indicate a sharp transition between two regimes and riblets with
  $\mathcal {W}^+\approx 20$ have
 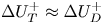 $\Delta U_T^+\approx \Delta U_D^+$. We also point out that here we use the riblet mean height as a reference working location separating the crest region from the groove bottom, but conclusions do not change when using the riblet spacing at any height between
  $k/2$ and the groove bottom. Nevertheless, measuring the width
  $\mathcal {W}^+$ inside the groove as opposed to the spacing
  $s^+$ is necessary for isolating the penetration of induced secondary flow from other inertial mechanisms at play at the crest.
(a) Mean velocity shift  $\Delta U^+$ as a function of
  $\ell _g^+$ and (b) viscous-scaled groove width at the riblet mean height
  $\mathcal {W}^+$ as a function of the viscous-scaled square root of the groove area
  $\ell _g^+$ for all flow cases. The vertical black dashed line indicates
  $\ell _g^+=18$, the vertical black dash-dotted line
  $\ell _g^+=11$ and the horizontal red line
  $\mathcal {W}^+=20$. The shaded region indicates the drag-increasing regime in which dispersion contribute more than turbulence to the breakdown of drag reduction
  $\Delta U_D^+>\Delta U_T^+$. The filled symbol in (b) refers to the
  $s/t=4$ blade riblets data of García-Mayoral & Jiménez (Reference García-Mayoral and Jiménez2011).
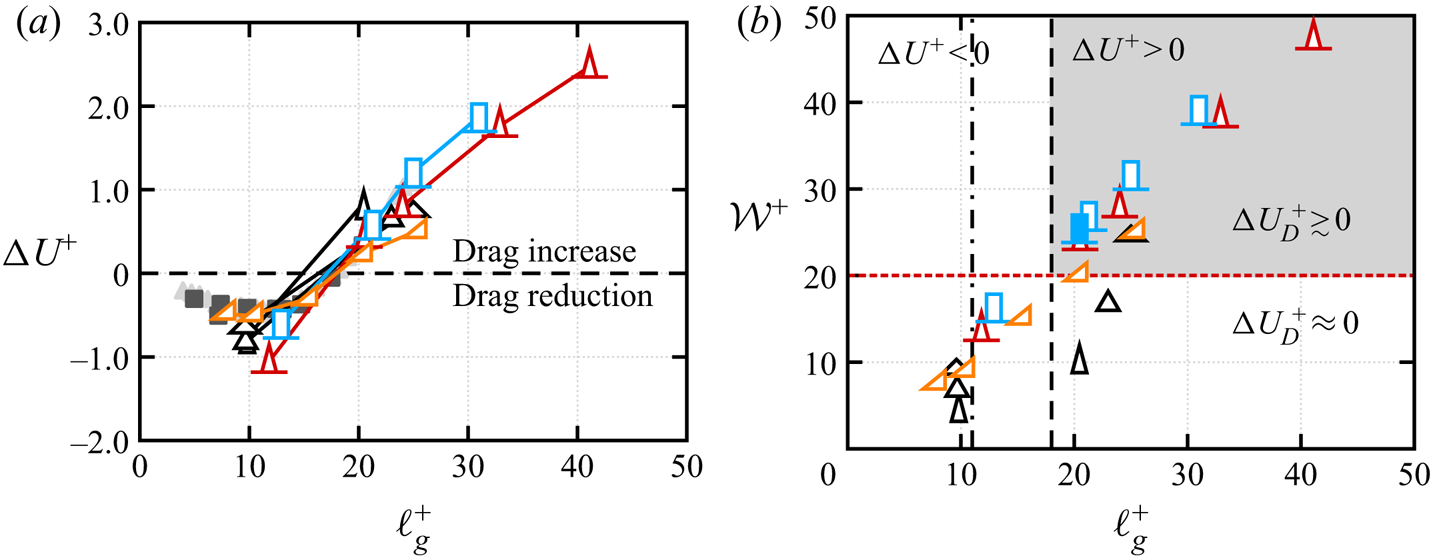
6. Conclusions
We carried out DNS of minimal-channel flow over several riblet geometries to shed light on the effect of the groove shape and on the physical mechanisms that lead to the degradation of drag reduction. The use of the minimal-channel flow configuration has been instrumental to develop a larger dataset than in previous studies, allowing us to reach more general conclusions. Besides ‘classical’ groove geometries, we also considered the case of triangular riblets asymmetric in the spanwise direction to investigate if a spanwise variation can be beneficial in terms of drag reduction. Results show that asymmetric riblets do not provide increased performance in terms of drag variation, apart from a gentler increase in  $\Delta U^+$, beyond the optimum
  $\ell _g^+$, compared to the symmetric geometries, and the only notable (and expected) difference is the presence of a net mean spanwise flow, which nevertheless has a negligible intensity compared to the mean streamwise velocity.
As first observed by García-Mayoral & Jiménez (Reference García-Mayoral and Jiménez2011), we confirm that drag reduction curves are more universal around the drag optimum, when reported with  $\ell _g^+$ than with
  $s^+$. We also find that the improvement in the fitting extends beyond the drag optimum, up to
  $\ell _g^+\leq 30$ and it applies to all riblet geometries here under scrutiny. As for the effect of the riblet shape, trapezoidal riblets with opening angle
  $\alpha =30^\circ$ yield the largest drag reduction among the shapes here tested, with
  $\Delta U^+\approx 1$, corresponding to approximately
  $6\,\%$ skin-friction drag reduction at
  $Re_\tau \approx 17\,000$, typical of aircraft wing. We further show that the roughness sublayer measured from the virtual origin of turbulence is linearly related to the riblet spacing
  $\delta _r^+\approx 0.6s^+$, whereas the one measured from the riblet mean height is linearly related to the square root of the groove area
 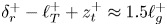 $\delta _r^+-\ell _T^+ + z_t^+\approx 1.5 \ell _g^+$. As a result, riblet grooves with the same
  $\delta _r^+-\ell _T^+ + z_t^+$ have similar
  $\Delta U^+$, suggesting that the mean flow inhomogeneity within the roughness sublayer is relevant for understanding the mechanisms of drag reduction. For this reason we use a generalized FIK analysis, which retains the effect of the spanwise mean flow variation, to isolate the different contributions to
  $\Delta U^+$ and gain additional insight into the flow physics of riblets.
In agreement with previous studies (Bechert et al. Reference Bechert, Bruse, Hage, van der Hoeven and Hoppe1997; Li & Liu Reference Li and Liu2018), riblets operating in the linear regime reduce drag by shifting the virtual origin of turbulence farther from the wall, increasing the effective mean velocity at the crest, and thus the bulk flow velocity. Large grooves instead operate beyond the viscous sublayer generating an inertial flow, which inevitably carries additional stress.
For riblet cases beyond the drag optimum  $\ell _g^+\gtrsim 11$ inertial flow prevails, eventually leading to the breakdown of drag reduction for
  $\ell _g^+\gtrsim 18$. Different types of inertial flow mechanisms exist, depending on whether the turbulent flow penetrates deeply into the riblet groove or not. For one, the different drag between the crest and the groove bottom can give rise to a strong shear, which favours the onset of a Kelvin–Helmholtz instability at the crest (García-Mayoral & Jiménez Reference García-Mayoral and Jiménez2011; Endrikat et al. Reference Endrikat, Modesti, García-Mayoral, Hutchins and Chung2021). Furthermore, we showed that dispersive stresses, that cannot be mistaken for Kelvin–Helmholtz rollers, also contribute to the drag of riblets. This picture of coexistence of mechanisms is not clear from previous studies (Choi et al. Reference Choi, Moin and Kim1993; Goldstein et al. Reference Goldstein, Handler and Sirovich1995; Lee & Lee Reference Lee and Lee2001; García-Mayoral & Jiménez Reference García-Mayoral and Jiménez2011), which suggest only one universal mechanism for all riblets. In order to gauge the importance of secondary flows for drag, we consider the riblet mean height as a reference depth from the riblet crest and we show that the value of the local groove width at this height,
  $\mathcal {W}^+$, indicates if the flow inside the groove is turbulent. If
  $\mathcal {W}^+\lesssim 20$, the groove bottom is dominated by viscosity and the flow is only turbulent at the crest. If
  $\mathcal {W}^+\gtrsim 20$, inertial flow penetrates most of the riblet and turbulent vortices preferentially station in the groove, causing non-zero
  $\bar {v}$ and
  $\bar {w}$, which we denote as dispersive velocities. The conditional-averaged flow inside the groove shows that the typical flow topology of the dispersive velocities, constituted by two counter-rotating vortices, is merely an artefact of the time averaging and that these structures are the result of a dynamic process, in which turbulent fluctuations with riblet-scaled size are spatially locked inside the riblet groove. Contrarily to the flow over a smooth wall or the flow over small riblets, in the case of large grooves the left and right spanwise conditional averages do not cancel out, and show their signature as dispersive stresses.
The analysis allows us to draw a regime diagram (figure 18) for determining if the drag increase is primarily caused by turbulence or dispersion, depending on the value of the viscous-scaled groove width at the riblet mean height  $\mathcal {W}^+$. By their geometrical definitions
  $\mathcal {W}^+$ and
  $\ell _g^+$ are proportional, therefore all riblets are bound to enter a flow regime in which inertial flow penetrates into the groove and dispersive stresses become important. A notable riblet geometry for which these conclusions might not apply are the three-dimensional riblets (Sasamori et al. Reference Sasamori, Mamori, Iwamoto and Murata2014, Reference Sasamori, Iihama, Mamori, Iwamoto and Murata2017), because defining a local groove width is not straightforward as for two-dimensional riblets.
Acknowledgements
The authors wish to thank M. Bernardini for discussions on processing of unstructured flow data and R. García-Mayoral for discussions regarding the virtual origin.
Funding
This research was supported by resources provided by The Pawsey Supercomputing Centre with funding from the Australian Government and the Government of Western Australia and by the National Computing Infrastructure (NCI), which is supported by the Australian Government. This research was partially supported under an Australian Research Council Discovery Project (DP170102595). D.M. has been partially funded by Ermenegildo Zegna, through the ‘EZ Founder's Scholarship’.
Declaration of interests
The authors report no conflict of interest.
Appendix A. Application of generalized FIK identity to smooth plane channel flow
In this appendix we discuss the relation between the FIK identity developed by Fukagata, Iwamoto & Kasagi (Reference Fukagata, Iwamoto and Kasagi2002) for smooth channel flow and the generalized FIK identity of Modesti et al. (Reference Modesti, Pirozzoli, Orlandi and Grasso2018) used in § 5. Consider the mean-momentum equation for a smooth plane channel flow,
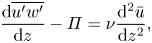 \begin{equation} \frac{\mathrm{d} \overline{u'w'}}{\mathrm{d} z} -\varPi = \nu\frac{\mathrm{d}^2\bar{u}}{\mathrm{d}z^2}, \end{equation}
where  $\varPi >0$ is the uniform pressure gradient,
  $\overline {u'w'}$ the turbulent stress and
  $\bar {u}$ the mean streamwise velocity. The overline symbol indicates averaging in time and homogeneous spatial directions. Due to the linearity of the second derivative one can split (A1) into
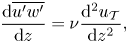 \begin{gather} \frac{\mathrm{d} \overline{u'w'}}{\mathrm{d} z}=\nu\frac{\mathrm{d}^2u_\mathcal{T}}{\mathrm{d}z^2}, \end{gather}
 \begin{gather}-\varPi = \nu\frac{\mathrm{d}^2u_\mathcal{L}}{\mathrm{d}z^2}, \end{gather}
where  $u_\mathcal {L}$ and
  $u_\mathcal {T}$ are the laminar and turbulent contributions to the mean velocity,
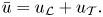 \begin{equation} \bar{u} = u_\mathcal{L} + u_\mathcal{T}. \end{equation}
We also note that integrating (A2a) across the channel we find that the first derivative of  $u_\mathcal {T}$ at the wall is zero,
  $(\mathrm {d} u_\mathcal {T}/\mathrm {d}z)_{w}=0$, namely
  $u_\mathcal {T}$ does not contribute to the mean wall-shear stress. Integrating (A3) allows us to find the bulk flow velocity,
 \begin{equation} u_b = u_{b\mathcal{L}} + u_{b\mathcal{T}}=\frac{h^2\varPi}{\nu} u_{b1} + u_{b\mathcal{T}},\quad u_{b\mathcal{X}} = \frac{1}{2h} \int_{{-}h}^{h} u_\mathcal{X}\mathrm{d}y, \end{equation}
where  $u_{1}$ is the non-dimensional velocity,
 \begin{equation} -\frac{1}{h^2} = \frac{\mathrm{d}^2u_1}{\mathrm{d}z^2}, \end{equation}
and the associated bulk velocity  $u_{b1}=\nu u_{b\mathcal {L}}/(h^2\varPi )=1/3$, both for full channel and open-channel flow. In the case of minimal-channel flow, due to the altered mean velocity profile, the bulk velocity can be obtained by fitting a composite velocity profile for
  $z>z_c$ (MacDonald et al. Reference MacDonald, Chung, Hutchins, Chan, Ooi and García-Mayoral2017). Introducing the skin-friction coefficient
  $\varPi = C_fu_b^2/(2h)$ and the bulk Reynolds number
  $Re_b=2u_bh/\nu$ allows us to recover the original FIK identity for the skin-friction coefficient (Fukagata et al. Reference Fukagata, Iwamoto and Kasagi2002),
 \begin{equation} C_f = \frac{12}{Re_b}\left(1-\frac{u_{b\mathcal{T}}}{u_b}\right)=C_{f\mathcal{L}} + C_{f\mathcal{T}}. \end{equation}
This analysis shows that the methodology used in § 5 coincides with classical FIK identity in the case of smooth plane channel flow. The main difference with the standard FIK identity is not in the procedure, but in the interpretation of the mean-momentum equation. Interpreting the terms in the mean-momentum equation as sources of separate Poisson equations has the advantage that the method can be applied to arbitrarily complex geometries, such as riblets. In § 5 we focus on the contributions to  $\Delta U^+$ rather than to the skin-friction coefficient, therefore the analysis is limited to the velocities
  $u_\mathcal {L}$ and
  $u_\mathcal {T}$.


 Open access